This session
55
1 1 University of Minnesota March, 22 2009 Bringing Lessons from the World’s Top Performers to Minnesota This session 1. There is nowhere to hide Why the yardstick for educational success is no longer improvement by national standards but the best performing systems internationally 2. Benchmarking education internationally Where we are – and where we can be – Where the US and other countries stand in terms of quality and equity of schooling outcomes – What the best performing countries show can be achieved 3. How we can get there Some policy levers that emerge from
-
Upload
calhoun-ward -
Category
Documents
-
view
30 -
download
7
description
This session. 1 . There is nowhere to hide Why the yardstick for educational success is no longer improvement by national standards but the best performing systems internationally 2. Benchmarking education internationally Where we are – and where we can be - PowerPoint PPT Presentation
Transcript of This session

11U
niv
ers
ity
of
Min
nes
ota
Ma
rch
, 22
200
9B
rin
gin
g L
esso
ns
fro
m t
he
Wor
ld’s
Top
Per
form
ers
to M
inne
sota
This session
1. There is nowhere to hide Why the yardstick for educational success is
no longer improvement by national standards but the best performing systems internationally
2. Benchmarking education internationally Where we are – and where we can be
– Where the US and other countries stand in terms of quality and equity of schooling outcomes
– What the best performing countries show can be achieved
3. How we can get there Some policy levers that emerge from
international comparisons
22U
niv
ers
ity
of
Min
nes
ota
Ma
rch
, 22
200
9B
rin
gin
g L
esso
ns
fro
m t
he
Wor
ld’s
Top
Per
form
ers
to M
inne
sota
There is nowhere to hideThe yardstick for success is no longer improvement by national
standards but the best performing education systems

AustraliaAustriaCzech RepublicDenmarkFinlandGermanyGreeceHungaryIcelandIrelandItalyJapanNetherlandsNew ZealandNorwayPolandPortugalSlovak RepublicSpainSwedenUnited KingdomUnited States
Expe
nditu
re p
er s
tude
nt a
t ter
tiary
leve
l (U
SD)
Tertiary-type A graduation rate
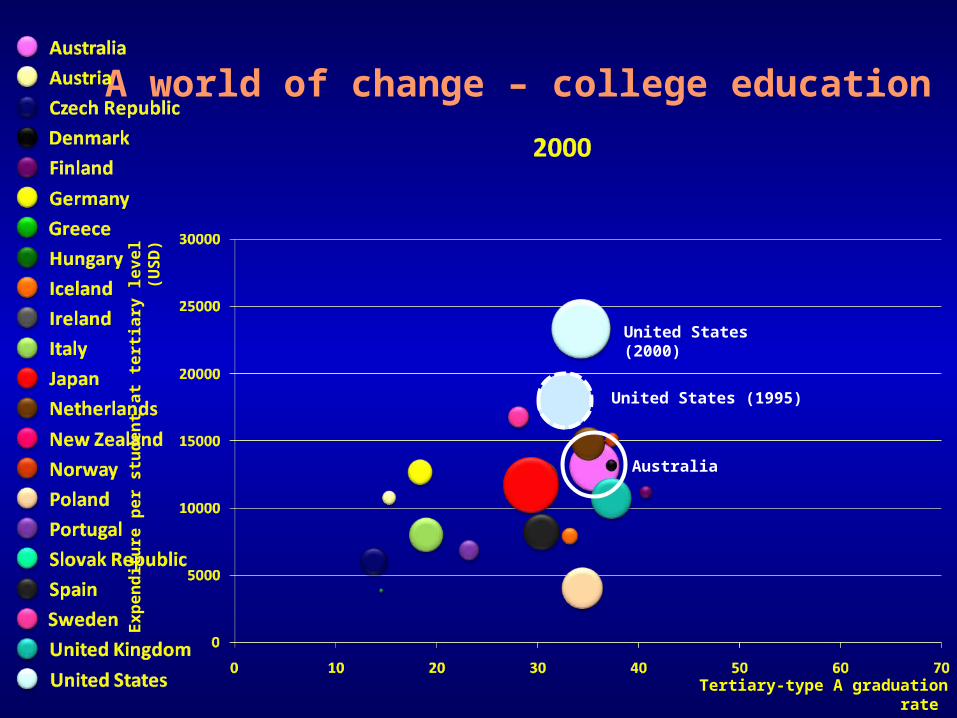
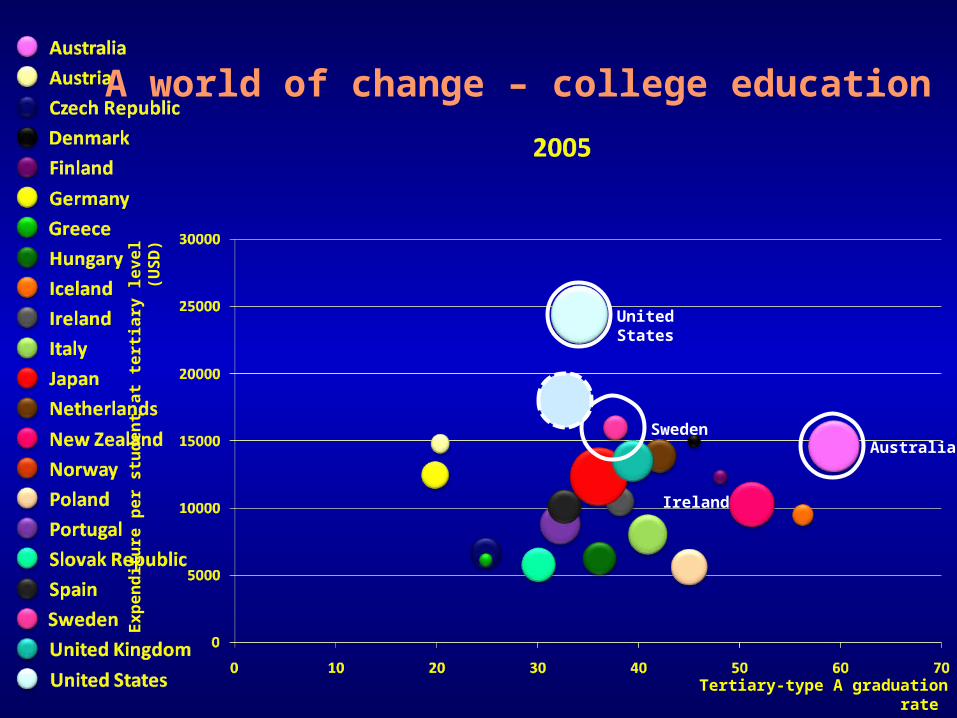
A world of change – college education
Graduate supply
Cost
per
stu
den
t

Expe
nditu
re p
er s
tude
nt a
t ter
tiary
leve
l (U
SD)
Tertiary-type A graduation rate
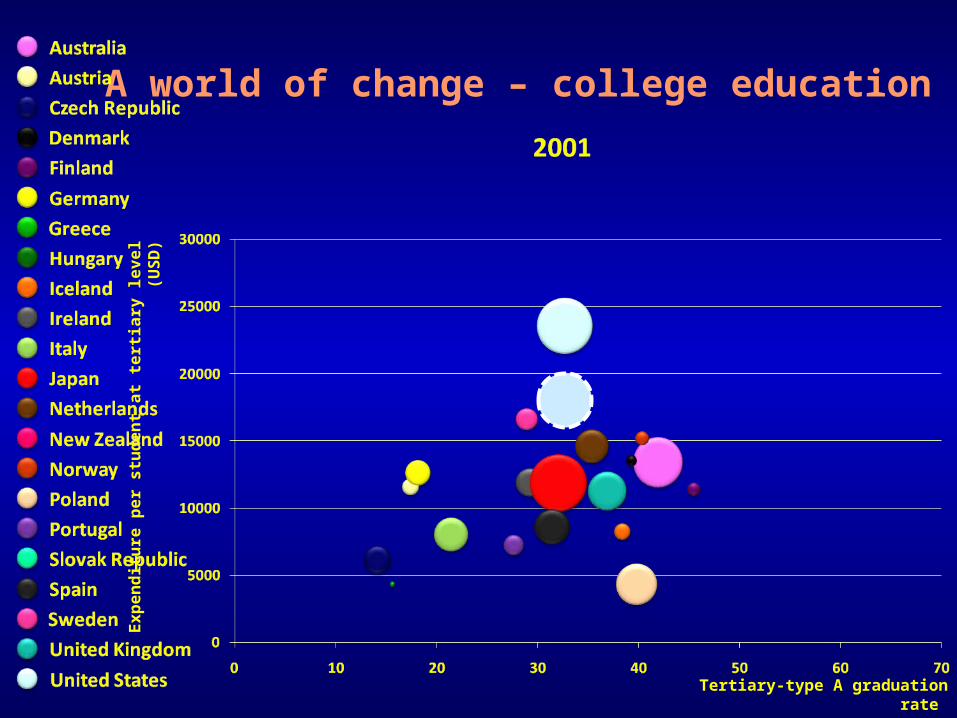
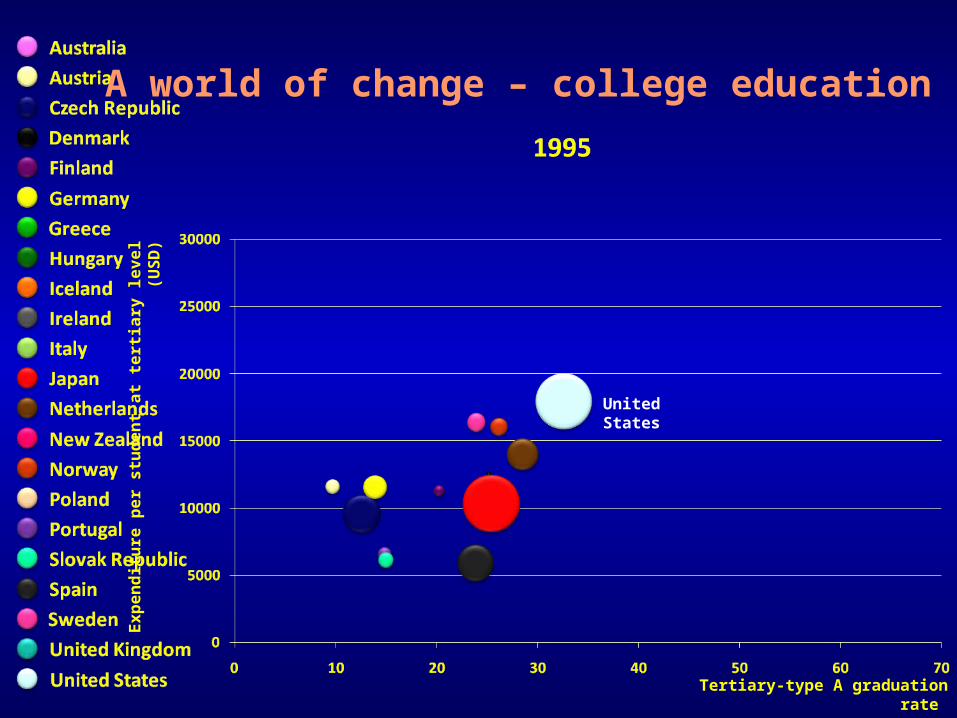
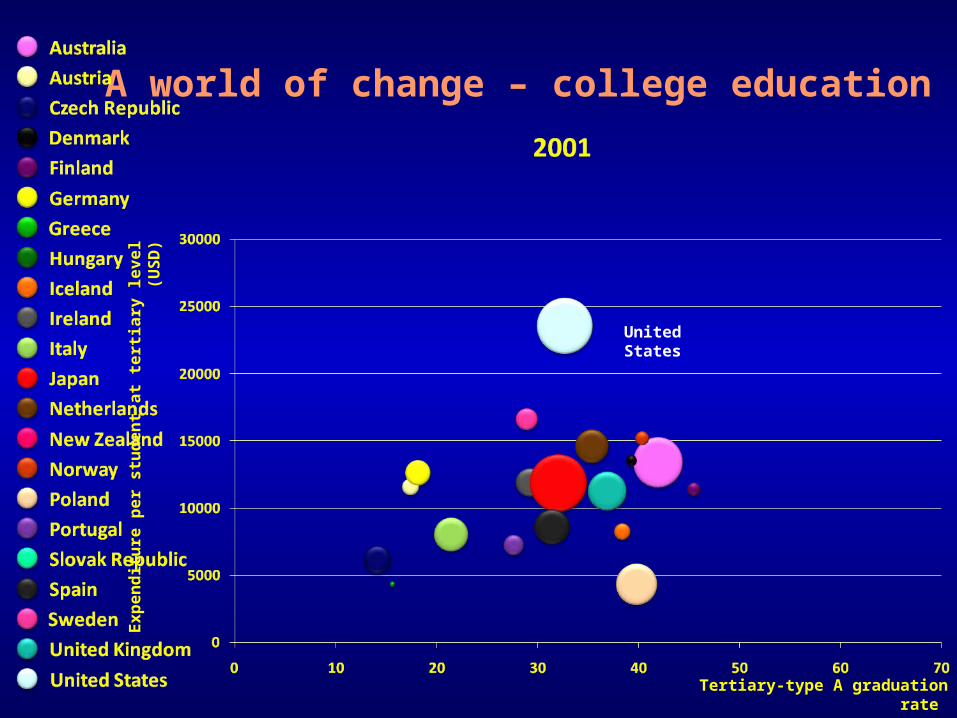
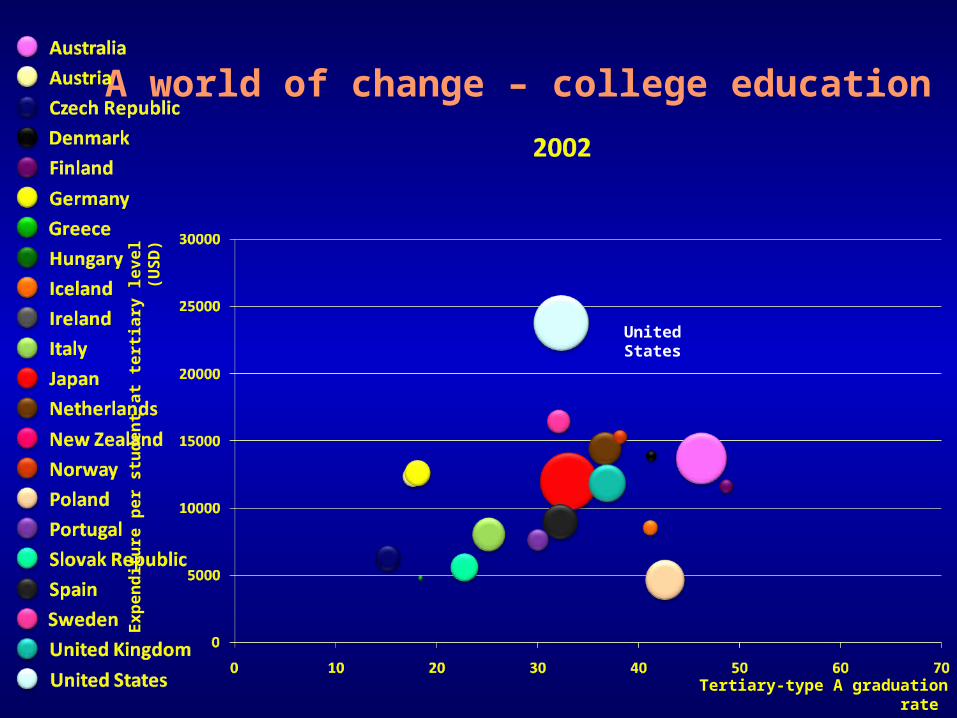
A world of change – college education
United States
Japan
Sweden
Graduate supply
Cost
per
stu
den
t
Germany
Expe
nditu
re p
er s
tude
nt a
t ter
tiary
leve
l (U
SD)
Tertiary-type A graduation rate
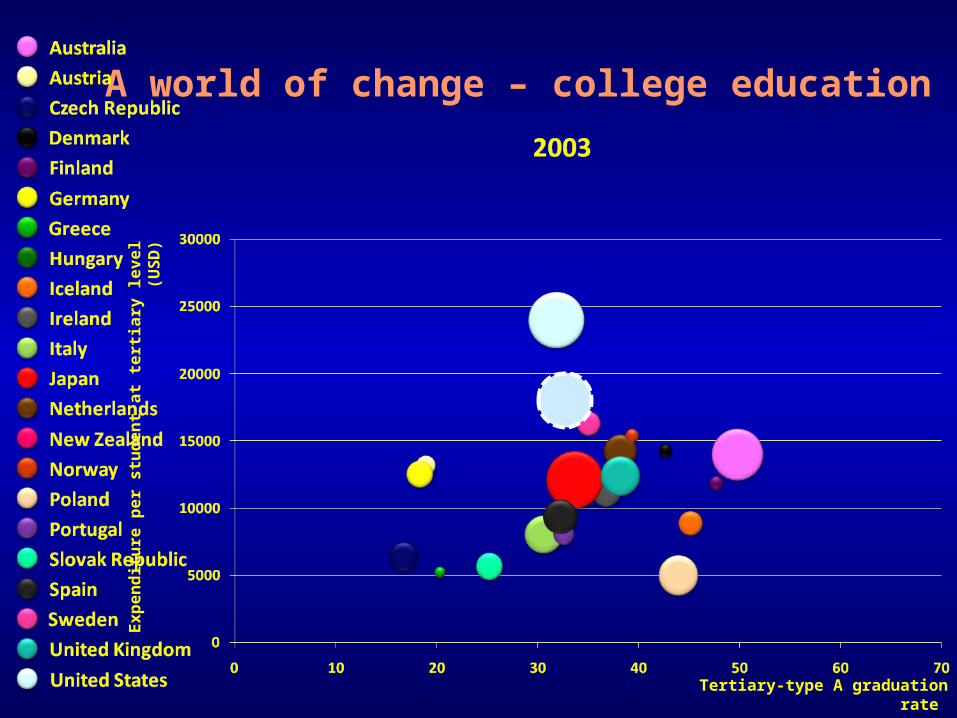
A world of change – college education
Australia
United States (2000)
United States (1995)
Expe
nditu
re p
er s
tude
nt a
t ter
tiary
leve
l (U
SD)
Tertiary-type A graduation rate
A world of change – college education

Expe
nditu
re p
er s
tude
nt a
t ter
tiary
leve
l (U
SD)
Tertiary-type A graduation rate
A world of change – college education
Expe
nditu
re p
er s
tude
nt a
t ter
tiary
leve
l (U
SD)
Tertiary-type A graduation rate
A world of change – college education

Expe
nditu
re p
er s
tude
nt a
t ter
tiary
leve
l (U
SD)
Tertiary-type A graduation rate
A world of change – college education
Expe
nditu
re p
er s
tude
nt a
t ter
tiary
leve
l (U
SD)
Tertiary-type A graduation rate
A world of change – college education
United States
Australia
Ireland
Sweden
Expe
nditu
re p
er s
tude
nt a
t ter
tiary
leve
l (U
SD)
Tertiary-type A graduation rate
A world of change – college education
United States

Expe
nditu
re p
er s
tude
nt a
t ter
tiary
leve
l (U
SD)
Tertiary-type A graduation rate
A world of change – college education
United States
Expe
nditu
re p
er s
tude
nt a
t ter
tiary
leve
l (U
SD)
Tertiary-type A graduation rate
A world of change – college education
United States
Expe
nditu
re p
er s
tude
nt a
t ter
tiary
leve
l (U
SD)
Tertiary-type A graduation rate
A world of change – college education
United States

Expe
nditu
re p
er s
tude
nt a
t ter
tiary
leve
l (U
SD)
Tertiary-type A graduation rate
A world of change – college education
United States

Expe
nditu
re p
er s
tude
nt a
t ter
tiary
leve
l (U
SD)
Tertiary-type A graduation rate
A world of change – college education

Expe
nditu
re p
er s
tude
nt a
t ter
tiary
leve
l (U
SD)
Tertiary-type A graduation rate
A world of change – college education
Australia
United States
Rising higher education qualifications seem generally not to have led to an “inflation” of the labour-market value of qualifications.
In all but three of the 20 countries with available data, the earnings benefit increased between 1997 and 2003, in Germany, Italy and Hungary by between 20% and 40%
1919U
niv
ers
ity
of
Min
nes
ota
Ma
rch
, 22
200
9B
rin
gin
g L
esso
ns
fro
m t
he
Wor
ld’s
Top
Per
form
ers
to M
inne
sota
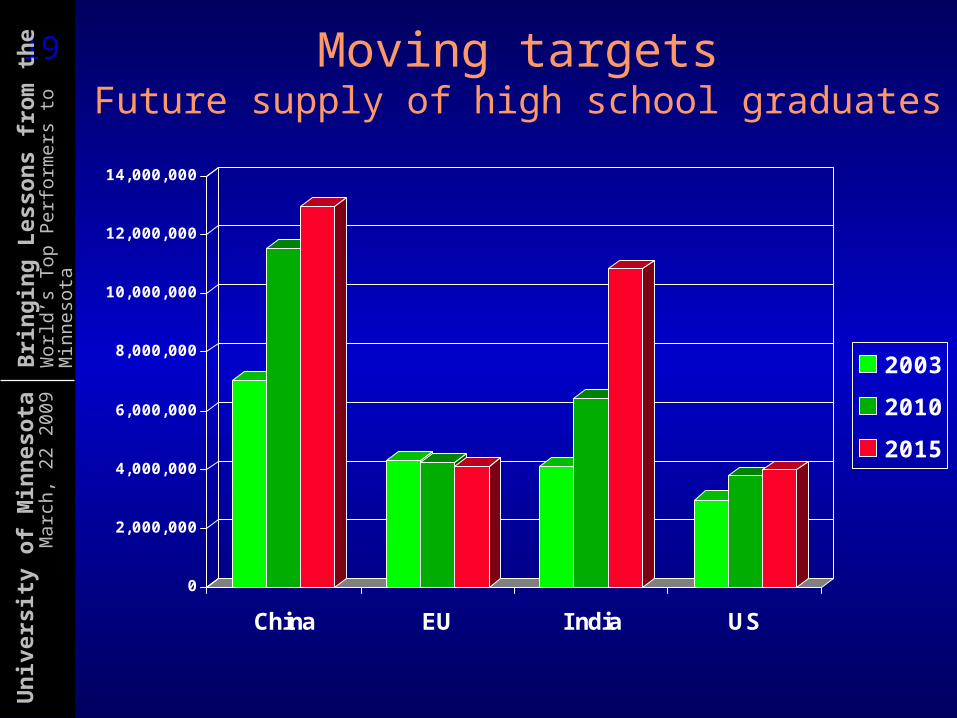
Moving targetsFuture supply of high school graduates
0
2,000,000
4,000,000
6,000,000
8,000,000
10,000,000
12,000,000
14,000,000
China EU India US
2003
2010
2015

2020U
niv
ers
ity
of
Min
nes
ota
Ma
rch
, 22
200
9B
rin
gin
g L
esso
ns
fro
m t
he
Wor
ld’s
Top
Per
form
ers
to M
inne
sota
0
500,000
1,000,000
1,500,000
2,000,000
2,500,000
3,000,000
3,500,000
4,000,000
4,500,000
5,000,000
China EU India US
2003
2010
2015
Future supply of high school graduates
0
2 , 0 0 0 , 0 0 0
4 , 0 0 0 , 0 0 0
6 , 0 0 0 , 0 0 0
8 , 0 0 0 , 0 0 0
10 , 0 0 0 , 0 0 0
12 , 0 0 0 , 0 0 0
14 , 0 0 0 , 0 0 0
China EU India US
2003
2010
2015
Future supply of college graduates

2121U
niv
ers
ity
of
Min
nes
ota
Ma
rch
, 22
200
9B
rin
gin
g L
esso
ns
fro
m t
he
Wor
ld’s
Top
Per
form
ers
to M
inne
sota
How the demand for skills has changedEconomy-wide measures of routine and non-routine task input
(US)
1960 1970 1980 1990 200240
45
50
55
60
65 Routine manual
Nonroutine manual
Routine cognitive
Nonroutine analytic
Nonroutine inter-active
(Levy and Murnane)
Mean t
ask
inp
ut
as
perc
en
tile
s of
the 1
960
task
dis
trib
uti
on
The dilemma of schools:The skills that are easiest to teach and test are also the ones that are easiest to digitise, automate and outsource
2222U
niv
ers
ity
of
Min
nes
ota
Ma
rch
, 22
200
9B
rin
gin
g L
esso
ns
fro
m t
he
Wor
ld’s
Top
Per
form
ers
to M
inne
sota
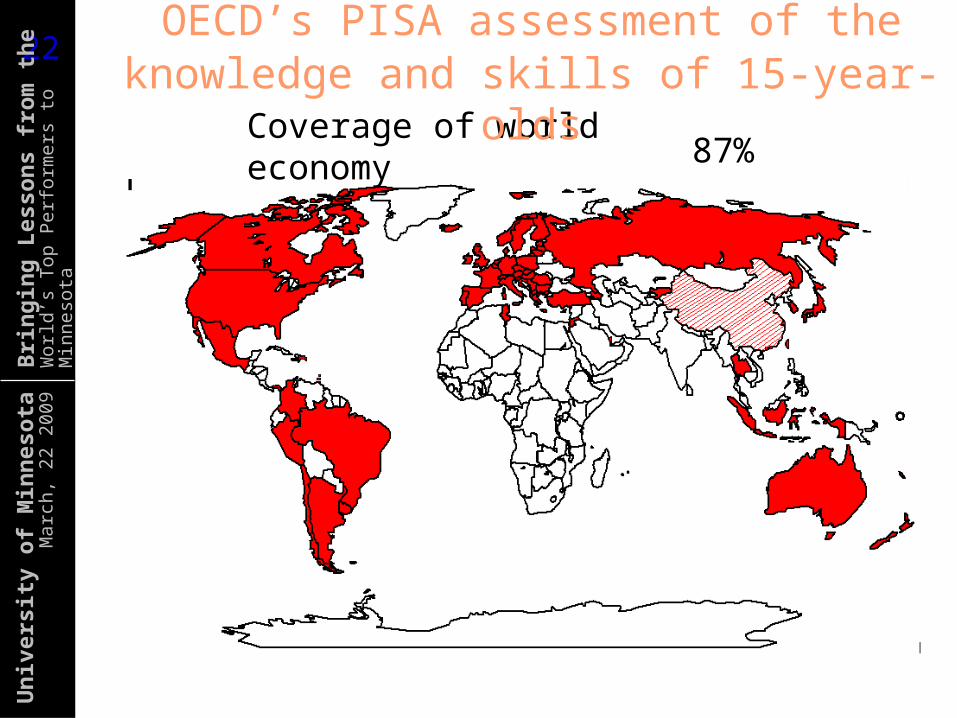
Coverage of world economy 77%81%83%85%86%87%
OECD’s PISA assessment of the knowledge and skills of 15-year-olds

2323U
niv
ers
ity
of
Min
nes
ota
Ma
rch
, 22
200
9B
rin
gin
g L
esso
ns
fro
m t
he
Wor
ld’s
Top
Per
form
ers
to M
inne
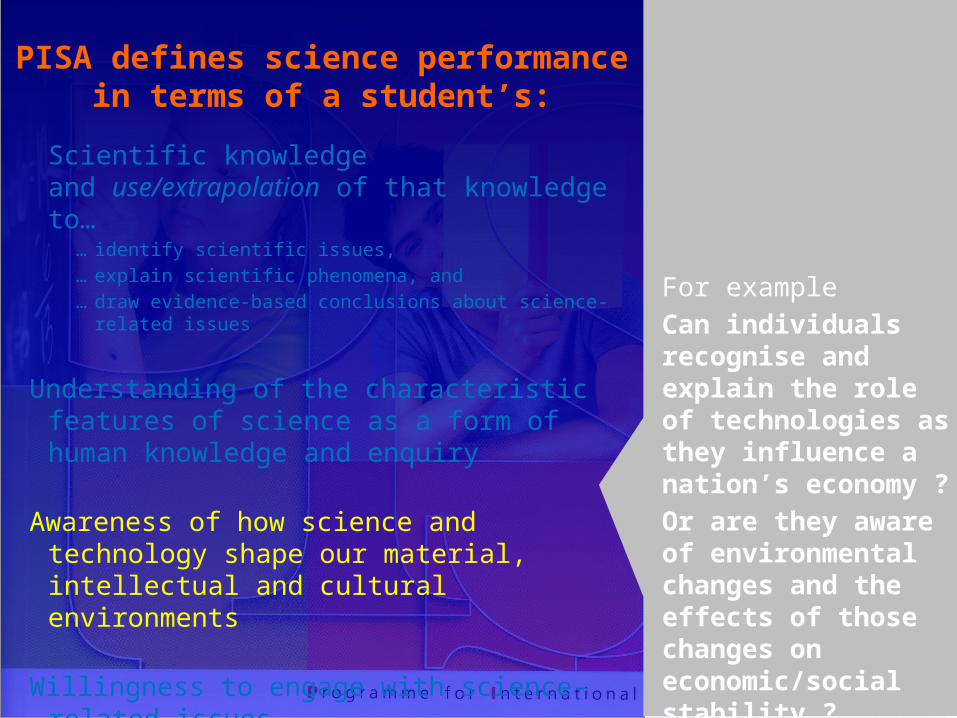
sotaPISA defines science performance
in terms of a student’s:
Scientific knowledge and use/extrapolation of that knowledge to…
… identify scientific issues, … explain scientific phenomena, and … draw evidence-based conclusions about
science-related issues
Understanding of the characteristic features of science as a form of human knowledge and enquiry
Awareness of how science and technology shape our material, intellectual and cultural environments
Willingness to engage with science-related issues
For exampleWhen reading about a health issue, can students separate scientific from non-scientific aspects of the text, apply knowledge and justify personal decisions ?

2424U
niv
ers
ity
of
Min
nes
ota
Ma
rch
, 22
200
9B
rin
gin
g L
esso
ns
fro
m t
he
Wor
ld’s
Top
Per
form
ers
to M
inne
sotaPISA defines science performance
in terms of a student’s:
Scientific knowledge and use/extrapolation of that knowledge to…
… identify scientific issues, … explain scientific phenomena, and … draw evidence-based conclusions about
science-related issues
Understanding of the characteristic features of science as a form of human knowledge and enquiry
Awareness of how science and technology shape our material, intellectual and cultural environments
Willingness to engage with science-related issues
For exampleCan students distinguish between evidence-based explanations and personal opinions ?
2525U
niv
ers
ity
of
Min
nes
ota
Ma
rch
, 22
200
9B
rin
gin
g L
esso
ns
fro
m t
he
Wor
ld’s
Top
Per
form
ers
to M
inne
sotaPISA defines science performance
in terms of a student’s:
Scientific knowledge and use/extrapolation of that knowledge to…
… identify scientific issues, … explain scientific phenomena, and … draw evidence-based conclusions about
science-related issues
Understanding of the characteristic features of science as a form of human knowledge and enquiry
Awareness of how science and technology shape our material, intellectual and cultural environments
Willingness to engage with science-related issues
For exampleCan individuals recognise and explain the role of technologies as they influence a nation’s economy ? Or are they aware of environmental changes and the effects of those changes on economic/social stability ?

2626U
niv
ers
ity
of
Min
nes
ota
Ma
rch
, 22
200
9B
rin
gin
g L
esso
ns
fro
m t
he
Wor
ld’s
Top
Per
form
ers
to M
inne
sotaPISA defines science performance
in terms of a student’s:
Scientific knowledge and use/extrapolation of that knowledge to…
… identify scientific issues, … explain scientific phenomena, and … draw evidence-based conclusions about
science-related issues
Understanding of the characteristic features of science as a form of human knowledge and enquiry
Awareness of how science and technology shape our material, intellectual and cultural environments
Willingness to engage with science-related issues
Interest in science, support for scientific enquiry, responsibility for the environment
This addresses the value students place on science, both in terms of topics and in terms of the scientific approach to understanding the world and solving problems
2727U
niv
ers
ity
of
Min
nes
ota
Ma
rch
, 22
200
9B
rin
gin
g L
esso
ns
fro
m t
he
Wor
ld’s
Top
Per
form
ers
to M
inne
sota
Context- Personal
- Social/public- Global
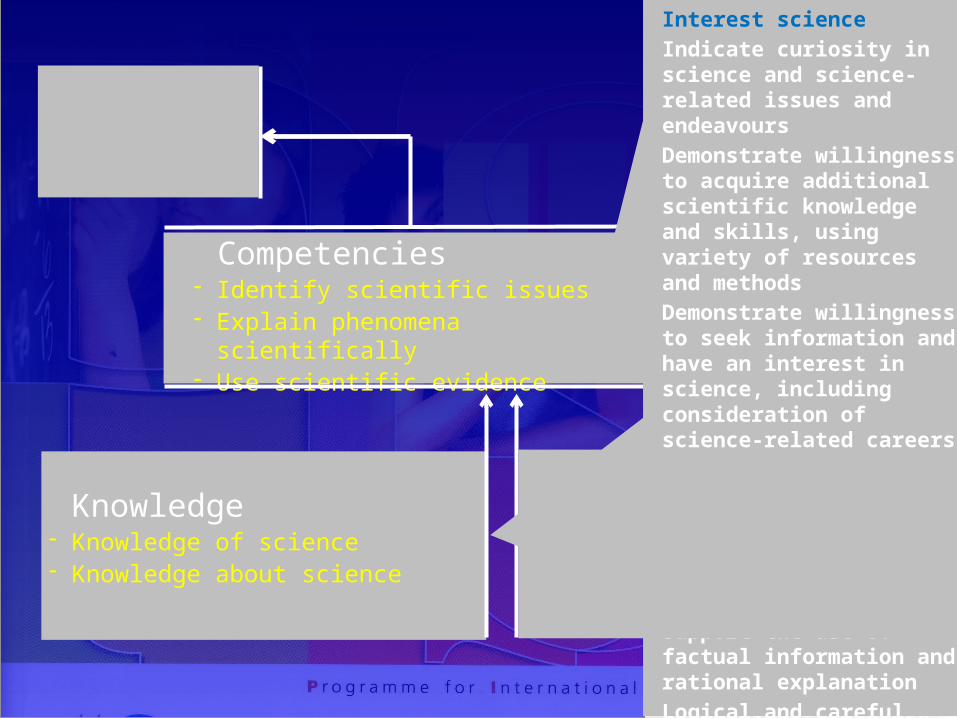
Competencies- Identify scientific issues- Explain phenomena scientifically- Use scientific evidence
Knowledge- Knowledge of science- Knowledge about science
Attitudes-Interest in science-Support for scientific enquiry-Responsibility
IdentifyingRecognising issues that can be investigated scientificallyIdentifying keywords in a scientific investigationRecognising the key features of a scientific investigation
ExplainingApplying knowledge of science in a situationDescribing or interpreting phenomena scientifically or predicting change
Using evidenceInterpreting scientific evidence and drawing conclusionsIdentifying the assumptions, evidence and reasoning behind conclusions
Knowledge of sciencePhysical systems (structure of matter, properties of matter, chemical changes of matter, motions and forces, energy and its transformations, energy and matter)Living systems (cells, humans, populations, ecosystems, biosphere)Earth and space (structures of the earth system, energy in the earth system, change in the earth system, earth’s history, space)Technology systems (Concepts and principles, science and technology)Knowledge about scienceScientific enquiry (purpose, experiments, data, measurement, characteristics of results)Scientific explanations (types, rules, outcomes)
Interest scienceIndicate curiosity in science and science-related issues and endeavoursDemonstrate willingness to acquire additional scientific knowledge and skills, using variety of resources and methodsDemonstrate willingness to seek information and have an interest in science, including consideration of science-related careers Support for scienceAcknowledge the importance of considering different scientific perspectives and argumentsSupport the use of factual information and rational explanationLogical and careful processes in drawing conclusions

2929U
niv
ers
ity
of
Min
nes
ota
Ma
rch
, 22
200
9B
rin
gin
g L
esso
ns
fro
m t
he
Wor
ld’s
Top
Per
form
ers
to M
inne
sotaAverage performanceof 15-year-olds in science – extrapolate and apply
High science performance
Low science performance
… 18 countries perform below this line
I srael
I talyPortugal Greece
Russian Federation
LuxembourgSlovak Republic,Spain,Iceland Latvia
Croatia
Sweden
DenmarkFrancePoland
Hungary
AustriaBelgiumIreland
Czech Republic SwitzerlandMacao- ChinaGermanyUnited Kingdom
Korea
J apanAustralia
Slovenia
NetherlandsLiechtenstein
New ZealandChinese Taipei
Hong Kong- China
Finland
CanadaEstonia
United States LithuaniaNorway
445
465
485
505
525
545
565
616

3030U
niv
ers
ity
of
Min
nes
ota
Ma
rch
, 22
200
9B
rin
gin
g L
esso
ns
fro
m t
he
Wor
ld’s
Top
Per
form
ers
to M
inne
sota
Context- Personal
- Social/public- Global
Competencies- Identify scientific issues- Explain phenomena scientifically- Use scientific evidence
Knowledge- Knowledge of science- Knowledge about science
Attitudes-Interest in science-Support for scientific enquiry-Responsibility
IdentifyingRecognising issues that can be investigated scientificallyIdentifying keywords in a scientific investigationRecognising the key features of a scientific investigation
ExplainingApplying knowledge of science in a situationDescribing or interpreting phenomena scientifically or predicting change
Using evidenceInterpreting scientific evidence and drawing conclusionsIdentifying the assumptions, evidence and reasoning behind conclusions
OECD Level 6
OECD Level 2 Students can demonstrate
ability to understand and articulate the complex modelling inherent in the design of an investigation.
Students can determine ifscientific measurement can be applied to a given variable in an investigation. Students can appreciate the relationship between a simple model and the phenomenon it is modelling.
Students can draw ona range of abstract scientific knowledge and concepts andthe relationships between these in developing explanations ofprocesses
Students can recall anappropriate, tangible, scientific fact applicable in a simple and straightforward context and can use it to explain or predict an outcome.
Students demonstrateability to compare and differentiate among competing explanations byexamining supporting evidence. They can formulate arguments by synthesising evidence from multiplesources.
Students can point to an obvious feature in a simple table in support of a given statement. They are able to recognise if a set of given characteristics apply to the function of everydayartifacts.

3131U
niv
ers
ity
of
Min
nes
ota
Ma
rch
, 22
200
9B
rin
gin
g L
esso
ns
fro
m t
he
Wor
ld’s
Top
Per
form
ers
to M
inne
sota
Ne
w Z
ea
lan
d
Fin
lan
d
Un
ite
d K
ing
do
m
Au
stra
lia
Jap
an
Ca
na
da
OE
CD
ave
rag
e
Po
rtu
ga
l
Ita
ly
Tu
rke
y
Me
xic
o
Un
ite
d S
tate
s
Ko
rea
60
40
20
0
20
40
60
80
100
Level 6 Level 5 Level 4 Level 3 Level 2 Below Level 1%
530 563 515 527 531 534 500 474 475 424 410 489 522
Large proportion of top performers
Top and bottom performers in science
Large prop. of poor perf.
These students often confuse key features of a scientific investigation, apply incorrect information, mix personal beliefs with facts in support of a position…
These students can consistently identify, explain and apply scientific knowledge, link different information sources and explanations and use evidence from these to justify decisions, demonstrate advanced scientific thinking in unfamiliar situations…
3232U
niv
ers
ity
of
Min
nes
ota
Ma
rch
, 22
200
9B
rin
gin
g L
esso
ns
fro
m t
he
Wor
ld’s
Top
Per
form
ers
to M
inne
sota
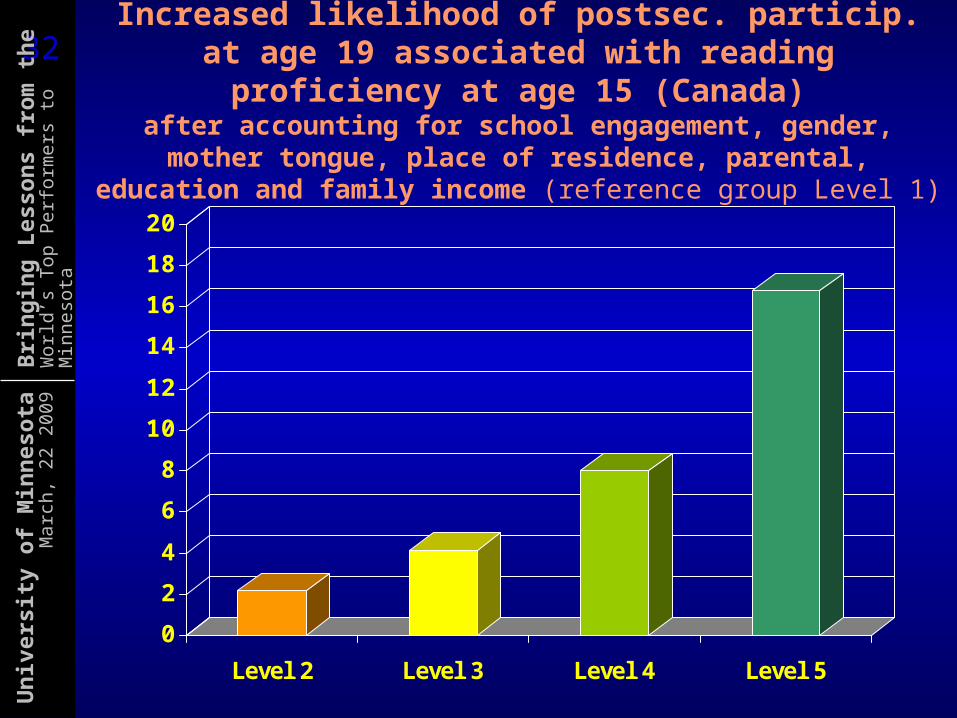
Increased likelihood of postsec. particip. at age 19 associated with reading proficiency at age
15 (Canada)after accounting for school engagement, gender, mother
tongue, place of residence, parental, education and family income (reference group Level 1)
0
2
4
6
8
10
12
14
16
18
20
Level 2 Level 3 Level 4 Level 5
3333U
niv
ers
ity
of
Min
nes
ota
Ma
rch
, 22
200
9B
rin
gin
g L
esso
ns
fro
m t
he
Wor
ld’s
Top
Per
form
ers
to M
inne
sota
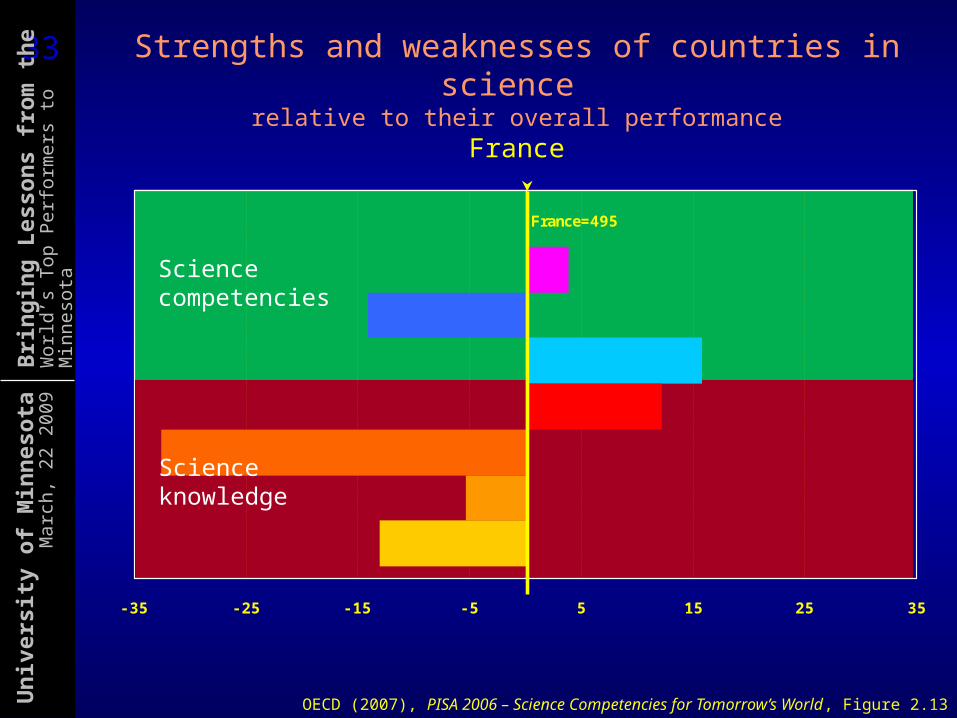
France=495
- 35 - 25 - 15 - 5 5 15 25 35
Overall science score
I dentifying scientific issues
Explaining phenomena scientifically
Using scientific evidence
Knowledge about science
Earth and space
Living systems
Physical systems
Strengths and weaknesses of countries in science relative to their overall performance
France
OECD (2007), PISA 2006 – Science Competencies for Tomorrow’s World, Figure 2.13
Science competencies
Science knowledge

3434U
niv
ers
ity
of
Min
nes
ota
Ma
rch
, 22
200
9B
rin
gin
g L
esso
ns
fro
m t
he
Wor
ld’s
Top
Per
form
ers
to M
inne
sota
France=495 Czech Republic=512
- 35 - 25 - 15 - 5 5 15 25 35
Overall science score
I dentifying scientific issues
Explaining phenomena scientifically
Using scientific evidence
Knowledge about science
Earth and space
Living systems
Physical systems
Strengths and weaknesses of countries in science relative to their overall performance
Czech Republic
OECD (2007), PISA 2006 – Science Competencies for Tomorrow’s World, Figure 2.13
Scientific competencies
Scientific knowledge
20
3535U
niv
ers
ity
of
Min
nes
ota
Ma
rch
, 22
200
9B
rin
gin
g L
esso
ns
fro
m t
he
Wor
ld’s
Top
Per
form
ers
to M
inne
sota
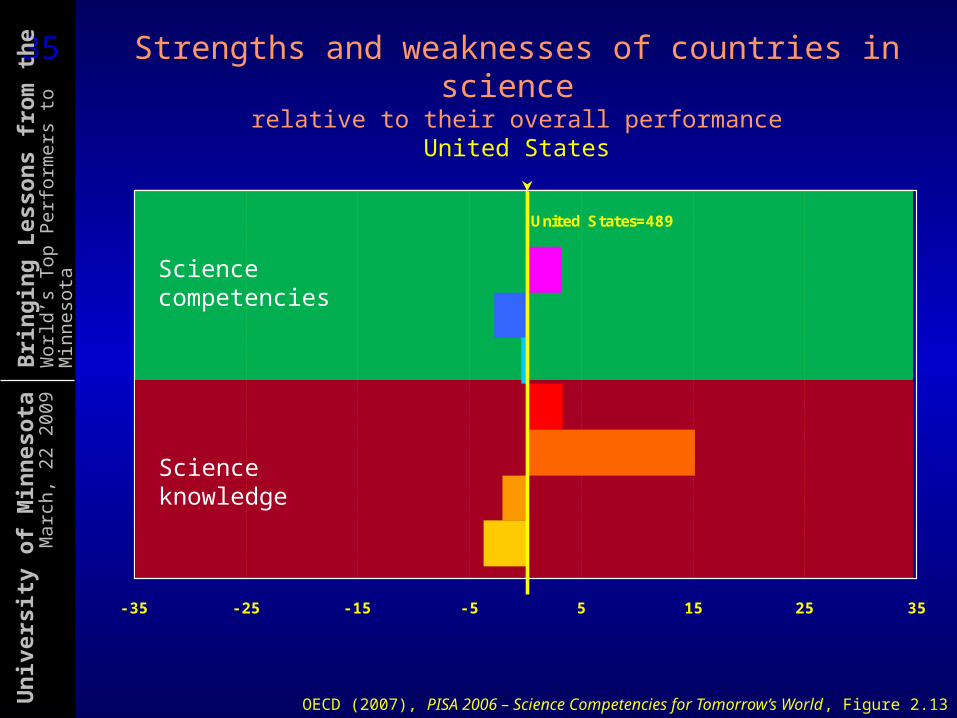
United States=489
- 35 - 25 - 15 - 5 5 15 25 35
Overall science score
I dentifying scientific issues
Explaining phenomena scientifically
Using scientific evidence
Knowledge about science
Earth and space
Living systems
Physical systems
Strengths and weaknesses of countries in science relative to their overall performance
United States
OECD (2007), PISA 2006 – Science Competencies for Tomorrow’s World, Figure 2.13
Science competencies
Science knowledge
3636U
niv
ers
ity
of
Min
nes
ota
Ma
rch
, 22
200
9B
rin
gin
g L
esso
ns
fro
m t
he
Wor
ld’s
Top
Per
form
ers
to M
inne
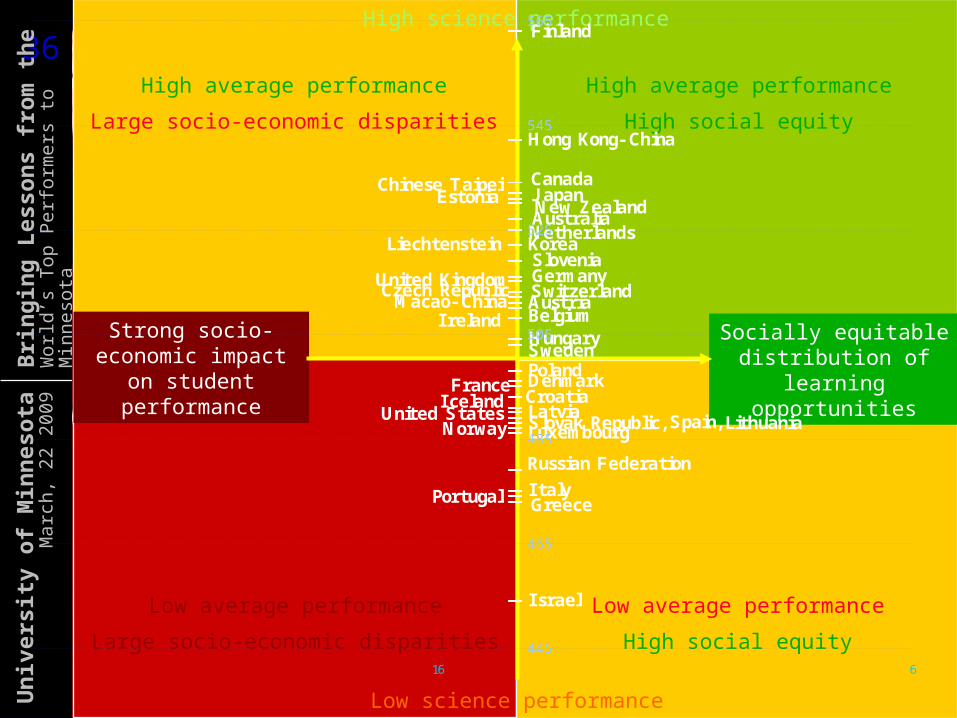
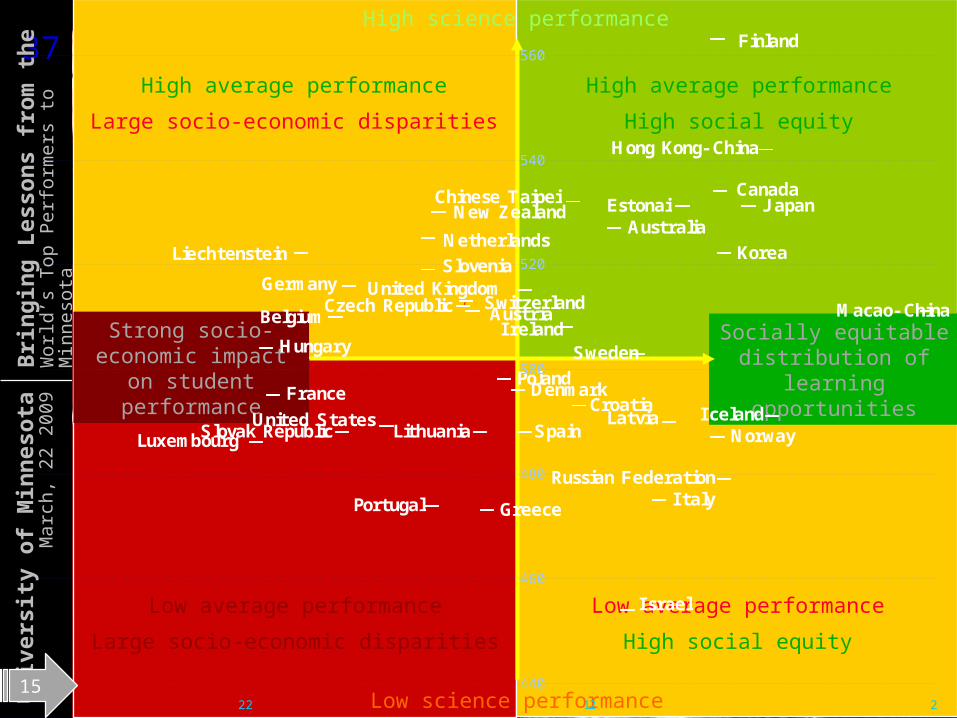
sotaAverage performanceof 15-year-olds in science – extrapolate and apply
Low average performance
Large socio-economic disparities
High average performance
Large socio-economic disparities
Low average performance
High social equity
High average performance
High social equity
Strong socio-economic impact on
student performance
Socially equitable distribution of
learning opportunities
High science performance
Low science performance
I srael
I talyPortugal Greece
Russian Federation
LuxembourgSlovak Republic,Spain,Iceland Latvia
Croatia
Sweden
DenmarkFrancePoland
Hungary
AustriaBelgiumIreland
Czech Republic SwitzerlandMacao- ChinaGermanyUnited Kingdom
Korea
J apanAustralia
Slovenia
NetherlandsLiechtenstein
New ZealandChinese Taipei
Hong Kong- China
Finland
CanadaEstonia
United States LithuaniaNorway
445
465
485
505
525
545
565
616
3737U
niv
ers
ity
of
Min
nes
ota
Ma
rch
, 22
200
9B
rin
gin
g L
esso
ns
fro
m t
he
Wor
ld’s
Top
Per
form
ers
to M
inne
sota Durchschnittliche
Schülerleistungen im Bereich Mathematik
Low average performance
Large socio-economic disparities
High average performance
Large socio-economic disparities
Low average performance
High social equity
High average performance
High social equity
Strong socio-economic impact on
student performance
Socially equitable distribution of
learning opportunities
High science performance
Low science performance
I srael
GreecePortugal I talyRussian Federation
LuxembourgSlovak Republic SpainIcelandLatvia
Croatia
Sweden
DenmarkFrancePoland
Hungary
AustriaBelgiumIreland
Czech Republic Switzerland Macao- China
Germany United Kingdom
Korea
J apanAustralia
SloveniaNetherlands
Liechtenstein
New ZealandChinese Taipei
Hong Kong- China
Finland
CanadaEstonai
United StatesLithuania Norway
440
460
480
500
520
540
560
2122215

4242P
ISA
OE
CD
Pro
gram
me
for
Inte
rnat
iona
l Stu
dent
Ass
essm
ent
Brie
fing
of C
ounc
il
14 N
ovem
ber
2007
How to get thereSome policy levers that emerge from
international comparisons
4343U
niv
ers
ity
of
Min
nes
ota
Ma
rch
, 22
200
9B
rin
gin
g L
esso
ns
fro
m t
he
Wor
ld’s
Top
Per
form
ers
to M
inne
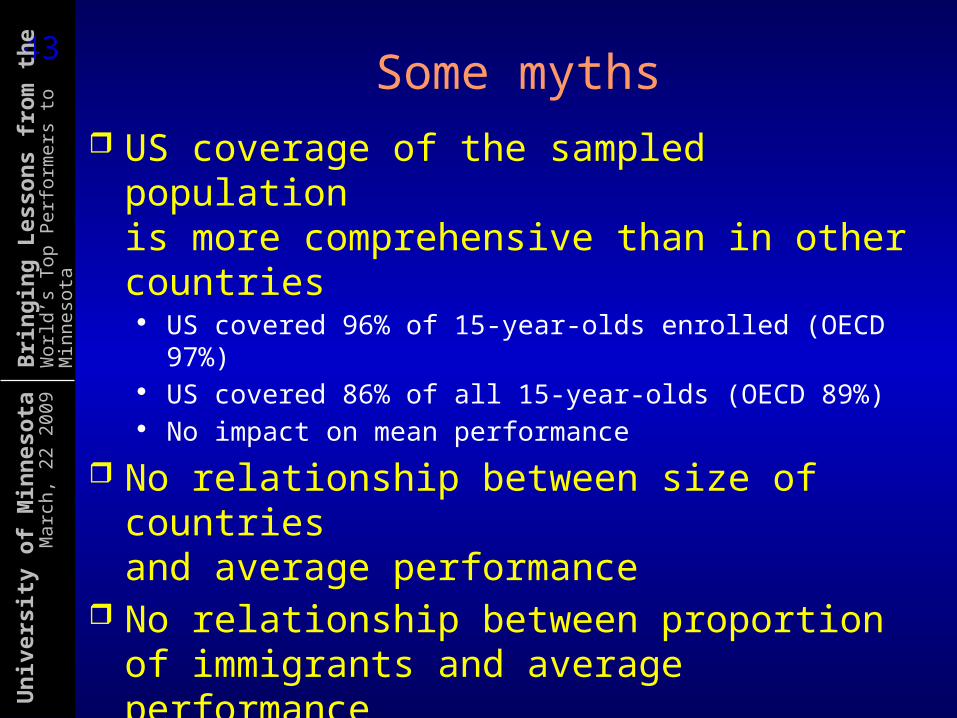
sota Some myths
US coverage of the sampled population is more comprehensive than in other countries
US covered 96% of 15-year-olds enrolled (OECD 97%) US covered 86% of all 15-year-olds (OECD 89%) No impact on mean performance
No relationship between size of countries and average performance
No relationship between proportion of immigrants and average performance
Few difference in students’ reported test motivation
Limited impact of national item preferences .

4545U
niv
ers
ity
of
Min
nes
ota
Ma
rch
, 22
200
9B
rin
gin
g L
esso
ns
fro
m t
he
Wor
ld’s
Top
Per
form
ers
to M
inne
sota
High ambitions and universal
standards
Rigor, focus and coherence
Great systems attract great teachers and
provide access to best practice and quality
professional development
4646U
niv
ers
ity
of
Min
nes
ota
Ma
rch
, 22
200
9B
rin
gin
g L
esso
ns
fro
m t
he
Wor
ld’s
Top
Per
form
ers
to M
inne
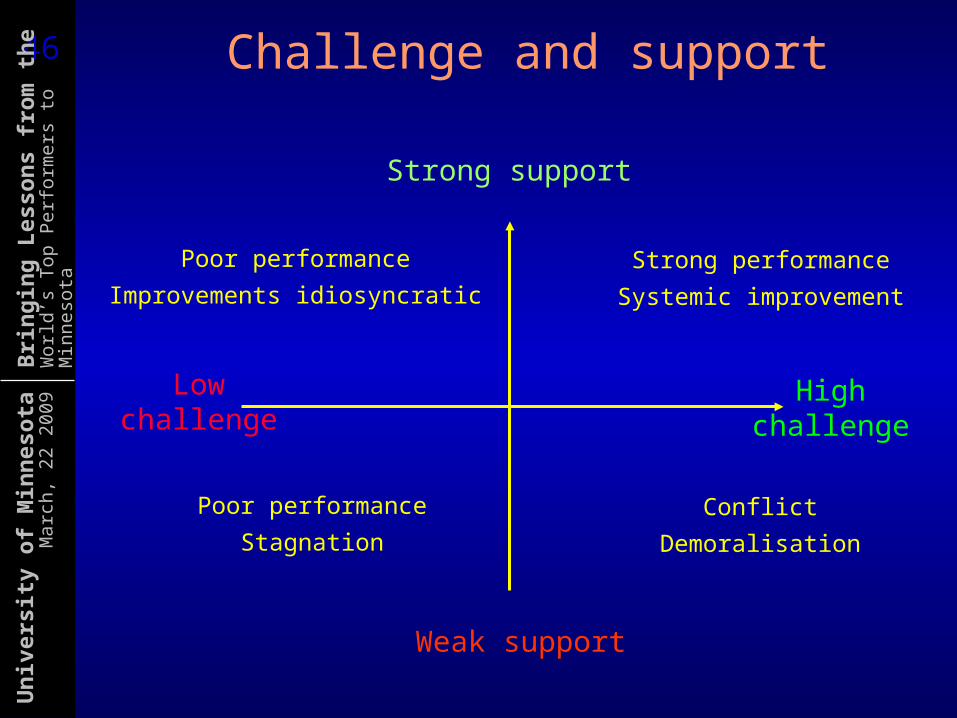
sota Challenge and support
Weak support
Strong support
Lowchallenge
Highchallenge
Strong performance
Systemic improvement
Poor performance
Improvements idiosyncratic
Conflict
Demoralisation
Poor performance
Stagnation

4747U
niv
ers
ity
of
Min
nes
ota
Ma
rch
, 22
200
9B
rin
gin
g L
esso
ns
fro
m t
he
Wor
ld’s
Top
Per
form
ers
to M
inne
sota
High ambitions
Access to best practice and quality professional development
Accountability and intervention in
inverse proportion to success
Devolved responsibility,
the school as the centre of action

4848U
niv
ers
ity
of
Min
nes
ota
Ma
rch
, 22
200
9B
rin
gin
g L
esso
ns
fro
m t
he
Wor
ld’s
Top
Per
form
ers
to M
inne
sota
No
Yes
0
10
20
30
40
50
60
70
No
Yes
0
41
46
63
Standards based external
examinations School autonomyin selecting teachers for hire
PISA score in science
School autonomy, standards-based examinations and science performance
School autonomy in selecting teachers for hire
4949U
niv
ers
ity
of
Min
nes
ota
Ma
rch
, 22
200
9B
rin
gin
g L
esso
ns
fro
m t
he
Wor
ld’s
Top
Per
form
ers
to M
inne
sota
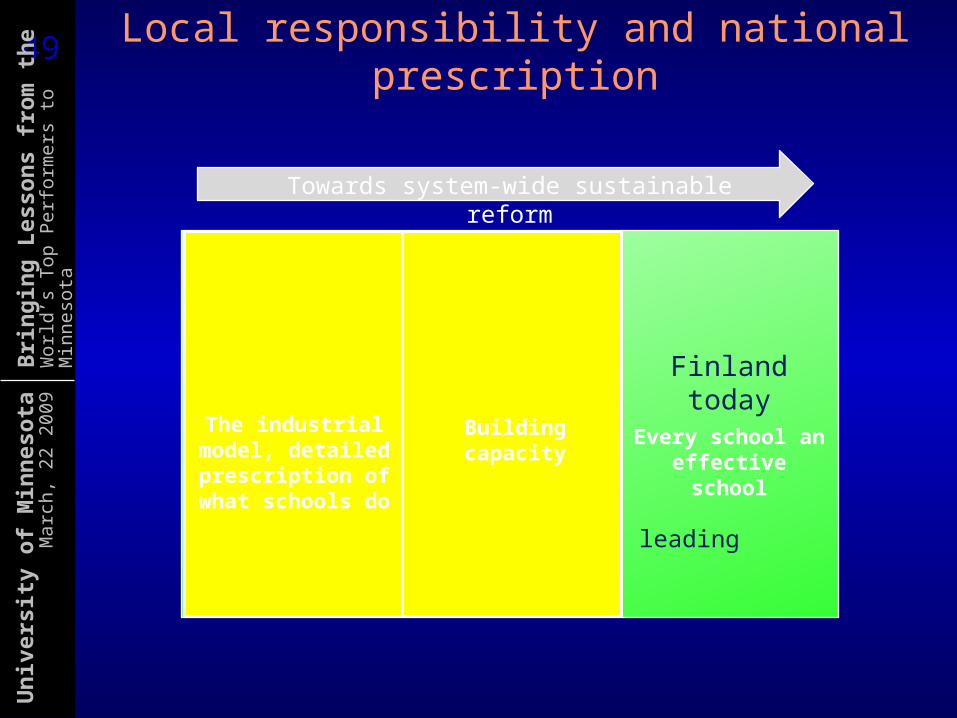
Local responsibility and national prescription
National prescription
Schools leading reform
Schools todayThe industrial
model, detailed prescription of
what schools do
Schools tomorrow?
Building capacity
Finland todayEvery school an effective school
Towards system-wide sustainable reform

5050U
niv
ers
ity
of
Min
nes
ota
Ma
rch
, 22
200
9B
rin
gin
g L
esso
ns
fro
m t
he
Wor
ld’s
Top
Per
form
ers
to M
inne
sota
Public and private schools
0 20 40 60 80 100
Luxembourg
J apan
I taly
Switzerland
Finland
Denmark
Czech Republic
Sweden
Hungary
Austria
Portugal
United States
Netherlands
Slovak Republic
Korea
I reland
Spain
Canada
Mexico
New Zealand
Germany
OECD
United Kingdom
Government schools
Government dependent private
Government independent private
- 150 - 100 - 50 0 50 100
Observed perf ormance diff erence
Diff erence af ter accounting f or socio-economic background of students and schools
Private schools perform better
Public schools perform better
%Score point difference
5151U
niv
ers
ity
of
Min
nes
ota
Ma
rch
, 22
200
9B
rin
gin
g L
esso
ns
fro
m t
he
Wor
ld’s
Top
Per
form
ers
to M
inne
sota
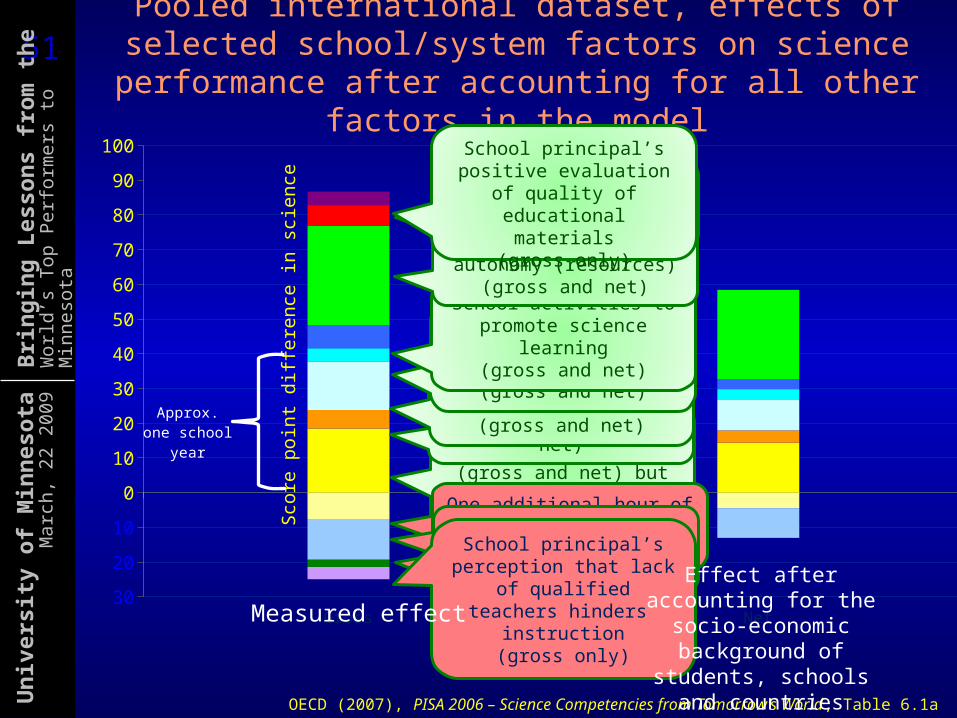
Pooled international dataset, effects of selected school/system factors on science performance after
accounting for all other factors in the model
OECD (2007), PISA 2006 – Science Competencies from Tomorrow’s World, Table 6.1a
Gross Net30
20
10
0
10
20
30
40
50
60
70
80
90
100
Approx. one school year
Sco
re p
oin
t d
iffe
ren
ce in
sci
en
ce
Schools practicing ability grouping (gross and net)
Academically selective schools (gross and net)
but no system-wide effect
School results posted publicly (gross and net)
One additional hour of science learning at
school (gross and net)
One additional hour of out-of-school lessons
(gross and net)
One additional hour of self-study or homework
(gross and net)
School activities to promote science
learning(gross and net)
Schools with greater autonomy (resources)
(gross and net)
Each additional 10% of public funding(gross only)
Schools with more competing schools
(gross only)
School principal’s perception that lack of
qualified teachers hinders instruction
(gross only)
School principal’s positive evaluation of quality of educational
materials(gross only)
Measured effect
Effect after accounting for the socio-economic
background of students, schools and countries

5252U
niv
ers
ity
of
Min
nes
ota
Ma
rch
, 22
200
9B
rin
gin
g L
esso
ns
fro
m t
he
Wor
ld’s
Top
Per
form
ers
to M
inne
sota
Strong ambitions
Access to best practice and quality professional development
Accountability
Devolvedresponsibility,
the school as the centre of action
Integrated educational
opportunities
From prescribed forms of teaching and assessment towards personalised learning

5353U
niv
ers
ity
of
Min
nes
ota
Ma
rch
, 22
200
9B
rin
gin
g L
esso
ns
fro
m t
he
Wor
ld’s
Top
Per
form
ers
to M
inne
sota Durchschnittliche
Schülerleistungen im Bereich Mathematik
Low average performance
Large socio-economic disparities
High average performance
Large socio-economic disparities
Low average performance
High social equity
High average performance
High social equity
Strong socio-economic impact on
student performance
Socially equitable distribution of
learning opportunities
High science performance
Low science performanceTurkey
AustraliaJ apan
Finland
CanadaNew Zealand
Korea
Czech Republic United KingdomAustria
Germany
Netherlands
SwitzerlandI relandBelgium
PolandSwedenHungary
IcelandFrance Denmark
United States SpainLuxembourg NorwaySlovak Republic
I talyGreecePortugal
420
440
460
480
500
520
540
560
580
21222
Early selection and institutional differentiation
High degree of stratification
Low degree of stratification
6
5454U
niv
ers
ity
of
Min
nes
ota
Ma
rch
, 22
200
9B
rin
gin
g L
esso
ns
fro
m t
he
Wor
ld’s
Top
Per
form
ers
to M
inne
sota
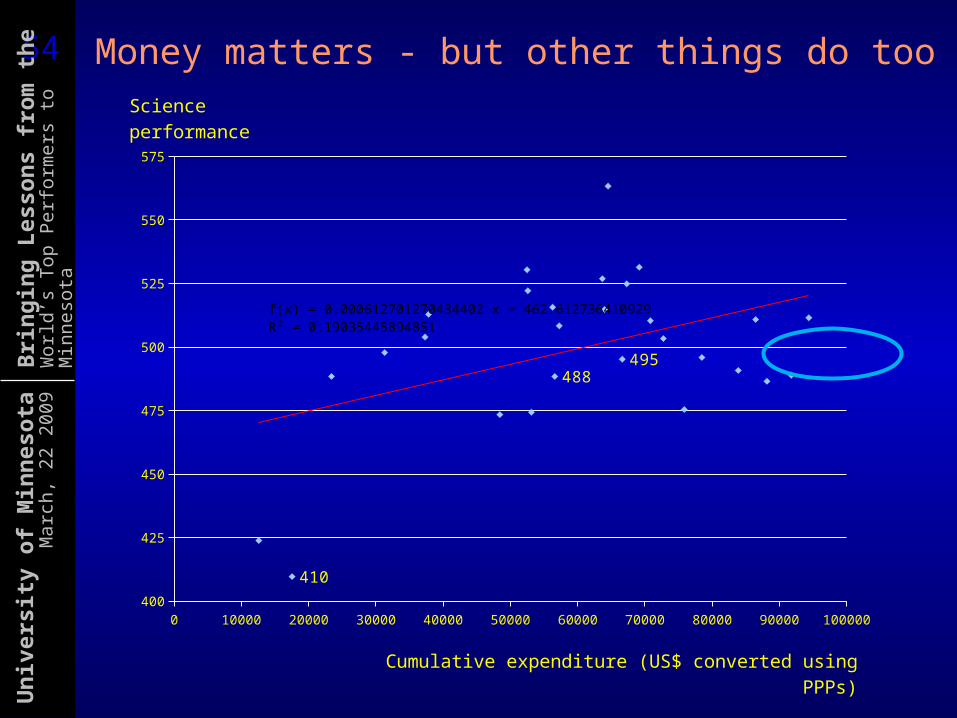
Money matters - but other things do too
0 10000 20000 30000 40000 50000 60000 70000 80000 90000 100000400
425
450
475
500
525
550
575
495
410
488
f(x) = 0.000612701270434402 x + 462.612736410929R² = 0.19035445894851
Scienceperformance
Cumulative expenditure (US$ converted using PPPs)

5555U
niv
ers
ity
of
Min
nes
ota
Ma
rch
, 22
200
9B
rin
gin
g L
esso
ns
fro
m t
he
Wor
ld’s
Top
Per
form
ers
to M
inne
sota
Port
ug
al
Sp
ain
Sw
itze
rlan
d
Tu
rkey
Belg
ium
Kore
a
Lu
xem
bou
rg
Germ
an
y
Gre
ece
Jap
an
Au
stra
lia
Un
ited
Kin
gd
om
New
Zeala
nd
Fra
nce
Neth
erl
an
ds
Den
mark
Italy
Au
stri
a
Cze
ch
Rep
ub
lic
Hu
ng
ary
Norw
ay
Icela
nd
Irela
nd
Mexic
o
Fin
lan
d
Sw
ed
en
Un
ited
Sta
tes
Pola
nd
Slo
vak R
ep
ub
lic
-10
-5
0
5
10
15
Salary as % of GDP/capita Instruction time 1/teaching time 1/class sizePort
ug
al
Sp
ain
Sw
itze
rlan
d
Tu
rkey
Belg
ium
Kore
a
Lu
xem
bou
rg
Germ
an
y
Gre
ece
Jap
an
Au
stra
lia
Un
ited
Kin
gd
om
New
Zeala
nd
Fra
nce
Neth
erl
an
ds
Den
mark
Italy
Au
stri
a
Cze
ch
Rep
ub
lic
Hu
ng
ary
Norw
ay
Icela
nd
Irela
nd
Mexic
o
Fin
lan
d
Sw
ed
en
Un
ited
Sta
tes
Pola
nd
Slo
vak R
ep
ub
lic
-10
-5
0
5
10
15
Difference with OECD average
Spending choices on secondary schoolsContribution of various factors to upper secondary teacher compensation costs
per student as a percentage of GDP per capita (2004)
Percentage points

5656U
niv
ers
ity
of
Min
nes
ota
Ma
rch
, 22
200
9B
rin
gin
g L
esso
ns
fro
m t
he
Wor
ld’s
Top
Per
form
ers
to M
inne
sota Paradigm shifts
Prescription Informed profession
Uniformity Embracing diversity
Demarcation Collaboration
Provision Outcomes
Bureaucratic – look up Devolved – look outwards
Talk equity Deliver equity
Hit & miss Universal high standards
Received wisdom Data and best practice
The old bureaucratic education system The modern enabling education system
5757U
niv
ers
ity
of
Min
nes
ota
Ma
rch
, 22
200
9B
rin
gin
g L
esso
ns
fro
m t
he
Wor
ld’s
Top
Per
form
ers
to M
inne
sota
Towards next generation of global benchmarks
Challenges to the instrumentsChallenges to the approach
5858U
niv
ers
ity
of
Min
nes
ota
Ma
rch
, 22
200
9B
rin
gin
g L
esso
ns
fro
m t
he
Wor
ld’s
Top
Per
form
ers
to M
inne
sota
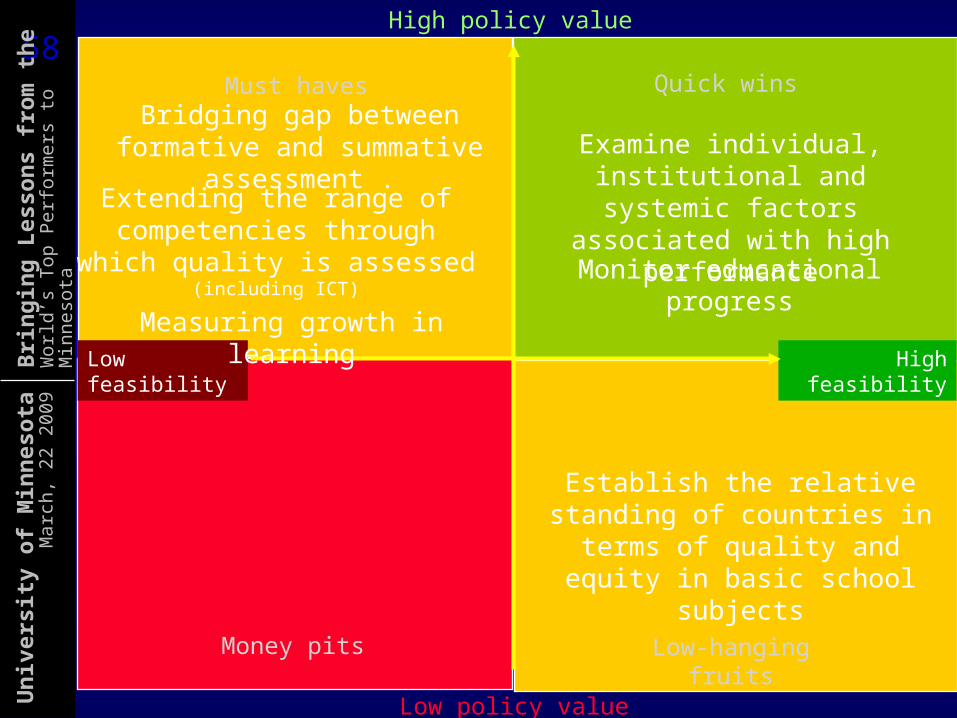
Low policy value
High policy value
Low feasibility High feasibility
Money pits
Must haves
Low-hanging fruits
Quick wins
Examine individual, institutional and systemic
factors associated with high performance
Establish the relative standing of countries in terms of quality and equity in basic
school subjects
Extending the range of competencies through which quality is assessed (including ICT)
Measuring growth in learning
Bridging gap between formative and summative
assessment .
Monitor educational progress
5959U
niv
ers
ity
of
Min
nes
ota
Ma
rch
, 22
200
9B
rin
gin
g L
esso
ns
fro
m t
he
Wor
ld’s
Top
Per
form
ers
to M
inne
sota
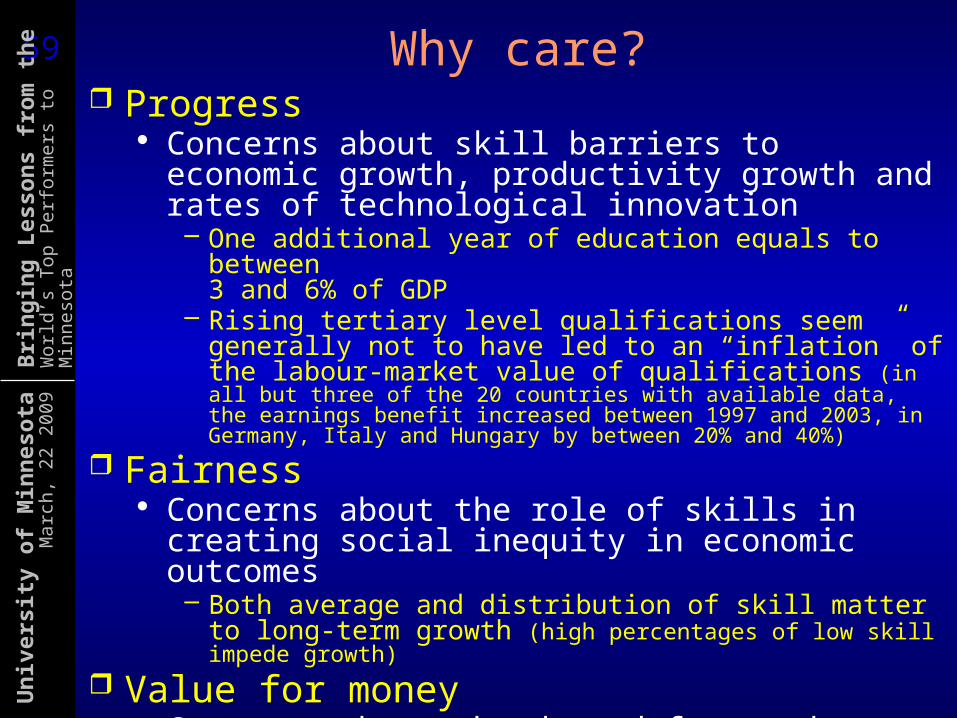
Why care? Progress
Concerns about skill barriers to economic growth, productivity growth and rates of technological innovation– One additional year of education equals to between
3 and 6% of GDP– Rising tertiary level qualifications seem generally not
to have led to an “inflation” of the labour-market value of qualifications (in all but three of the 20 countries with available data, the earnings benefit increased between 1997 and 2003, in Germany, Italy and Hungary by between 20% and 40%)
Fairness Concerns about the role of skills in creating
social inequity in economic outcomes– Both average and distribution of skill matter
to long-term growth (high percentages of low skill impede growth)
Value for money Concerns about the demand for, and efficiency
and effectiveness of, investments in public goods
6060U
niv
ers
ity
of
Min
nes
ota
Ma
rch
, 22
200
9B
rin
gin
g L
esso
ns
fro
m t
he
Wor
ld’s
Top
Per
form
ers
to M
inne
sota
0
10
20
30
40
1989
1994
1999
2004
2014
2019
2024
2029
2034
2039
2044
2049
2054
2059
2064
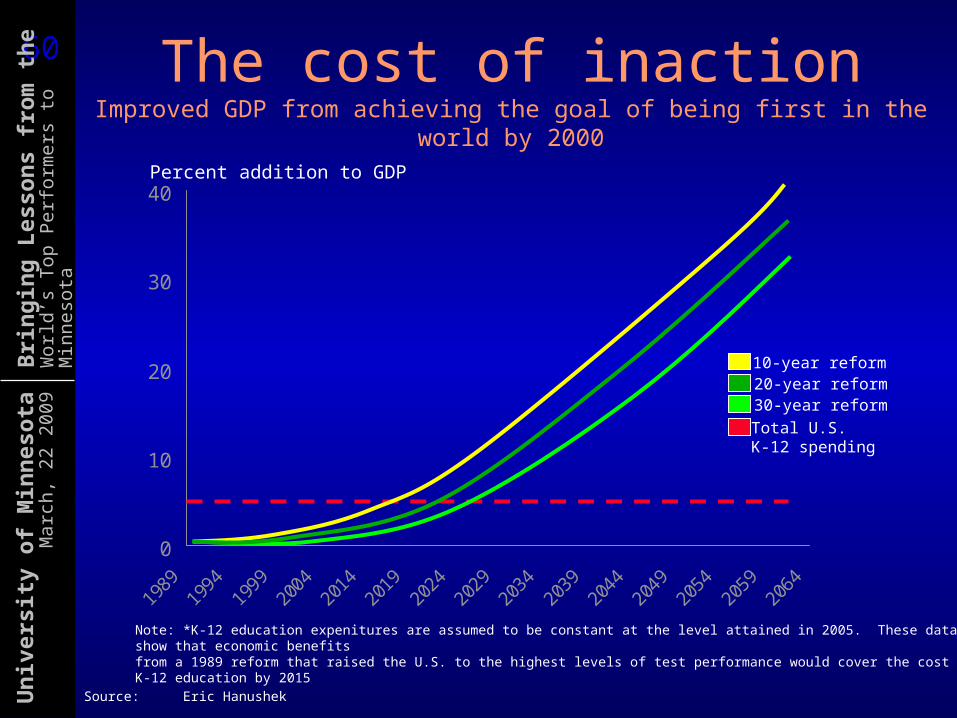
The cost of inactionImproved GDP from achieving the goal of being first in the world by 2000
Note: *K-12 education expenitures are assumed to be constant at the level attained in 2005. These data show that economic benefits from a 1989 reform that raised the U.S. to the highest levels of test performance would cover the cost of K-12 education by 2015
Source:Eric Hanushek
Percent addition to GDP
10-year reform20-year reform30-year reformTotal U.S. K-12 spending
6161U
niv
ers
ity
of
Min
nes
ota
Ma
rch
, 22
200
9B
rin
gin
g L
esso
ns
fro
m t
he
Wor
ld’s
Top
Per
form
ers
to M
inne
sota
6262U
niv
ers
ity
of
Min
nes
ota
Ma
rch
, 22
200
9B
rin
gin
g L
esso
ns
fro
m t
he
Wor
ld’s
Top
Per
form
ers
to M
inne
sota
Thank you !
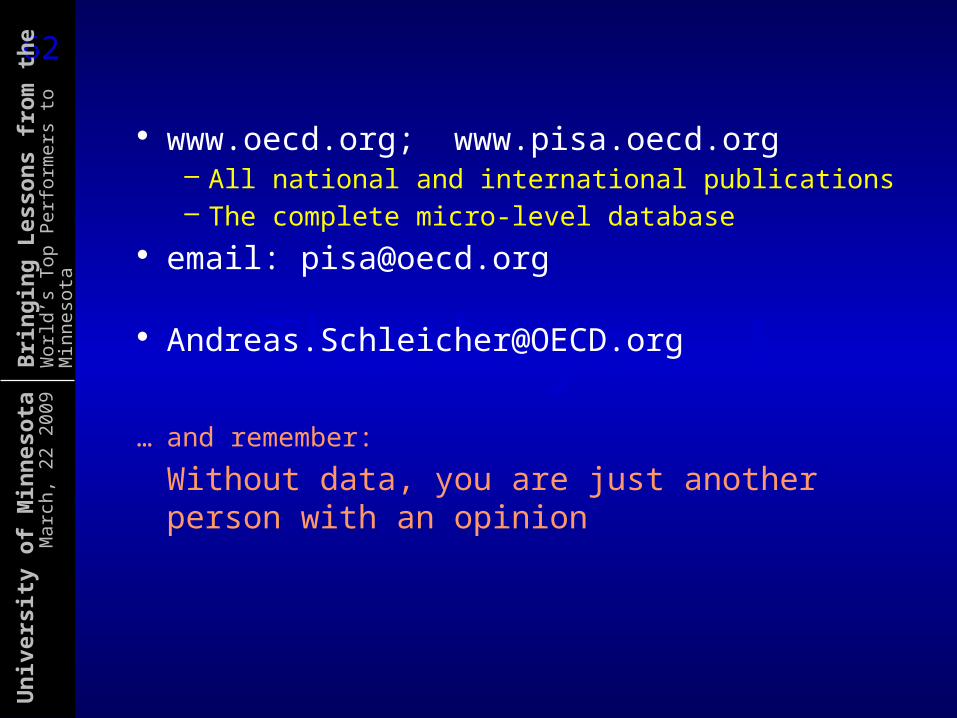
www.oecd.org; www.pisa.oecd.org– All national and international publications– The complete micro-level database
email: [email protected]
…and remember:
Without data, you are just another person with an opinion