This report contains portions of the economic impact ... Appliance Coating... · coating operations...
32
This report contains portions of the economic impact analysis report that are related to the industry profile.
Transcript of This report contains portions of the economic impact ... Appliance Coating... · coating operations...

This report contains portions of the economic impact analysis report that are related to theindustry profile.

September 22, 2000 FINAL
2 INDUSTRY PROFILE
Large appliance production is an assembly-line process in which components are cut,assembled, and coated. The common structural materials used in production are steel andaluminum; however, there has been a recent trend toward the use of plastics for certaincomponents. Households, the construction industry, and the food service industry purchaseand use large appliances. These products include washing machines and dryers,refrigerators, dishwashers, ovens, heaters, and air conditioners. For the purposes of thisindustry profile, we focused on the following Standard Industrial Classification (SIC) codesof the industries that manufacture large appliances:
1. SIC 3585 - Refrigeration and Heating Equipment,
2. SIC 3589 - Service Industry Machinery, not elsewhere classified (n.e.c.),
3. SIC 3631 - Household Cooking Equipment,
4. SIC 3632 - Household Refrigerators and Freezers,
5. SIC 3633 - Household Laundry Equipment, and
6. SIC 3639 - Household Appliances, (n.e.c.).
Although these are the primary SIC codes for manufacture of large appliances and accountfor the majority of sales and production, the economic impact analysis does account forimpacts on facilities that reported a SIC code not included in the above list.
Production of large appliances involves coating operations that emit HAPs throughuse of coatings with high solvent concentrations. Coatings and paints are applied to themetal surfaces of large appliances to protect them from wear and corrosion. The three typesof coatings used in the manufacture of large appliances are waterborne, organic-solvent-borne, and powdered coatings. The coatings possess varying characteristics which makethem suitable for different applications.
This section provides an overview of the large appliances coating industry. Section2.1 describes the production processes involved in large appliance manufacturing with anemphasis on coating operations. Also discussed are the various categories of largeappliances and their production costs. Section 2.2 describes the uses of large appliances andthe consumer groups who purchase them. A summary of the organization of the largeappliance coating industry is presented in Section 2.3. It describes the market structure, thefacilities that manufacture large appliances, and the companies that own the facilities. The

September 22, 2000 FINAL
Agency also identifies small businesses potentially affected by the proposed rule. Finally,Section 2.4 presents available market data and trends for the industry.
2.1 Production Overview
The following discussion of the production process, coating operations, and coatingmaterials is derived from EPA (1980). As Figure 2-1 shows, large appliance manufacturingis a continuous and highly automated process where metal components are assembled andcoated. Coiled or sheet metal is first cut and stamped into the appropriate shapes. Thesepieces are then welded together to form the large appliances. The welded parts are cleanedwith organic degreasers and a mild caustic detergent to remove any grease that might haveaccumulated during handling of the product. Next, the metal is treated in a phosphate bath toprepare the surface for coating. Iron phosphate or zinc phosphate is used because thesecompounds increase the adherence of coatings and improve corrosion resistance of largeappliances. It is at this point that the product is coated and cured. The coated and curedparts then enter the final assembly stage where the last parts are attached to the largeappliances.
2.1.1 Coating Operations
Several available methods exist to coat the surfaces of large appliances. Thealternative methods differ in transfer efficiency, which is measured as the ratio of the amountof paint solids deposited on a surface to the total amount of coating solids used in the coatingprocess. When liquid spray systems are used, transfer efficiency is equal to the ratio of thesolids deposited on the surface to the amount delivered through the application device. Theliquid spray systems include the following:

September 22, 2000 FINAL
Figure 2-1. Flow Diagram of Large Appliance Manufacturing
Forming of Parts andAssembly
Surface Cleaning
Metal Treatingwith Phosphates
Prime Coating
Prime Coat Curing
Final Coating
Final Coat Curing
Final Assembly

September 22, 2000 FINAL
� Air and airless spray coating uses compressed air, which may be heated,filtered, or humidified. The compressed air is used to atomize the coating whichis then directed towards the part to be coated. The transfer efficiency of airspraying is 40 percent. The airless spray method sprays coating through specialnozzles without using air. The transfer efficiency of the airless spray method isslightly higher at 45 percent.
� Electrostatic spray deposits coatings evenly on all sides of the part. The transferefficiency of this method ranges between 55 and 60 percent. With this system,the paint particles are negatively charged, while the part to be coated is positivelycharged. Because of the opposing charge, the paint particles are electricallyattracted to the part. This results in a uniform coating.
� Electrostatic bell or disk coating uses centrifugal forces to cause atomization. A bell or disk with a negatively charged surface is spun around, which thennegatively charges the coating particles passing across it. These coating particlesthen become attracted to the positive grounded parts to be coated. The transferefficiency of this method is 90 percent, which far surpasses that of theelectrostatic spray coating method.
When recycling coating systems are used instead, transfer efficiency is calculated asthe ratio of the solids adhering to the surface to the amount of coating solids delivered,excluding the solids that are recovered for re-use. Recycling coating systems include thefollowing:
� Dip coating is used on parts not visible after assembly. Hence, the coatingsurface need not be smooth. Parts are lowered into a tank that contains thecoating. After the parts are coated, they proceed to an area where the excess paintdrips off and is recycled. The transfer efficiency of this method is approximately85 percent.
� Flow coating also has a transfer efficiency of 85 percent. It entails running astream of coating over a part. Coatings are pumped through mechanical arms thathave been fitted with nozzles. These arms pass over the part so that it is coated,while the excess paint drips off and is recycled. This coating method is also usedfor parts that are not visible after assembly.
� Electrostatic dip coating produces an extremely smooth uniform coat with atransfer efficiency of approximately 95 percent. A DC voltage is applied betweenelectrodes that are located in a bath of coating and attached to the part to becoated. The part is then dipped into the bath. Since it possesses a charge oppositeof the coating, the coating particles are attracted to it.

September 22, 2000 FINAL
2.1.2 Coating Types
The three major types of coatings are waterborne, conventional organic-solvent-borne, and powder coatings. The different types of coatings vary in their content, in thecoating operations in which they can be used, and in their advantages and disadvantages foruse as coatings. While the purpose of coatings is to provide decoration, wear protection, andcorrosion resistance, some may be better than others for specific large appliances based onthe appliance’s function, life-expectancy, and intensity of use.
The content of waterborne coatings varies based on the coating operation it will beused in. For spray, dip, and flow coating systems, 56 percent of the coating is water, 14percent is organic solvent, and 30 percent is paint solids. In electrostatic methods, thecontent of the waterborne coatings is 90 percent water, 4 percent organic solvents, and 6percent paint solids. The presence of solvents is the only source of VOC emissions fromwaterborne coatings. Since relatively small amounts of solvents are present, use ofwaterborne coatings results in relatively fewer emissions than other coatings. Anotheradvantage that stems from low levels of solvent is that waterborne coatings arenonflammable. While these advantages of waterborne solvents exist, there are also somedisadvantages. Waterborne coatings render large appliances more susceptible to rust andcorrosion relative to organic-solvent-borne coatings. These coatings also do not have thedegreasing ability that some organic solvent-borne coatings do. Use of waterborne coatingswill therefore require increased expenditures on the pre-cleaning process in large appliancemanufacturing.
Conventional organic-solvent-borne coatings contain approximately 30 percent paintsolids and a much higher solvent content than waterborne coatings. They are commonlyused in air, airless, and electrostatic coating systems. Since organic-solvent-borne coatingscontain a higher percentage of solvents, their advantages and disadvantages are contrary tothose of waterborne coatings. The solvent-borne coatings result in higher levels ofemissions, but they provide greater protection to the large appliances. They are also moreflammable in comparison to waterborne coatings.
One of the main advantages to using powder coatings is that they contain no organic-solvents. Powder coatings therefore have low toxicity levels and no organic-solvent VOCemissions when applied. Even though there are no organic-solvent VOC emissions releasedwhen powder coatings are used, some VOCs are emitted in the post-coating applicationstages. Still, powder coatings have low VOC emissions relative to the other types ofcoatings. The use of powder coatings is associated with high transfer efficiencies when usedwith certain coating systems, but there have been problems associated with controlling the

September 22, 2000 FINAL
thickness of powdered coatings when they are applied. Another problem associated withpowder coatings is their explosion potential. Organic powders suspended in air have thepotential to ignite. To alleviate this problem, ventilation rates in the powder coating boothsmust be maintained at a high enough level.
2.1.3 Large Appliance Products
The primary large appliance industry segments are:
� household appliances classified by SIC codes 3631, 3632, 3633, and 3639 andinclude ovens, ranges, refrigerators, freezers, laundry equipment, dishwashingmachines, microwave ovens, and garbage disposals,
� service industry machinery classified by SIC 3589 and includes commercialfood preparation equipment, display cases, commercial carpet cleaners andvacuums, and floor polishing and scrubbing equipment, and
� heating and air conditioning equipment covered by SIC 3585 and includes airconditioners and heaters for homes and motor vehicles, commercial refrigeration,furnaces, heat pumps, drinking fountains, and ice making machinery.
Table 2-1 provides product descriptions of the large appliances and lists the correspondingSIC codes.

September 22, 2000 FINAL
Table 2-1. SIC Codes and Large Appliance Product Descriptions
Product Description SIC Code Example Products
Refrigeration and HeatingEquipment
3585 Air conditioners and parts, including motor vehicle;cold drink dispensing equipment; refrigeratedcabinets and display cases; condensers andcondensing units; coolers; dehumidifiers; electricwarm furnaces; drinking fountains; heat pumps;humidifying equipment; ice making machinery;industrial refrigeration machinery and equipment;snow making machinery; soda fountains
Service Industry Machinery(n.e.c.)
3589 Cafeteria food warming equipment; commercialcarpet sweepers; car washing machinery; includingdirt sweeping units; commercial dishwashingmachines; commercial food warming equipment;commercial garbage disposers; janitors’ carts; coin-operated servicing machines, except dry cleaningand laundry; sewage treatment equipment; powersewer cleaning equipment; sludge processingequipment; industrial and commercial electricvacuum cleaners and sweepers; water conditionersfor swimming pools; household water filters andsofteners; household water purification equipment;industrial water treatment equipment
Household CookingEquipment
3631 Household ovens, ranges, stoves, and microwaves;barbeques, grills, and braziers for outdoor cooking
Household Refrigerators andFreezers
3632 Household refrigerators and freezers
Household LaundryEquipment
3633 Household dry cleaning and laundry machines,including coin-operated; domestic laundry wringers
Household Appliances(n.e.c.)
3639 Household dishwashing machines and garbagedisposal units; household water heaters; householdsewing machines and attachments; buttonhole andeyelet machines and attachments; household floorwaxers and polishers; household trash compactors

September 22, 2000 FINAL
2.1.4 Costs of Production
This section discusses the cost of coating operations as part of total cost of producinglarge appliances. The main cost elements of coating operations include:
� cost of materials, i.e., coating materials, solvents, etc.,
� substrates, i.e., steel, aluminum, and other materials to be coated, and
� other costs, i.e., labor, energy, capital expenditures, etc.
Absent specific cost data, the focus of this section is the cost of coating materials. The pricesof the various types of coatings used in large appliance production are not available; howeverCensus Bureau information is available on coating material costs, total material costs, andvalue of product shipments by SIC code for the years 1992 and 1997.
Table 2-2 shows that for all SIC codes representing large appliance manufacturing,coatings are a small share of the costs of materials used in production and an even smallershare of the value of final product shipments. The cost of other materials, such as metal,plastics, iron and steel castings, and metal stamping equipment make up larger shares of themanufacturing costs of large appliances since larger quantities of these inputs are used toproduce a single large appliance and the cost these inputs is high compared to coating costs.
The industry segment with the highest share of coating material costs is SIC 3633,Household Laundry Equipment. In 1997 the cost of coatings are almost 3 percent of the totalcost of materials Although this cost share is small in absolute terms, it is much larger incomparison to the cost shares for the other large appliance industry segments. This perhapsis due to the quality of the coatings used for these large appliances. Because washingmachines are exposed to water and dryers are exposed to extreme heat during operation, thecorrosion resistance of the coatings used for this equipment must be resilient. The only otherindustry segment with a coating cost share approaching this magnitude is HouseholdCooking Equipment (SIC 3631). Since ovens, microwaves, and ranges are also exposed tohigh temperatures when they are in use, they also require high quality coatings. In 1997, thecost of coatings were equal to just over 2 percent of the total cost of materials.

September 22, 2000 FINAL
Table 2-2. Cost of Materials Consumed by Large Appliance Industry Segment: 1992and 1997 ($106)
SIC Code/Description 1992 1997
SIC 3585 - Refrigeration and Heating Equipment
Coating Material Costa $55.0 $73.76
Total Material Cost $10,341.2 $15,404.59
Coatings as a Percentage of Total Materials 0.53% 0.48%
Value of Product Shipments $18,072.2 $26,172.57
Coatings as a Percentage of Product Shipments 0.30% 0.28%
SIC 3589 - Service Industry Machinery (n.e.c.)
Coating Material Cost NA NA
Total Material Cost $2,388.3 $4,311.86
Coatings as a Percentage of Total Materials NA NA
Value of Product Shipments $5,057.2 $8,801.67
Coatings as a Percentage of Product Shipments NA NA
SIC 3631 - Household Cooking Equipment
Coating Material Cost $27.8 $40.79
Total Material Cost $1,811.7 $1,754.60
Coatings as a Percentage of Total Materials 1.53% 2.32%
Value of Product Shipments $3,006.8 $3,606.92
Coatings as a Percentage of Product Shipments 0.92% 1.13%

September 22, 2000 FINAL
Table 2-2. Cost of Materials Consumed by Large Appliance Industry Segment: 1992and 1997 ($106) continued
SIC Code/Description 1992 1997
SIC 3632 - Household Refrigerators and Freezers
Coating Material Cost $29.1 $30.90
Total Material Cost $2,596.6 $2,896.73
Coatings as a Percentage of Total Materials 1.12% 1.07%
Value of Product Shipments $4,047.6 $4,775.24
Coatings as a Percentage of Product Shipments 0.72% 0.65%
SIC 3633 - Household Laundry Equipment
Coating Material Cost $46.3 $57.17
Total Material Cost $1,721.2 $2,081.23
Coatings as a Percentage of Total Materials 2.69% 2.75%
Value of Product Shipments $2,995.0 $3,586.85
Coatings as a Percentage of Product Shipments 1.55% 1.59%
SIC 3639 - Household Appliances (n.e.c.)b
Coating Material Cost $16.7 $24.75
Total Material Cost $1,954.5 $2,642.6
Coatings as a Percentage of Total Materials 0.85% 0.94%
Value of Product Shipments $2,278.8 $5,247.5
Coatings as a Percentage of Product Shipments 0.73% 0.47%
Notes: aCoating materials include paints, varnishes, shellacs, enamels, and lacquers.bThe 1997 cost information for SIC 3639 does not include information on Household Sewing Machines due to the lack of available data.NA means data not available.
Source: U.S. Department of Commerce, Bureau of the Census. 1992 Census of Manufactures: Industry Series for Service Industry Machines and Household Appliances.U.S. Department of Commerce, Bureau of the Census. 1997 Economic Census: ManufacturingIndustry Series for Commercial Refrigerator and Heating Equipment, Motor Vehicle AirConditioning, Household Cooking Appliances, Household Refrigerators and Freezers,Household Laundry Equipment, and Other Household Appliances.

September 22, 2000 FINAL
2.2 Uses, Consumers, and Substitutes
Large appliances are generally purchased by three major groups of consumers:
� households,
� the construction industry, and
� the food service industry.
Households purchase a variety of items such as ovens, refrigerators, microwaves,dishwashers, laundry machines, clothes dryers, and heating and cooling units, to operate intheir homes. Some or all of these large appliances were once considered luxury items, butnow they are common in most homes. They simplify the tasks of cooking and cleaning andthey make homes more comfortable places to live. When individuals or businesses in theconstruction industry purchase large appliances, they do so to include them in theconstruction of new homes and buildings. It is more cost-effective for contractors andconstruction companies to build homes with these large appliances in place because it ismore difficult for the owners to install them after the structures have been built. Theseappliances may be customized to fit the decor or space dimensions of the planned structure.
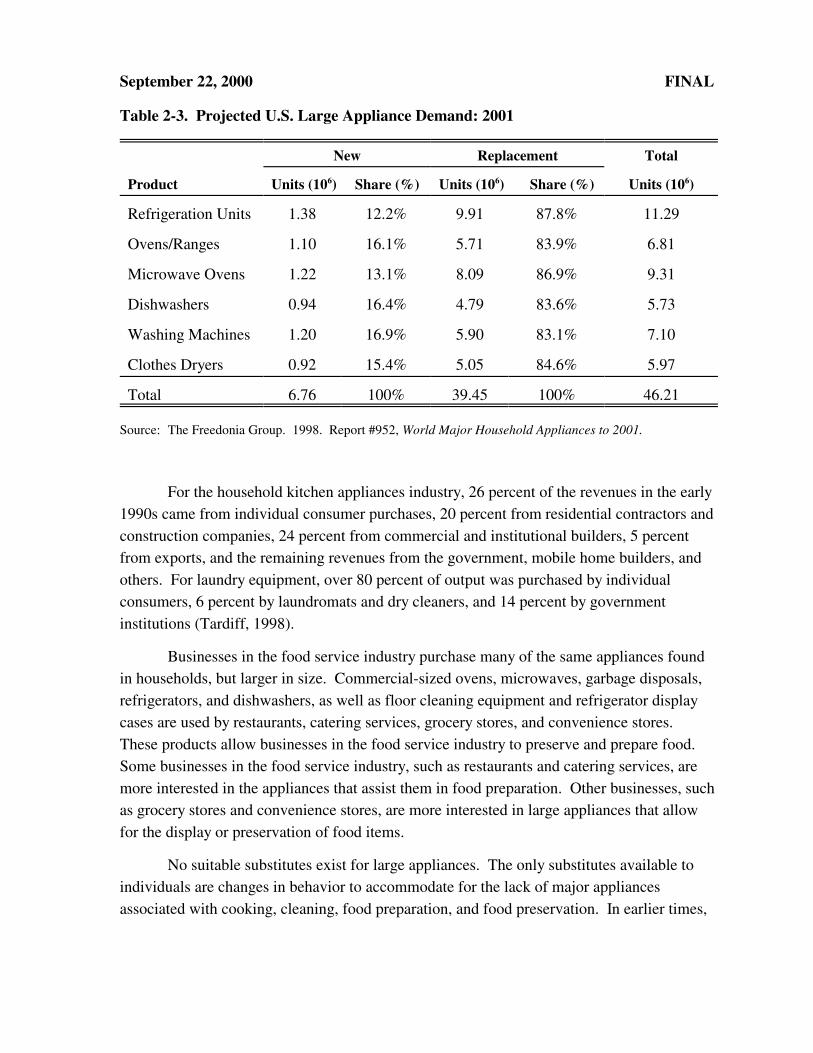
Based on The Freedonia Group (1998), Table 2-3 shows the projected demand formajor appliances in 2001 with a breakdown of appliances purchased for the first time (new)and those purchased to replace an old appliance (replacement). As shown, a majority of thedemand for large appliances is made up by consumers who are replacing existing large homeappliances. The demand for replacements stems from either the worn condition of existinglarge appliances or from the desire to upgrade to higher quality large appliances. First timepurchases of major appliances are mainly made by contractors who acquire these products toinstall in new buildings. While there are households that do purchase large applianceswithout ever having owned them before, most individuals purchase homes with theseproducts pre-installed (either new or existing).
September 22, 2000 FINAL
Table 2-3. Projected U.S. Large Appliance Demand: 2001
New Replacement Total
Product Units (106) Share (%) Units (106) Share (%) Units (106)
Refrigeration Units 1.38 12.2% 9.91 87.8% 11.29
Ovens/Ranges 1.10 16.1% 5.71 83.9% 6.81
Microwave Ovens 1.22 13.1% 8.09 86.9% 9.31
Dishwashers 0.94 16.4% 4.79 83.6% 5.73
Washing Machines 1.20 16.9% 5.90 83.1% 7.10
Clothes Dryers 0.92 15.4% 5.05 84.6% 5.97
Total 6.76 100% 39.45 100% 46.21
Source: The Freedonia Group. 1998. Report #952, World Major Household Appliances to 2001.
For the household kitchen appliances industry, 26 percent of the revenues in the early1990s came from individual consumer purchases, 20 percent from residential contractors andconstruction companies, 24 percent from commercial and institutional builders, 5 percentfrom exports, and the remaining revenues from the government, mobile home builders, andothers. For laundry equipment, over 80 percent of output was purchased by individualconsumers, 6 percent by laundromats and dry cleaners, and 14 percent by governmentinstitutions (Tardiff, 1998).
Businesses in the food service industry purchase many of the same appliances foundin households, but larger in size. Commercial-sized ovens, microwaves, garbage disposals,refrigerators, and dishwashers, as well as floor cleaning equipment and refrigerator displaycases are used by restaurants, catering services, grocery stores, and convenience stores. These products allow businesses in the food service industry to preserve and prepare food. Some businesses in the food service industry, such as restaurants and catering services, aremore interested in the appliances that assist them in food preparation. Other businesses, suchas grocery stores and convenience stores, are more interested in large appliances that allowfor the display or preservation of food items.
No suitable substitutes exist for large appliances. The only substitutes available toindividuals are changes in behavior to accommodate for the lack of major appliancesassociated with cooking, cleaning, food preparation, and food preservation. In earlier times,

September 22, 2000 FINAL
major appliances were not available. Individuals in households would perform morehousework by hand, e.g., laundry would be hand-washed and air-dried, dishes would washedby hand, food would be preserved using salts, and food preparation would rely on fire ratherthan stoves and ovens. Large appliances were invented to alleviate the burden of performingthese tasks in a rudimentary manner. Over time, individuals have come to rely uponrefrigerators, ovens, dishwashers, and laundry machines because they enable them tocomplete household tasks more effectively and in less time (i.e., improve quality of life).
2.3 Affected Producers
This section presents information about the market structure of the large appliancesindustry. This includes descriptions of the types of manufacturing facilities in the industryand the companies that own these facilities. Also included are example of large appliancemanufacturing firms and their market shares in different segments of the appliance market.
2.3.1 Market Structure
Market structure is of interest because it determines the behavior of producers andconsumers in the industry. In perfectly competitive industries, no producer or consumer isable to influence the price of the product sold. In addition, producers are unable to affect theprice of inputs purchased for use in production. This condition most likely holds if theindustry has a large number of buyers and sellers, the products sold and inputs used inproduction are homogeneous, and entry and exit of firms is unrestricted. Entry and exit offirms are unrestricted for most industries, except in cases where the government regulateswho is able to produce output, where one firm holds a patent on a product, where one firmowns the entire stock of a critical input, or where a single firm is able to supply the entiremarket. In industries that are not perfectly competitive, producer and/or consumer behaviorcan have an effect on price.
Concentration ratios (CRs) and Herfindahl-Hirschman indices (HHIs) can providesome insight into the competitiveness of an industry. The U.S. Department of Commercereports these ratios and indices for the four-digit SIC code level for 1992, the most recentyear available. Table 2-4 provides the value of shipments, the four- and eight-firmconcentration ratios, and the Herfindahl-Hirschman indices that have been calculated byfour-digit SIC code. From an examination of these concentration ratios, it is evident that theindustries involved in the manufacture of large household appliances are more concentratedthan the industries producing Service Machinery (SIC 3589) and Refrigeration and HeatingEquipment (SIC 3585). Of the large household appliance industries, HouseholdRefrigerators and Freezers (SIC 3632) and Household Laundry Equipment (SIC 3633) are

September 22, 2000 FINAL
1This means that the four largest firms in the Household Refrigerators and Freezers industry control 82percent of the market and that the four largest firms in the Household Laundry Equipment industry control 94percent of the industry.
Table 2-4. Market Concentration Measures for the Large Appliances Industries: 1992
SIC Code/DescriptionValue of
Shipments ($106) CR4 CR8 HHI
3585 - Refrigeration and Heating Equipment $19,697.0 35% 51% 410
3589 - Service Industry Machinery $5,344.6 14% 23% 102
3631 - Household Cooking Equipment $2,950.0 60% 81% 1214
3632 - Household Refrigerators and Freezers $4,232.4 82% 100% 1891
3633 - Household Laundry Equipment $3,328.50 94% NA NA
3639 - Other Household Appliances $3,169.10 70% 91% 1750
Notes: NA means data not available.Source: U.S. Department of Commerce, Bureau of the Census. 1992 Census of Manufactures: Industry
Series for Service Industry Machines and Household Appliances.U.S. Department of Commerce, Bureau of the Census. 1999. Concentration Ratios inManufacturing.
the most concentrated with CR4s of 82 and 94 percent, respectively1. The Service IndustryMachinery industry (SIC 3589) is the least concentrated industry segment with a CR4 of only14 percent and a CR8 of 23 percent.
The criteria for evaluating the HHIs are based on the 1992 Department of Justice’sHorizontal Merger Guidelines. According to these criteria, industries with HHIs below1,000 are considered unconcentrated (i.e., more competitive), those with HHIs between1,000 and 1,800 are considered moderately concentrated (i.e., moderately competitive), andthose with HHIs above 1,800 are considered highly concentrated (i.e., less competitive). Ingeneral, firms in less concentrated industries are more likely to be price takers, while those inmore concentrated industries have more ability to influence market prices. Based on thesecriteria, the Refrigeration and Heating Equipment industry (SIC 3585) and the ServiceIndustry Machinery industry (SIC 3589) are unconcentrated while the large householdappliance industries (SICs 3631, 3632, and 3639) are more concentrated. Of the industriesfor which HHI data are available, the most concentrated industry is SIC 3632, the HouseholdRefrigerators and Freezers industry. By the Horizontal Merger Guidelines, it is considered
September 22, 2000 FINAL
highly concentrated. The HHI data supports the conclusions drawn from the concentrationratio data.
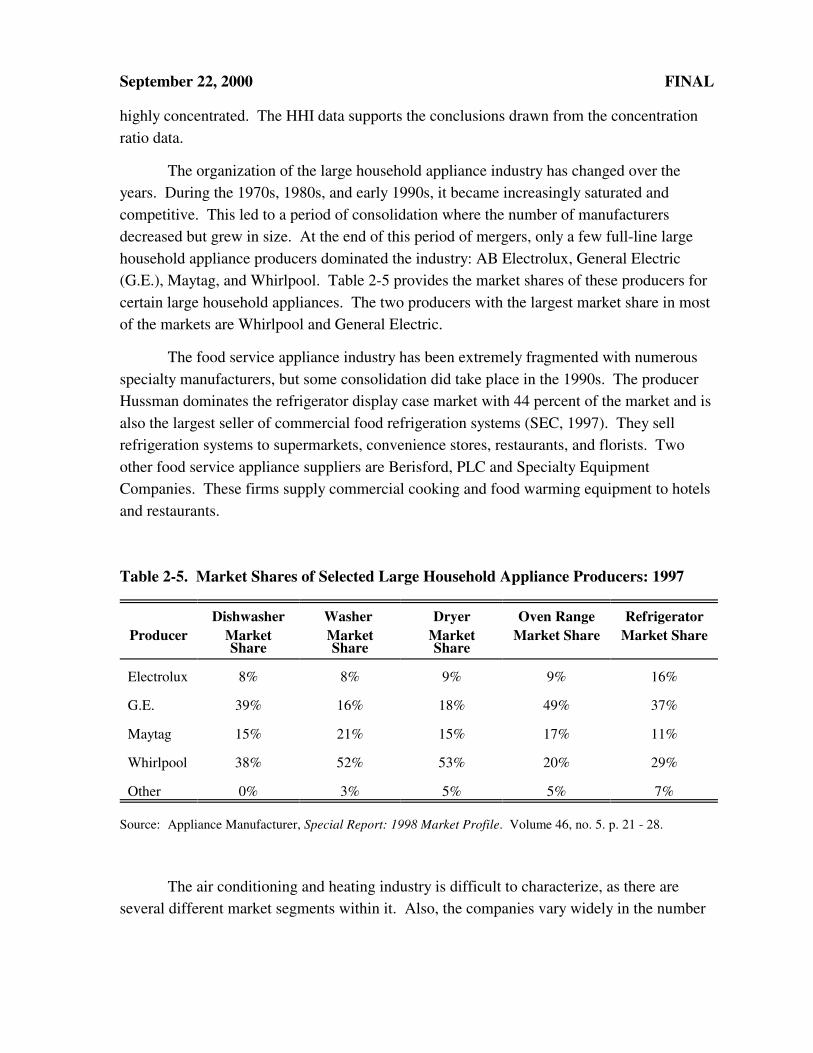
The organization of the large household appliance industry has changed over theyears. During the 1970s, 1980s, and early 1990s, it became increasingly saturated andcompetitive. This led to a period of consolidation where the number of manufacturersdecreased but grew in size. At the end of this period of mergers, only a few full-line largehousehold appliance producers dominated the industry: AB Electrolux, General Electric(G.E.), Maytag, and Whirlpool. Table 2-5 provides the market shares of these producers forcertain large household appliances. The two producers with the largest market share in mostof the markets are Whirlpool and General Electric.
The food service appliance industry has been extremely fragmented with numerousspecialty manufacturers, but some consolidation did take place in the 1990s. The producerHussman dominates the refrigerator display case market with 44 percent of the market and isalso the largest seller of commercial food refrigeration systems (SEC, 1997). They sellrefrigeration systems to supermarkets, convenience stores, restaurants, and florists. Twoother food service appliance suppliers are Berisford, PLC and Specialty EquipmentCompanies. These firms supply commercial cooking and food warming equipment to hotelsand restaurants.
Table 2-5. Market Shares of Selected Large Household Appliance Producers: 1997
ProducerDishwasher
MarketShare
Washer MarketShare
DryerMarketShare
Oven RangeMarket Share
RefrigeratorMarket Share
Electrolux 8% 8% 9% 9% 16%
G.E. 39% 16% 18% 49% 37%
Maytag 15% 21% 15% 17% 11%
Whirlpool 38% 52% 53% 20% 29%
Other 0% 3% 5% 5% 7%
Source: Appliance Manufacturer, Special Report: 1998 Market Profile. Volume 46, no. 5. p. 21 - 28.
The air conditioning and heating industry is difficult to characterize, as there areseveral different market segments within it. Also, the companies vary widely in the number
September 22, 2000 FINAL
and type of markets in which they participate. The industry as a whole is not veryconcentrated, but certain market segments within the industry may be served by only a fewsuppliers. The air conditioning market segment is quite competitive with no single firmpossessing more than 14 percent of the market share. The largest heating and air-conditioning producer is United Technologies, through its subsidiary Carrier. The companyalso produces ventilating and refrigeration equipment. In the 1940s, Carrier had a 90 percentshare of the heating and air-conditioning market; however this fell to a 37 percent share andsince has continued to decline. The dehumidifier market is primarily served by twosuppliers, Electrolux and Whirlpool, which continue to account for 60 percent of this market(Tardiff, 1998).
2.3.2 Manufacturing Facilities
Based on responses to the Section 114 letters, the Agency identified 221 facilitieswithin this source category, of which, 74 facilities (or 33.5 percent) are projected to be majorsources subject to the MACT standard and its associated costs. The survey responsesidentified two types of producers: integrated coaters and non-integrated coaters. Integratedcoaters produce large appliances and then perform their own coating operations after thelarge appliances have been manufactured. Non-integrated coaters manufacture largeappliances using pre-coated metal. From the survey, almost all large appliancemanufacturers were identified as integrated coaters. Most choose this production methodbecause the quality of the large appliances improves if the they are coated aftermanufacturing and assembly occurs.
Large appliance manufacturing facilities are located nationwide; however, there is amuch larger concentration in the eastern half of the country. The states along the West Coasthave some large appliance facilities, but nowhere near as many in comparison to theMidwest and the Southeast. In fact, only 36 facilities (16 percent) operate west of KansasCity. As shown in Figure 8-1, the states with the largest number of facilities are Ohio with18, Tennessee with 16, Illinois with 15, Texas with 14, and Wisconsin with 13.
Facility size can be measured by the number of employees working in the facilities. Figure 8-2 shows the distribution of the potentially affected large appliance facilities by thenumber of employees. Of the 207 facilities reporting employment data, almost 50 percenthave between 100 and 499 employees and 38 percent have more than 500 employees. Therefore, this figure illustrates that large appliance facilities tend to be larger in order toaccommodate the manufacturing, assembling, and coating operations required to producelarge appliances. Most producers require at least 100 employees to carry out the multiplestages required for large appliance production.

September 22, 2000 FINAL
Number of Facilities1 - 56 - 1011 - 20
3
13171 1
71
3
8
56
1815 13
71 68
2 5916
14
5610
87
1
4
4�
1�
1�
3�
6
�
1
The distribution of coating operation employees across facilities can also beexamined. Figure 8-3 shows the distribution of the potentially affected facilities by thenumber of employees working on coating operations. Of the 166 facilities reporting coatingoperations employment, almost 55 percent have fewer than 10 coating line employees andalmost 89 percent have less than 50 coating line employees. This figure illustrates thatcoating operations do not require a large share of total large appliance facility employment. Most facilities conduct their coating operations with a small number of employees, possiblyindicating that coating operations are relatively capital intensive. Only the largest facilitiesthat manufacture a large number of appliances use more than 100 employees solely forcoating operations.

September 22, 2000 FINAL
0
20
40
60
80
100
120
1 - 19 20 - 99 100 - 499 500 and greate r
N um ber o f Em ployees
Num
ber
of F
acil
itie
s
0
2 0
4 0
6 0
8 0
1 0 0
0 - 9 1 0 - 4 9 5 0 - 9 9 1 0 0 a n d g r e a t e r
N u m b e r o f E m p l o y e e s
Nu
mb
er o
f F
acili
ties
Figure 2-1. Location of Large Appliance Facilities By State
Figure 8-2. Employment Distribution of Large Appliance Coating Facilities: 1997
Source: U.S. EPA. 1998. Preliminary Industry Characterization of Large Appliance Surface Coating SourceCategory. Office of Air Quality Planning and Standards. EPA-450/3-80-037.

September 22, 2000 FINAL
Figure 8-3. Employment Distribution of Coating Operations in Large Appliance Facilities: 1997
Source: U.S. EPA. 1998. Preliminary Industry Characterization of Large Appliance Surface Coating SourceCategory. Office of Air Quality Planning and Standards. EPA-450/3-80-037
2.3.3 Companies
The Agency identified 84 ultimate parent companies within the large appliancecoating source category and obtained their sales and employment data from either theirsurvey response or one of the following secondary sources:
� Dun and Bradstreet Market Identifiers (Dun & Bradstreet, 1999)
� Hoover’s Company Profiles (Hoover’s, Incorporated, 1999)
� Company Websites.
Appendix A provides a listing of these 84 companies that own and operate the 221 facilitieswithin this source category.
Annual sales data was available for 83 of the companies (99 percent) and annualemployment data was available for 74 of the companies (88 percent). The average (median)annual sales of companies reporting data were $2.5 billion ($155.9 million). This includesrevenues from operations other than large appliance manufacturing. The average (median)employment for these companies was 14,487 employees (1,481 employees). The top fourcompanies in annual sales are:
� General Electric Company – $88.5 billion with 276,000 employees,
� United Technologies Corporation – $24.5 billion with 180,100 employees,
� AB Electrolux – $14.5 billion with 99,322 employees, and
� Emerson Electric – $13.4 billion with 111,800 employees.
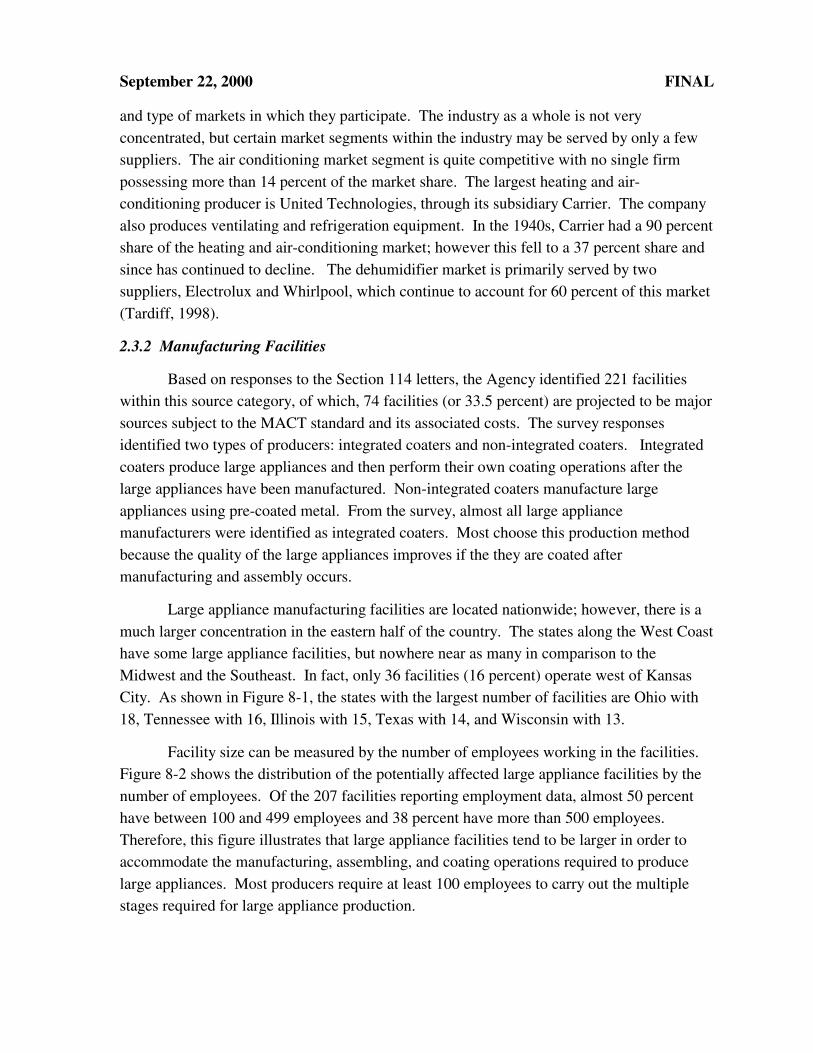
Large appliance manufacturing companies can be grouped into small and large categories using Small Business Administration (SBA) general size standard definitions by
September 22, 2000 FINAL
L arge59%
S m all41%
SIC codes. For most SIC codes, the size standard is based on the number of employees butin some cases, the size standard is based on the annual sales of the company. Although
Figure 2-5. Distribution of Owning Companies by Size:1997
responses by large appliance facilities to the industry survey indicated six different SICcodes, there are twenty-four different SIC codes across the ultimate parent companiesowning these facilities. For these SIC codes, the small business definition ranges are 100 to1,000 employees and $5 million in annual sales. Using these guidelines and available data,the Agency has identified 34 small businesses, or 40.5 percent of all companies within thissource category. Figure 2-5 provides a breakdown of the large and small businesses.
For 1997, the annual average (median) sales for the small companies was $164.6million ($19.9 million) and the average (median) employment was 183 employees (120employees). For large companies, the annual average (median) sales was $4.1 billion ($799million) and the average (median) employment was 21,320 employees (3,750 employees). Small companies owned and operated 38 large appliance facilities, or only 17.2 percent of

September 22, 2000 FINAL
the total within this source category. This reflects an average of 1.1 facility per company. Alternatively, the 50 large companies owned and operated 183 large appliance facilities, or82.8 percent, with an average of 3.66 facilities per company.
Based on survey responses, Table 2-6 provides descriptive statistics for largeappliance manufacturing facilities and their coating operations by ownership size. Asexpected, the average facility and coating operations employment levels are greater for largecompanies. The average number of employees in facilities owned by large companies is 730,while it is only 165 for small companies. For coating operations, facilities owned by largecompanies have an average of 33 employees, while the facilities owned by small companieshave an average of 13 employees.
Table 2-6. Summary of Large Appliance Facility and Coating Operations EmploymentData by Ownership Size: 1997
Employment in
DescriptiveStatistics
Small Large Companies Companies All Facilities
Facilities
Average 165 730 637
Median 134 400 330
Minimum 11 22 11
Maximum 450 5,500 5,500
Coating Operations
Average 13 33 29
Median 6 10 10
Minimum 1 1 1
Maximum 107 600 600
Notes: aOf the 221 large appliance facilities, 207 reported facility employment data. Of those reporting employment data, 38 facilities are owned by small companies and 169 are owned by large companies.bOf the 221 large appliance facilities, 166 reported coating operations employment data. Of thosereporting coating operation employment data 27 facilities are owned by small companies and 139are owned by large companies.
September 22, 2000 FINAL
Facilities owned by small companies may dedicate a smaller absolute number ofemployees to their coating lines, but the share of coating line employees to facilityemployees is higher than it is for large companies. Large companies dedicate an average of4.5 percent of their employees to work on the coating lines, while small companies have 7.8percent of their employees coating large appliances.
2.4 Market Data and Industry Trends
This section presents historical market data, including foreign trade and market pricesfor large appliances by the major industry segments. Historical market data include U.S.production, foreign trade, and apparent consumption of large appliances across the industrysegments for the years 1993 through 1997. The importance of foreign trade is measured byconcentration ratios, i.e., the relation of exports to U.S. production and the relativeimportance of imports to U.S. apparent consumption. Lastly, this section presents thequantities, values, and market prices for large appliances by industry segment, as representedby SIC codes.
2.4.1 U.S. Production and Apparent Consumption
The U.S. production, exports, imports, and apparent consumption of large appliancesare presented by industry segment in this section. Table 2-7 presents historical data onproduction, foreign trade, and apparent consumption, while Table 2-8 presents the averageannual growth rates of these measures for the large household appliances industry. Asshown, the value of U.S. production and apparent consumption for the household applianceindustry segments generally increased over the time period examined, with the exception ofhousehold laundry equipment.
During the early 1990s, growth of the large household appliance market had sloweddue to consolidation and fewer opportunities for companies to expand. However, a reductionin interest rates in 1992 led to an increase in home building. It continued to rise through1997 in response to a strong U.S. economy and high levels of consumer spending andconstruction activity. New large household appliances were purchased by constructioncompanies and contractors so they could be installed into the homes they built. Consumerexpenditures also rose during this time period and with it came a surge in home remodeling(Tardiff, 1998). As home owners remodeled, they often upgraded their large householdappliances. This led to increased demand for both new and replacement householdappliances during the 1990s. The largest increases in the value of production from 1993 to1997 were for Household Refrigerators and Freezers (SIC 3632) and Other HouseholdAppliances (SIC 3639). The average annual growth rates, discussed next and displayed in
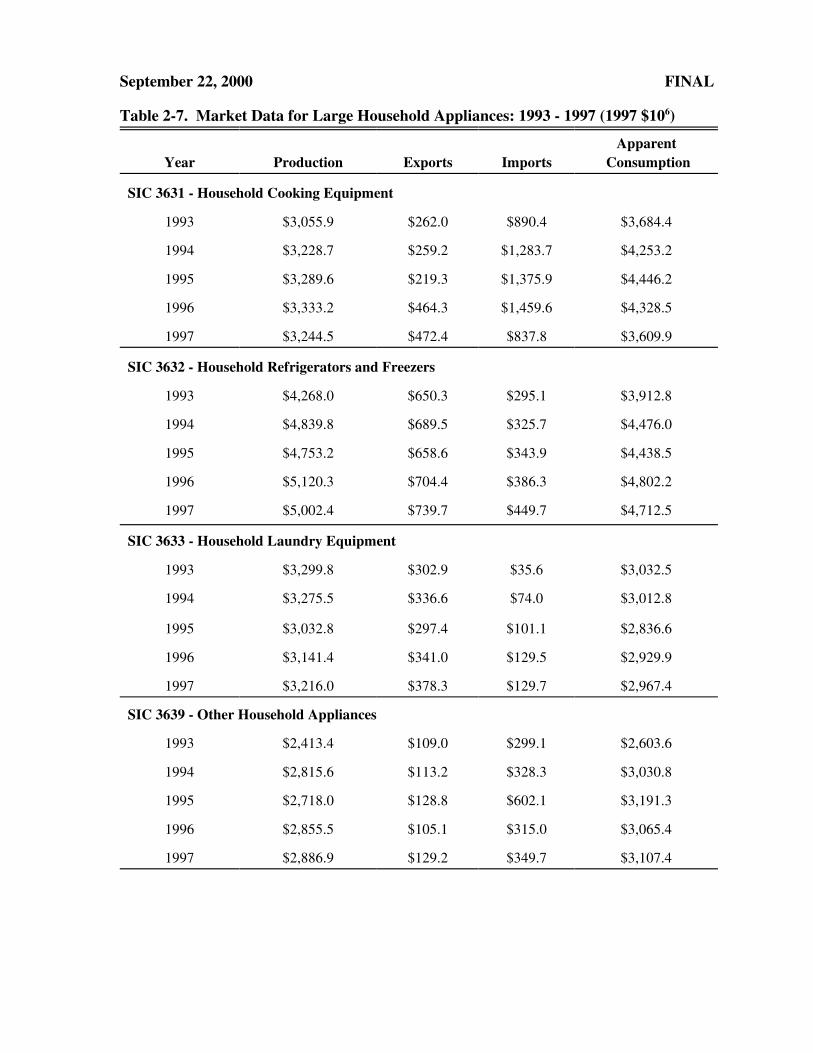
September 22, 2000 FINAL
Table 2-7. Market Data for Large Household Appliances: 1993 - 1997 (1997 $106)
Year Production Exports ImportsApparent
Consumption
SIC 3631 - Household Cooking Equipment
1993 $3,055.9 $262.0 $890.4 $3,684.4
1994 $3,228.7 $259.2 $1,283.7 $4,253.2
1995 $3,289.6 $219.3 $1,375.9 $4,446.2
1996 $3,333.2 $464.3 $1,459.6 $4,328.5
1997 $3,244.5 $472.4 $837.8 $3,609.9
SIC 3632 - Household Refrigerators and Freezers
1993 $4,268.0 $650.3 $295.1 $3,912.8
1994 $4,839.8 $689.5 $325.7 $4,476.0
1995 $4,753.2 $658.6 $343.9 $4,438.5
1996 $5,120.3 $704.4 $386.3 $4,802.2
1997 $5,002.4 $739.7 $449.7 $4,712.5
SIC 3633 - Household Laundry Equipment
1993 $3,299.8 $302.9 $35.6 $3,032.5
1994 $3,275.5 $336.6 $74.0 $3,012.8
1995 $3,032.8 $297.4 $101.1 $2,836.6
1996 $3,141.4 $341.0 $129.5 $2,929.9
1997 $3,216.0 $378.3 $129.7 $2,967.4
SIC 3639 - Other Household Appliances
1993 $2,413.4 $109.0 $299.1 $2,603.6
1994 $2,815.6 $113.2 $328.3 $3,030.8
1995 $2,718.0 $128.8 $602.1 $3,191.3
1996 $2,855.5 $105.1 $315.0 $3,065.4
1997 $2,886.9 $129.2 $349.7 $3,107.4

September 22, 2000 FINAL
Table 2-7. Market Data for Large Household Appliances: 1993 - 1997 (1997 $106)continued
Year Production Exports ImportsApparent
Consumption
All Household Appliances
1993 $13,037.1 $1,324.2 $1,520.2 $13,233.1
1994 $14,159.6 $1,398.5 $2,011.7 $14,772.8
1995 $13,793.6 $1,304.1 $2,423.0 $14,912.5
1996 $14,450.4 $1,614.8 $2,290.4 $15,126.0
1997 $14,349.8 $1,719.6 $1,766.9 $14,397.1
Source: U.S. Department of Commerce, Bureau of the Census. 1993 - 97. Current Industrial Reports: Major Household Appliances and Refrigeration, Air Conditioning, and Warm Air Heating Equipment.
Table 2-8, confirms these increases in production value for these segments of largehousehold appliances.
Overall, the average annual growth rates for production and consumption areextremely similar within each SIC code, as shown in Table 2-8. The similarities in thegrowth rates for production and consumption, along with the relatively low quantities ofexports and imports, implies that many of the large household appliances produced in theU.S. were consumed in the U.S. The average annual growth rates for imports and exportswere also calculated and are displayed in Table 2-8. These rates look large relative to thegrowth rates calculated for production and apparent consumption, but in actuality, the overallvalue of foreign trade is quite low in comparison to the value of production and apparentconsumption. In other words, the absolute values of exports and imports are small, thereforefluctuations in their values translates into large changes in annual growth rates. As the nextsection on foreign trade measures will show, neither exports nor imports of large appliancesis large relative to the production and consumption of U.S. produced large appliances.
Table 2-9 displays the market data associated with the commercial refrigeration andheating equipment industry. The average value of production in this industry is $18.6 billionand the average annual growth rate of production is 7.2 percent. This average growth rate ismuch higher than the rate of 2.5 percent for all large household appliances.

September 22, 2000 FINAL
Table 2-8. Average Annual Growth Rates for Large Household Appliances by Industry Segment: 1993 - 1997
SIC Code Production Exports ImportsApparent
Consumption
3631 1.55% 24.25% 3.71% 0.18%
3632 4.26% 3.38% 11.17% 4.97%
3633 -0.55% 6.27% 43.18% -0.48%
3639 4.84% 5.54% 14.12% 4.78%
All SICs 2.52% 7.29% 6.11% 2.30%Source: U.S. Department of Commerce, Bureau of the Census. 1993 - 97. Current Industrial Reports: Major
Household Appliances and Refrigeration, Air Conditioning, and Warm Air Heating Equipment.
Table 2-9. Market Data and Growth Rates for Commercial Refrigeration and Heating Equipment (SIC 3585): 1993 - 1997 (1997 $106)
Year Production Exports ImportsApparent
Consumption
1993 $15,333.2 $1,733.4 $1,185.0 $14,784.8
1994 $18,176.3 $1,292.7 $1,172.5 $18,056.2
1995 $18,998.6 $1,576.7 $1,252.8 $18,674.8
1996 $20,640.4 $1,458.1 $1,245.9 $20,428.2
1997 $20,013.4 $1,538.4 $1,198.7 $19,673.7
Average Annual Growth Rates
1993 - 1997 7.2% -1.4% 0.4% 7.8%Source: U.S. Department of Commerce, Bureau of the Census. 1993 - 97. Current Industrial Reports, Major
Household Appliances and Refrigeration, Air Conditioning, and Warm Air Heating Equipment.
While the average annual growth rate of household appliance production is lower than it isfor commercial refrigeration and heating equipment production, the export and import datareveal a higher degree of international trade in the large household appliance market. Thevalues of exports are similar in the two industry segments, but the value of production ishigher in the commercial refrigeration and heating equipment market. Exports thereforerepresent a larger share of large household appliance production than they do of commercial

September 22, 2000 FINAL
refrigeration and heating equipment. A similar conclusion can be drawn from anexamination of import values. A comparison of the value of imports across industrysegments reveals that the average import value is higher in the household appliance market. This means that U.S. demand for foreign household appliances is higher than that of therefrigeration and heating equipment industry.
Table 2-10 provides market data on the service industry machinery segment of thelarge appliances industry. It is the smallest segment of the entire large appliances industry,with an average value of production equal to $6.8 billion. The values of production are thelowest of the three large appliance industry segments, however, this segment has the largestaverage annual growth rate for both production and apparent consumption. The averageannual growth rate of the value of production for the service machinery market is 8 percent.
Table 2-10. Market Data and Growth Rates for Service Industry Machinery (SIC 3589): 1993 - 1997 (1997 $106)
Year Production Exports ImportsApparent
Consumption
1993 $6,065.1 $179.4 $127.7 $6,013.4
1994 $6,422.8 $195.2 $129.6 $6,357.1
1995 $7,068.4 $241.4 $131.8 $6,958.9
1996 $7,641.3 $287.0 $157.5 $7,511.8
1997 NA $309.0 $172.2 NA
Annual Average Growth Rates
1993 - 1997 8.0% 14.7% 8.0% 7.7%Notes: NA means data not available. Source: U.S. Department of Commerce, Bureau of the Census. 1993 - 97. Current Industrial Reports, Major
Household Appliances and Refrigeration, Air Conditioning, and Warm Air Heating Equipment.U.S. Department of Commerce, Bureau of the Census. 1993 - 96. Annual Survey of Manufactures.
2.4.2 Foreign Trade
Average foreign trade concentration ratios can be examined by industry segment andSIC code to determine the share of U.S. large appliance production sold abroad and the shareof U.S. consumption supplied from abroad. Table 2-11 shows a higher degree ofinternational trade occurred in the large household appliances market while very little

September 22, 2000 FINAL
occurred in the service industry machinery market. While some of the large householdappliances produced in the U.S. were exported, very little domestically produced serviceindustry machinery went to supply the foreign large appliance market. Examination of theimport side from the U.S. perspective shows that consumption of certain householdappliances, such as cooking equipment and other household appliances, relied heavily onforeign supply. Consumption of service industry machinery, however, relied mainly ondomestically produced products.
Table 2-11. Average Foreign Trade Concentration Ratios by SIC Code: 1993 - 1997
Description/SIC CodeExports as a Share of
U.S. ProductionImports as a Share of
U.S. Apparent Consumption
Large Household Appliances 11.98% 12.27%
Household Cooking Equipment (SIC 3631) 10.35% 28.44%
Service Industry Machinery (SIC 3632) 14.38% 8.03%
Household Laundry Equipment (SIC 3633) 10.38% 3.20%
Other Household Appliances (SIC 3639) 4.29% 12.54%
Commercial Refrigeration and Heating Equipment (SIC 3585)
8.29% 6.68%
Service Machinery (SIC 3589) 3.30% 2.04%
Source: U.S. Department of Commerce, Bureau of the Census. 1993 - 97. Current Industrial Reports, Major Household Appliances and Refrigeration, Air Conditioning, and Warm Air Heating Equipment.U.S. Department of Commerce, Bureau of the Census. 1993 - 96. Annual Survey of Manufactures.
Between these two extremes is the commercial refrigeration and heating market. Commercial refrigeration and heating equipment was imported and exported more thanservice industry machinery, but the foreign trade concentration ratios for this market showthat there was not a heavy reliance on international trade. Exports of commercialrefrigeration and heating equipment were a larger share of U.S. production (8.3 percent) thanimports were of apparent U.S. consumption (6.7 percent).
Within the household appliances industry, exports as a share of U.S. production rangebetween 10 and 14 percent for cooking equipment, service industry machinery, and laundryequipment. The exported share of other household appliances was much smaller atapproximately 4.3 percent. What stands out about the foreign trade of large household

September 22, 2000 FINAL
appliances is the share of cooking equipment consumed in the U.S. from abroad. Over 28percent of household cooking equipment consumed here was imported. The U.S. thereforerelies heavily on the foreign supply of cooking equipment. In contrast, the consumption ofhousehold laundry equipment does not rely on as heavily on foreign supply, since only 3.2percent consumed was from abroad.
2.4.3 Market Prices
Using quantity and value of shipments data from the U.S. Department of Commerce,unit prices by large appliance industry segment can be calculated. Table 2-12 shows themarket prices, which were derived by dividing the value of shipments by the number of unitsproduced. The price variations seem to be consistent with the product categories theyrepresent. Household refrigerators and freezers are the most expensive household appliancewith a price of $438 per unit, followed by household laundry equipment at $263 per unit, andhousehold cooking equipment at $178 per unit. Other household appliances have the lowestmarket price of all household appliances at $130 per unit. These tend to be smallerappliances, such as sewing machines and garbage disposal units. The products in theRefrigeration and Heating Equipment (SIC 3585) and Household Laundry Equipment (SIC3633) market segments have market prices around $250.

September 22, 2000 FINAL
Table 2-12. Quantity, Value of Shipments, and Market Prices by Large ApplianceIndustry Segment: 1997
Industry Segment/SIC CodeQuantity(106 units)
Value of Shipments ($106)
Market Prices ($/unit)
All Household Appliances 63.81 $14,205.5 $222.66
Household Cooking Equipment (SIC 3631)
18.24 $3,244.5 $177.88
Household Refrigerators and Freezers (SIC 3632)
11.09 $4,858.2 $437.98
Household Laundry Equipment (SIC 3633)
12.28 $3,216.0 $262.80
Other Household Appliances (SIC 3639)
22.20 $2,886.8 $130.04
Refrigeration and Heating Equipment(SIC 3585)
70.25 $17,517.0 $249.35
Service Industry Machinery (SIC 3639)
NA NA NA
Note: NA means data not available.Source: U.S. Department of Commerce, Bureau of the Census. 1997. Current Industrial Reports: Major
Household Appliances and Refrigeration, Air Conditioning, and Warm Air Heating Equipment.

September 22, 2000 FINAL
5 REFERENCES
Appliance Manufacturer. 1998. Market Trends Study. <http://www.ammagazine.com/trends_study.html>
Appliance Manufacturer. 1998. Special Report: 1998 Market Profile. 46(5): 21 - 28.
Dun & Bradstreet. 1999. Dun’s Market Identifiers [computer file]. New York, NY: DialogCorporation.
The Freedonia Group. 1998. Report #952, World Major Household Appliances to 2001.
Hoover’s Incorporated. 1999. Hoover’s Company Profiles [computer file]. Austin, TX:Hoover’s Incorporated. <http://www.hoovers.com/>.
Securities Exchange Commission. 1998. 10-K Reports. <http://www.sec.gov>
U.S. Environmental Protection Agency. 1980. Industrial Surface Coating: Appliances -Background Information for Proposed Standards. Emissions Standards Division,Office of Air Quality Planning and Standards. EPA-450/3-80-037.
U.S. Environmental Protection Agency. 1998. Preliminary Industry Characterization LargeAppliance Surface Coating Industry.
U.S. Department of Commerce, Bureau of the Census. 1993, 1994, 1995, and 1996. AnnualSurvey of Manufactures.
U.S. Department of Commerce, Bureau of the Census. 1993, 1994, 1995, 1996, and 1997.Current Industrial Reports. Major Household Appliances.
U.S. Department of Commerce, Bureau of the Census. 1993, 1994, 1995, 1996, and 1997.Current Industrial Reports. Refrigeration, Air Conditioning, and Warm Air HeatingEquipment.
U.S. Department of Commerce, Bureau of the Census. 1997 Economic Census:Manufacturing Industry Series for Commercial Refrigerator and Heating Equipment.
U.S. Department of Commerce, Bureau of the Census. 1997 Economic Census:Manufacturing Industry Series for Household Cooking Appliances.
U.S. Department of Commerce, Bureau of the Census. 1997 Economic Census:Manufacturing Industry Series for Household Laundry Equipment.
U.S. Department of Commerce, Bureau of the Census. 1997 Economic Census:Manufacturing Industry Series for Household Refrigerators and Freezers.
September 22, 2000 FINAL
U.S. Department of Commerce, Bureau of the Census. 1997 Economic Census:Manufacturing Industry Series for Motor Vehicle Air Conditioning.
U.S. Department of Commerce, Bureau of the Census. 1997 Economic Census:Manufacturing Industry Series for Other Household Appliances.
U.S. Department of Commerce, Bureau of the Census. 1997 Economic Census:Manufacturing Industry Series for Service Industry Machines.
U.S. Department of Commerce, Bureau of the Census. 1999. Concentration Ratios inManufacturing (for the year 1992).
Tardiff, Joseph C. 1998. U.S. Industry Profiles, The Leading 100, Gale Research.