THIS REPORT CONTAINS ASSESSMENTS OF ... GAIN Publications...THIS REPORT CONTAINS ASSESSMENTS OF...
12
THIS REPORT CONTAINS ASSESSMENTS OF COMMODITY AND TRADE ISSUES MADE BY USDA STAFF AND NOT NECESSARILY STATEMENTS OF OFFICIAL U.S. GOVERNMENT POLICY - Date: GAIN Report Number: Post: Report Categories: Approved By: Prepared By: Report Highlights: Lithuania is a net exporter of wood and wood products. In 2016 total trade of forest products between the U.S. and Lithuania increased by 40 percent in comparison with 2015, and reached U.S. $20 million. Wood sawn or chipped dominates in the value of products sourced from the United States to Lithuania. Veneer sheets sales take the second position in this regard. To some extent there is potential for U.S. hardwood exports as a niche raw material for Lithuanian wood processors, especially for the furniture industry. Mira Kobuszynska, Agricultural Specialist Russ Nicely, Agricultural Attaché Wood Products Forestry and Wood Products in Lithuania Warsaw Lithuania 2/28/2017 Public Voluntary
-
Upload
duongthien -
Category
Documents
-
view
219 -
download
0
Transcript of THIS REPORT CONTAINS ASSESSMENTS OF ... GAIN Publications...THIS REPORT CONTAINS ASSESSMENTS OF...

THIS REPORT CONTAINS ASSESSMENTS OF COMMODITY AND TRADE ISSUES MADE BY
USDA STAFF AND NOT NECESSARILY STATEMENTS OF OFFICIAL U.S. GOVERNMENT
POLICY
-
Date:
GAIN Report Number:
Post:
Report Categories:
Approved By:
Prepared By:
Report Highlights:
Lithuania is a net exporter of wood and wood products. In 2016 total trade of forest products between
the U.S. and Lithuania increased by 40 percent in comparison with 2015, and reached U.S. $20 million.
Wood sawn or chipped dominates in the value of products sourced from the United States to Lithuania.
Veneer sheets sales take the second position in this regard. To some extent there is potential for U.S.
hardwood exports as a niche raw material for Lithuanian wood processors, especially for the furniture
industry.
Mira Kobuszynska, Agricultural Specialist
Russ Nicely, Agricultural Attaché
Wood Products
Forestry and Wood Products in Lithuania
Warsaw
Lithuania
2/28/2017
Public Voluntary
Role of the forestry product sector in the economy
The forest industry is one of the most important sectors in the Lithuanian economy. Timber of softwood
species is a leading natural resource which creates a base for wood processing, mostly for the furniture
and paper industries in Lithuania. According to the UN FAO Global Forest Resources Assessment
(FRA), agricultural land covers more than 50 percent of Lithuania and forested land is about 33 percent
of total land area, with 2.2 million hectares. In 2014 the total growing wood stock volume reached 521
million cubic meters and on average 249 cubic meters per hectare.
Forests and wood product industries provide over 60,000 jobs in forestry and logging, wood
manufacturing and the paper and furniture industries. This is 6 percent of total employment in the
country. In 2013 the forest and wood processing sector’s share of total national value added reached 4.5
percent, with forestry adding about 0.6 percent. The biggest share of the value added in the sector was
generated by the furniture industry, some 2 percent. The number of companies in forestry, logging and
the forest industry diminished while their average size increased in recent years. The Lithuanian forest
and wood processing sector has over 2,000 operating companies as of 2014.
Timber Supply
In Lithuania over 60 percent of forested land belongs to the State, including 40 percent of forests of
State importance and 10 percent of State forests reserved for property restitution. Land reforms have not
been completed yet. Until October 2018, all forests reserved for restitution should be transferred to the
State forest enterprises or sold in auctions. According to the Committee on Forests and the Forest
Industry, (UNECE) if forest management activities would be restored in these forests, it would increase
the wood supply by up to 10 percent. 40 percent of total forested area is owned by private individuals
and companies. Privately held forests are small in size, about 3.4 hectares on average. Currently there
are 250,000 private owners which own forest land totaling 858,000 hectares in Lithuania. Lithuania is
situated within the so-called mixed forest belt with a high percentage of broadleaves and mixed conifer-
broadleaves stands. The most common stands of timber are pine (33.2% of the total area of stands),
birch (21.1%), spruce (19.7%), black alder (6.5%) and grey alder (5.9%), aspen (3.6%) and oak and ash
(3.5%).
According to the Lithuanian Forest Law, the general volume of all annual forest cuttings cannot exceed
the gross annual tree increment. The volume of annual main forest cuttings in State forests is approved
by the government and for the period 2014-2018 it comprises 3.15 million cubic meters. The Ministry
of Environment approves the volume of intermediate forest cuttings in State forests and for 2016 the
volume amounted to 1.3 million cubic meters. The felling volume in state forests remains stable, on the
level of 3.8-3.9 million cubic meters. Felling volume in private forests is much more sensitive to prices
than State forest production. Private felling grew moderately in recent years until 2014, reaching 3.8
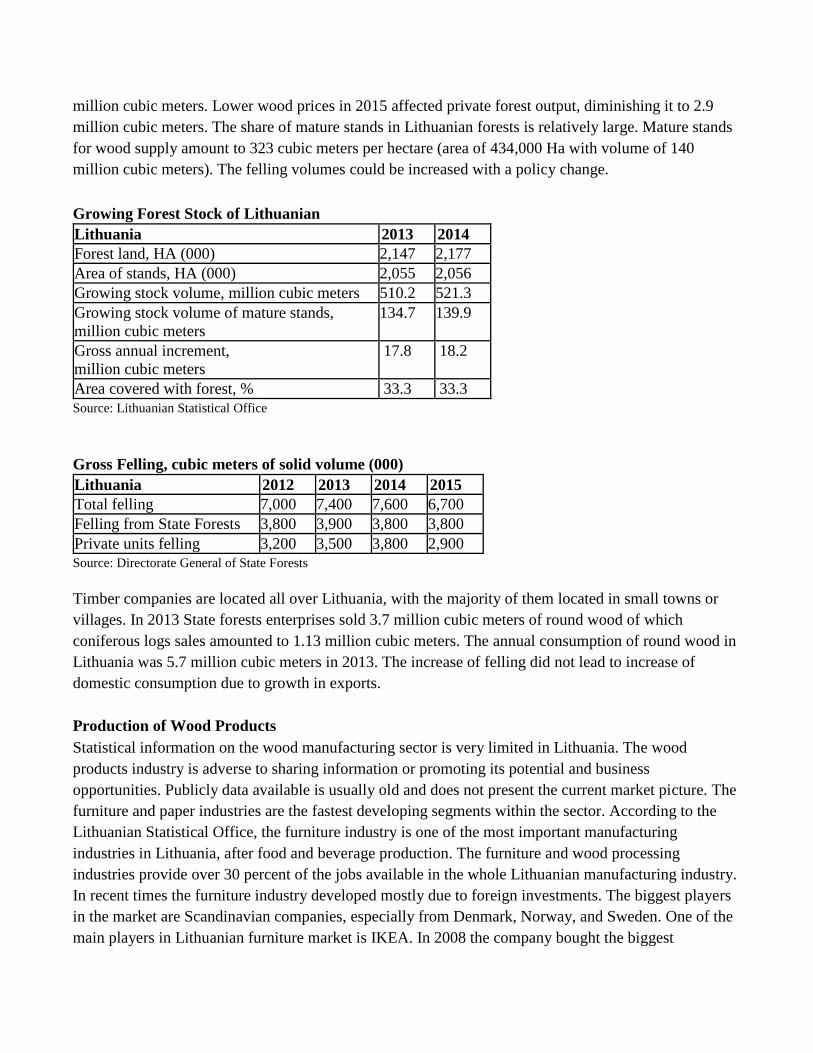
million cubic meters. Lower wood prices in 2015 affected private forest output, diminishing it to 2.9
million cubic meters. The share of mature stands in Lithuanian forests is relatively large. Mature stands
for wood supply amount to 323 cubic meters per hectare (area of 434,000 Ha with volume of 140
million cubic meters). The felling volumes could be increased with a policy change.
Growing Forest Stock of Lithuanian
Lithuania 2013 2014
Forest land, HA (000) 2,147 2,177
Area of stands, HA (000) 2,055 2,056
Growing stock volume, million cubic meters 510.2 521.3
Growing stock volume of mature stands,
million cubic meters
134.7 139.9
Gross annual increment,
million cubic meters
17.8 18.2
Area covered with forest, % 33.3 33.3
Source: Lithuanian Statistical Office
Gross Felling, cubic meters of solid volume (000)
Lithuania 2012 2013 2014 2015
Total felling 7,000 7,400 7,600 6,700
Felling from State Forests 3,800 3,900 3,800 3,800
Private units felling 3,200 3,500 3,800 2,900
Source: Directorate General of State Forests
Timber companies are located all over Lithuania, with the majority of them located in small towns or
villages. In 2013 State forests enterprises sold 3.7 million cubic meters of round wood of which
coniferous logs sales amounted to 1.13 million cubic meters. The annual consumption of round wood in
Lithuania was 5.7 million cubic meters in 2013. The increase of felling did not lead to increase of
domestic consumption due to growth in exports.
Production of Wood Products
Statistical information on the wood manufacturing sector is very limited in Lithuania. The wood
products industry is adverse to sharing information or promoting its potential and business
opportunities. Publicly data available is usually old and does not present the current market picture. The
furniture and paper industries are the fastest developing segments within the sector. According to the
Lithuanian Statistical Office, the furniture industry is one of the most important manufacturing
industries in Lithuania, after food and beverage production. The furniture and wood processing
industries provide over 30 percent of the jobs available in the whole Lithuanian manufacturing industry.
In recent times the furniture industry developed mostly due to foreign investments. The biggest players
in the market are Scandinavian companies, especially from Denmark, Norway, and Sweden. One of the
main players in Lithuanian furniture market is IKEA. In 2008 the company bought the biggest
Lithuanian furniture producer “Giriu Bizonas” which increased the sector’s potential significantly and
this was reflected in export increases pretty soon afterwards.
Statistical data available for 2014 show a significant increase in furniture sales in 2014. The main driver
for this increase came from exports. According to the Lithuanian Statistical Office, Lithuania enjoys a
positive foreign trade balance in furniture trade. In 2016 furniture exports from Lithuania amounted to
EUR 1.486 million (6 percent increase in relation to 2015). Imports of furniture amounted to EUR 1.210
million (6 percent increase in relation to 2015). Production of sawn wood was about 0.9 million cubic
meters in 2014.
Trade
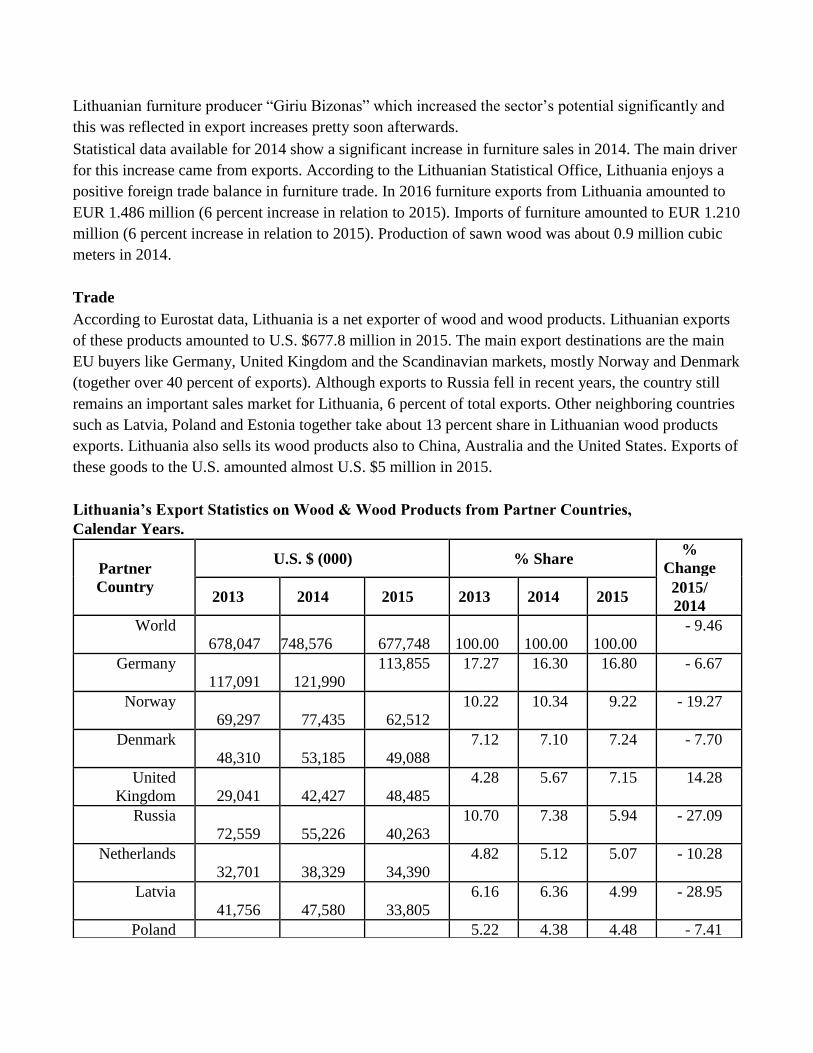
According to Eurostat data, Lithuania is a net exporter of wood and wood products. Lithuanian exports
of these products amounted to U.S. $677.8 million in 2015. The main export destinations are the main
EU buyers like Germany, United Kingdom and the Scandinavian markets, mostly Norway and Denmark
(together over 40 percent of exports). Although exports to Russia fell in recent years, the country still
remains an important sales market for Lithuania, 6 percent of total exports. Other neighboring countries
such as Latvia, Poland and Estonia together take about 13 percent share in Lithuanian wood products
exports. Lithuania also sells its wood products also to China, Australia and the United States. Exports of
these goods to the U.S. amounted almost U.S. $5 million in 2015.
Lithuania’s Export Statistics on Wood & Wood Products from Partner Countries,
Calendar Years.
Partner
Country
U.S. $ (000) % Share %
Change
2013 2014 2015 2013 2014 2015 2015/
2014
World
678,047
748,576
677,748
100.00
100.00
100.00
- 9.46
Germany
117,091
121,990
113,855 17.27 16.30 16.80 - 6.67
Norway
69,297
77,435
62,512
10.22 10.34 9.22 - 19.27
Denmark
48,310
53,185
49,088
7.12 7.10 7.24 - 7.70
United
Kingdom
29,041
42,427
48,485
4.28 5.67 7.15 14.28
Russia
72,559
55,226
40,263
10.70 7.38 5.94 - 27.09
Netherlands
32,701
38,329
34,390
4.82 5.12 5.07 - 10.28
Latvia
41,756
47,580
33,805
6.16 6.36 4.99 - 28.95
Poland 5.22 4.38 4.48 - 7.41

35,374 32,818 30,387
Sweden
28,063
31,028
29,615
4.14 4.14 4.37 - 4.55
France
31,695
32,491
29,589
4.67 4.34 4.37 - 8.93
Switzerland
7,438
37,335
27,218
1.10 4.99 4.02 - 27.10
Italy
15,929
18,967
22,385
2.35 2.53 3.30 18.02
Estonia
20,557
23,724
22,118
3.03 3.17 3.26 - 6.77
Belgium
21,911
24,143
18,662
3.23 3.23 2.75 - 22.70
China
7,364
9,098
10,992
1.09 1.22 1.62 20.81
Australia
9,082
12,757
10,132
1.34 1.70 1.49 - 20.58
Czech Republic
5,023
5,714
9,231
0.74 0.76 1.36 61.55
United States
3,962
6,171
8,743
0.58 0.82 1.29 41.67
Source: Eurostat
Lithuania’s Import Statistics on Wood & Wood Products from Partner Countries,
Calendar Years.
Partner
Country
U.S. $ (000) % Share %
Change
2013 2014 2015 2013 2014 2015 2015/2014
World
405,455
510,436
449,655
100.00
100.00
100.00
- 11.91
Poland
110,391
123,312
96,380
27.23 24.16 21.43 - 21.84
Latvia
64,856
73,441
69,624
16.00 14.39 15.48 - 5.20
Russia
36,410
48,143
49,144
8.98 9.43 10.93 2.08
Belarus
30,336
54,054
49,112
7.48 10.59 10.92 - 9.14
Ukraine
29,290
38,009
38,452
7.22 7.45 8.55 1.17
Germany
23,978
28,730
27,648
5.91 5.63 6.15 - 3.77
Estonia
17,655
24,481
20,659
4.35 4.80 4.59 - 15.61
Italy 1.48 2.94 3.27 - 2.02

6,004 15,021 14,717
Finland
12,431
16,092
12,970
3.07 3.15 2.88 - 19.40
Austria
10,838
13,145
11,252
2.67 2.58 2.50 - 14.40
Sweden
13,694
16,204
10,506
3.38 3.17 2.34 - 35.17
Romania
9,174
9,183
6,437
2.26 1.80 1.43 - 29.90
United States
3,709
4,703
4,990
0.91 0.92 1.11 6.10
Source: Eurostat
Lithuania is a large importer of wood and wood products. Demand for wood highly exceeds the
centrally regulated supply available in the country. In 2015 imports of wood and wood products
amounted to U.S. $450 million. The main suppliers were neighbor EU countries such as Poland, Latvia,
Estonia (42 percent of wood and wood products imports), and non EU neighbor countries like Russia,
Belarus, and Ukraine (30 percent of imports). The Lithuanian wood industry sources mostly round
wood and raw materials for further processing from these markets. United States ranked as the
thirteenth largest supplier of Wood and Wood Products to Lithuania with the sales valued U.S. $5
million in 2015.
U.S. exports of forest products to Lithuania,
Calendar Years, (U.S. $million)
2013 2014 2015 2016 % change 2015-16
Total Agricultural Fish&Forest Products 167.8 137.2 101.4 71.0 -30
Forest Products 3.8 4.6 4.6 6.1 33.8
Source: USDA BICO
U.S. imports of forest products from Lithuania,
Calendar Years, (U.S. $million)
2013 2014 2015 2016 % change 2015-16
Total Agricultural Fish&Forest Products 32.0 55.6 87.4 88.1 0.8
Forest Products 4.8 6.5 9.7 13.9 42.7
of which:
Logs &Chips 0.0 0.0 0.0 0.0 -
Hardwood Lumber 0.0 0.0 0.2 0.2 30.3
Softwood&Treated Lumber 1.4 1.3 1.3 2.3 75.1
Panel Products 1.4 2.0 3.7 7.4 100.0
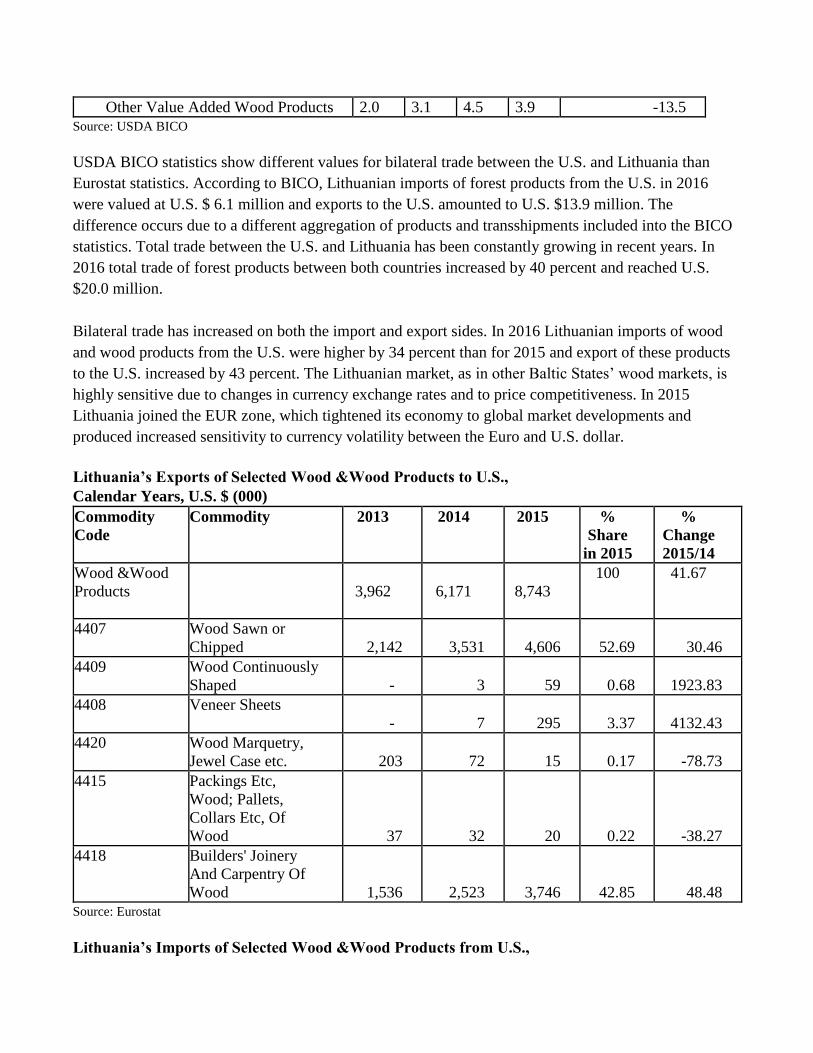
Other Value Added Wood Products 2.0 3.1 4.5 3.9 -13.5
Source: USDA BICO
USDA BICO statistics show different values for bilateral trade between the U.S. and Lithuania than
Eurostat statistics. According to BICO, Lithuanian imports of forest products from the U.S. in 2016
were valued at U.S. $ 6.1 million and exports to the U.S. amounted to U.S. $13.9 million. The
difference occurs due to a different aggregation of products and transshipments included into the BICO
statistics. Total trade between the U.S. and Lithuania has been constantly growing in recent years. In
2016 total trade of forest products between both countries increased by 40 percent and reached U.S.
$20.0 million.
Bilateral trade has increased on both the import and export sides. In 2016 Lithuanian imports of wood
and wood products from the U.S. were higher by 34 percent than for 2015 and export of these products
to the U.S. increased by 43 percent. The Lithuanian market, as in other Baltic States’ wood markets, is
highly sensitive due to changes in currency exchange rates and to price competitiveness. In 2015
Lithuania joined the EUR zone, which tightened its economy to global market developments and
produced increased sensitivity to currency volatility between the Euro and U.S. dollar.
Lithuania’s Exports of Selected Wood &Wood Products to U.S.,
Calendar Years, U.S. $ (000)
Commodity
Code
Commodity 2013 2014 2015 %
Share
in 2015
%
Change
2015/14
Wood &Wood
Products
3,962
6,171
8,743
100
41.67
4407 Wood Sawn or
Chipped
2,142
3,531
4,606 52.69 30.46
4409 Wood Continuously
Shaped
-
3
59 0.68 1923.83
4408 Veneer Sheets
- 7
295 3.37 4132.43
4420 Wood Marquetry,
Jewel Case etc.
203
72
15 0.17 -78.73
4415 Packings Etc,
Wood; Pallets,
Collars Etc, Of
Wood
37
32
20 0.22 -38.27
4418 Builders' Joinery
And Carpentry Of
Wood 1,536
2,523
3,746 42.85 48.48
Source: Eurostat
Lithuania’s Imports of Selected Wood &Wood Products from U.S.,

Calendar Years, U.S. $ (000)
Commodity
Code
Commodity 2013 2014 2015 %
Share
in 2015
%
Change
2015/14
Wood &Wood
Products
3,709
4,703
4,990
100 6.1
4407 Wood Sawn or
Chipped
3,197
3,741
3,275
65.63 -12.47
4409 Wood Continuously
Shaped
-
-
2
0.05 1085.23
4408 Veneer Sheets
344
856
1,668
33.43 94.86
4420 Wood Marquetry,
Jewel Case etc.
9
2
1
0.02 -46.39
4411 Fiberboard Of
Wood Or Other
Ligneous Materials
139
91
36
0.71 -60.88
4418 Builders' Joinery
And Carpentry Of
Wood
11
1
-
0 -70.64
Source: Eurostat
Lithuania’s Import from U.S. of Wood Sawn or Chipped Lengthwise, Sliced Or Peeled, More
Than 6 Mm (.236 In.) Thick (HS: 4407), Calendar Years.
Commodity Description U.S. $ (000) % Share
in 2015
% Change
2013 2014 2015 2015/2014
4407
Wood Sawn Or Chipped
Length, Sliced Etc, Ov6 Mm
Th
3,197
3,741
3,275 100 -12.47
440795
Ash, Sawn or Chipped
Lengthwise, Sliced or Peeled
-
29
- 0 -100
440791
Oak Wood, Sawn, Sliced Etc,
Over 6 Mm Thick
1,973
2,231
1,247 38.08 -44.1
440799
Non coniferous Wood Nesoi,
Sawn, Sliced Etc, Ov 6Mm
1,214
1,197
1,770 54.04 47.79
440793
Maple Sawn or Chipped
Lengthwise, Sliced Or Peeled
9
191
236 7.22 23.67
440794
Cherry, Sawn/Chipped
Lengthwise, Sliced/Peeled
1,214
1,197
1,770 0 -100
440710
Coniferous Wood Sawn,
Sliced Etc, Over 6 Mm Thick
2
-
22 0.66 n/a
Source: Eurostat
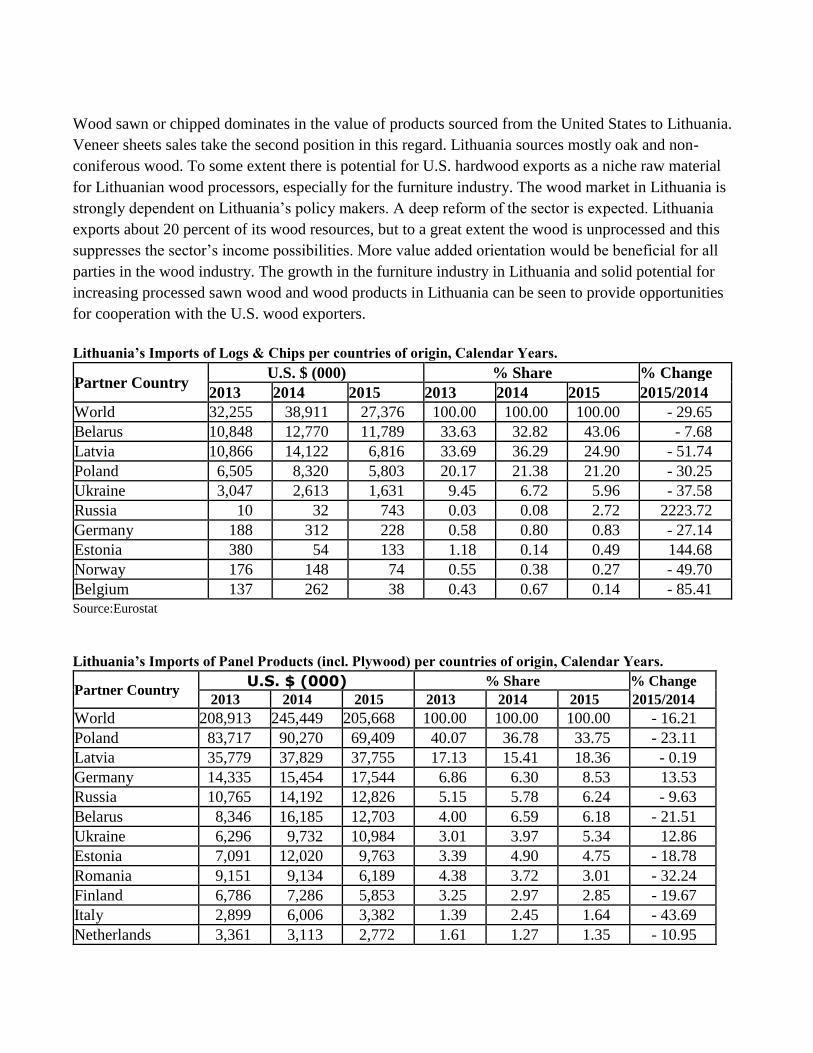
Wood sawn or chipped dominates in the value of products sourced from the United States to Lithuania.
Veneer sheets sales take the second position in this regard. Lithuania sources mostly oak and non-
coniferous wood. To some extent there is potential for U.S. hardwood exports as a niche raw material
for Lithuanian wood processors, especially for the furniture industry. The wood market in Lithuania is
strongly dependent on Lithuania’s policy makers. A deep reform of the sector is expected. Lithuania
exports about 20 percent of its wood resources, but to a great extent the wood is unprocessed and this
suppresses the sector’s income possibilities. More value added orientation would be beneficial for all
parties in the wood industry. The growth in the furniture industry in Lithuania and solid potential for
increasing processed sawn wood and wood products in Lithuania can be seen to provide opportunities
for cooperation with the U.S. wood exporters.
Lithuania’s Imports of Logs & Chips per countries of origin, Calendar Years.
Partner Country U.S. $ (000) % Share % Change
2013 2014 2015 2013 2014 2015 2015/2014
World 32,255 38,911 27,376 100.00 100.00 100.00 - 29.65
Belarus 10,848 12,770 11,789 33.63 32.82 43.06 - 7.68
Latvia 10,866 14,122 6,816 33.69 36.29 24.90 - 51.74
Poland 6,505 8,320 5,803 20.17 21.38 21.20 - 30.25
Ukraine 3,047 2,613 1,631 9.45 6.72 5.96 - 37.58
Russia 10 32 743 0.03 0.08 2.72 2223.72
Germany 188 312 228 0.58 0.80 0.83 - 27.14
Estonia 380 54 133 1.18 0.14 0.49 144.68
Norway 176 148 74 0.55 0.38 0.27 - 49.70
Belgium 137 262 38 0.43 0.67 0.14 - 85.41
Source:Eurostat
Lithuania’s Imports of Panel Products (incl. Plywood) per countries of origin, Calendar Years.
Partner Country U.S. $ (000) % Share % Change
2013 2014 2015 2013 2014 2015 2015/2014
World 208,913 245,449 205,668 100.00 100.00 100.00 - 16.21
Poland 83,717 90,270 69,409 40.07 36.78 33.75 - 23.11
Latvia 35,779 37,829 37,755 17.13 15.41 18.36 - 0.19
Germany 14,335 15,454 17,544 6.86 6.30 8.53 13.53
Russia 10,765 14,192 12,826 5.15 5.78 6.24 - 9.63
Belarus 8,346 16,185 12,703 4.00 6.59 6.18 - 21.51
Ukraine 6,296 9,732 10,984 3.01 3.97 5.34 12.86
Estonia 7,091 12,020 9,763 3.39 4.90 4.75 - 18.78
Romania 9,151 9,134 6,189 4.38 3.72 3.01 - 32.24
Finland 6,786 7,286 5,853 3.25 2.97 2.85 - 19.67
Italy 2,899 6,006 3,382 1.39 2.45 1.64 - 43.69
Netherlands 3,361 3,113 2,772 1.61 1.27 1.35 - 10.95
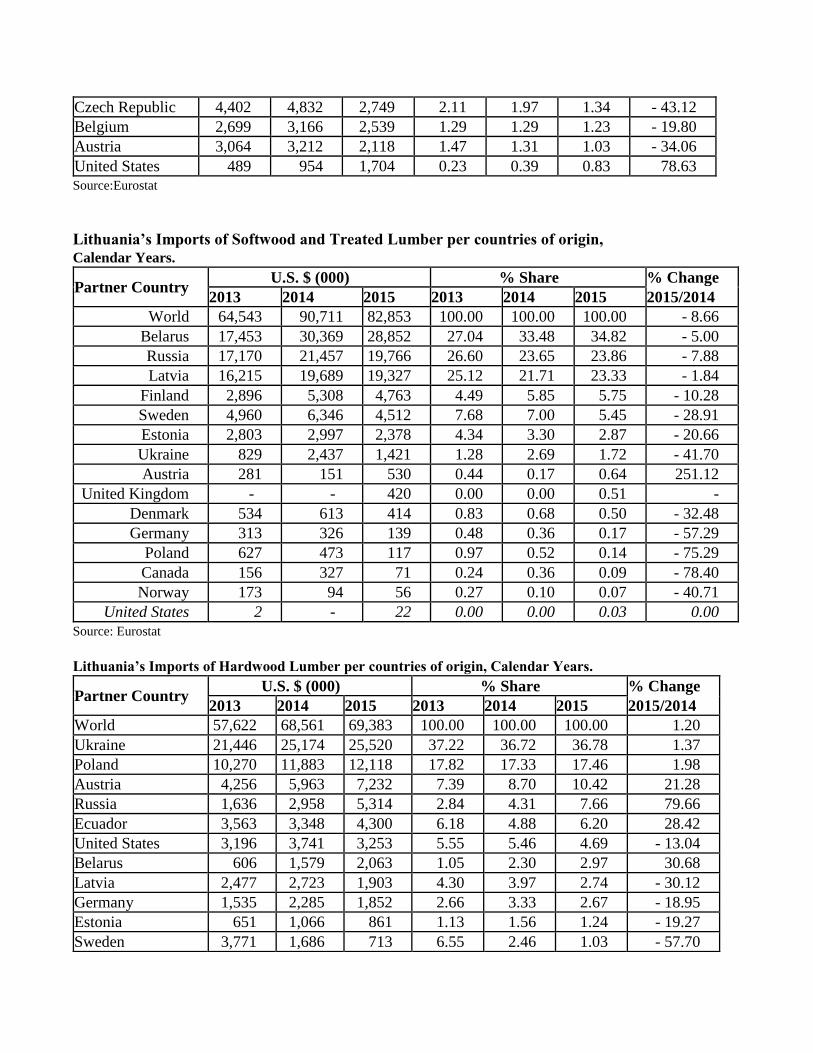
Czech Republic 4,402 4,832 2,749 2.11 1.97 1.34 - 43.12
Belgium 2,699 3,166 2,539 1.29 1.29 1.23 - 19.80
Austria 3,064 3,212 2,118 1.47 1.31 1.03 - 34.06
United States 489 954 1,704 0.23 0.39 0.83 78.63
Source:Eurostat
Lithuania’s Imports of Softwood and Treated Lumber per countries of origin,
Calendar Years.
Partner Country U.S. $ (000) % Share % Change
2013 2014 2015 2013 2014 2015 2015/2014
World 64,543 90,711 82,853 100.00 100.00 100.00 - 8.66
Belarus 17,453 30,369 28,852 27.04 33.48 34.82 - 5.00
Russia 17,170 21,457 19,766 26.60 23.65 23.86 - 7.88
Latvia 16,215 19,689 19,327 25.12 21.71 23.33 - 1.84
Finland 2,896 5,308 4,763 4.49 5.85 5.75 - 10.28
Sweden 4,960 6,346 4,512 7.68 7.00 5.45 - 28.91
Estonia 2,803 2,997 2,378 4.34 3.30 2.87 - 20.66
Ukraine 829 2,437 1,421 1.28 2.69 1.72 - 41.70
Austria 281 151 530 0.44 0.17 0.64 251.12
United Kingdom - - 420 0.00 0.00 0.51 -
Denmark 534 613 414 0.83 0.68 0.50 - 32.48
Germany 313 326 139 0.48 0.36 0.17 - 57.29
Poland 627 473 117 0.97 0.52 0.14 - 75.29
Canada 156 327 71 0.24 0.36 0.09 - 78.40
Norway 173 94 56 0.27 0.10 0.07 - 40.71
United States 2 - 22 0.00 0.00 0.03 0.00
Source: Eurostat
Lithuania’s Imports of Hardwood Lumber per countries of origin, Calendar Years.
Partner Country U.S. $ (000) % Share % Change
2013 2014 2015 2013 2014 2015 2015/2014
World 57,622 68,561 69,383 100.00 100.00 100.00 1.20
Ukraine 21,446 25,174 25,520 37.22 36.72 36.78 1.37
Poland 10,270 11,883 12,118 17.82 17.33 17.46 1.98
Austria 4,256 5,963 7,232 7.39 8.70 10.42 21.28
Russia 1,636 2,958 5,314 2.84 4.31 7.66 79.66
Ecuador 3,563 3,348 4,300 6.18 4.88 6.20 28.42
United States 3,196 3,741 3,253 5.55 5.46 4.69 - 13.04
Belarus 606 1,579 2,063 1.05 2.30 2.97 30.68
Latvia 2,477 2,723 1,903 4.30 3.97 2.74 - 30.12
Germany 1,535 2,285 1,852 2.66 3.33 2.67 - 18.95
Estonia 651 1,066 861 1.13 1.56 1.24 - 19.27
Sweden 3,771 1,686 713 6.55 2.46 1.03 - 57.70
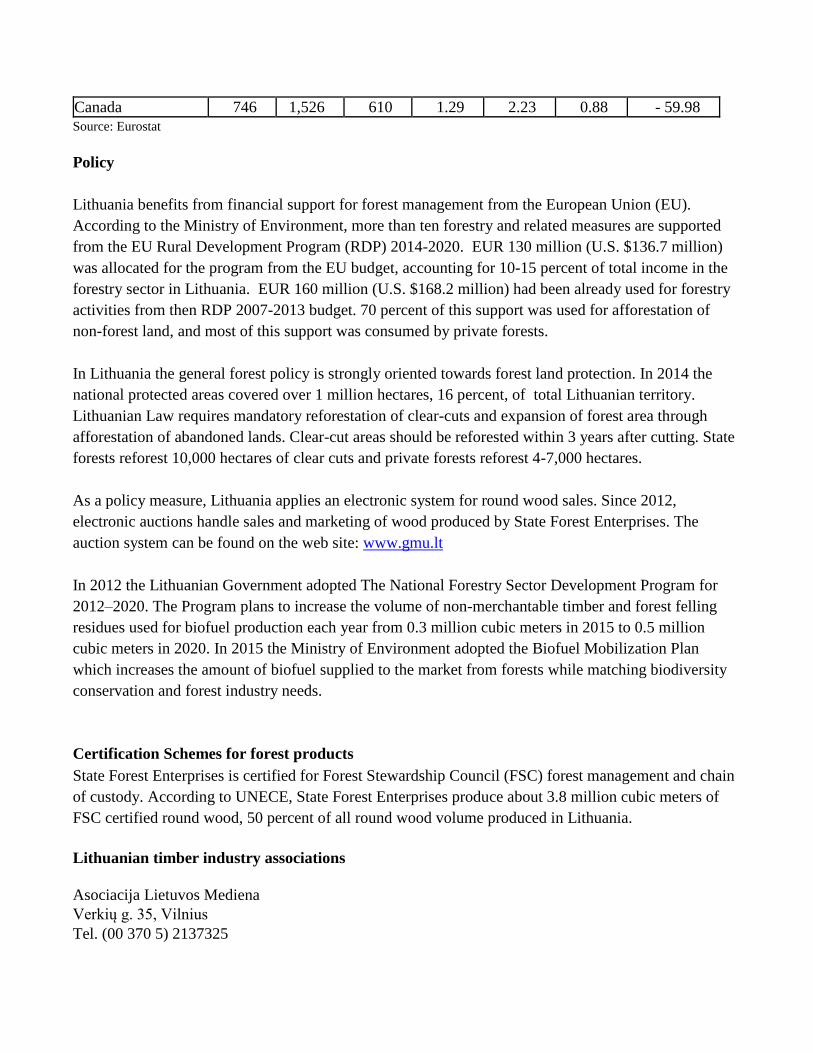
Canada 746 1,526 610 1.29 2.23 0.88 - 59.98
Source: Eurostat
Policy
Lithuania benefits from financial support for forest management from the European Union (EU).
According to the Ministry of Environment, more than ten forestry and related measures are supported
from the EU Rural Development Program (RDP) 2014-2020. EUR 130 million (U.S. $136.7 million)
was allocated for the program from the EU budget, accounting for 10-15 percent of total income in the
forestry sector in Lithuania. EUR 160 million (U.S. $168.2 million) had been already used for forestry
activities from then RDP 2007-2013 budget. 70 percent of this support was used for afforestation of
non-forest land, and most of this support was consumed by private forests.
In Lithuania the general forest policy is strongly oriented towards forest land protection. In 2014 the
national protected areas covered over 1 million hectares, 16 percent, of total Lithuanian territory.
Lithuanian Law requires mandatory reforestation of clear-cuts and expansion of forest area through
afforestation of abandoned lands. Clear-cut areas should be reforested within 3 years after cutting. State
forests reforest 10,000 hectares of clear cuts and private forests reforest 4-7,000 hectares.
As a policy measure, Lithuania applies an electronic system for round wood sales. Since 2012,
electronic auctions handle sales and marketing of wood produced by State Forest Enterprises. The
auction system can be found on the web site: www.gmu.lt
In 2012 the Lithuanian Government adopted The National Forestry Sector Development Program for
2012–2020. The Program plans to increase the volume of non-merchantable timber and forest felling
residues used for biofuel production each year from 0.3 million cubic meters in 2015 to 0.5 million
cubic meters in 2020. In 2015 the Ministry of Environment adopted the Biofuel Mobilization Plan
which increases the amount of biofuel supplied to the market from forests while matching biodiversity
conservation and forest industry needs.
Certification Schemes for forest products
State Forest Enterprises is certified for Forest Stewardship Council (FSC) forest management and chain
of custody. According to UNECE, State Forest Enterprises produce about 3.8 million cubic meters of
FSC certified round wood, 50 percent of all round wood volume produced in Lithuania.
Lithuanian timber industry associations
Asociacija Lietuvos Mediena
Verkių g. 35, Vilnius
Tel. (00 370 5) 2137325
e-mail: [email protected]
Government institutions:
Ministry of Environment of the Republic of Lithuania
Jakšto g. 4, LT-01105 Vilnius,
Tel. (00 370 7) 066 36 61
e-mail: [email protected]
Directorate General of State Forests
Smolensko str. 15, 03201 Vilnius
Tel. (00 370 5) 273 4021
e-mail: [email protected]
End of Report.