THIS REPORT CONTAINS ASSESSMENTS OF ......exports to African countries in the first seven months of...
42
Turkey Grain and Feed Annual Report 2018 1 THIS REPORT CONTAINS ASSESSMENTS OF COMMODITY AND TRADE ISSUES MADE BY USDA STAFF AND NOT NECESSARILY STATEMENTS OF OFFICIAL U.S. GOVERNMENT POLICY Date: GAIN Report Number: Approved By: Prepared By: Report Highlights: Turkey’s wheat production for marketing year (MY) 2018/19 is forecast at 19.3 MMT, which is slightly lower compared to the previous year due to decreased planting area. Barley production forecast is up seven percent for MY 2018/19 to 6.75 MMT, while corn planting area is expected to decrease about five percent to 530,000 hectares and production to 5.1 MMT. In an effort to tackle food price inflation, the Turkish Government reduced the import tariffs on several commodities in 2017. The GOT plans to grant 14.8 billion TL ($3.89 billion) in agricultural subsidies to agricultural producers in 2018 and many new licensed warehouse systems for grain storage are being established. Turkey Grain and Feed Annual Report 2018 Kubilay Karabina, Agricultural Specialist Elizabeth Leonardi, Agricultural Attaché Grain and Feed Annual 2018 Grain and Feed Annual Turkey TR8010 3/27/2018 Required Report - public distribution
Transcript of THIS REPORT CONTAINS ASSESSMENTS OF ......exports to African countries in the first seven months of...
Turkey Grain and Feed Annual Report 2018 1
THIS REPORT CONTAINS ASSESSMENTS OF COMMODITY AND TRADE ISSUES MADE BY
USDA STAFF AND NOT NECESSARILY STATEMENTS OF OFFICIAL U.S. GOVERNMENT
POLICY
Date:
GAIN Report Number:
Approved By:
Prepared By:
Report Highlights:
Turkey’s wheat production for marketing year (MY) 2018/19 is forecast at 19.3 MMT, which is slightly
lower compared to the previous year due to decreased planting area. Barley production forecast is up
seven percent for MY 2018/19 to 6.75 MMT, while corn planting area is expected to decrease about
five percent to 530,000 hectares and production to 5.1 MMT. In an effort to tackle food price inflation,
the Turkish Government reduced the import tariffs on several commodities in 2017. The GOT plans to
grant 14.8 billion TL ($3.89 billion) in agricultural subsidies to agricultural producers in 2018 and many
new licensed warehouse systems for grain storage are being established.
Turkey Grain and Feed Annual Report 2018
Kubilay Karabina, Agricultural Specialist
Elizabeth Leonardi, Agricultural Attaché
Grain and Feed Annual 2018
Grain and Feed Annual
Turkey
TR8010
3/27/2018
Required Report - public distribution
Turkey Grain and Feed Annual Report 2018 2
EXECUTIVE SUMMARY
Wheat production for marketing year (MY) 2018/19 is forecast at 19.3 MMT, which is slightly lower
compared to the previous year due to decreased planting area, assuming sufficient rain and favorable
conditions from April to June. Post revised the wheat consumption forecast down to 17.6 MMT in MY
2017/18 due to decreasing feed wheat usage.
Russia continues to be the prominent supplier of wheat for Turkey’s flour and pasta sector in 2017/18,
despite last year’s political issues. For MY 2017/18, wheat exports (including wheat products, such as
flour) from Turkey are expected to be 6.3 MMT, due to sales into neighboring countries and growth in
exports to African countries in the first seven months of the marketing year. However, wheat flour
exports have been slowing down in recent months. For MY 2018/19, total wheat exports from Turkey,
including wheat products, are forecast at 6 MMT, down 300,000 MT from MY 2017/18, due to ongoing
issues with prominent markets, such as Iraq, which complicate trade.
Barley production for MY 2018/19 is forecast at 6.75 MMT, up seven percent compared to the previous
year, due to increasing planted area. High barley prices in the domestic market led to many farmers
planting barley instead of wheat.
In MY 2018/19, Turkish corn planting area is forecast to decrease about five percent to 530,000 hectares
and production to 5.1 MMT. The total planting decrease is projected at about 20,000 ha in MY 2018/19.
Good returns on alternative crops, especially cotton, are the reason for the decreased corn planting.
Compound feed production in Turkey increased to 22.4 MMT in 2017, up 10 percent compared to last
year. Imports of residues and byproducts from food industries such as bran and meals to Turkey reached
at 6.6 MMT in 2017, up 33 percent compared to last year.
The Government of Turkey (GOT) plans to grant 14.8 billion TL ($3.89 billion) in agricultural subsidies
to all agricultural producers, including livestock farmers, in 2018 as part of their new agricultural
budget. This is up 15 percent compared to 2017, in terms of Turkish Lira. The GOT granted 12.8 billion
TL ($3.55 billion) in agricultural subsidies to producers in 2017.
Within the scope of a set of measures to fight rising food inflation in Turkey, the Turkish government
reduced the import tariff on several commodities such as wheat, corn, barley, rice, pulses, bran and
meals in 2017.
New licensed warehouse systems for grain storage are developing in Turkey. The GOT has supported
construction and operations of licensed warehouses. As of February 2017, there are 40 active licensed
warehouse operations (LWO) with a capacity of 1.8 MMT. There were only 19 LWO last year.
According to the Turkish Grain Board (TMO), TMO procured 240,000 MT of wheat and 95,000 MT of
corn with electronic warehouse receipts in MY 2017/18 and plans to procure grain only through licensed
warehouses in MY 2018/19. Also, TMO did not sell any products to exporters within the scope of
Inward Processing Regime in 2017/18.
PRODUCTION
Wheat

Turkey Grain and Feed Annual Report 2018 3
Wheat production for marketing year (MY) 2018/19 is forecast at 19.3 MMT, which is slightly lower
compared to the previous year due to decreased planting area, assuming sufficient rain and favorable
conditions from April to June. Wheat planting area has decreased compared to last year. Good returns,
mainly on barley and other crops, are impacting farmers’ planting decision.
Last year, Turkey experienced one of the driest seasons for planting in 2017/18. Mid-season
precipitation improved though and the situation ended with very favorable conditions which resulted in
an abundant crop. Although the current season also started with drought concerns, the average winter
rainfall in Turkey from October 2017 through February 2018 was much better than the previous year.
Average rainfall in Turkey from October 2017 through February 2018 was 292.6 millimeters (mm).
During the same period the previous year, rainfall was 229.6 mm. Although this year’s rainfall amount
is 9 percent lower than the national historical average, it is 28 percent higher than last year. February
and March saw fairly heavy rainfall throughout most of the country. Dormant crops rely on winter
precipitation for spring emergence and establishment.
The areas with the greatest increase in rainfall compared to the previous year were the Mediterranean
region, followed by the Central Anatolia and East Anatolia regions. As can be seen Table 1, the
cumulative rainfall from October to January in the Mediterranean region was 438.5 mm, while the
average level for that region is 453.1 mm. This amount of rainfall is 3 percent lower than the national
historical average for Mediterranean region, and it is 45 percent higher than last year.
Table 1: Cumulative Rainfall in Turkey
Turkey: Recent Rainfall Levels
Region Oct 2016- Feb
2017 (mm)
Oct 2017- Feb
2018 (mm)
Normal
(mm)
2017/18 deviation from
normal
Thrace 347.4 409.6 394.0 4 %
Aegean 260.1 326.6 378.8 -14 %
Mediterranean 302.7 438.5 453.1 -3 %
Central Anatolia 120.2 173.5 198.9 -13 %
Black Sea 286.6 314.9 342.5 -8 %
East Anatolia 180.1 239.1 279.0 -14 %
Southeast
Anatolia
223.8 266.0 342.0 -22 %
Turkey Total 229.6 292.9 322.8 -9 % Source: Turkish State Meteorological Service
The cumulative rainfall from October to January in the Central Anatolia region was 173.5 mm, while the
average level for that region is 198.9 mm. This amount of rainfall is 13 percent lower than the national
historical average for Central Anatolia region, and it is 44 percent higher than last year. Despite
adequate winter rains, there was a lack of snow, which negatively impacts growth.
During the planting season, precipitation was near to above average over the majority of the winter
grains area, with the exception of the Southern Anatolia region. Dry weather has been reported as a
concern for the winter grains crop in Southeastern Turkey, along the Syrian Border. The area of concern
Turkey Grain and Feed Annual Report 2018 4
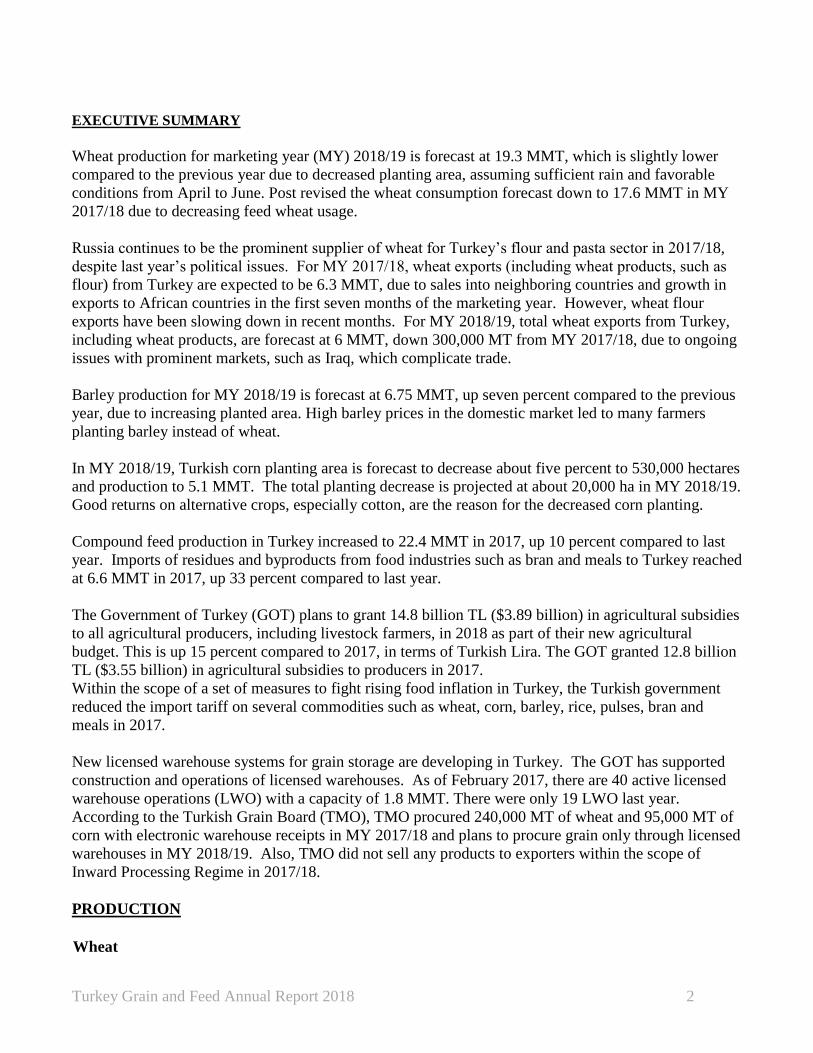
is referred to as Southern Anatolia and typically produces 15 percent of the total winter wheat crop.
Precipitation over Southern Anatolia between October 1, 2017 until December 31, 2017 was well below
normal (Fig. 1). This was one of the driest seasons for planting in recent years.
Figure 1: Percent Normal Cumulative Precipitation,
Illustrating Below Normal Precipitation Over Southern Anatolia, Turkey during planting
Source: USDA FAS
Last year the crop in the Central Anatolia region was beset with drought at planting. Mid-season
precipitation improved the situation and lead to very favorable conditions which resulted in an abundant
crop. Thus, this year’s crop in the Southern Anatolia region still has time to recover and end up with
good yields.
Planting of the 2017/18 winter barley and wheat crops started in mid-September and concluded in early
December. Dry weather in October and November 2017 in some regions of Central Anatolia and
Southeast Anatolia caused a small amount of damage to the crop, forcing a few farmers to have to re-
plant wheat.
MY 2018/19 wheat planting is forecast to decrease slightly to 7,615,000 ha. Winter wheat planting,
which finished in October 2017, was nearly 200,000 ha below the previous year, mainly due to
competition with barley in unirrigated areas, and other products differing by region.
Turkey Grain and Feed Annual Report 2018 5
Although it is still early to reliably forecast MY 2018/19 wheat production, the wheat production
estimate is 19.3 MMT, assuming sufficient rain and favorable conditions from April to June.
Central Anatolia is the main grain production region of Turkey. So far in MY 2018/19, rainfall in the
region is below normal levels. Total wheat area in Central Anatolia is 2,835,000 ha and the average
yield is about two MT/ha. Nearly half of the fields are unirrigated and yields are directly linked to
rainfall. A considerable number of farmers in the region switched from wheat to barley in unirrigated
areas, due to high barley prices during the planting period. Barley also gained some land from wheat
Kirsehir, Yozgat and Kiriklale, which are also unirrigated areas, due to good returns last year. Due to
good returns on corn, some irrigated areas of Konya Province also switched from wheat to corn
production. Of the total 5.5 MMT of wheat projected in Central Anatolia in MY 2018/19, 1.1 MMT is
durum wheat.
The Cukurova region has 260,000 ha of wheat planted in MY 2018/19, which is same as last year. Soil
moisture dramatically improved after January and February rains, benefiting the region’s crop.
Temperatures have been mild and overall growing conditions are good. So far, wheat development is
faster than normal due to high temperatures. In some areas, there was rust and white fly observed in the
wheat fields, which will probably negatively impact the quantity. The Cukurova region is expected to
produce 1.3 MMT of wheat in MY 2018/19.
In the Thrace region, the wheat area will marginally decrease due to crop rotation patterns and better
returns on other alternatives like sunflower. So far, plant germination is normal because of good rainfall.
The cumulative rainfall from October to January in the Thrace region was 409.6 mm, while the average
level for that region is 394.0 mm. This is three percent higher than the national historical average for
Thrace region, and it is 18 percent higher than last year. The Thrace region is expected to produce 3.3
MMT of wheat in MY 2018/19.
In MY 2017/18, wheat planted area in Southeastern Anatolia decreased one percent, about 3,000 ha,
due to good returns on cotton. Especially in Harran, cotton has been gaining area from corn and wheat
for the last two years. Kiziltepe and Viransehir are the main areas in Southeastern Anatolia where
farmers planted wheat. Farmers complained about competition with imported durum wheat and
marketing issues, so some switched from durum wheat to milling wheat in some areas in the region.
There will be about 1 MMT of durum wheat production in Southeast Anatolia, down 15 percent
compared to last year, assuming sufficient rain and favorable conditions until the harvest in MY
2018/19. Of the total 19.3 MMT of wheat produced in Turkey in MY 2017/18, 2.2 MMT were durum
wheat. Alternative crops, orchard development, greenhouse development, sesame seeds, onions, and
vegetables increase their share of farm area every year in Turkey, which reduces wheat land.
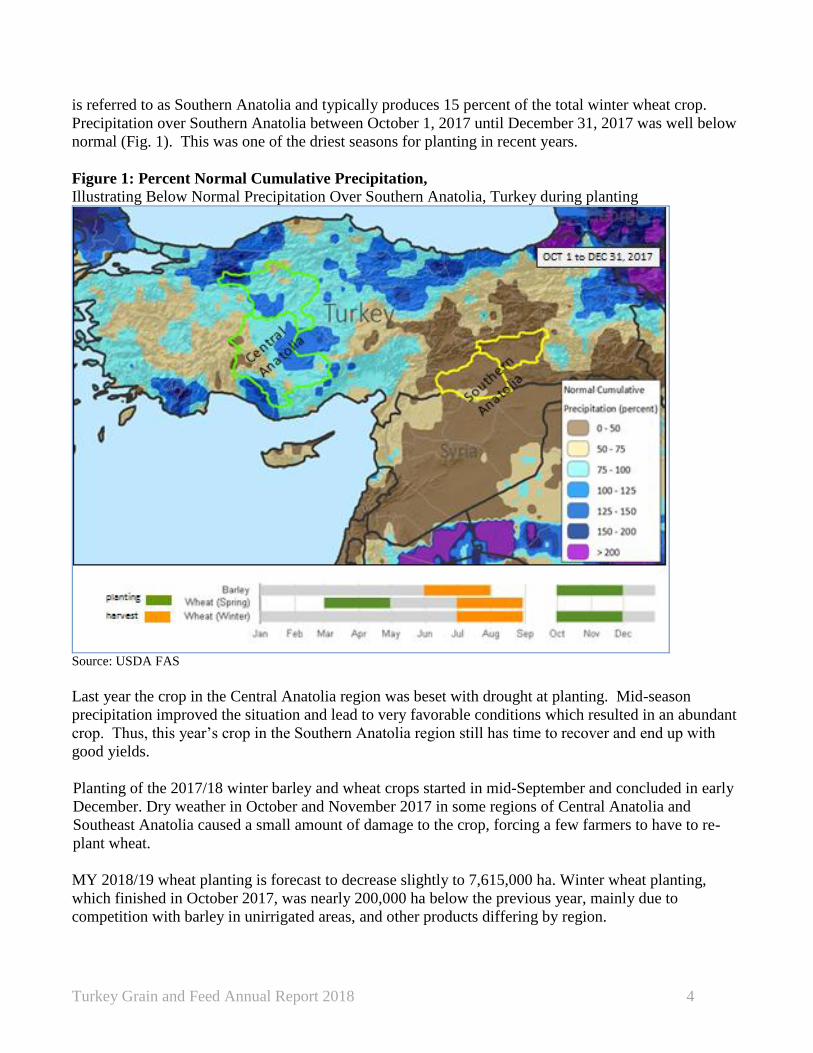
Table 2: Turkish Wheat Production by Region
Regions
MY
2016
Avg.
yield
(MT/H
A)
MY
2017
Avg.
yield
(MT/H
A)
Long
term
Avg.
yield
(MT/H
A)
Harve
st
Time
MY 2016/17 MY 2017/18 MY 2018/19
Harveste
d Area Producti
on (MT)
Harveste
d Area Producti
on (MT)
Harveste
d Area Producti
on (MT) (ha) (ha) (ha)
Turkey Grain and Feed Annual Report 2018 6
Çukuro
va
region
3.5-4.5 4.5-5 4.5-5.5
May1
0-
June
10
260,000 1,175,0
00 260,000
1,250,0
00 260,000
1,300,0
00
Hatay
region 3 4.7 5-5.5
May2
5-
June
25
86,000 200,000 85,000 225,000 85,000 225,000
Southe
ast
region
2.9 3.3 3-3.5
May1
5-
June
25
933,000 2,705,0
00 927,000
3,150,0
00 924,000
3,000,0
00
Central
Anatoli
a
1.7 1.9 1.5-2
June2
5-
July
25
2,990,0
00
5,000,0
00
2,995,0
00
5,650,0
00
2,835,0
00
5,500,0
00
Polatlı 2.8-3 3.4 3.3
June1
5-
July
20
130,000 300,000 130,000 375,000 130,000 375,000
Aegean
region 2-2.5 3 3
May2
5-
June
25
500,000 1,700,0
00 500,000
1,800,0
00 500,000
1,850,0
00
Aydin
region 4.5 4 4
May2
0-
June
10
6,000 50,000 6,000 50,000 6,000 50,000
Thrace 4.8 4.1 4.1
June1
5-
July
15
620,000 3,000,0
00 617,000
3,250,0
00 615,000
3,300,0
00
Other
regions 1.4 1.6 1.5
June1
5-
July
15
2,290,0
00
3,120,0
00
2,280,0
00
3,750,0
00
2,260,0
00
3,700,0
00
Total 2.3 2.5 2.3
May1
5-
July1
5
7,815,00
0
17,250,0
00
7,800,00
0
19,500,0
00
7,615,00
0
19,300,0
00
Source: USDA Estimates
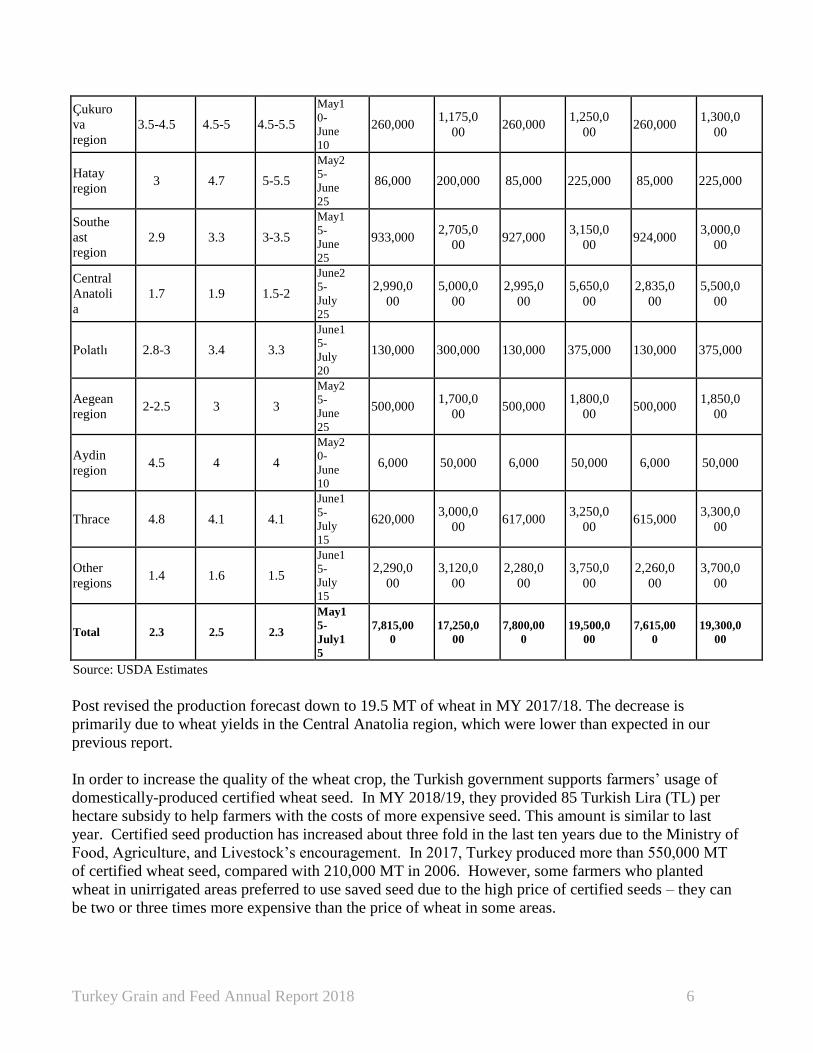
Post revised the production forecast down to 19.5 MT of wheat in MY 2017/18. The decrease is
primarily due to wheat yields in the Central Anatolia region, which were lower than expected in our
previous report.
In order to increase the quality of the wheat crop, the Turkish government supports farmers’ usage of
domestically-produced certified wheat seed. In MY 2018/19, they provided 85 Turkish Lira (TL) per
hectare subsidy to help farmers with the costs of more expensive seed. This amount is similar to last
year. Certified seed production has increased about three fold in the last ten years due to the Ministry of
Food, Agriculture, and Livestock’s encouragement. In 2017, Turkey produced more than 550,000 MT
of certified wheat seed, compared with 210,000 MT in 2006. However, some farmers who planted
wheat in unirrigated areas preferred to use saved seed due to the high price of certified seeds – they can
be two or three times more expensive than the price of wheat in some areas.
Turkey Grain and Feed Annual Report 2018 7
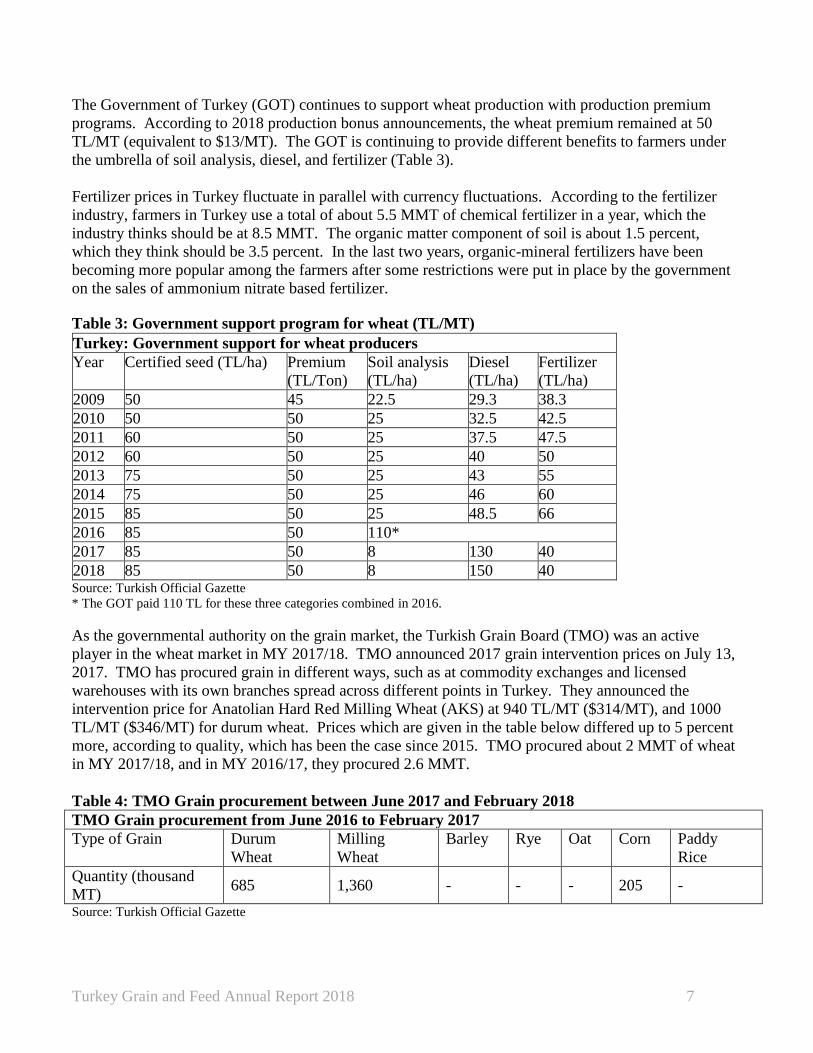
The Government of Turkey (GOT) continues to support wheat production with production premium
programs. According to 2018 production bonus announcements, the wheat premium remained at 50
TL/MT (equivalent to $13/MT). The GOT is continuing to provide different benefits to farmers under
the umbrella of soil analysis, diesel, and fertilizer (Table 3).
Fertilizer prices in Turkey fluctuate in parallel with currency fluctuations. According to the fertilizer
industry, farmers in Turkey use a total of about 5.5 MMT of chemical fertilizer in a year, which the
industry thinks should be at 8.5 MMT. The organic matter component of soil is about 1.5 percent,
which they think should be 3.5 percent. In the last two years, organic-mineral fertilizers have been
becoming more popular among the farmers after some restrictions were put in place by the government
on the sales of ammonium nitrate based fertilizer.
Table 3: Government support program for wheat (TL/MT)
Turkey: Government support for wheat producers
Year Certified seed (TL/ha) Premium
(TL/Ton)
Soil analysis
(TL/ha)
Diesel
(TL/ha)
Fertilizer
(TL/ha)
2009 50 45 22.5 29.3 38.3
2010 50 50 25 32.5 42.5
2011 60 50 25 37.5 47.5
2012 60 50 25 40 50
2013 75 50 25 43 55
2014 75 50 25 46 60
2015 85 50 25 48.5 66
2016 85 50 110*
2017 85 50 8 130 40
2018 85 50 8 150 40 Source: Turkish Official Gazette
* The GOT paid 110 TL for these three categories combined in 2016.
As the governmental authority on the grain market, the Turkish Grain Board (TMO) was an active
player in the wheat market in MY 2017/18. TMO announced 2017 grain intervention prices on July 13,
2017. TMO has procured grain in different ways, such as at commodity exchanges and licensed
warehouses with its own branches spread across different points in Turkey. They announced the
intervention price for Anatolian Hard Red Milling Wheat (AKS) at 940 TL/MT ($314/MT), and 1000
TL/MT ($346/MT) for durum wheat. Prices which are given in the table below differed up to 5 percent
more, according to quality, which has been the case since 2015. TMO procured about 2 MMT of wheat
in MY 2017/18, and in MY 2016/17, they procured 2.6 MMT.
Table 4: TMO Grain procurement between June 2017 and February 2018
TMO Grain procurement from June 2016 to February 2017
Type of Grain Durum
Wheat
Milling
Wheat
Barley Rye Oat Corn Paddy
Rice
Quantity (thousand
MT) 685 1,360 - - - 205 -
Source: Turkish Official Gazette

Turkey Grain and Feed Annual Report 2018 8
The GOT also gives support for fertilizer, gasoline, certified seed usage, and soil analysis – rates are
similar with last year, except fuel has increased (Table 3). Considering the depreciation of the Turkish
Lira against the U.S. Dollar, intervention prices in terms of value in dollars, of TMO decreased from
$303 last year to $268 in MY 2017/18 (Table 5).
Table 5: Historic TMO Wheat Intervention Price and Government Premiums
Turkey: TMO milling wheat intervention prices and wheat premiums (TL/MT)
Year Intervention
price
Premium (Same as Table
3)
2007 425 45
2008 500 45
2009 500 45
2010 550 50
2011 605 50
2012 665 50
2013 720 50
2014 - 50
2015 862 50
2016 910 50
2016 (As date of July 2016, 1 USD Dollar was 3
TL)
$303 $16.6
2017
(As date of July 2017, 1 USD Dollar was 3.5 TL)
940 50
$268* $14*
Source: Turkish Grain Board (TMO) www.tmo.gov.tr
Barley
Post revised the production forecast down to 6.3 MT of barley in MY 2017/18. The decrease is primarily
due to late rains in springtime, which were not enough to eliminate winter drought effects in a few areas
in Central Anatolia.
MY 2018/19 barley planting is projected to grow to 3.55 million hectares, up about 5 percent from MY
2017/18. The barley area increased considerably in unirrigated areas of the Central Anatolia region
compared to last year. Good returns on barley impacted farmers’ planting decisions. In the other
important area for barley, such as the Southeast/GAP region, the planted area remained the same.
Barley production for 2018/19 is forecast at 6.75 MMT, up seven percent compared to the previous year,
due to increasing planting area, assuming sufficient rain and favorable conditions from April to June.
Barley fields are generally unirrigated and yields are directly linked to rainfall. So far, barley
germination and plant development is favorable, except for a few fields in Southeast/GAP Region,
which were affected by winter drought.
Corn

Turkey Grain and Feed Annual Report 2018 9
In MY 2018/19, Turkish corn planting area forecast is down about five percent to 530,000 hectares and
production to 5.1 MMT, assuming sufficient rain and favorable conditions, similar with the long term
yield average. MY 2018/19 corn planting in Turkey has not started yet. Good returns on alternative
crops, such as cotton, as well as the recent relatively low world corn price and low domestic market corn
price are expected to lead to decreased corn planting.
Second crop corn is a common product in Southeast Anatolia, especially in Sanliurfa and Mardin
regions. Some farmers in Harran, in the Southeast Region, who used to plant milling wheat as a first
crop and corn as a second crop, have switched back to cotton instead of double cropping. Due to
increased cotton planted area against corn in the Southeast Region, especially for the last two years, the
second crop corn harvest expectation is also down. Therefore, first crop corn planted area will be the
same in MY 2018/19, but the second crop corn planted area is expected to decrease. The decrease in
total corn planting is projected at about 20,000 ha in MY 2018/19.
Corn area was 550,000 ha and production was 5.4 MMT in MY 2017/18, down slightly from the
previous year, mainly due to the decrease in second crop area. High returns for cotton and oilseeds, as
well as a significant increase in the production support payment for those crops, are impacting planting
decisions.
First crop corn planting is common in the Cukurova, Aegean, and Marmara regions. First crop corn
planting started in February 2018. The high returns for cotton, peanuts, and vegetables led corn farmers
to plant these instead of corn; hence there will be a two percent decrease in corn area in Cukurova. In
some irrigated areas of the Aegean region, corn will also lose some planted area to cotton, though this
was partly compensated for by the increase in corn production in Central Anatolia.
Rice
Post forecasts paddy rice production at 806,000 MT in MY 2018/19 with 1,000 ha increased planting
area. Planting area is projected to be with 100,000 ha, up one percent compared to the previous year, due
to sufficient precipitation.
MY 2017/18 total rice area and production are estimated at 99,000 hectares and 776,000 metric tons, up
slightly from previous year due to yield increases with new varieties.
Rice planting will start at the end of April 2018 and finish by the end of the next month. Edirne
Province in Thrace Region produces more than 50 percent of the country’s paddy rice production.
According to the Turkish State Water Authority, the cumulative rainfall from October 2017 to January
2018 in the Thrace region was 409.6 mm, while the average level for that region is 394.0 mm. This
amount is three percent higher than the national historical average for Thrace region, and it is 18 percent
higher than last year. Sufficient precipitation and high water levels in the dams have allowed farmers to
plant more rice, but the exact numbers will be clear after May.
Rice yields depend on rainfall at the end of August and early September. The harvest normally begins in
September and ends in October. In Central Anatolia, Cankiri and Corum regions produce nearly a
quarter of Turkey’s paddy rice production. Osmancik and Baldo varieties are the well-known varieties
among farmers and consumers and have dominated the region for many years. However, new varieties

Turkey Grain and Feed Annual Report 2018 10
such as Cammeo, Galileo, Ronaldo, and Luna are rising in popularity because of high yields and high
milling rates (Table 33). Farmers are taking advantage of opportunities to increase yields, and they have
begun trying different varieties. Despite similar shapes of grain, the new varieties have different cooking
and flavor characteristics. According to market sources, some farmers faced marketing issues with new
varieties due to the fact that they have not gained recognition yet by the public.
Table 6: Average yield and Milling Rate by varieties
Paddy Rice Varieties Yield MT/ha Milling Rate
Baldo 6.5/7.0 %55
Cammeo 7.0/7.5 %57
Osmancik (inc; Yatkin, Efe, Gala) 7.5/8.5 %60
Ronaldo 7.5/8.5 %60
Luna 9.5/10 %68 Sources: Industry Sources
CONSUMPTION
Wheat
Turkish domestic wheat consumption is forecast at 17.8 MMT in MY 2018/19, up 200,000 MT from the
2017/18 year. The majority of wheat is utilized for human consumption as flour and pasta (some of
which is exported), with the rest of the wheat used as feed. Seed and industrial consumption remains the
same, so the increase in consumption is in the food and feed use sector, which typically varies inversely
to the amount of wheat produced and quality expectations. For example, in high production years, there
is abundant low-quality feed wheat. Consumption for food usage is forecast to increase in parallel with
population growth and the return of high numbers of tourists to Turkey in MY 2018/19.
Post revised the wheat consumption forecast down to 17.6 MMT in marketing year 2017/18, due to
decreasing feed wheat usage. Availability of feed wheat was limited compared to the previous year,
because of the general characteristic of crop.
There are several factors impacting wheat products consumption in Turkey. According to Turkish
National Statistics, the population growth rate of Turkey is 1.2 percent and median age is 31. Turkey
has a population of 80 million and also is currently hosting more than three million refugees. In 2016,
the Turkish tourism sector struggled due to regional, political, and economic instability, but is springing
back now and trying to make up for losses in recent years. According to Turkey’s Ministry of Culture
and Tourism, the number of foreigners visiting Turkey dropped about 30 percent from 36 million in
2015 to 25 million in 2016. The sector partly recovered in 2017, as the number of foreigners visiting
Turkey increased by 27 percent to 32 million. The sector aims to again reach 2015 levels and expects 36
million in 2018. In MY 2018/19, despite decreasing the consumption trend of bread among high income
consumers in metropolitan cities, total food, seed and industrial (FSI) consumption forecast is expected
to increase to 16.8 MMT, up 100,000 MT from the 2017/18 year.
Bread, an iconic symbol of nourishment in Turkey, is still the staple food for the general population.
Turkey produces about 100 million 250-gram loaves of fresh bread every day. In major cities like

Turkey Grain and Feed Annual Report 2018 11
Istanbul, Ankara, and Izmir, the diet has shifted from bread consumption to protein-based diets, but
bread still carries a lot of cultural value in Turkish society and that is very hard to change, even with
changing lifestyles and diets. Additionally, sourdough bread and gluten-free products are becoming
popular among higher income consumers in Turkey.
A goal of national self-sufficiency in wheat production and stability of bread prices are always hot topics
and indicators among politicians for performance of agricultural policies. Turkish government
administrations carry out special policies on wheat, such as providing agricultural subsidies, intervention
prices, and protective high tariffs. All across the country there are bread factories owned by
municipalities, which supply consumers with low-priced bread. According to estimates, municipalities
produce around 10 million loaves every day in Turkey, which is about ten percent of total bread
production.
Turkey is a major wheat products producer in the world. In addition to high domestic consumption,
increasing exports are the driving force of the wheat products industry. Turkey produces more than 21
million MT of a wide range of wheat products and exports wheat flour to 160 countries all over the
world. There are 730 active flour factories, with a total of 30 MMT/year production capacities.
Capacity use rate is around 50 percent. Due to competition, economies of scale, low profitability, and
other sectoral reasons, consolidation among them is anticipated in the future.
According to industry sources, wheat flour exporters are requesting government assistance on a number
of industry issues which are hindering exports. One is the new $60/MT extra duty on Turkish flour that
the Iraqi government started to impose in January 2018. This is putting Turkish flour at a disadvantage
against competitors such as Iran. Additionally, through the help of a free trade agreement with Turkey,
Bosnian-origin wheat flour is gaining market share in Turkey because of competitive prices. Turkey
imported a record 105,000 MT of wheat flour from Bosnia in 2017. The industry would like an
amendment in the free trade agreement to put quotas on Bosnian flour imports.
According to the Turkish pasta manufacturing industry, pasta consumption was about eight kilograms
per person in 2016. Durum wheat demand has been very strong due to high levels of pasta products
exports. There are 25 active pasta factories in Turkey with more than two MMT/year production
capacity total. Capacity use rate is over 70 percent. There are also more than 140 factories for bulgur,
biscuit/cracker, and semolina production in Turkey (Table 7).
Table 7: Wheat Products Industry Statistics
Wheat Products Industry
Type of
Product
Active
Factories
Production Capacity/ Year
(MMT)
Capacity use rate/ Year
(percent)
Wheat Flour 730 30 50
Pasta 25 2 80
Bulgur 103 1.8 65
Biscuit/Cracker 30 1.3 60
Semolina 13 0.8 75 Sources: Industry Sources
The domestic wheat flour price remained stable in MY 2017/18. The wheat CIF import price in
Marmara in February 2018 was $202/MT for 11.5 percent protein, $210/MT for 12.5 percent protein

Turkey Grain and Feed Annual Report 2018 12
and US$ 218/MT for 13.5 percent protein. The average wheat flour export price was about $310/MT in
MY 2017/18. Strong exports and TMO’s domestic sales stabilized the domestic wheat flour market
price.
Table 8: Average Wheat Flour Price at the Bandırma Commodity Exchange
WHEAT FLOUR PRICE MY 2016/17 (TL/50 kg)
Jan Feb Mar Apr
Ma
y Jun Jul Aug Sep Oct Nov Dec
201
6
64.0
9
64.2
0
64.1
5
63.4
5
63.8
1
63.8
9
65.1
1
64.6
1
65.4
0
69.1
2
66.1
9
65.8
3
201
7
67.4
8
67.5
3
66.3
6
68.5
5
68.8
3
68.8
9
69.9
8
73.3
5
68.6
0
69.8
5
67.8
1
68.3
1
201
8
68.6
7
Source: Bandırma Commodity Exchange, Turkey
TMO announced it was willing to sell up to 73,621 MT of its domestic durum wheat stocks to pasta and
semolina producers in October 2017 at a price of 1,070 TL/MT (around US$ 281/ MT), excluding VAT
and handling charges. As can be seen in Figure 2, just after TMO started selling durum wheat stocks,
the price stabilized.
Due to competitive international prices (averaging $245 /MT) delivery of imported durum wheat from
Kazakhstan, Russia, and Canada rose just after the harvest, and then durum wheat price in the domestic
market was in decline until September 2017. Durum wheat on the Konya CME was 1,106 TL/MT
($290/MT) in February 2018, compared to 970 TL/MT ($262/MT) in February 2017 (1 US$=3.8 TL
February, 2018 and 1 US$=3.7 TL February, 2017).
Figure 2: Average Durum Wheat Price at Turkish Commodity Exchange (TL/MT)
Source: Price average from multiple commodity exchanges in Turkey
The Polatli CME is the main commodity market exchange for red milling wheat in Turkey. High
quality red milling wheat on the Polatli CME was 1,110 TL/MT ($301/MT) in February 2017 and was
1,106 TL/MT (US$290/MT) in February 2018. Average red milling wheat price at the main commodity
exchanges was around 1,040 TL/MT (US$273/MT) in February 2018.

Turkey Grain and Feed Annual Report 2018 13
The price differences between milling and durum wheat were very narrow during MY 2017/18. Durum
wheat normally has lower yields but higher prices compared to milling wheat, but this was not the case
in MY 2017/18. This will lead increased milling wheat production and decreased durum wheat
production in MY 2018/19.
Turkish wheat prices can be followed by using the major Commodity Exchanges’ websites:
1) http://www.polatliborsa.org.tr/; 2) http://www.ktb.org.tr 3) http://www.adanatb.org.tr/
4) http://www.esktb.org.tr/ 5) Also TMO’s Daily Market and Commodity Exchange Prices Bulletin
states recent commodity prices.
Figure 3: Average Red Milling Wheat Price at Commodity Exchanges in Turkey
Source: Price average from multiple commodity exchanges in Turkey
Table 9: Turkey Wheat Selling Price of TMO-purchased Grains after the harvest in MY 2017/18.
TMO selling prices
Type
Selling Price (TL/MT); and Price in $USD/MT, using exchange rate at the time of
price; Excluding VAT and handling charges
October ‘17 November ‘17 December ‘17 January ‘18 February ‘18
Anatolian Hard
White Wheat
940-995 940-995 960-999 980/1010 960/1100
$249-$264 $239/$253 $255/$265 $261/$269 $252/$290
Anatolian Hard
Red Wheat
940-995 940-995 960-999 980/1010 955/1025
$249-$264 $239/$253 $255/$265 $261/$269 $251/$270
Durum 1055-1070 1060-1075 1065/1080 1080/1100 1045/1115
$280-$284 $270/$273 $282/$286 $288/$293 $275/$293
Feed Wheat 880 880 885 890 900
$233 $224 $234 $237 $237
Imported
Milling Wheat
985 1020 1020 1020 1020
$261 $259 $271 $272 $268 Source: Turkish Grain Board; www.tmo.gov.tr

Turkey Grain and Feed Annual Report 2018 14
Barley
Barley consumption in Turkey in MY 2017/18 is estimated at 6.5 MMT tons, up 20 percent from MY
2016/17, due to high production compared to the previous year. Barley consumption in Turkey in
2018/19 is projected at 6.8 MMT tons, due to a better production forecast, assuming a competitive
domestic price increases usage in feed.
There are two major sectors using barley in Turkey. One is the malting and beer industry and the other
is the feed sector. Malting barley consumption, which is estimated at 900,000 MT, has been steady in
recent years. Barley traditionally has been preferred as a feed grain in Turkey, especially for ruminants,
and barley consumption for feed use is directly linked with price. Feed companies can compensate for
any reductions in barley availability by using residual and waste products from the food industries, such
as bran. However, the feed sector continues to grow, and this also drives continued demand for barley.
It is expected that TMO’s sales and the elimination of the tariff for barley until the harvest will put
pressure on barley prices.
Corn
There are two main users of corn in Turkey: the feed industry and the corn starch industry. Corn
consumption moves in line with developments in the domestic feed sector. The Turkish feed sector has
successfully continued to grow steadily in the last decade. MY 2017/18 consumption is projected to be
about 7.27 MMT and will increase to 7.45 MMT in MY 2018/19, due to strong demand from feed
sector.
The starch based sugar industry is controlled by the government through production quota allocations,
which also govern sugar production by the sugar beet sector. The total production capacity of the starch
based sugar industry is about 1.5 MMT. The sector typically has used 900,000 MT of domestic corn
annually. The Turkish government announces quotas each year, and is expected to decrease the quota
allocations for starch based sugar in the coming days. For detailed information, please see Turkey Sugar
Annual Report 2018 by searching here. A possible decrease in corn use for starch based sugar
production will likely reduce domestic corn consumption overall in Turkey, though it may be partially
offset by production in other corn products like corn starch, and the amount of starch based sugar
produced for export.
Feed Sector
Turkey’s over 80 million person population and 80 percent urbanization rate continues to grow. This
drives an increase in the use of commercial feed for animal production as opposed to on-farm feeding
for rural households. In addition to the movement of people from rural to urban areas at a rapid pace,
rising household income has increased the demand for protein-based food in Turkey for many years.
Broiler meat is very popular and remains a more affordable alternative compared to red meat, which is
very expensive in Turkey. Tourism numbers have also begun to resume in 2017, which also drives the
increase in consumption.
Turkey Grain and Feed Annual Report 2018 15
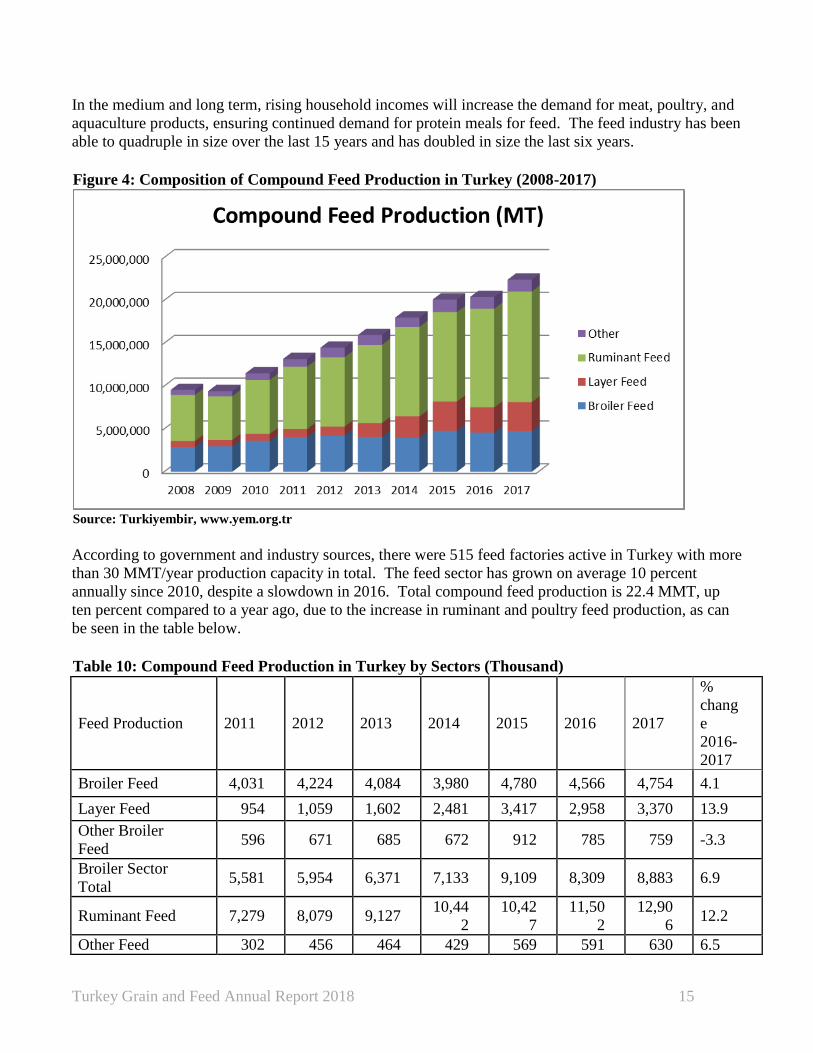
In the medium and long term, rising household incomes will increase the demand for meat, poultry, and
aquaculture products, ensuring continued demand for protein meals for feed. The feed industry has been
able to quadruple in size over the last 15 years and has doubled in size the last six years.
Figure 4: Composition of Compound Feed Production in Turkey (2008-2017)
Source: Turkiyembir, www.yem.org.tr
According to government and industry sources, there were 515 feed factories active in Turkey with more
than 30 MMT/year production capacity in total. The feed sector has grown on average 10 percent
annually since 2010, despite a slowdown in 2016. Total compound feed production is 22.4 MMT, up
ten percent compared to a year ago, due to the increase in ruminant and poultry feed production, as can
be seen in the table below.
Table 10: Compound Feed Production in Turkey by Sectors (Thousand)
Feed Production 2011 2012 2013 2014 2015 2016 2017
%
chang
e
2016-
2017
Broiler Feed 4,031 4,224 4,084 3,980 4,780 4,566 4,754 4.1
Layer Feed 954 1,059 1,602 2,481 3,417 2,958 3,370 13.9
Other Broiler
Feed 596 671 685 672 912 785 759 -3.3
Broiler Sector
Total 5,581 5,954 6,371 7,133 9,109 8,309 8,883 6.9
Ruminant Feed 7,279 8,079 9,127 10,44
2
10,42
7
11,50
2
12,90
6 12.2
Other Feed 302 456 464 429 569 591 630 6.5
Turkey Grain and Feed Annual Report 2018 16
Total 13,16
2
14,48
9
15,96
2
18,00
4
20,10
5
20,40
2
22,41
9 9.9
Source: Turkiyembir, www.yem.org.tr
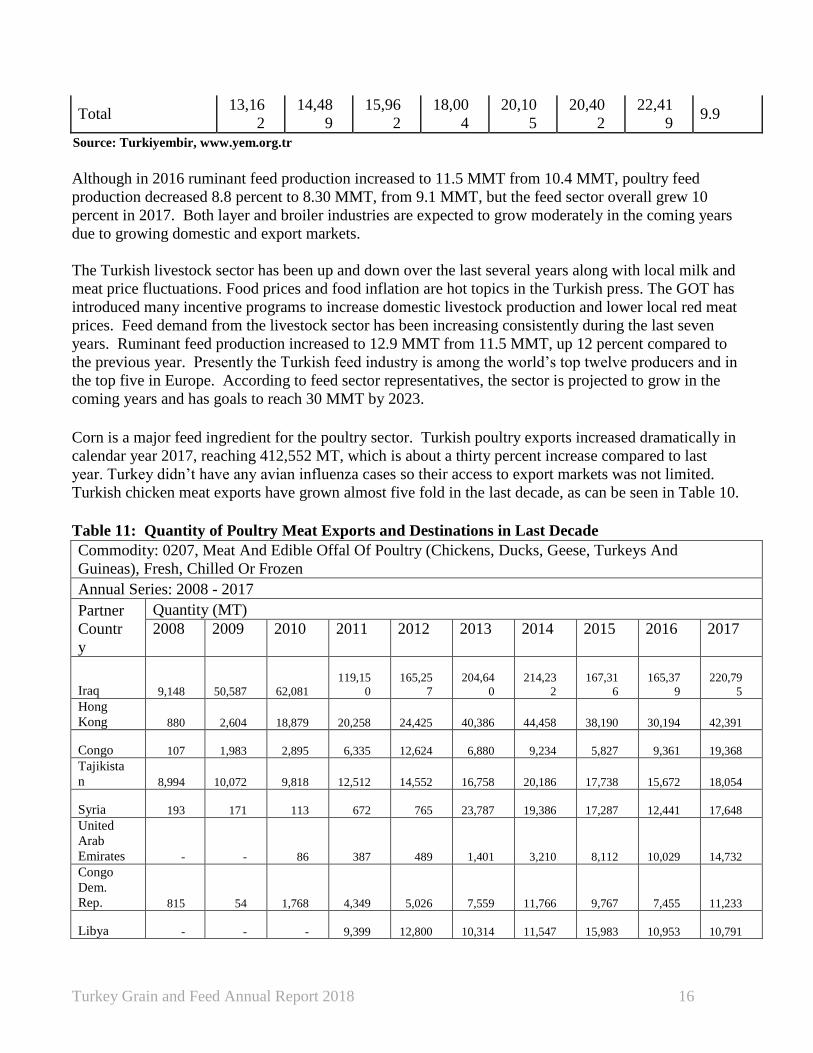
Although in 2016 ruminant feed production increased to 11.5 MMT from 10.4 MMT, poultry feed
production decreased 8.8 percent to 8.30 MMT, from 9.1 MMT, but the feed sector overall grew 10
percent in 2017. Both layer and broiler industries are expected to grow moderately in the coming years
due to growing domestic and export markets.
The Turkish livestock sector has been up and down over the last several years along with local milk and
meat price fluctuations. Food prices and food inflation are hot topics in the Turkish press. The GOT has
introduced many incentive programs to increase domestic livestock production and lower local red meat
prices. Feed demand from the livestock sector has been increasing consistently during the last seven
years. Ruminant feed production increased to 12.9 MMT from 11.5 MMT, up 12 percent compared to
the previous year. Presently the Turkish feed industry is among the world’s top twelve producers and in
the top five in Europe. According to feed sector representatives, the sector is projected to grow in the
coming years and has goals to reach 30 MMT by 2023.
Corn is a major feed ingredient for the poultry sector. Turkish poultry exports increased dramatically in
calendar year 2017, reaching 412,552 MT, which is about a thirty percent increase compared to last
year. Turkey didn’t have any avian influenza cases so their access to export markets was not limited.
Turkish chicken meat exports have grown almost five fold in the last decade, as can be seen in Table 10.
Table 11: Quantity of Poultry Meat Exports and Destinations in Last Decade
Commodity: 0207, Meat And Edible Offal Of Poultry (Chickens, Ducks, Geese, Turkeys And
Guineas), Fresh, Chilled Or Frozen
Annual Series: 2008 - 2017
Partner
Countr
y
Quantity (MT)
2008
2009
2010
2011
2012
2013
2014
2015
2016
2017
Iraq
9,148
50,587
62,081
119,15
0
165,25
7
204,64
0
214,23
2
167,31
6
165,37
9
220,79
5
Hong
Kong
880
2,604
18,879
20,258
24,425
40,386
44,458
38,190
30,194
42,391
Congo
107
1,983
2,895
6,335
12,624
6,880
9,234
5,827
9,361
19,368
Tajikista
n
8,994
10,072
9,818
12,512
14,552
16,758
20,186
17,738
15,672
18,054
Syria
193
171
113
672
765
23,787
19,386
17,287
12,441
17,648
United
Arab
Emirates -
-
86
387
489
1,401
3,210
8,112
10,029
14,732
Congo
Dem.
Rep.
815
54
1,768
4,349
5,026
7,559
11,766
9,767
7,455
11,233
Libya -
-
-
9,399
12,800
10,314
11,547
15,983
10,953
10,791

Turkey Grain and Feed Annual Report 2018 17
Other
59,71
3
49,173
43,715
63,242
68,590
51,911
70,493
57,903
57,558
57,540
Total
79,85
0
114,64
4
139,35
5
236,30
4
304,52
8
363,63
6
404,51
2
338,12
3
319,04
2 412,55
2
Source: Global Trade Atlas
Of Turkey’s broiler exports, more than half are to neighboring countries. The main destinations were
Iraq (220,795 MT), Hong Kong (42,391 MT), Congo (19,368 MT), Tajikistan (18,054 MT), and Syria
(17,648 MT) in 2017.
Egg production on modern farms has doubled in the last ten years, as a result of increases in both
domestic egg consumption and exports. Although it declined in 2015 to 17.2 billion pieces (eggs) due to
interruptions in exports, total production reached 18.5 billion pieces in 2016. With increasing domestic
demand and dynamic export capacity, it is projected to continue to grow in the coming years. Domestic
consumption of eggs was estimated to have increased to 200 pieces per person in 2016. The industry is
continuing promotion programs to reach the European average consumption of 250 eggs per year.
Turkey continues to export about twenty-five percent of its egg production.
The price changes for feed move in parallel with U.S. Dollar, since many of the feed materials are
imported. For instance, broiler feed price was 1,380 TL/MT ($368) in January 2017, and it was 1440
TL/MT ($380) in January 2018. The feed has been steadily increasing, in terms of Turkish Lira, since
January 2016. The GOT has taken measures to make feed more affordable by removing the value added
tax from 8 percent to 0 percent on most of feed materials, except DDGS and corn gluten meal. The feed
sector and farmers continue to struggle with high feed prices, which are up 25 percent in the last two
years. This is mainly due to the devaluation of the Turkish Lira and increased world price of
commodities, as the sector partially depends on imported raw materials.
Figure 5: Average Compound Feed Prices in Turkey, By Type of Feed
Source: Turkiyembir, www.yem.org.tr

Turkey Grain and Feed Annual Report 2018 18
Table 12: Recent Feed Prices by Month in Turkey (TL/MT)
Turkey: Feed Price (TL/MT)
Apr-
17
May-
17
Jun-
17
Jul-
17
Aug-
17
Sep-
17
Oct-
17
Nov-
17
Dec-
17
Jan-
18
Broiler Feed
142
0 1420
140
0
140
0
135
0
130
0
132
0
138
0
144
0
144
0
Layer Feed
124
0 1240
124
0
124
0
120
0
115
0
117
0
123
0
129
0
125
0
Dairy Cattle
Feed 970 970 970 970 970 920 960
102
0
106
0
106
0
Beef Cattle
feed 900 900 900 900 900 860 900 960
100
0
100
0
Source: Turkiyembir, www.yem.org.tr
The feed sector in Turkey is dynamic and always seeks new alternatives for better rations. Commodities
under HS code 23, such as meals and brans, including DDGS, are increasingly popular in the feed sector
(See Table below) due to high nutritional content, relatively low duty tax, and a competitive price in
2017. Turkey imported 6.6 MMT of feed materials in 2017, up 1.6 MMT compared to 2016. Turkey
imported 1.7 MMT of wheat bran, up 20 percent compared to the previous year. In an effort to tackle
food price inflation, the GOT reduced the wheat bran tariff from 5 percent to zero percent in November
2017.
Table 13: Imports of Residues and Byproducts from Food Industries to Turkey
HS Commodity: 23, “Residues And Waste From The Food Industries; Prepared Animal Feed”
Commodity Description Quantity (MT)
%
Change
2015 2016 2017 2016-17
2303
Residues Of Starch Mfr Or Sugar Mfr Or
Brewing Etc 944,682 1,676,604 2,413,075 44
2302
Bran, Sharps Etc From Working Cereals &
Leg Plants 1,291,415 1,516,107 1,997,132 31
2306
Oilcake EtcNesoi, From Veg Fats & Oils
Nesoi 950,507 921,336 1,068,214 16
2304
Soybean Oilcake &Oth Solid Residue,
Wh/Not Ground 417,203 664,401 759,202 14
2301
Flour, Meal Etc Of Meat Etc, Not For
Human; 109,703 146,508 141,080 -4
2309 Preparations Used In Animal Feeding 30,373 32,961 124,414 77
2308
Veg Material, Waste Etc For Feeding
Animals Nesoi 75,098 86,908 90,246 4
HS 23
(total)
Food Industry Residues & Waste; Prep
Animal Feed 3,818,982 5,047,044 6,593,363 31

Turkey Grain and Feed Annual Report 2018 19
Source: GTA
Feed companies change their feed ratios to obtain the protein amounts needed in their feed products, and
imported residues are becoming more popular as a substitute. Imported Residues and byproducts feed
ratio has tripled since 2010, as can be in the figure below. Oilseeds and their byproducts are also widely
used in the feed sector. For detailed information, please see Turkey Oilseeds and Products Annual
Report.
Figure 6: Imports of Residues and Byproducts from Food Industries to Turkey by HS Code
Source: Turkiyembir, www.yem.org.tr
Rice
Rice is irreplaceable for making pilaf, one of the most common dishes in Turkey. Turkish consumers
prefer the well-known medium grain varieties of Baldo, Osmancik, and Calrose. According to market
sources, when Turkish consumers read the names of these varieties on the package, they feel confident
buying them. Long grain varieties are demanded by the food service sector in recent years, due to their
competitive prices.
Rice consumption in Turkey in MY 2018/19 is forecast at 790,000 tons, and remains the same as the
2017/18 estimate. Demand is driven by the growing population and increasing numbers of tourists but
growth will be offset by reductions in per capita consumption by the domestic population because of
perceptions of rice by some as less healthy and inconsistent quality.

Turkey Grain and Feed Annual Report 2018 20
The sector is optimistic about the upcoming tourism season after a tough two years with a 30 percent
decrease in tourist numbers since 2016. According to booking and reservation numbers, tourism
expectations are better for the coming year. However, these gains are offset by lower demand than
usual from the retail and food service sector due to some ongoing negative perceptions from consumers
about rice as an unhealthy food in recent years. The other ongoing issue for consumers is blended
imported rice. Some rice companies have been blending lower priced imported rice, such as Indian or
Chinese origin, with domestic varieties to have better retail prices. This creates some consistency and
quality problems with the rice when cooking, which impacts consumers’ perception about rice in
general, and hurts the industry as a whole.
TRADE
Wheat
According to the official statistics of Turkey, during the first eight months of MY 2017/18, total wheat
imports were 3.1 MMT. For MY 2017/18, wheat imports into Turkey are expected to reach 5.5 MMT,
due to stable demand from wheat product producers.
Russia (2,259,892 MT), Lithuania (493,681 MT) and Mexico (324,118 MT) were the largest wheat
suppliers for Turkey in MY 2016/17. Russia is the main supplier of milling wheat to Turkey with 2.2
MMT in MY 2016/17 so far, followed by Lithuania with 200,000 MT of milling wheat during the same
period. Turkey imported 3.1 MMT of durum wheat during the first eight months of MY 2017/18.
According to market sources, almost 1 MMT of wheat is also on its way to Turkey.
Table 14: Turkish Wheat Imports (Origin)
Countries MY 2014/15 MY 2015/16 MY 2016/17 MY 2017/18*
Russia 4,022,474 2,875,740 2,259,892 2,222,252
Lithuania 237,039 422,726 493,681 200,417
Ukraine 246,934 150,768 169,464 197,071
Canada 88,104 168,046 144,499 148,084
Kazakhstan 34,527 45,064 87,424 137,219
Mexico 302,630 117,043 324,118 1,459
Germany 24,636 127,380 255,840 0
Other 826,206 119,099 629,390 250,567
Total 5,782,550 4,025,866 4,364,308 3,157,069*
* June 2017-December 2017
Source: Turkish Statistics Institute, does not include transshipments
For MY 2017/18, wheat exports (including wheat products, such as flour) from Turkey are expected to
be 6.5 MMT, due to strong sales into neighboring countries and African countries in the first seven
months of the marketing year.

Turkey Grain and Feed Annual Report 2018 21
For MY 2018/19, total wheat exports from Turkey, including wheat products, are forecast at 6 MMT,
down 500,000 MT from 2017/18, due to ongoing issues with neighboring countries which complicate
trade, such as financial issues with Iraqi importers and Iraqi governments. The Iraqi government has
started to impose an extra $60 per MT as a duty on Turkish flour.
Within the scope of a set of measures to fight rising food inflation in Turkey, the Turkish government
reduced the import tariff on wheat, barley and corn from 130 percent to 45, 35, and 25 percent
respectively, according to a decree published in the Official Gazette on June 28, 2017.
TMO was very active with their more than 2 MMT of wheat stocks in MY 2017/18. TMO opened
tenders after the harvest for 336,000 MT of wheat in order to supply high quality wheat to domestic
market. The wheat was bought under a zero tariff quota through a cabinet decision. In contrast to their
actions in recent years, the Turkish Grain Board (TMO) did not sell any products to exporters within the
scope of the Inward Processing Regime.
Table 15: Wheat foreign trade data in MY 2016/17 and MY 2017/18
TURKEY: WHEAT FOREIGN TRADE (excluding wheat products)
MONTH IMPORT IMPORT EXPORT EXPORT
MY 2016/17 MY 2017/18 MY 2016/17 MY 2017/18
(MT) (MT) (MT) (MT)
June 220,390 255,674 2 140
July 284,952 165,762 3,837 3,009
August 487,917 276,090 2,449 11,237
September 423,165 597,354 8,793 1,600
October 391,201 421,397 5,790 3,405
November 356,392 546,335 1,311 19,868
December 366,647 894,457 2,817 1,542
Sub-total (June-Dec.) 2,530,664 3,157,069 24,999 40,801
January 246,172
462
February 240,256
344
March 314,789
516
April 360,025
317
May 672,402
141
MY TOTAL 4,364,308 *5,500,000 26,779 *100,000
*forecast, does not include wheat products
Source: Turkish Statistics Institute, does not include transshipments
Turkey has ranked as the top wheat flour exporter in the world in recent years. They have access to
comparably cheap wheat from the Black Sea region and a strategic location, where Turkey acts as a hub
for trade with neighboring countries. Turkish flour exports have surged, reaching almost $1 billion in
2014 and surpassing two million metric tons, making Turkey the world’s largest exporter of flour with
more than 100 destinations in the world with the help of Turkey’s Inward Processing Regime (IPR)
policy.
Turkey Grain and Feed Annual Report 2018 22
The GOT applies high tariffs on grains to protect the domestic market. Despite considerable price
differences between domestic and international prices, there is an open door for exporters of value added
products to import inputs tariff free.
A number of Turkish agricultural exports benefit from Turkey’s IPR policy. Under the inward
processing regime, authorized by the Undersecretary for Foreign Trade, grain processors may import
wheat duty free when they register grain exports, such as wheat flour, pasta and biscuits exports. Outside
of this inward processing regime, the applied custom rate for wheat is now 45 percent. Almost all wheat
imports in MY 2017/18 have been done under the scope of the IPR with zero tariffs by wheat product
exporters.
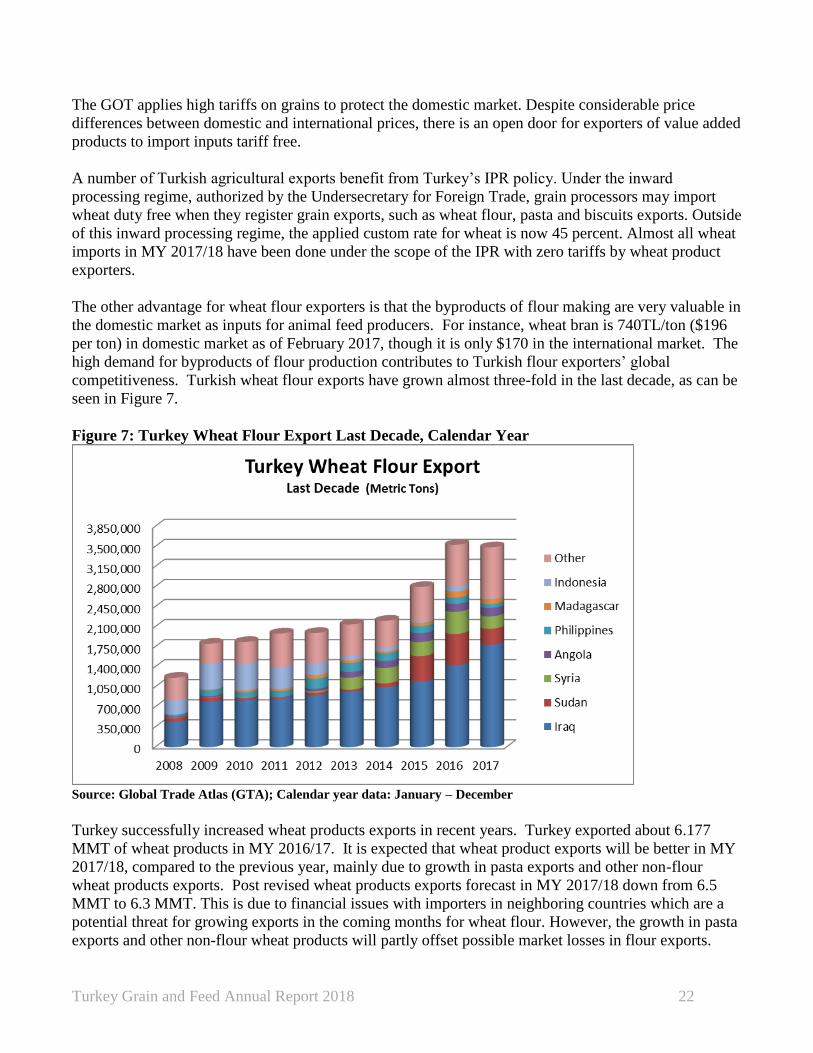
The other advantage for wheat flour exporters is that the byproducts of flour making are very valuable in
the domestic market as inputs for animal feed producers. For instance, wheat bran is 740TL/ton ($196
per ton) in domestic market as of February 2017, though it is only $170 in the international market. The
high demand for byproducts of flour production contributes to Turkish flour exporters’ global
competitiveness. Turkish wheat flour exports have grown almost three-fold in the last decade, as can be
seen in Figure 7.
Figure 7: Turkey Wheat Flour Export Last Decade, Calendar Year
Source: Global Trade Atlas (GTA); Calendar year data: January – December
Turkey successfully increased wheat products exports in recent years. Turkey exported about 6.177
MMT of wheat products in MY 2016/17. It is expected that wheat product exports will be better in MY
2017/18, compared to the previous year, mainly due to growth in pasta exports and other non-flour
wheat products exports. Post revised wheat products exports forecast in MY 2017/18 down from 6.5
MMT to 6.3 MMT. This is due to financial issues with importers in neighboring countries which are a
potential threat for growing exports in the coming months for wheat flour. However, the growth in pasta
exports and other non-flour wheat products will partly offset possible market losses in flour exports.
Turkey Grain and Feed Annual Report 2018 23
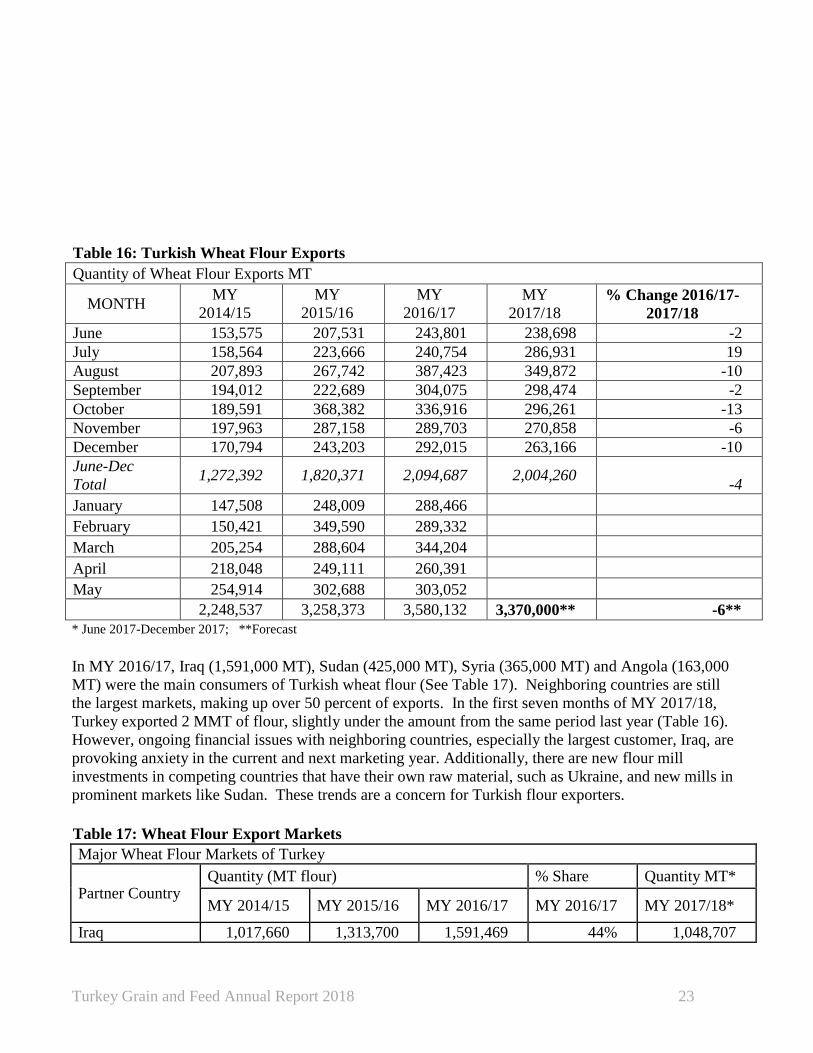
Table 16: Turkish Wheat Flour Exports
Quantity of Wheat Flour Exports MT
MONTH MY
2014/15
MY
2015/16
MY
2016/17
MY
2017/18
% Change 2016/17-
2017/18
June 153,575 207,531 243,801 238,698 -2
July 158,564 223,666 240,754 286,931 19
August 207,893 267,742 387,423 349,872 -10
September 194,012 222,689 304,075 298,474 -2
October 189,591 368,382 336,916 296,261 -13
November 197,963 287,158 289,703 270,858 -6
December 170,794 243,203 292,015 263,166 -10
June-Dec
Total 1,272,392 1,820,371 2,094,687 2,004,260
-4
January 147,508 248,009 288,466
February 150,421 349,590 289,332
March 205,254 288,604 344,204
April 218,048 249,111 260,391
May 254,914 302,688 303,052
2,248,537 3,258,373 3,580,132 3,370,000** -6**
* June 2017-December 2017; **Forecast
In MY 2016/17, Iraq (1,591,000 MT), Sudan (425,000 MT), Syria (365,000 MT) and Angola (163,000
MT) were the main consumers of Turkish wheat flour (See Table 17). Neighboring countries are still
the largest markets, making up over 50 percent of exports. In the first seven months of MY 2017/18,
Turkey exported 2 MMT of flour, slightly under the amount from the same period last year (Table 16).
However, ongoing financial issues with neighboring countries, especially the largest customer, Iraq, are
provoking anxiety in the current and next marketing year. Additionally, there are new flour mill
investments in competing countries that have their own raw material, such as Ukraine, and new mills in
prominent markets like Sudan. These trends are a concern for Turkish flour exporters.
Table 17: Wheat Flour Export Markets
Major Wheat Flour Markets of Turkey
Partner Country Quantity (MT flour) % Share Quantity MT*
MY 2014/15 MY 2015/16 MY 2016/17 MY 2016/17 MY 2017/18*
Iraq 1,017,660 1,313,700 1,591,469 44% 1,048,707

Turkey Grain and Feed Annual Report 2018 24
Syria 226,237 280,637 364,612 10% 185,474
Angola 130,671 141,773 163,630 5% 92,474
Sudan 219,609 593,351 425,076 12% 4,553
Other 654,360 928,912 1,035,347 29% 672,974
TOTAL 2,248,537 3,258,373 3,580,134 100% 2,004,182
*June 2017-December 2017; Source: Global Trade Atlas (GTA)
After flour, pasta production is an important industry in Turkey’s wheat products sector. Pasta exporters
have been expanding their markets in Africa with the help of a new amendment in 2015 to the IPR. The
amendment allows tariff-free imports of milling, wheat up to 30 percent, if producers blend milling
wheat and durum wheat in order to produce pasta for the African market. They can only sell 100 percent
durum wheat pasta in Turkey.
Table 18: Quantity of Pasta Exports from Turkey (MT of Pasta)
Quantity of Pasta Exports
Month MY 2015/16 MY 2016/17 MY 2017/18
June 63,439 84,211 87,561
July 56,270 62,128 80,561
August 52,115 83,399 96,736
September 51,070 71,222 88,021
October 60,505 69,392 92,314
November 61,965 69,151 98,012
December 71,430 64,096 103,017
Sub, Total Jun-Dec 416,794 503,599 646,222
January 56,358 74,964
February 62,332 71,882
March 77,173 83,755
April 67,556 85,833
May 66,203 97,040
MY TOTAL 746,416 917,073 1,200,000*
*forecast; Source: Global Trade Atlas (GTA)
In MY 2017/18, Benin (83,000 MT), Angola (78,400 MT) and Somalia (59,000 MT) are the main
buyers of Turkish pasta. The pasta exporters are continuing to increase exports to markets in Africa.
Table 19: Quantity of Pasta Exported in MY2015/16, 2016/17 and 2017/18
Quantity of Turkish Pasta Exported by Destination Countries (MT)
Countries MY 2015/16 MY 2016/17 MY 2017/18*
Benin 88,589 99,572 83,011
Angola 73,879 39,481 78,431
Somalia 62,648 86,903 58,903
Iraq 52,246 61,976 30,581
Japan 44,974 50,773 28,454
Turkey Grain and Feed Annual Report 2018 25
Togo 41,822 39,481 47,880
Ghana 22,634 35,587 29,418
Other 359,624 503,300 389,544
Total 746,416 917,073 646,222
*June 2017-December 2017; Source: Global Trade Atlas (GTA)
According to official figures, Turkish pasta export increased to 917,073 MT in MY 2016/17, up about
22 percent compared to MY 2015/16. Turkey is forecast to export 1,200,000 MT of pasta in MY
2017/18 due to expanded markets in African countries. All wheat product exporters are concerned
about decreasing unit prices as well decreasing profits due to high competition in the sector, and worry
that it may cause consolidations and acquisitions in the short run.
Barley
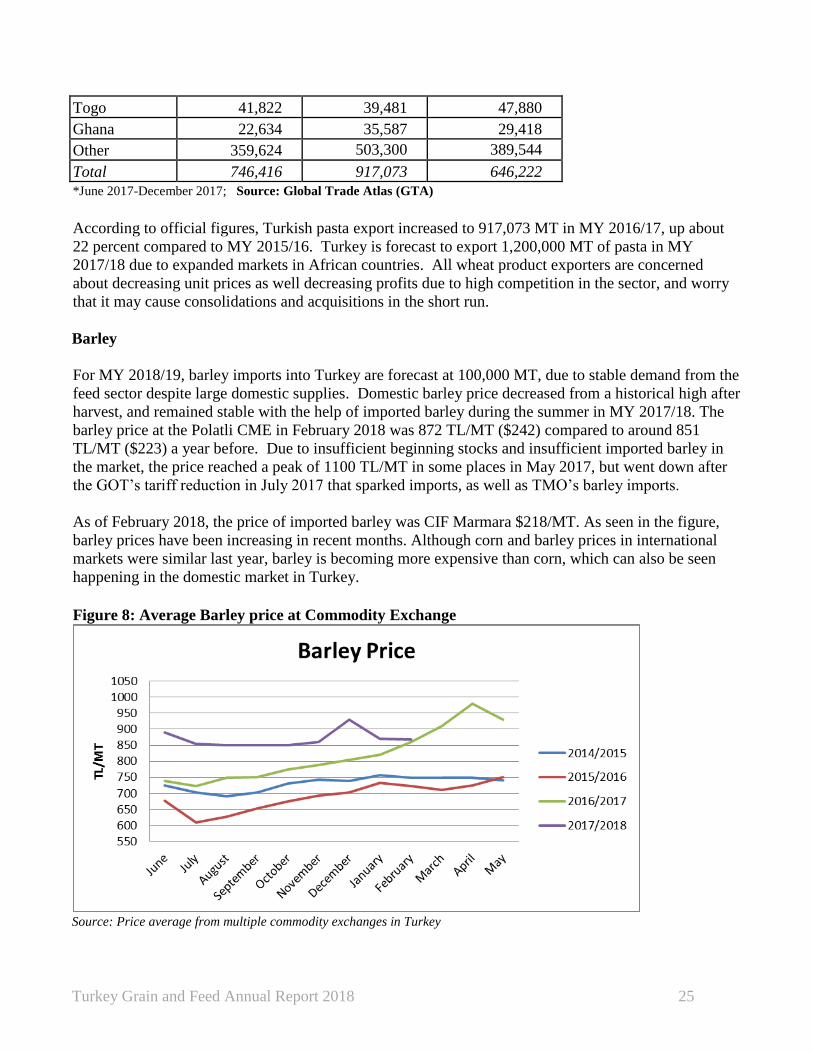
For MY 2018/19, barley imports into Turkey are forecast at 100,000 MT, due to stable demand from the
feed sector despite large domestic supplies. Domestic barley price decreased from a historical high after
harvest, and remained stable with the help of imported barley during the summer in MY 2017/18. The
barley price at the Polatli CME in February 2018 was 872 TL/MT ($242) compared to around 851
TL/MT ($223) a year before. Due to insufficient beginning stocks and insufficient imported barley in
the market, the price reached a peak of 1100 TL/MT in some places in May 2017, but went down after
the GOT’s tariff reduction in July 2017 that sparked imports, as well as TMO’s barley imports.
As of February 2018, the price of imported barley was CIF Marmara $218/MT. As seen in the figure,
barley prices have been increasing in recent months. Although corn and barley prices in international
markets were similar last year, barley is becoming more expensive than corn, which can also be seen
happening in the domestic market in Turkey.
Figure 8: Average Barley price at Commodity Exchange
Source: Price average from multiple commodity exchanges in Turkey

Turkey Grain and Feed Annual Report 2018 26
Through a governmental authorization, TMO imported 250,000 MT of barley through tenders during
MY 2017/18 in order to meet sectoral demand and regulate domestic prices. TMO has offered to sell
imported barley stocks to the domestic market starting in October 2017 at prices of 770 TL/MT and 810
TL/MT (US$ 205/MT), excluding VAT and handling charges.
Table 20: Turkey Barley Trade
TURKEY: BARLEY FOREIGN TRADE
MONTH IMPORT MY
2016/17
IMPORT MY
2017/18
EXPORT MY
2016/17
EXPORT MY
2017/18
June 3 445 0 0
July 0 107,154 0 0
August 4,234 47,161 0 0
September 0 96 0 56
October 53 56,821 0 116
November 18 24,138 784 52
December 35 12,179 4615 0
January 14,314 174 0
February 14,982 8422
March 14,322 0
April 50,850 0
May 41,648 0
MY
TOTAL 140,459 550,000*
13,995 20,000*
* Forecast
Source: Turkish Statistics Institute, does not reflect transshipments
Within the scope of a set of measures against food inflation, in decrees published in the Official Gazette,
the Turkish government reduced the import tariff on barley from 130 percent to 35 percent on June 28,
2017, and then again from 35 percent to 0 percent as of December 31, 2017 until March 2018. After
March 31, 2018, it is expected to return to 35 percent.
After a tough harvest season in MY 2016/17, Turkey started the new season with historically low
beginning stocks in MY 2017/18. According to official figures of Turkey, during the first seven months
of MY 2017/18, total barley imports were 250,000 MT.
For MY 2017/18, barley imports into Turkey are expected to reach 550,000 MT due to TMO’s imports
and the new zero tariff import opportunity for the private sector. Russia is the main supplier of barley to
Turkey with 200,000 MT in MY 2017/18 so far, followed by Ukraine with 150,000 MT of barley during
the same period.
Turkey exported about 200 MT of barley to the “Turkish Republic of Northern Cyprus”. For MY
2017/18, barley exports from Turkey are expected to reach 20,000 MT, assuming demand from
neighboring countries. For MY 2018/19, total barley exports from Turkey are forecast at 20,000 MT,
similar with the previous year.
Turkey Grain and Feed Annual Report 2018 27
Corn
Post revised the corn import forecast up to 2 MMT in marketing year 2017/18, due to the strong demand
from the feed sector, low beginning stocks, and insufficient domestic production. Last marketing year,
both TMO and the private sector had refrained from importing much corn, but this year as soon as they
could they resumed corn imports, with the private sector taking a very active role. In MY 2017/18,
contrary to the previous year, the private sector was eager to buy corn after the harvest, so TMO
procured only 205,000 MMT of corn, compared to 1.7 MMT in MY 2016/17.
For MY 2018/19, corn imports into Turkey are expected to remain high and are forecast at 2.3 MMT,
due to insufficient domestic supply and stable demand from the feed sector.
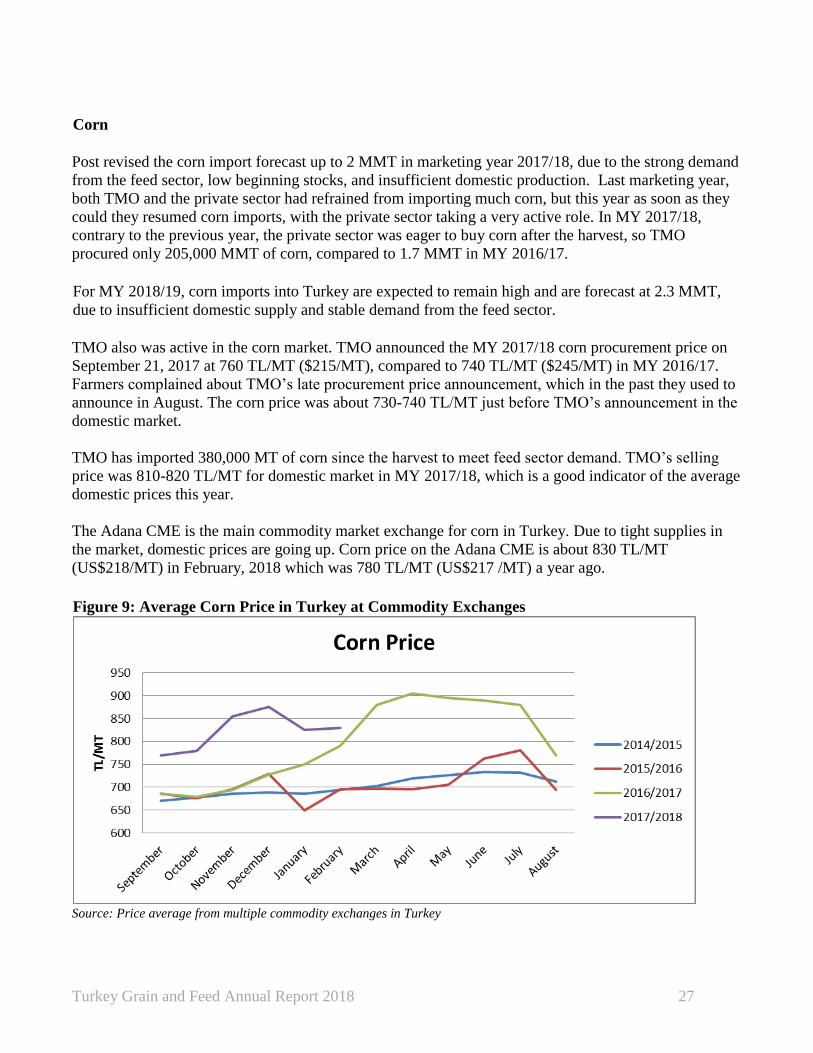
TMO also was active in the corn market. TMO announced the MY 2017/18 corn procurement price on
September 21, 2017 at 760 TL/MT ($215/MT), compared to 740 TL/MT ($245/MT) in MY 2016/17.
Farmers complained about TMO’s late procurement price announcement, which in the past they used to
announce in August. The corn price was about 730-740 TL/MT just before TMO’s announcement in the
domestic market.
TMO has imported 380,000 MT of corn since the harvest to meet feed sector demand. TMO’s selling
price was 810-820 TL/MT for domestic market in MY 2017/18, which is a good indicator of the average
domestic prices this year.
The Adana CME is the main commodity market exchange for corn in Turkey. Due to tight supplies in
the market, domestic prices are going up. Corn price on the Adana CME is about 830 TL/MT
(US$218/MT) in February, 2018 which was 780 TL/MT (US$217 /MT) a year ago.
Figure 9: Average Corn Price in Turkey at Commodity Exchanges
Source: Price average from multiple commodity exchanges in Turkey
Turkey Grain and Feed Annual Report 2018 28
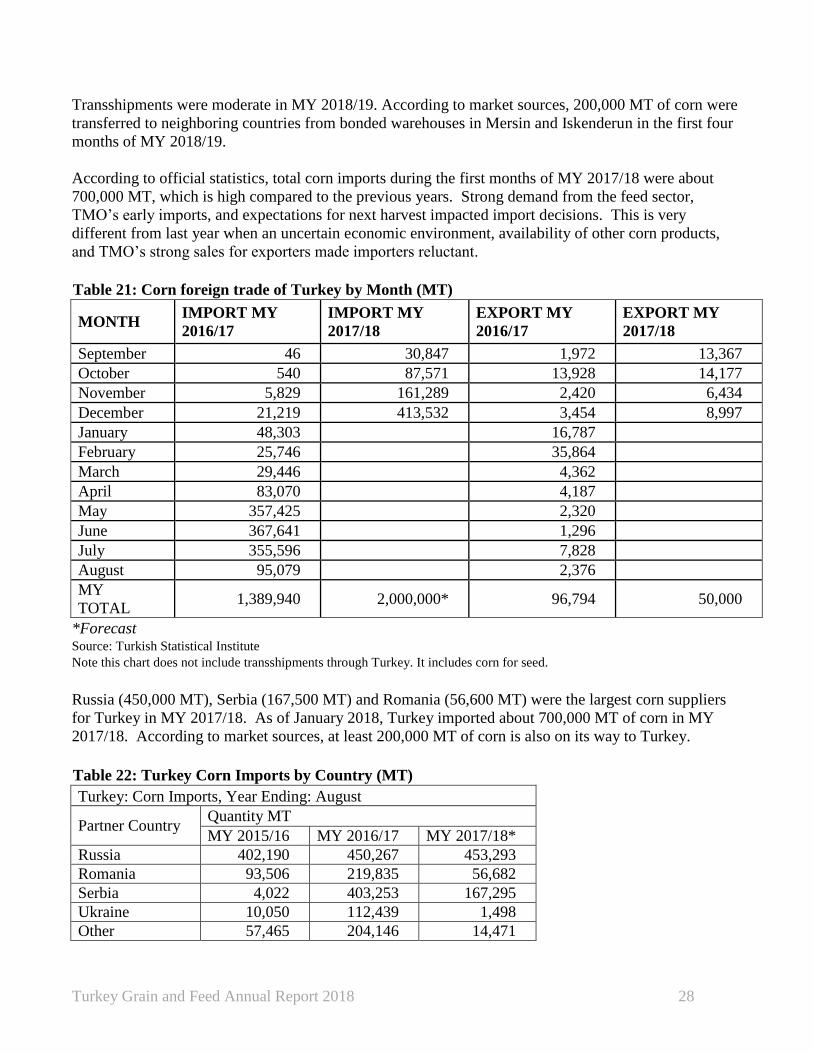
Transshipments were moderate in MY 2018/19. According to market sources, 200,000 MT of corn were
transferred to neighboring countries from bonded warehouses in Mersin and Iskenderun in the first four
months of MY 2018/19.
According to official statistics, total corn imports during the first months of MY 2017/18 were about
700,000 MT, which is high compared to the previous years. Strong demand from the feed sector,
TMO’s early imports, and expectations for next harvest impacted import decisions. This is very
different from last year when an uncertain economic environment, availability of other corn products,
and TMO’s strong sales for exporters made importers reluctant.
Table 21: Corn foreign trade of Turkey by Month (MT)
MONTH IMPORT MY
2016/17
IMPORT MY
2017/18
EXPORT MY
2016/17
EXPORT MY
2017/18
September 46 30,847 1,972 13,367
October 540 87,571 13,928 14,177
November 5,829 161,289 2,420 6,434
December 21,219 413,532 3,454 8,997
January 48,303 16,787
February 25,746 35,864
March 29,446 4,362
April 83,070 4,187
May 357,425 2,320
June 367,641 1,296
July 355,596 7,828
August 95,079 2,376
MY
TOTAL 1,389,940 2,000,000* 96,794 50,000
*Forecast Source: Turkish Statistical Institute
Note this chart does not include transshipments through Turkey. It includes corn for seed.
Russia (450,000 MT), Serbia (167,500 MT) and Romania (56,600 MT) were the largest corn suppliers
for Turkey in MY 2017/18. As of January 2018, Turkey imported about 700,000 MT of corn in MY
2017/18. According to market sources, at least 200,000 MT of corn is also on its way to Turkey.
Table 22: Turkey Corn Imports by Country (MT)
Turkey: Corn Imports, Year Ending: August
Partner Country Quantity MT
MY 2015/16 MY 2016/17 MY 2017/18*
Russia 402,190 450,267 453,293
Romania 93,506 219,835 56,682
Serbia 4,022 403,253 167,295
Ukraine 10,050 112,439 1,498
Other 57,465 204,146 14,471

Turkey Grain and Feed Annual Report 2018 29
Total 567,233 1,389,940 693,239 *September 2017-December 2017
Source: Turkish Statistical Institute, Note this chart does not include transshipments through Turkey.
According to Turkish Statistical Institute, from September 2017 to December 2017, Turkey exported
about 43,000 MT of corn, including as seeds. Main destinations were Iraq (35,688 MT) and the United
States (3,014 MT).
Table 23: Turkey Corn Exports by Country (MT) (includes seed corn)
Turkey: Corn Exports, Year Ending: August
Partner Country Quantity MT
MY 2015/16 MY 2016/17 MY 2017/18*
United States 1,102 44,619 3,014
Iraq 44,540 27,316 35,688
Germany 2,817 2,917 1,092
Italy 2,261 1,236 591
Other 16,009 20,707 2,590
Total 66,729 96,795 42,975
*September 2017-December 2017 Source: Turkish Statistical Institute
Table 24: Turkey Corn Exports by HS Codes
Turkey Export Statistics To World
Commodity: 1005, Corn (Maize) Year Ending: August
Commodity Description Quantity MT
2014/15 2015/16 2016/17
1005 Corn (Maize) Total 46,382 66,729 96,795
100590 Corn (Maize), Other Than Seed Corn 31,677 52,950 85,413
100510
Corn (Maize) Seed, Certified, Excluding Sweet
Corn 14,705 13,779 11,382 Source: Turkish Statistical Institute
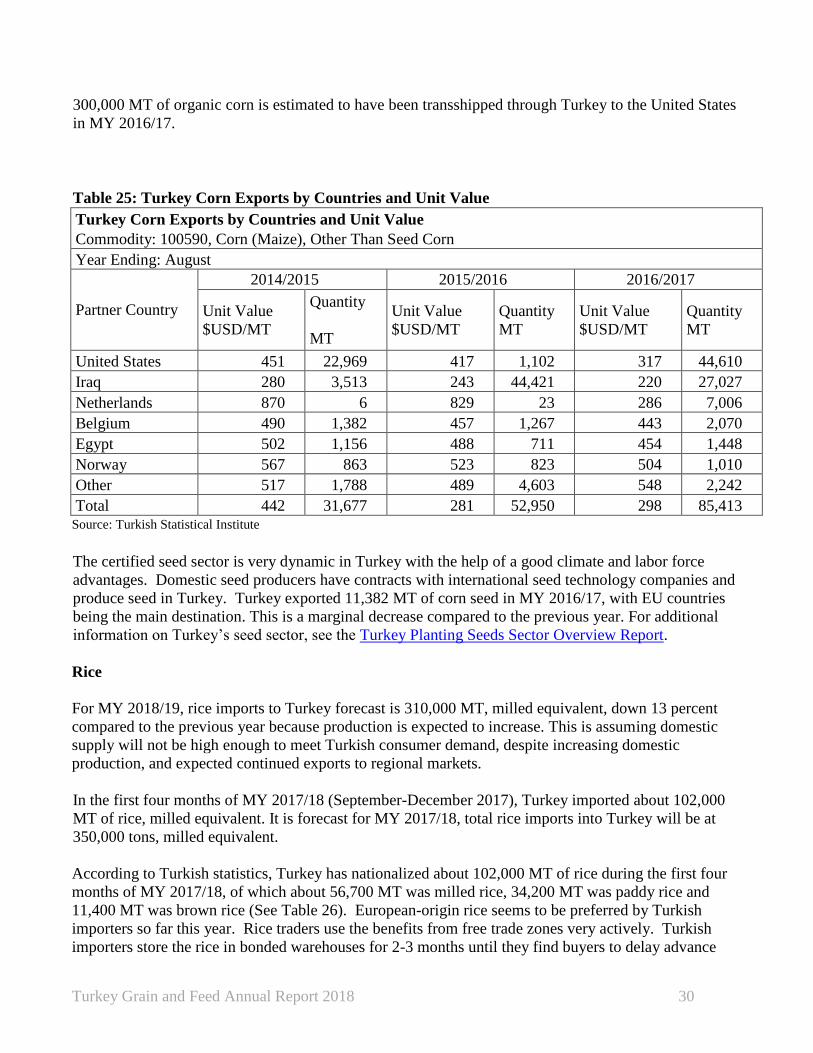
In MY 2016/17, Turkey exported about 97,000 MT of corn, of which about 11,400 MT was seed. There
is not accessible data in Turkey on organic corn production or organic corn trade. According to private
sector sources, Turkey produces around 40,000 MT of organic corn annually for export markets. Post
revised corn exports to 100,000 MT due to increased unexpected demand for corn in MY 2017/18.
For MY 2018/19, corn exports from Turkey are forecast at 100,000 MT, similar with MY 2017/18, due
to stable demand for seed and organic corn. Also Turkey is a hub for transshipments, and lots of corn is
shipped through Turkey to export markets. U.S. import data shows the scale of these transshipments;
organic corn (excluding seed) shipped from/through Turkey to the United States in MY 2016/2017
remained similar to last year at around 352,000 MT. According to Turkish export statistics, Turkey
registered 44,610 MT of corn exports (excluding seed) to the United States from Turkey, though
Turkey’s export data doesn’t show organic products separately. Based on these figures, roughly over
Turkey Grain and Feed Annual Report 2018 30
300,000 MT of organic corn is estimated to have been transshipped through Turkey to the United States
in MY 2016/17.
Table 25: Turkey Corn Exports by Countries and Unit Value
Turkey Corn Exports by Countries and Unit Value
Commodity: 100590, Corn (Maize), Other Than Seed Corn
Year Ending: August
Partner Country
2014/2015 2015/2016 2016/2017
Unit Value
$USD/MT
Quantity
MT
Unit Value
$USD/MT
Quantity
MT
Unit Value
$USD/MT
Quantity
MT
United States 451 22,969 417 1,102 317 44,610
Iraq 280 3,513 243 44,421 220 27,027
Netherlands 870 6 829 23 286 7,006
Belgium 490 1,382 457 1,267 443 2,070
Egypt 502 1,156 488 711 454 1,448
Norway 567 863 523 823 504 1,010
Other 517 1,788 489 4,603 548 2,242
Total 442 31,677 281 52,950 298 85,413 Source: Turkish Statistical Institute
The certified seed sector is very dynamic in Turkey with the help of a good climate and labor force
advantages. Domestic seed producers have contracts with international seed technology companies and
produce seed in Turkey. Turkey exported 11,382 MT of corn seed in MY 2016/17, with EU countries
being the main destination. This is a marginal decrease compared to the previous year. For additional
information on Turkey’s seed sector, see the Turkey Planting Seeds Sector Overview Report.
Rice
For MY 2018/19, rice imports to Turkey forecast is 310,000 MT, milled equivalent, down 13 percent
compared to the previous year because production is expected to increase. This is assuming domestic
supply will not be high enough to meet Turkish consumer demand, despite increasing domestic
production, and expected continued exports to regional markets.
In the first four months of MY 2017/18 (September-December 2017), Turkey imported about 102,000
MT of rice, milled equivalent. It is forecast for MY 2017/18, total rice imports into Turkey will be at
350,000 tons, milled equivalent.
According to Turkish statistics, Turkey has nationalized about 102,000 MT of rice during the first four
months of MY 2017/18, of which about 56,700 MT was milled rice, 34,200 MT was paddy rice and
11,400 MT was brown rice (See Table 26). European-origin rice seems to be preferred by Turkish
importers so far this year. Rice traders use the benefits from free trade zones very actively. Turkish
importers store the rice in bonded warehouses for 2-3 months until they find buyers to delay advance

Turkey Grain and Feed Annual Report 2018 31
payment of the tariff and VAT. Therefore, when comparing importer and exporter data regarding
Turkish rice trade, there are some differences due to transshipments and stocks held in free zones.
Most of the paddy rice (rice in the husk) imports are done with zero tariffs under the inward processing
regime (IPR) for export purposes. This IPR process for the paddy rice sector is similar to the one used
in the wheat sector. Rice exporters gain import certificates when exporting milled rice, which allows
them to import paddy rice with zero tariff in order to produce rice for exports. The main target is to
support Turkey’s millers to become the rice miller for the region. Paddy millers are concentrated in the
Mersin region, where they are closer to Middle Eastern countries. They import paddy rice, mill it, and
export it to Middle East and North African countries. According to market sources, 25 percent of the
paddy rice imports are done under the IPR for export purposes.
Besides traders, another prominent player in the rice market is the Turkish Grain Board (TMO). TMO
imported 7,500 MT of Calrose paddy rice and 2,250 MT of milled Calrose Rice, with tenders issued in
December 2017 to meet the demand from the retail sector and stabilize the domestic rice price. TMO
will also import 1,000 MT of Calrose rice within the scope of a tender issued in March 2018. Calrose
variety rice is the favorite among Turkish consumers, but importers have been hesitant to import because
of the current price of milled Calrose rice, which was about $1,000/MT CIF as of February 2018.
Turkey generally imports paddy rice from United States. Importers remain concerned about the risk of
possible rejection of rice though from genetically engineered (GE) corn or soy products dust. Even at
unavoidable low levels, any detection of a GE product, even if approved for feed use in Turkey, in a
shipment of rice can cause the shipment to be rejected as there are no GE products approved for food
consumption in Turkey. Another issue which has impacted imports of United States rice in the past and
remains a concern for importers is the white tip nematode on Turkey’s pest list. Though this pest exists
in Turkey, the GOT rejects consignments if this pest is found.
According to the Turkish Statistical Institute, Turkey imported more than 66,000 MT of paddy rice from
the United States in MY 2016/17, milled equivalent. Paddy rice imported from America is generally
used in domestic market as consumers prefer it due to its high quality.
Turkey imported 265,181 MT of rice in MY 2016/17, milled equivalent. United States (66,429 MT),
Russia (44,068 MT), Greece (42,660 MT), and Italy (32,381 MT) continue to be the main rice suppliers
for Turkey. The most imported rice varieties were medium grain ones. Also some lower priced long
grain varieties were imported for lower price-point consumers. The quality of imported rice differs
dramatically according to origin, and retail prices reflect these differences with some varieties being
triple the price of other varieties or origins.
The Middle East and countries in Africa are the most important markets for Turkish rice millers. In the
first four months of MY 2017/18, exports to Syria were 5,621 MT (10,207 MT in total for MY
2016/17), Iraq were 843 MT (4,691 MT in MY 2016/17), and Italy were 1,098 MT (2,517 MT in MY
2016/17).
Table 26: Rice import; classified by process
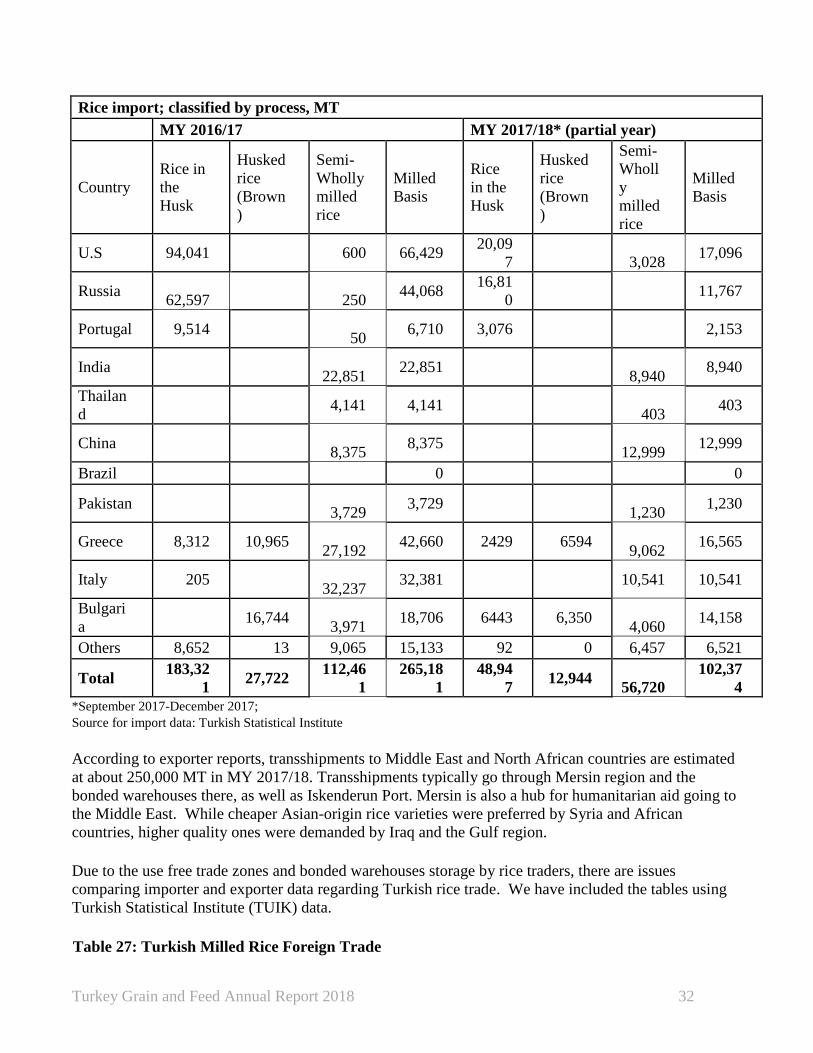
Turkey Grain and Feed Annual Report 2018 32
Rice import; classified by process, MT
MY 2016/17 MY 2017/18* (partial year)
Country
Rice in
the
Husk
Husked
rice
(Brown
)
Semi-
Wholly
milled
rice
Milled
Basis
Rice
in the
Husk
Husked
rice
(Brown
)
Semi-
Wholl
y
milled
rice
Milled
Basis
U.S 94,041 600 66,429 20,09
7
3,028 17,096
Russia
62,597
250 44,068
16,81
0 11,767
Portugal 9,514
50 6,710 3,076 2,153
India
22,851 22,851
8,940 8,940
Thailan
d 4,141 4,141
403 403
China
8,375 8,375
12,999 12,999
Brazil 0 0
Pakistan
3,729 3,729
1,230 1,230
Greece 8,312 10,965
27,192 42,660 2429 6594
9,062 16,565
Italy 205
32,237 32,381 10,541 10,541
Bulgari
a 16,744
3,971 18,706 6443 6,350
4,060 14,158
Others 8,652 13 9,065 15,133 92 0 6,457 6,521
Total 183,32
1 27,722
112,46
1
265,18
1
48,94
7 12,944
56,720
102,37
4
*September 2017-December 2017;
Source for import data: Turkish Statistical Institute
According to exporter reports, transshipments to Middle East and North African countries are estimated
at about 250,000 MT in MY 2017/18. Transshipments typically go through Mersin region and the
bonded warehouses there, as well as Iskenderun Port. Mersin is also a hub for humanitarian aid going to
the Middle East. While cheaper Asian-origin rice varieties were preferred by Syria and African
countries, higher quality ones were demanded by Iraq and the Gulf region.
Due to the use free trade zones and bonded warehouses storage by rice traders, there are issues
comparing importer and exporter data regarding Turkish rice trade. We have included the tables using
Turkish Statistical Institute (TUIK) data.
Table 27: Turkish Milled Rice Foreign Trade
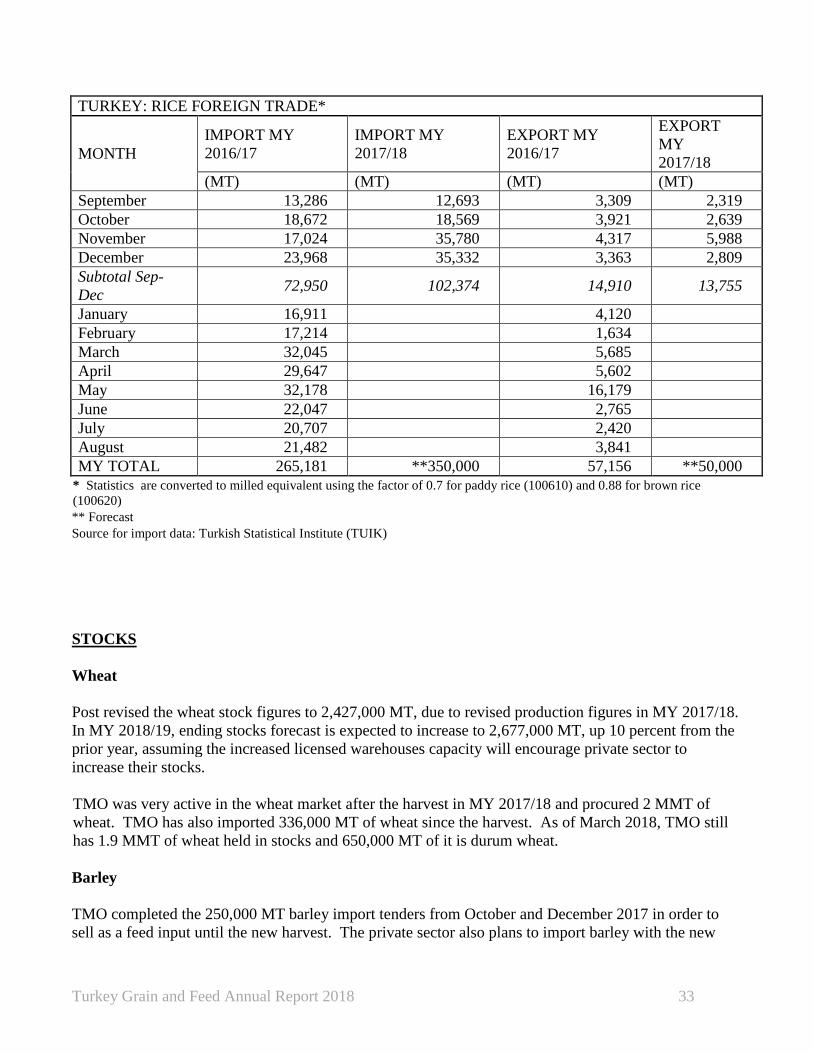
Turkey Grain and Feed Annual Report 2018 33
TURKEY: RICE FOREIGN TRADE*
MONTH
IMPORT MY
2016/17
IMPORT MY
2017/18
EXPORT MY
2016/17
EXPORT
MY
2017/18
(MT) (MT) (MT) (MT)
September 13,286 12,693 3,309 2,319
October 18,672 18,569 3,921 2,639
November 17,024 35,780 4,317 5,988
December 23,968 35,332 3,363 2,809
Subtotal Sep-
Dec 72,950 102,374 14,910 13,755
January 16,911 4,120
February 17,214 1,634
March 32,045 5,685
April 29,647 5,602
May 32,178 16,179
June 22,047 2,765
July 20,707 2,420
August 21,482 3,841
MY TOTAL 265,181 **350,000 57,156 **50,000
* Statistics are converted to milled equivalent using the factor of 0.7 for paddy rice (100610) and 0.88 for brown rice
(100620)
** Forecast
Source for import data: Turkish Statistical Institute (TUIK)
STOCKS
Wheat
Post revised the wheat stock figures to 2,427,000 MT, due to revised production figures in MY 2017/18.
In MY 2018/19, ending stocks forecast is expected to increase to 2,677,000 MT, up 10 percent from the
prior year, assuming the increased licensed warehouses capacity will encourage private sector to
increase their stocks.
TMO was very active in the wheat market after the harvest in MY 2017/18 and procured 2 MMT of
wheat. TMO has also imported 336,000 MT of wheat since the harvest. As of March 2018, TMO still
has 1.9 MMT of wheat held in stocks and 650,000 MT of it is durum wheat.
Barley
TMO completed the 250,000 MT barley import tenders from October and December 2017 in order to
sell as a feed input until the new harvest. The private sector also plans to import barley with the new
Turkey Grain and Feed Annual Report 2018 34
temporary zero tariff rates. TMO and the private sector have approximately 668,000 MT of barley
stocks as they enter the new harvest. In 2018/19, barley stocks are forecast at 698,000 MT, remaining
similar with the year before.
Corn
Post revised stocks are at 834,000 MT due to revised decreased production and higher export figures in
MY 2017/18. In MY 2018/19, stocks are also forecast at 684,000 MT, a bit lower compared to the
previous year, and this is assuming that consumption and imports stay high. Also due to the uncertain
economic environment in Turkey generally, the private sector may be unwilling to tie money up in
stocks.
Rice
For MY 2018/19, rice stocks estimate is 131,000 MT, up 10,000 MT compared to the prior year (they
were 121,000 MT in MY2017/18). This is assuming consumption remains stable and production
increases as expected.
Paddy rice price differs by variety in Turkey. Despite the fact that some varieties have better yields and
milling rates, prices are set according to consumer preferences. Paddy rice price increased around 15
percent compared to last year, which is above the normal increase in price due to inflation.
The Turkish Grain Board (TMO) did not announce a 2017 paddy rice procurement price due to
sufficient demand by the private sector for domestic paddy rice. TMO sells Baldo milled rice variety at
5 TL/Kg, Calrose at 3.9 TL/Kg, and Luna at 3.8 TL/Kg in TMO retail stores.
Table 28: Bulk Price by Varieties in Domestic Market
Paddy Rice Varieties February 2017 February 2018
Baldo 2400-2600 TL/Ton 2800-2900 TL/Ton
Cammeo 2100-2200 TL/Ton 2400-2500 TL/Ton
Osmancik (inc; Yatkin, Efe, Gala) 2100-2250 TL/Ton 2100-2250 TL/Ton
Ronaldo 1700-1750 TL/Ton 2000-2100 TL/Ton
Luna 1600-1650 TL/Ton 1900-1950 TL/Ton Sources: Industry Sources
According to market sources, TMO has about 5,000 MT of rice, milled equivalent, in its stocks as of
February 2018. Most locally produced rice is being kept in the private sector’s stocks. Last year, due to
the rice shortage, producers and traders who had high stocks were able to earn large profits. They are
holding their supplies as stocks, particularly the newly harvested product, in an attempting to get higher
prices in May.
Turkey has 25,000 paddy rice farms. Bandirma, Samsun, Edirne, Tekirdag and Ankara are the locations
of the important commodity exchanges for rice. Turkey has more than 130 paddy rice millers with a
yearly capacity of 2.8 MMT.

Turkey Grain and Feed Annual Report 2018 35
POLICY
The Government of Turkey (GOT) plans to grant 14.8 billion TL ($3.89 billion) in agricultural subsidies
to all agricultural producers in 2018 as part of their new agricultural budget. This is up 15 percent
compared to 2017 (these figures includes subsidies to the livestock sector). The GOT granted 12.8
billion TL ($3.55 billion) in agricultural subsidies to producers in 2017. Note that these estimates
assume an exchange rate of US$1=3.80 TL as of February 2018 and exchange rate of US$1=3.60 TL as
of February 2017, although the actual rate is variable during the year.
According to the subsidy details announced in the Official Gazette about the Cabinet Decision on
Agricultural Support in 2018, the important update to 2018 subsidies is that the fuel subsidy is increased.
The GOT promises to subsidize half of farmers’ fuel costs in 2018. Fertilizer and soil analysis subsidies
remain the same as last year, and premiums also remain the same, except there was a premium increase
for some pulses and forage crops. According to Turkey’s Agricultural Basin Based Support Scheme,
which came into force in 2017, Turkey is divided into different agricultural basins based on climate and
soil categories to subsidize specific crops for each zone. Farmers can only receive subsidies if they have
planted crops which the government deems suitable for their region and has put on the basin list for their
particular location.
Table 29: Agricultural Subsidies by Products in 2017-2018
Product Fuel/Diesel
(TL/ha)
Fertilizer
(TL/ha)
Soil Analysis*
(TL/ five ha)
Premium (TL/MT)
2017 2018 2017 2018 2017 2018 2017 2018
Wheat, Barley,
Oat, Rye,
Triticale
130 150 40 40 8 8 50 50
Cotton 360 400 40 40 8 8 800 800
Paddy Rice 360 400 40 40 8 8 100 100
Soy Bean 170 190 40 40 8 8 600 600
Canola 90 100 40 40 8 8 500 500
Aspire 110 120 40 40 8 8 550 550
Corn 170 190 40 40 8 8 30 30
Sunflower 170 190 40 40 8 8 40 40
Chick Pea,
lentils, Dry
110 140 40 40 8 8 300 500

Turkey Grain and Feed Annual Report 2018 36
Beans
Olive Oil 90 100 40 40 8 8 800 800
Tea 90 100 40 40 8 8 130 130
Onion, and
Others
90 100 40 40 8 8 - -
Forage crops 90 100 40 40 8 8 400-
900**
400-
1000**
Fallow 50 60 - - - - - - * Soil analysis support is 40 TL per five ha
** Premium is given according to variety per year
It is estimated that the breakdown of the total payments in 2018 will be: fuel subsidies will be 1.9 billion
TL, premium subsidies will be 4 billion TL (including 1.5 Billion TL for cotton), rural development
subsidies will be 1.7 billion TL, agricultural insurance payments about 1 billion TL, and livestock
subsidy expenditures will be about 4 billion TL.
The GOT continues to encourage domestic certified seed and seedling usage, as they have in previous
years. There are also some subsidies for certified seed producers, organic products, and good farming
practices, which are similar with 2017. Farmers have to be registered in the Farmer Registration System
in order to collect government subsidies. The subsidy for seed producers will be given to producers who
registered in Farmer Registration System, produce and sell certified seed in Turkey and are authorized as
a seed company by the government.
Table 30: Subsidies for Domestic Certified Seed Producers
Products TL/kg
2017 2018
Barley, Rye, Oats 0.08 0.08
Wheat 0.10 0.10
Paddy Rice 0.25 0.25
Soybean 0.35 0.35
Sesame 0.60 0.60
Chickpea, Dry Bean, Safflower 0.50 0.50
Canola 1.20 1.20 Source: Official Gazette
Despite the fact that grain production premiums have remained the same during the last six years (see
Table 32) , there has been a nearly 60 percent devaluation of the Turkish Lira against the U.S. Dollar
and many foreign currencies during the same period. The GOT paid about 3.3 billion TL for grain
premiums in 2017, of which 675 million TL was for wheat, 120 million for corn, 70 million TL for
pulses, and 70 million TL for paddy rice. The GOT also paid about 656 million TL for agricultural
insurance premium in 2017 for all plant crops.
Table 31: Grain Premiums Turkey (TL/MT)
Grain Premiums Turkey: Grain Premiums (TL/MT)

Turkey Grain and Feed Annual Report 2018 37
Products 2013 2014 2015 2016 2017 2018
Wheat 50 50 50 50 50 50
Barley, Oats, Rye 50 50 50 50 50 50
Paddy Rice 100 100 100 100 100 100
Chick Peas, Lentils, Dry beans 100 100 200 300 300 500
Corn 40 40 40 20 30 30 Source: Official Gazette
The feed and livestock industries are struggling with high feed prices. Turkey’s livestock sector has had
a lot of new investment, including the import of live animals, which has increased the importance of
access to forage crops. The feed industry is dependent on soybean and byproduct imports, corn
byproducts imports, and bran or byproducts from oilseed mills, wheat mills, and the cotton ginning
industry. There is also not enough pasture development and forage crop planting in Turkey, so the
government has encouraged forage crop production with additional financial support in recent years.
Table 32: Turkey Forage Crop Support
Forage crop support (TL/ha/year)
Products 2013 2014 2015 2016 2017 2018
Alfalfa (irrigated) 500 500 500 600 600 900
Trefoil 400 400 400 450 600 900
Silage corn 750 750 750 450 900 1000 Source: Official Gazette
New licensed warehouse systems for grain storage are developing in Turkey. The GOT has supported
construction of some licensed warehouses since 2005, and they plan to regulate the grain market with
the help of licensed warehouses in the near future. For this purpose, the GOT gives some grants and
financial support in order to encourage new investments. As of March 2017, there were 40 active
licensed warehouse operations (LWO) in 24 provinces with a capacity of 1.8 MMT. There were only 19
LWO the year before. This year there have been applications for 106 new LWO investments, and the
goal is to increase LWO storage capacity to 9.4 MMT in the coming years.
The GOT is still working on a well-functioning Licensed Warehousing, Warehouse Receipts System
(WHR) transaction process for delivery on agricultural products and futures markets in Turkey with the
help of commodity exchanges. Nine commodity exchanges are authorized for making transactions with
product certificates by Turkish Ministry of Customs and Trade. Ninety seven percent of current WHR
are for grain storage, the remaining amount is for cotton, olives, and hazelnuts. According to TMO,
TMO procured 240,000 MT of wheat and 95,000 of corn with electronic warehouse receipts in MY
2017/18 and plans to procure grain only through licensed warehouses in 2018. For updated data on
LWO, please visit the webpage of Turkish Ministry of Customs and Trade.

Turkey Grain and Feed Annual Report 2018 38
Market access problems as result of Turkey’s 2010 biosafety law continue to disrupt trade. While some
corn and soy varieties are approved for import to Turkey for animal feed, this law does not allow
imports of commodities containing genetically engineered varieties (events) that have not yet been
approved for use in Turkey, including at an unavoidable low level presence. See FAS GAIN report on
Biotechnology for further information and detail on this policy issue.
Increasing food prices continue to be an important issue in Turkey. Food inflation is a high priority, and
has been the driving force of consumer price inflation in 2017. According to Turkish Statistics, the
producer price index of agricultural products (Agriculture - PPI) increased by 2.24 percent in the
previous month. Compared to the same month of the previous year, it has increased by 10.26 percent,
and on the twelve month moving average basis it increased by 11.23 percent in February 2018.
The GOT aims to put downward pressure domestic commodity prices with import instruments. As part
of a series of measures against food inflation, the Turkish government reduced the import tariff on
wheat, barley and corn from 130 percent to 45, 35, and 25 percent respectively, according to a decree
published in the Official Gazette on June 28, 2017. The reference price for these commodities was also
determined as $200 per ton, according to a communique published in the Official Gazette on June 30,
2017. In reality, this reference price can be higher than the actual commodity prices, thereby increasing
the tariff payments. The GOT then eliminated the import tariff on barley from 35 percent to 0 percent as
of December 31, 2017 until the end of March 2018.
Table 33: Grain Tariff Rates
Turkey: Grain Tariff Rates
Product
group Products EU
Bosnia
Herz.
South
Korea
Other incl.
US Notes
Wheat
Spelt, common wheat and
meslin (excl. seed) 45 0 45 45
200 USD CIF
ref.price
Durum Wheat 45 0 45 45 200 USD CIF
ref price
Common wheat, Durum wheat
and meslin seed 0 0 0 0 -
Barley
Barley Seed 0 0 0 0
White Barley (excluding seed) 0 0
0 200 USD CIF
ref price
Malting Barley (excluding seed) 0 0 0 0 200 USD CIF
ref price
Corn
Maize Seed 0 0 0 0
Popcorn, Unpopped, (excluding
seed) 25 0 25 25
200 USD CIF
ref price
Other Corn 25 0
25 270 USD CIF
ref price
Rice
Rice in husk for sowing 13 0 15 115
Round, medium, long grain rice
in husk 34 0 34 34
Round, medium, long husked
rice 36 0 36 36
Semi milled, wholly milled,
broken rice 45 0 45 45
Note: Tariff rates valid as of March 2018, but after barley rates are expected to return to 35%
Turkey Grain and Feed Annual Report 2018 39
Source: Turkish Ministry of Economy
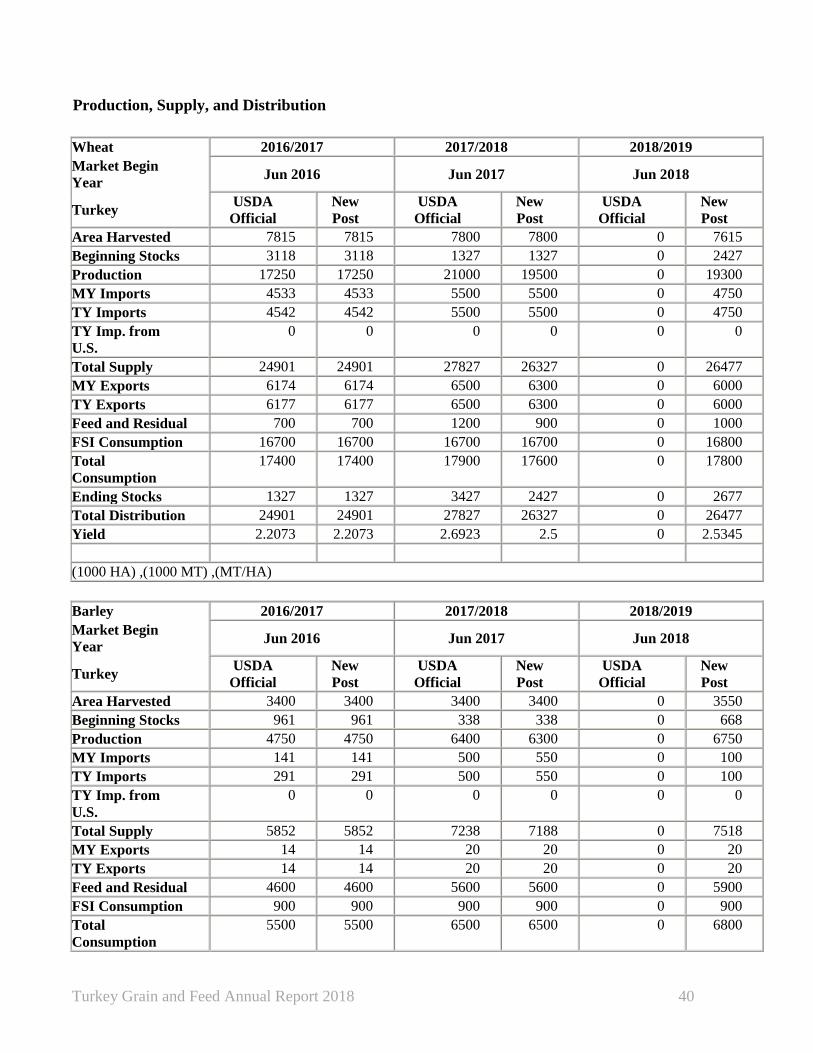
Turkey Grain and Feed Annual Report 2018 40
Production, Supply, and Distribution
Wheat 2016/2017 2017/2018 2018/2019
Market Begin
Year Jun 2016 Jun 2017 Jun 2018
Turkey USDA
Official
New
Post
USDA
Official
New
Post
USDA
Official
New
Post
Area Harvested 7815 7815 7800 7800 0 7615
Beginning Stocks 3118 3118 1327 1327 0 2427
Production 17250 17250 21000 19500 0 19300
MY Imports 4533 4533 5500 5500 0 4750
TY Imports 4542 4542 5500 5500 0 4750
TY Imp. from
U.S.
0 0 0 0 0 0
Total Supply 24901 24901 27827 26327 0 26477
MY Exports 6174 6174 6500 6300 0 6000
TY Exports 6177 6177 6500 6300 0 6000
Feed and Residual 700 700 1200 900 0 1000
FSI Consumption 16700 16700 16700 16700 0 16800
Total
Consumption
17400 17400 17900 17600 0 17800
Ending Stocks 1327 1327 3427 2427 0 2677
Total Distribution 24901 24901 27827 26327 0 26477
Yield 2.2073 2.2073 2.6923 2.5 0 2.5345
(1000 HA) ,(1000 MT) ,(MT/HA)
Barley 2016/2017 2017/2018 2018/2019
Market Begin
Year Jun 2016 Jun 2017 Jun 2018
Turkey USDA
Official
New
Post
USDA
Official
New
Post
USDA
Official
New
Post
Area Harvested 3400 3400 3400 3400 0 3550
Beginning Stocks 961 961 338 338 0 668
Production 4750 4750 6400 6300 0 6750
MY Imports 141 141 500 550 0 100
TY Imports 291 291 500 550 0 100
TY Imp. from
U.S.
0 0 0 0 0 0
Total Supply 5852 5852 7238 7188 0 7518
MY Exports 14 14 20 20 0 20
TY Exports 14 14 20 20 0 20
Feed and Residual 4600 4600 5600 5600 0 5900
FSI Consumption 900 900 900 900 0 900
Total
Consumption
5500 5500 6500 6500 0 6800

Turkey Grain and Feed Annual Report 2018 41
Ending Stocks 338 338 718 668 0 698
Total Distribution 5852 5852 7238 7188 0 7518
Yield 1.3971 1.3971 1.8824 1.8529 0 1.9014
(1000 HA) ,(1000 MT) ,(MT/HA)
Corn 2016/2017 2017/2018 2018/2019
Market Begin
Year Sep 2016 Sep 2017 Sep 2018
Turkey USDA
Official
New
Post
USDA
Official
New
Post
USDA
Official
New
Post
Area Harvested 570 570 600 550 0 530
Beginning Stocks 862 862 804 804 0 834
Production 5500 5500 6000 5400 0 5100
MY Imports 1389 1389 1500 2000 0 2300
TY Imports 1421 1421 1500 2000 0 2300
TY Imp. from
U.S.
3 3 0 0 0 0
Total Supply 7751 7751 8304 8204 0 8234
MY Exports 97 97 50 100 0 100
TY Exports 100 100 50 100 0 100
Feed and Residual 5800 5800 6200 6200 0 6400
FSI Consumption 1050 1050 1070 1070 0 1050
Total
Consumption
6850 6850 7270 7270 0 7450
Ending Stocks 804 804 984 834 0 684
Total Distribution 7751 7751 8304 8204 0 8234
Yield 9.6491 9.6491 10 10 0 9.6226
(1000 HA) ,(1000 MT) ,(MT/HA)
Rice, Milled 2016/2017 2017/2018 2018/2019
Market Begin Year Sep 2016 Sep 2017 Sep 2018
Turkey USDA
Official
New
Post
USDA
Official New Post
USDA
Official
New
Post
Area Harvested 98 98 99 99 0 100
Beginning Stocks 128 128 91 91 0 121
Milled Production 500 500 520 520 0 540
Rough Production 746 746 776 776 0 806
Milling Rate (.9999) 6700 6700 6700 6700 0 6700
MY Imports 300 300 350 350 0 310
TY Imports 300 300 350 350 0 310
TY Imp. from U.S. 50 50 0 0 0 0
Total Supply 928 928 961 961 0 971
MY Exports 57 57 50 50 0 50
TY Exports 60 60 50 50 0 50
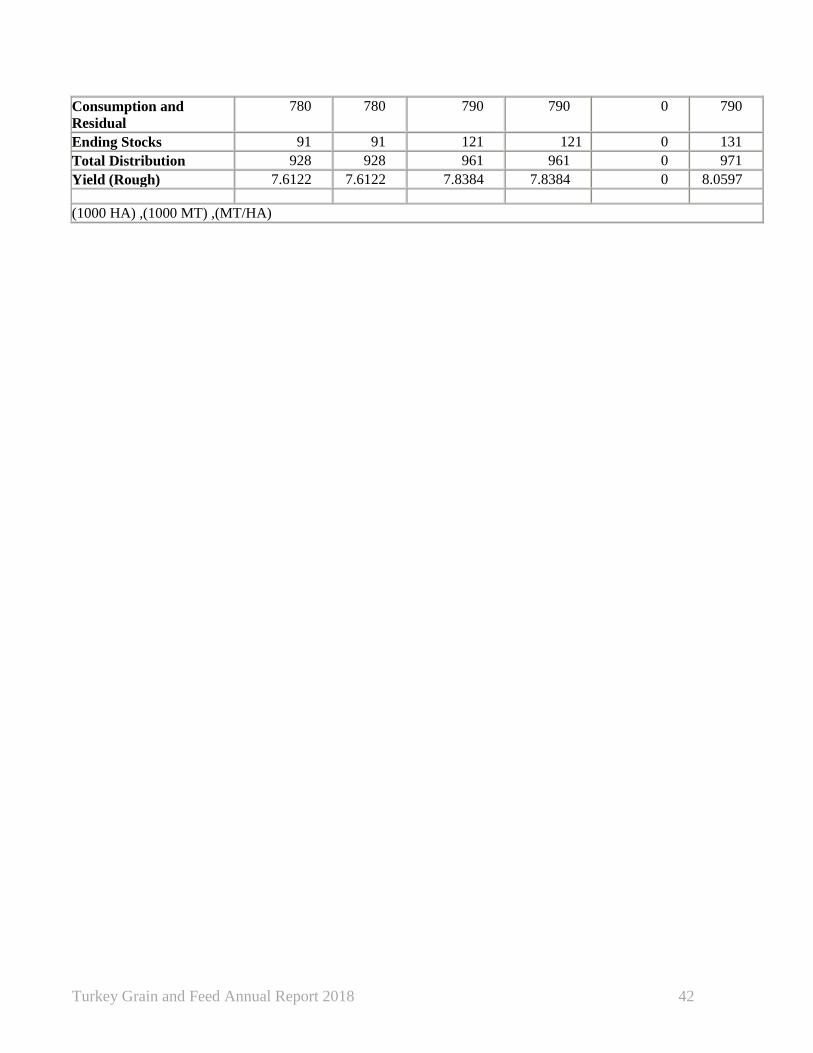
Turkey Grain and Feed Annual Report 2018 42
Consumption and
Residual
780 780 790 790 0 790
Ending Stocks 91 91 121 121 0 131
Total Distribution 928 928 961 961 0 971
Yield (Rough) 7.6122 7.6122 7.8384 7.8384 0 8.0597
(1000 HA) ,(1000 MT) ,(MT/HA)