THIS REPORT CONTAINS ASSESSMENTS OF COMMODITY … GAIN Publications/Retail Foods... · THIS REPORT...
33
THIS REPORT CONTAINS ASSESSMENTS OF COMMODITY AND TRADE ISSUES MADE BY USDA STAFF AND NOT NECESSARILY STATEMENTS OF OFFICIAL U.S. GOVERNMENT POLICY Date: GAIN Report Number: Approved By: Prepared By: Report Highlights: Expansion and diversification of large-scale retail businesses coupled with introduction of information technologies has led a rapid evolvement of the retail food sector in South Korea over the last two decades. Strong consumer demand for value, convenience, diversity and quality generates increased demand for imported food and agricultural products in the sector. The United States remains the leading supplier of consumer-ready food products to the Korean retail food sector. Korea’s imports of consumer-ready food products from the United States totaled a record high $3.6 billion in 2014, up 21.4 percent from the previous year. Reduction of import tariffs under KORUS FTA should provide Sangyong Oh, Marketing Specialist Kevin Sage-EL, ATO Director Retail Food Sector Report Biennial Retail Foods Korea - Republic of KS1512 2015-04-01 Required Report - public distribution
Transcript of THIS REPORT CONTAINS ASSESSMENTS OF COMMODITY … GAIN Publications/Retail Foods... · THIS REPORT...

THIS REPORT CONTAINS ASSESSMENTS OF COMMODITY AND TRADE ISSUES MADE BY
USDA STAFF AND NOT NECESSARILY STATEMENTS OF OFFICIAL U.S. GOVERNMENT
POLICY
Date:
GAIN Report Number:
Approved By:
Prepared By:
Report Highlights:
Expansion and diversification of large-scale retail businesses coupled with introduction of information
technologies has led a rapid evolvement of the retail food sector in South Korea over the last two
decades. Strong consumer demand for value, convenience, diversity and quality generates increased
demand for imported food and agricultural products in the sector. The United States remains the
leading supplier of consumer-ready food products to the Korean retail food sector. Korea’s imports of
consumer-ready food products from the United States totaled a record high $3.6 billion in 2014, up 21.4
percent from the previous year. Reduction of import tariffs under KORUS FTA should provide
Sangyong Oh, Marketing
Specialist
Kevin Sage-EL, ATO
Director
Retail Food Sector Report Biennial
Retail Foods
Korea - Republic of
KS1512
2015-04-01
Required Report - public distribution

American products with additional opportunities in the sector.

Post:
Author Defined:
KOREA RETAIL FOOD SECTOR REPORT
TABLE OF CONTENTS
I. Market Summary
A. South Korean Retail Food Sector Overview
B. Consumer Food Trends
C. Food Import Trends
II. Road Map for Market Entry
A. Entry Strategy
B. Market Structure and Product Flow
C. Sub-sector Company Profiles
C-1. Hypermarkets
C-2. Grocery Supermarkets
C-3. Convenience Stores
C-4. Department Stores
C-5. On-line Retailers
C-6. Franchise Specialty Grocery Retailers
D. Wet Markets and Independent Small Grocers
III. Competition
IV. Best Product Prospects
A. Products Present in the Market Which Have Good Sales Potential
B. Products Not Present in Significant Quantities but Which Have Good Sales Potential
C. Products Not Present Because They Face Significant Barriers
V. Post Contact and Further Information
I. Market Summary
Seoul ATO
A. South Korean Retail Food Sector Overview
The retail food sector in South Korea (here in after referred to Korea) has evolved dramatically
ever since opening of its first large-scale discount store (i.e., hypermarket) in 1993 (E-Mart by
Shinsegae Co.) and the liberalization of large-scale retail business to foreign ownership in 1996
(Macro, a Dutch retailer was the first one to enter the market). As a result, modern format, large-
scale retail businesses such as hypermarket chains, grocery supermarket chains, convenience
store chains, and on-line retailers have grown rapidly at the expense of traditional street markets
and family-operated small retailers over the years. Expansion of these new retail industries
coupled with the introduction of new information technologies has brought a big change in the way
Korean consumers purchase daily necessities, including food.
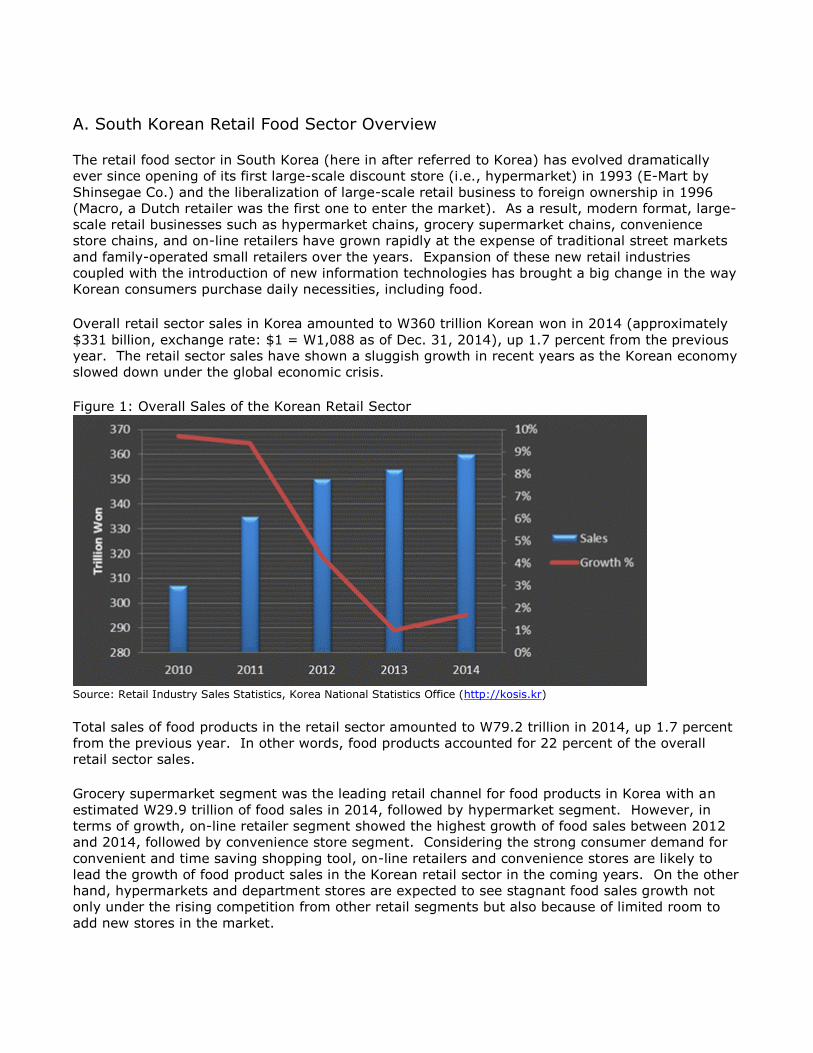
Overall retail sector sales in Korea amounted to W360 trillion Korean won in 2014 (approximately
$331 billion, exchange rate: $1 = W1,088 as of Dec. 31, 2014), up 1.7 percent from the previous
year. The retail sector sales have shown a sluggish growth in recent years as the Korean economy
slowed down under the global economic crisis.
Figure 1: Overall Sales of the Korean Retail Sector
Source: Retail Industry Sales Statistics, Korea National Statistics Office (http://kosis.kr)
Total sales of food products in the retail sector amounted to W79.2 trillion in 2014, up 1.7 percent
from the previous year. In other words, food products accounted for 22 percent of the overall
retail sector sales.
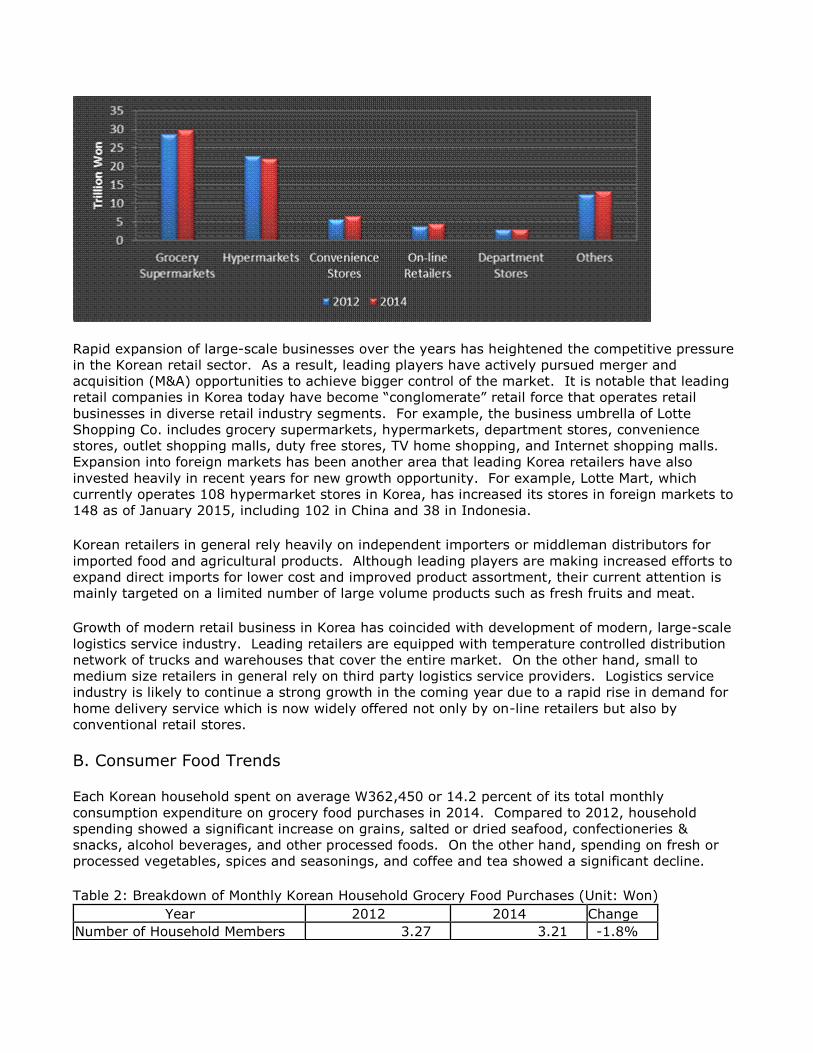
Grocery supermarket segment was the leading retail channel for food products in Korea with an
estimated W29.9 trillion of food sales in 2014, followed by hypermarket segment. However, in
terms of growth, on-line retailer segment showed the highest growth of food sales between 2012
and 2014, followed by convenience store segment. Considering the strong consumer demand for
convenient and time saving shopping tool, on-line retailers and convenience stores are likely to
lead the growth of food product sales in the Korean retail sector in the coming years. On the other
hand, hypermarkets and department stores are expected to see stagnant food sales growth not
only under the rising competition from other retail segments but also because of limited room to
add new stores in the market.

Figure 2: Sales of Food Products in the Korean Retail Sector
Source: Retail Industry Sales by Product Statistics, Korea National Statistics Office (http://kosis.kr)
Table 1: Estimated Sales of Food Products by Retail Industry Segment (2014)
Industry Segment Total Sales Share of Food Products in Total
Sales*
Food Sales
(Estimates)
Grocery
Supermarkets
W35.4
trillion 84.5% W29.9 trillion
Hypermarkets W47.5
trillion 51.0% W22.2 trillion
Convenience Stores W12.7
trillion 51.4% W6.5 trillion
On-line Retailers W41.1
trillion 10.7% W4.4 trillion
Department Stores W29.3
trillion 10.1% W2.9 trillion
Others** W13.3 trillion
Total W79.2 trillion Source: Retail Industry Sales by Product Statistics, Korea National Statistics Office (http://kosis.kr)
*Note: Estimates based on IR reports of some of the leading companies in each segment. The figure for on-line retailers is from ‘On-line shopping industry product sales statistics’ by Korea National Statistics Office.
**Note: Others include independent, family operated retail stores of various consumer goods; traditional street markets; and category-focused specialty retail stores (independent or franchise operation).
Figure 3: Estimated Sales of Food Products by Retail Industry Segment (2012 vs 2014)
Rapid expansion of large-scale businesses over the years has heightened the competitive pressure
in the Korean retail sector. As a result, leading players have actively pursued merger and
acquisition (M&A) opportunities to achieve bigger control of the market. It is notable that leading
retail companies in Korea today have become “conglomerate” retail force that operates retail
businesses in diverse retail industry segments. For example, the business umbrella of Lotte
Shopping Co. includes grocery supermarkets, hypermarkets, department stores, convenience
stores, outlet shopping malls, duty free stores, TV home shopping, and Internet shopping malls.
Expansion into foreign markets has been another area that leading Korea retailers have also
invested heavily in recent years for new growth opportunity. For example, Lotte Mart, which
currently operates 108 hypermarket stores in Korea, has increased its stores in foreign markets to
148 as of January 2015, including 102 in China and 38 in Indonesia.
Korean retailers in general rely heavily on independent importers or middleman distributors for
imported food and agricultural products. Although leading players are making increased efforts to
expand direct imports for lower cost and improved product assortment, their current attention is
mainly targeted on a limited number of large volume products such as fresh fruits and meat.
Growth of modern retail business in Korea has coincided with development of modern, large-scale
logistics service industry. Leading retailers are equipped with temperature controlled distribution
network of trucks and warehouses that cover the entire market. On the other hand, small to
medium size retailers in general rely on third party logistics service providers. Logistics service
industry is likely to continue a strong growth in the coming year due to a rapid rise in demand for
home delivery service which is now widely offered not only by on-line retailers but also by
conventional retail stores.
B. Consumer Food Trends
Each Korean household spent on average W362,450 or 14.2 percent of its total monthly
consumption expenditure on grocery food purchases in 2014. Compared to 2012, household
spending showed a significant increase on grains, salted or dried seafood, confectioneries &
snacks, alcohol beverages, and other processed foods. On the other hand, spending on fresh or
processed vegetables, spices and seasonings, and coffee and tea showed a significant decline.
Table 2: Breakdown of Monthly Korean Household Grocery Food Purchases (Unit: Won)
Year 2012 2014 Change
Number of Household Members 3.27 3.21 -1.8%

Total Household Income 4,076,876 4,302,352 5.5%
Total Consumption Expenditure 2,457,441 2,551,057 3.8%
Total Grocery Food Expenditure 358,969 362,450 1.0%
Product Category Amount* Share Amount Share Grains 21,092 5.7% 22,152 6.0% 5.0%
Processed Grains 16,813 4.6% 16,234 4.4% -3.4%
Bakery Products & Rice Cakes 21,708 5.9% 22,221 6.0% 2.4%
Meat 49,166 13.4% 52,598 14.3% 7.0%
Processed Meat 11,573 3.1% 11,172 3.0% -3.5%
Fresh Seafood 21,207 5.8% 20,592 5.6% -2.9%
Salted or Dried Seafood 7,045 1.9% 7,978 2.2% 13.2%
Other Processed Seafood 7,123 1.9% 7,366 2.0% 3.4%
Dairy Products & Eggs 31,805 8.7% 31,686 8.6% -0.4%
Oil & Fat 2,753 0.7% 2,806 0.8% 1.9%
Fresh & Processed Fruits 43,314 11.8% 44,500 12.1% 2.7%
Fresh & Processed Vegetables 39,679 10.8% 35,565 9.7% -10.4%
Fresh & Processed Seaweeds 4,375 1.2% 4,339 1.2% -0.8%
Confectioneries & Snacks 26,069 7.1% 28,135 7.7% 7.9%
Spices & Seasonings 14,963 4.1% 11,972 3.3% -20.0%
Other Processed Foods 10,208 2.8% 11,957 3.3% 17.1%
Coffee & Tea 8,500 2.3% 7,904 2.1% -7.0%
Juice & Beverages 11,797 3.2% 12,006 3.3% 1.8%
Alcohol Beverages 9,779 2.7% 11,267 3.1% 15.2% Source: Monthly Household Expenditure Survey, Korea National Statics Service (http://kosis.kr)
Due in part to the aging population, there is a heavy emphasis among the general Korean public
on healthy eating. Of course, Korean consumers’ strong belief in health-improving efficacy of
regular food ingredients dates back thousands of years as indicated by a still prevailing old
proverb, "food and medicine are from the same source". However, 'Well-being', a theme that
evoked new consumer trend of seeking both physical and psychological health by adopting more
wholesome approaches in daily life has further heightened the Korean consumers’ attention to
healthy diet. As a result, sales of functional foods (such as glucosamine, chlorella, vitamins, anti-
oxidants, lactic bacteria, antlers, pollen, fish oil, ginseng and other Asian herbs) as well as regular
foods that are associated with health benefits (such as red wine, organic food, green tea, yoghurt,
blueberries, pomegranate, and quinoa) continue to grow in the retail sector.
Table 3: Aging Korean Population (Unit: 1,000 people)
Age Group 1995 2000 2010
Change Number Share Number Share Number Share
0-14 10,236 23.0 % 9,639 21.0 % 7,907 16.2% -22.7 %
15-64 31,678 71.1 % 32,973 71.7 % 35,611 72.9% 12.4 %
65 + 2,640 5.9 % 3,372 7.3 % 5,357 11.0% 102.9 % Source: National Population Survey, Korea National Statics Service (http://kosis.kr)
Outstanding growth of the Korean economy and consumer income over the years has naturally
resulted in growth of demand for products of higher quality and new tastes. Due to the strong
performance of export industries, Korea maintained a relatively stable economy during the recent
global economic crisis. Korean GDP for 2013 amounted to $1.2 trillion, which was 13th highest in
the world. Korean’s per capita GNI amounted to $26,205 in 2013, which was 8th highest in the
world among countries with over 40 million populations. Nevertheless, the global economic crisis

took its toll in Korea and generated strong call for better value and lower price particularly among
the low and middle income consumer groups who were pressured by high housing debt as well as
reduced job opportunity.
Figure 4: Korean Economy Trend
Source: Gross Domestic Production - Per Capita Gross National Income, Bank of Korea; CIA Fact Book (www.cia.gov)
Korea's 50 million inhabitants occupy a country the size of the state of Indiana. About 70 percent
of the land is mountainous terrain, and over 90 percent of Korean population lives in urban cities,
which explains the high population density and high real estate cost. Convenience has become a
very important factor behind many new consumer trends as everyday life of Koreans gets busier.
For example, increase of dual-income families and single parent households have led to bigger
demand for Home Meal Replacement (HMR) products in retail stores. Delivery service is commonly
offered by retail stores in Korea as people do not want to waste time on the traffic-jammed roads.
Rapid growth of on-line shopping is also rooted partly in the demand for convenience. Of course,
high real estate cost is another factor that drives stores to move to ‘cyber space’.
Figure 5: Breakdown of Korean Households by the Number of Household Member

Source: Household Statistics, Korea National Statics Service (http://kosis.kr)
C. Food Import Trends
By nature, Korea depends heavily on imports for both raw agricultural commodities and consumer-
ready products. Local supply alone is not capable of meeting the rising consumer demand for
quality, value, and diversify. For example, Korea’s self-sufficiency rate for grains marked 23.1
percent in 2013, making Korea an OECD country with the lowest self-sufficiency rate (even worse,
over 90 percent of the local grain produced was rice). Industry sources estimate that over 70
percent of all food and agricultural products consumed in the market is either imported or locally
processed products using imported ingredients.
Figure 6: Korea’s Self-sufficiency Rate for Grains
Source: Korea Rural Economic Institute (KREI)
Growth of modern format, large-scale retail businesses coupled with evolving taste of Korean
consumers are translated into growing opportunities for imported consumer-ready food products in
the Korean retail sector. Large-scale retail stores such as hypermarkets and grocery supermarkets
have become the major retail channel for imported consumer-ready foods as they offer favorable
shopping environment where imported products can better compete against locally manufactured
or grown products. Department stores are likely to remain the leading retail channel for high-end,
premium quality imported foods. On-line retailers are expected to play a bigger role in distributing
imported consumer-ready foods in the future. In particular, on-line retailing should be an efficient
distribution channel for specialty imported products that has limited but diversified demand.

According to Korean government trade data (KOTIS), Korea’s imports of consumer-oriented foods
in 2014 totaled a record high $10.5 billion, up 15.6 percent from the previous year. The United
States remained the leading exporter of consumer-ready food products to Korea by shipping a
record high $3.6 billion of products, up 21.4 percent.
Table 4: Korea’s Imports of Agricultural, Forestry, and Fishery Products (Year 2014, CIF value)
Product Category From the World Total From the U.S.
Value Growth Value Growth
Basic Commodity $6.6 Billion -8.7% $2.5 Billion 102.8%
Intermediary $9.0 Billion 4.4% $1.5 Billion -1.3%
Consumer-Oriented $10.5 Billion 15.6% $3.6 Billion 21.4%
Forestry $3.2 Billion 17.3% $0.2 Billion -2.2%
Fishery $4.2 Billion 16.7% $0.2 Billion 5.4%
Total $33.5 Billion 7.1% $8.1 Billion 31.0% Source: Korea Trade Information Service (KOTIS) Database (www.kita.net)
The outlook for U.S. food exports to the Korean retail sector is excellent for a wide variety of
products, including beef, pork, poultry, seafood, processed vegetables, fresh and processed fruits,
nuts, dairies, juices, alcohol beverages, condiments and sauces, processed organic foods, coffee,
bakery goods, snacks, and confectioneries. In addition, on-going trade liberalization should create
new opportunities for those products that are currently under restrictive import barriers (such as
tariff-rated import quota and phytosanitary certification barrier). In particular, Korea-United
States Free Trade Agreement (KORUS FTA), implemented in March 2012, will help American
products better compete in the Korean market under reduced import tariffs.
Table 5: Advantages and Challenges Facing U.S. Products in Korea
Advantages Challenges
Korea is an emerging market where new ideas
and trends are eagerly tried and accepted,
leading to greater opportunities for new-to-
market products. Consumers are looking for
new and international tastes as the income
level continues to rise.
Consumers are generally biased toward locally
produced products. Many consumers still
maintain a negative view on the quality and
safety of imported foods. Imported foods are
often associated with contaminations and
potential food-borne diseases. In addition,
food safety issues are increasingly becoming
means to restrict imports.
Korea, by nature, depends heavily on imports
for its food and agricultural needs. On-going
elimination of import barriers will improve
market access and price competitiveness of
imported products. In particular, KORUS FTA
will help American products better compete in
the Korean market under reduced import
tariffs.
Imports of many products still face restrictive
trade barriers. Many American fresh fruits
have no access to Korea. Certain food
additives approved for food use in the United
States may not be approved in Korea. Korean
government makes frequent changes into its
food safety/labeling standards.
A series of public food safety scandals
associated with imported products from China
and Japan in recent years has led the general
public and traders to be more concerned
about the quality of imported product that
they buy. Traders are likely to switch
procurement sources to safer sources,
including the United States, in an effort to
Local retailers in general lack experience and
expertise on international sourcing. As a
result, the flow of imported products to the
retailer is often participated by multiple layers
of middlemen, which adds cost and
inefficiency to the supply chain. Retailers are
reluctant to carry imported products of short
shelf life.

regain consumer confidence.
Growth of the retail sector is led by modern
format, large-scale retail businesses, which
offer better environment for imported
products to compete against locally grown or
manufactured products. Large-scale retailers
are actively seeking ways to increase the
assortment of imported products.
Korea maintains a strong food processing
industry, which presents tough competition to
imported consumer-ready products. High
markups coupled with tariffs often deteriorate
price competitiveness of imported products
against locally processed products.
Due to the long history of economic and
political tie between Korea and the United
States, many Korean consumers are familiar
with American products and food trends.
Consumers maintain a positive view on the
quality and value of American products.
English is the most popular foreign language
in Korea.
Consumers maintain negative perceptions
about GMO products. Retailers fear reprisal
from anti-GMO activists and, consequently,
refuse to stock any product that would have to
be labeled "Contains GMO". Many U.S.
products would be required to have "Contains
GMO" labeling under Korean regulations.
II. Road Map for Market Entry
A. Entry Strategy
Market Research:
The first step recommended for new-to-market American supplier seeking an entry into Korea is
preliminary research to determine if there is a potential market for its product in Korea. The
research should cover key issues including consumption trends, size of the market (imports),
major distribution channels, current import tariffs and local taxes, and Korean government
regulations and standards. The research, together with consultations with potential Korean import
partners down the road, can also help the American supplier to tell if any modifications to its
existing products or marketing strategy would be needed. The Foreign Agricultural Service (FAS)
under the United States Department of Agriculture (USDA) is a useful source of information and
resources available to the American supplier. In particular, Attaché GAIN reports covering various
products and industries for the Korean market are available in the FAS website
(www.fas.usda.gov). Local offices in Korea under USDA/FAS can also provide the American
supplier with catered assistance with various market entry tools as well as links to other relevant
sources of support (please see Section V of this report for contact information of the offices).
Additionally, the United States Department of Commerce is another important source of
information for non-agricultural products. In particular, the “Country Commercial Guide”
published by the department includes a wide range of useful information about the Korean market
(www.buyusa.gov/korea/en/).
Establishing Korean Import/Distribution Partners:
While executing the preliminary market research, the American supplier is recommended to
develop dialogues with potential business partners (importers/distributors) in Korea. Lists of
Korean importers by product or by industry are available from the USDA/FAS offices in Korea. The
lists are based on the industry contact database updated by the offices regularly. Korean
importers in general are actively seeking new business opportunities with foreign suppliers and
would willingly provide in-depth market intelligence if they are interested in the supplier’s product
or business offer.
An effective tool recommended for developing contacts with Korean importers is exhibiting in

reputable food trade shows because Korean importers highly value face-to-face encounters when
developing new business with foreign supplier. In particular, the Seoul Food & Hotel, the only
show officially endorsed by USDA/FAS in Korea, has been an outstanding venue for new-to-market
American suppliers to meet with a large number of key importers and distributors in Korea.
Registration information to join the U.S. Pavilion of the show is available from the organizer
(www.seoulfoodnhotel.co.kr, [email protected]). Other international food trade shows that
attract a sizable number of Korean food importers include FoodEx Japan
(www3.jma.or.jp/foodex/en/), Natural Products Expo West (www.expowest.com), Fancy Food
Show (www.specialtyfood.com), SIAL France (www.sialparis.com), and ANUGA Germany
(www.anuga.com).
Another tool recommended is joining trade delegations to Korea organized by various American
agricultural export promotion organizations, such as State Regional Trade Groups (SRTG, e.g.,
Food Export Association of the Midwest USA), State Departments of Agriculture, and USDA
Cooperators (e.g. U.S. Dairy Export Council). Some of the states and USDA cooperators maintain
representative offices or marketing contractors in Korea. Contact information of these
organizations is available from USDA/FAS Korea offices.
As the dialogue develops further and the potential business partner is narrowed down, the
American supplier would be asked to ship sample products to Korea. Sample products shipped to
Korea could be subject to the same set of Korean regulations as required on regular commercial
shipment to enter the market, and therefore allow the American supplier to verify in advance if the
product would have any problem against Korean standards such as export certification requirement
or food additive standard. Test shipment also helps verify the Harmonized Tariff System (HS)
Code that the product would be subject to in Korea, which decides the import tariff or tariff rated
import quota that the product is subject to (for more information about the Advance Product
Classification Service offered by the Korea Customs Valuation and Classification Institute, please
visit www.customs.go.kr).
Once the test shipment finds no conflict against local regulations, and an agreement on price and
transaction terms is reached, both parties would move forward to sign a formal contract to start
actual business. The type of business relationship agreed between the U.S. exporter and the
Korean importer may vary from a market exclusive, long-term business agreement to a non-
binding, one-time purchase order mainly depending on how the exporter sees the role of the
import partner in market development. One common practice is maintaining a non-binding seller-
buyer relationship during the test-market period and then upgrading to a more binding option later
if the partnership proves bigger potential. Letter of credit (L/C) is the most common and
recommended payment terms used between new business partners. It is also recommended that
the contract include an agreement on the method of resolution for any trade dispute that may
arise from the transaction.
Import Food Standards & Regulations:
Korea has well-established standards and regulations on food and agricultural products. Imported
products must meet all the local rules to be able to enter and sell in Korea. For detailed
information regarding standards and regulations that imported food and agricultural products are
subject to in Korea, including Labeling, Packaging, Export Health Certificates, MRL (Maximum
Residue Level) Code, and Food Additive Code, please refer to the following annual reports
published by the Office of Agricultural Affairs/FAS Seoul.
(1) FAIRS (Food and Agricultural Import Regulations and Standards) Country Report Annual 2014,
KS1453 dated December 31, 2014 (or visit www.atoseoul.com or www.fas.usda.gov for more
recent update).

(2) FAIRS Export Certificate Report Annual 2014, KS1452 dated December 31, 2014
(3) Animal & Plant Health Inspection Service (APHIS/USDA) also provides via its website
(www.aphis.usda.gov) detailed information and guidance on export health certificates and
documents required in Korea by product.
Meeting Local Tastes:
One of the common mistakes that American suppliers often make is viewing Koreans as the same
natured consumers in the neighboring countries, Japan and China. Although it is true that people
in these three Far Eastern Asian countries share some parts of their histories and cultures,
Koreans’ tastes for foods are different in many ways from the neighbors. Consequently, products
that are catered to the taste of Korean consumers will have higher chance of making a successful
entry into Korea. Personal visits to Korea should be the best way to develop understanding about
the local tastes. Information gathering through Internet or associating with Korean American
communities could also be an efficient tool.
Meeting local tastes could mean anything from modifying package design to reformulating the
recipe. Package design, in particular, is a very important factor in Korea, and the American
supplier should consider developing a new design that can better attract Korean consumers.
Although many Koreans can read English, adding Korean language on the label can significantly
improve the level of exposure on the shelf. Another noteworthy issue in packaging is the separate
Korean language label required on imported products. This added, stick-on label can detract from
the appearance of the product. The American supplier should discuss the design of the Korean
language label with the import partner for better look. Korean language label is in general printed
by the import partner and hand-attached to the product in the duty free warehouse at the port of
entry before the customs inspection.
New-to-market suppliers should also have a thorough plan for promotional activities and
advertisements to develop local consumer awareness. Korean retailers in general require in-store
promotions at the cost of the supplier when accepting new products. Some of the most widely
offered programs include in-store advertisements, free sampling events, and point of purchase
(POP) sales promotions such as sweepstakes and coupons.
B. Market Structure and Product Flow
Korean retailers in general rely heavily on independent importers for imported food products.
Although leading retailers are currently putting increased efforts to expand direct imports, their
attention is focused on a limited number of large volume products. Purchasing managers in local
retail companies tend to be risk averse, and have yet to develop expertise and experience needed
to carry out direct purchasing on an international scale.
Participation of multiple layers of independent importers and distributor middlemen in the supply
chain is part of the reason behind high consumer price of many imported products in Korea. The
independent importers are required to bear greater amount of the risk than the retailers when
placing a new product on the shelf, which forces the importers to add high markup on new
products to cover potential loss. In contrast, products brought in directly by retailers can be sold
at lower price due to less distribution cost and markup.
It takes at least two weeks for a container ship from a western American port, and three weeks
from an eastern port, to arrive in a port in Korea. In general, most imported consumer ready
products enter the country through the port of Busan, the second largest city in Korea at the

southeastern tip of the peninsula. Port of Inchon, which is much closer to the Seoul metropolitan
market, is another important entry point. Small-volume-high-value products, such as premium
wine, fresh cherries, and chilled beef, are in general brought in via air cargos through Inchon
International Airport (ICN) which is about an hour drive distance from the city of Seoul.
The amount of time that the product sits in the port of entry for food safety inspections and
customs clearance process varies from one day to a couple of weeks largely depending on the kind
of inspection the product is subject to. The detailed laboratory inspection that all new-to-market
products and randomly selected existing products are subject to may take as long as ten working
days. In case of live animals, the quarantine sanitary inspection can take more than a couple of
months. The documentary inspection, which is allowed on products with previous import records,
may be completed within a day or two.
Figure 7: Flow of Imported Products to Retail Sector
Once the products are cleared from the customs, they are transported to the importer’s warehouse
for storage. Importers may have warehouses in more than one location. The importer usually
supplies directly to the large-scale retailer’s warehouses but may use wholesalers or brokers when
supplying to small retailers or to regional markets. Large-scale retailers in general operate a
network of "distribution-hubs" across the country, each of which services all the stores in a given
province or regional market. Most importers are using third party logistics service providers for
warehousing and trucking because of the high overhead cost.
The city of Seoul (capital of Korea) and its surrounding area within 60 miles radius together
account for over 50 percent of the Korean population and 70 percent of total retail sales in Korea.
Although the government maintains a strong policy initiative to develop other parts of the country
for balanced growth, Seoul metropolitan area is expected to maintain a leading share of the retail
market sales in Korea in the coming years. Other markets that are likely to see strong growth of
retail industry include Busan, Inchon, and Daejun (this city, located in the middle section of the
peninsula, has been designated as the new home of the Korean government offices).
C. Sub-Sector Company Profiles
C-1. Hypermarkets
Overall sales of hypermarkets amounted to W47.5 trillion in 2014, up 3.4 percent from the
previous year. The growth of the segment is expected to slowdown in the coming year largely
because there is limited room left in the market to add new stores (typical hypermarket store
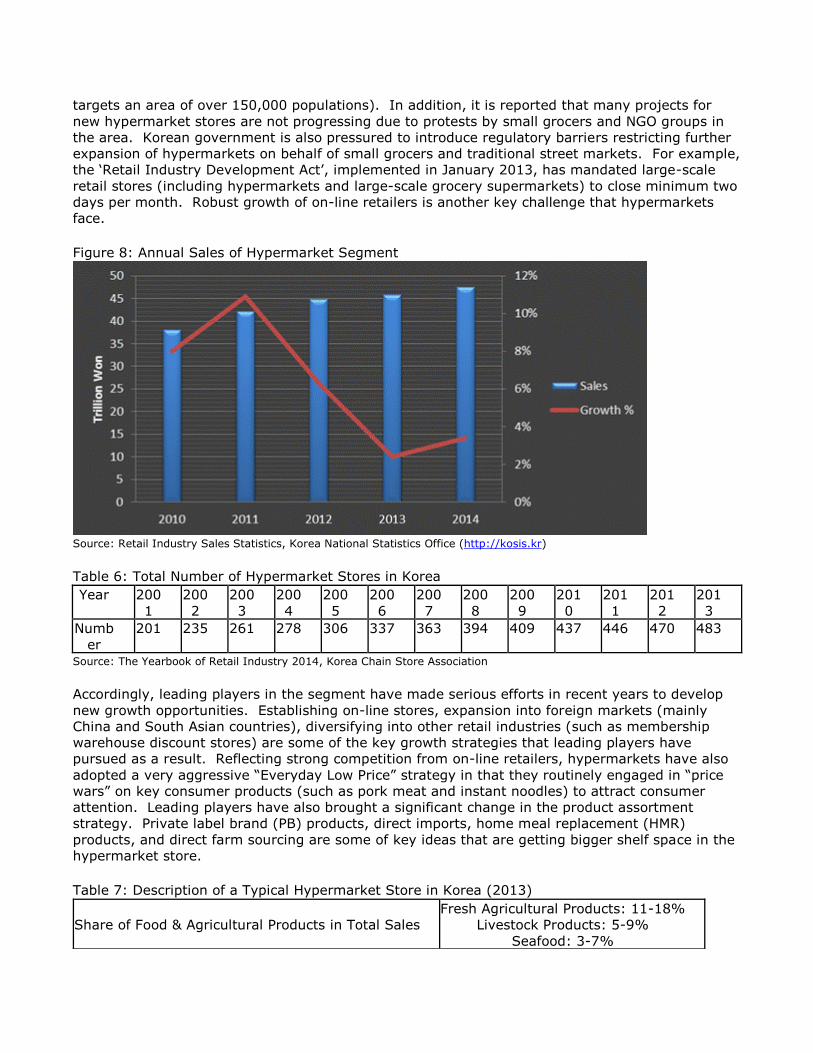
targets an area of over 150,000 populations). In addition, it is reported that many projects for
new hypermarket stores are not progressing due to protests by small grocers and NGO groups in
the area. Korean government is also pressured to introduce regulatory barriers restricting further
expansion of hypermarkets on behalf of small grocers and traditional street markets. For example,
the ‘Retail Industry Development Act’, implemented in January 2013, has mandated large-scale
retail stores (including hypermarkets and large-scale grocery supermarkets) to close minimum two
days per month. Robust growth of on-line retailers is another key challenge that hypermarkets
face.
Figure 8: Annual Sales of Hypermarket Segment
Source: Retail Industry Sales Statistics, Korea National Statistics Office (http://kosis.kr)
Table 6: Total Number of Hypermarket Stores in Korea
Year 200
1
200
2
200
3
200
4
200
5
200
6
200
7
200
8
200
9
201
0
201
1
201
2
201
3
Numb
er
201 235 261 278 306 337 363 394 409 437 446 470 483
Source: The Yearbook of Retail Industry 2014, Korea Chain Store Association
Accordingly, leading players in the segment have made serious efforts in recent years to develop
new growth opportunities. Establishing on-line stores, expansion into foreign markets (mainly
China and South Asian countries), diversifying into other retail industries (such as membership
warehouse discount stores) are some of the key growth strategies that leading players have
pursued as a result. Reflecting strong competition from on-line retailers, hypermarkets have also
adopted a very aggressive “Everyday Low Price” strategy in that they routinely engaged in “price
wars” on key consumer products (such as pork meat and instant noodles) to attract consumer
attention. Leading players have also brought a significant change in the product assortment
strategy. Private label brand (PB) products, direct imports, home meal replacement (HMR)
products, and direct farm sourcing are some of key ideas that are getting bigger shelf space in the
hypermarket store.
Table 7: Description of a Typical Hypermarket Store in Korea (2013)
Share of Food & Agricultural Products in Total Sales
Fresh Agricultural Products: 11-18%
Livestock Products: 5-9%
Seafood: 3-7%

Processed Foods: 21-29%
Prepared Foods: 8-14%
Size of Store 10,000 square meter
Parking Capacity 500 - 700 cars
Number of Employees 100 full-timers, 40 part-timers
Number of Items in Inventory 56,000 SKUs (stock keeping units)
Daily Sales W192 million
Number of Daily Customers 4,800
Per Customer Purchase Amount W40,000 Source: Estimates based on the Yearbook of Retail Industry 2014 (Korea Chain Store Association)
Table 8: Profile of Major Hypermarket Chains in Korea (2013)
Company Store Name Ownership Annual Sales Total Store New Store
EMART Company, Ltd. E Mart Korea W12.3 trillion 148 2
Homeplus Co., Ltd. Home Plus U.K. W11.5 trillion 139 6
Lotte Shopping Co. Lotte Mart Korea W6.5 trillion 108 4
E. Land Retail New Core Korea W2.8 trillion 19 0
Costco Wholesale Korea COSTCO U.S. W2.5 trillion 9 0
KACM Inc. Hanaro Club Korea W1.6 trillion 6 0
Mega Mart Co., Ltd. Mega Mart Korea W0.6 trillion 8 0 Source: The Yearbook of Retail Industry, Korea Chain Store Association
C-2. Grocery Supermarkets
Sales of grocery supermarkets amounted to W35.4 trillion won in 2014, up 0.8 percent from the
previous year. Small to medium size supermarkets under independent ownership accounted for
over 75 percent of the total segment sales. On the other hand, stores under large-scale retail
companies (i.e., Super Supermarkets, SSM), which led the growth of the segment over the years,
have experienced weak growth since 2012 largely due to the government regulations that intended
to protect small grocers and traditional street markets. For example, the government introduced a
regulation in January 2011 that prohibited opening of new SSM stores within 500 meters from
designated “traditional market zones”. SSM stores have also been mandated under the ‘Retail
Industry Development Act’ implemented in January 2013 to close minimum two days per month as
well as between midnight and 10:00 a.m.
Figure 9: Annual Sales of Grocery Supermarket Segment

Source: Retail Industry Sales Statistics, Korea National Statistics Office (http://kosis.kr)
Figure 10: Annual Sales of Super Supermarkets (SSM*)
Source: The Yearbook of Retail Industry 2014, Korea Chain Store Association
*Note: SSM in this figure represents stores under the leading seven SSM companies
Some of the key trends in the segment include improvement in product assortment (to offer more
home meal replacement products, fresh products, portion-packaged products, and private label
brand products), efficient promotions (on-line coupons, membership programs), stronger customer
service (in-store service outlets such as pharmacy, laundry shop, and post office), and expansion
into on-line shopping.
Table 9: Description of a Typical Super Supermarket (SSM) Store in Korea (2013)
Share of Food & Agricultural Products in Total Sales
Fresh Agricultural Products: 22-26%
Livestock Products: 9-13%
Seafood: 5%
Processed Foods: 42%
Prepared Foods: 3-5%
Size of Store 770 square meters
Parking Capacity 50 cars

Number of Employees 10 full-timers, 5 part-timers
Number of Items in Inventory 28,000 SKU
Daily Sales W15 million
Number of Consumers Daily 1,000
Per Consumer Purchase Amount W15,000 Source: Estimates based on The Yearbook of Retail Industry, Korea Chain Store Association
Table 10: Profile of Major Supermarket Chains (2013)
Company Name Store Name Annual Sales Total Store
Lotte Shopping Co. Lotte Super
Market 999 W1.6 trillion 496
GS Retail Co., Ltd. GS Supermarket W1.4 trillion 254
Seowon Utong Co., Ltd. Top-Mart W1.3 trillion 75
Homeplus Co., Ltd. Home Plus Express W1.2 trillion 286
Everyday Retail Co., Ltd. E Mart Everyday W746 billion 132 Source: The Yearbook of Retail Industry 2014, Korea Chain Store Association
C-3. Convenience Stores
Total sales of convenience store segment amounted to W12.7 trillion, up 8.7 percent from the
previous year. Convenience stores have shown strong sales growth particularly in congested
metropolitan areas where office workers and young consumers with busy lifestyle demand an easy
shopping channel for small food purchases.
Due to low entry barrier, convenience store segment saw an explosive opening of new stores
between 2009 and 2012 (total number of stores in the segment grew from 14,130 to 24,559).
However, ‘fair trade guide’, introduced by the Korean government in 2013 under the objective of
fostering sustainable business environment in the segment, resulted in a drastic decline in new
store opening in 2013. Under the guide, new convenience store under same franchise is prohibited
within 250 meter radius of existing store.
Figure 9: Annual Sales of Convenience Store Segment
Source: Retail Industry Sales Statistics, Korea National Statistics Office (http://kosis.kr)

Figure 10: Number of Convenience Stores in Korea
Source: The Yearbook of Retail Industry 2014, Korea Chain Store Association
Expansion of the segment has been driven by the top three players over the years, CU (Family
Mart changed the name to CU in 2012), GS25, and Seven Eleven that currently has over 5,000
stores each. Increased competition in the segment is likely to encourage the leading players to
seek merger and acquisition (M&A) opportunities in the coming years.
Introduction of more Home Meal Replacement (HMR) products and private brand (PB) products
have been heavily emphasized in the segment in recent years for higher profit and customer
loyalty. Another area of emphasis has been offering more service products, including postal
service, quick delivery, banking, and photo processing, to increase consumer traffic to the stores.
It is notable that convenience stores maintain a very aggressive product assortment policy in that
new products are eagerly tried while under-performing products are quickly dropped, a strategy to
keep abreast with the fast changing consumption trends of its target consumers.
Table 11: Description of an Average Convenience Store in Korea (2013)
Share of Food & Agricultural Products in Total
Sales
Liquors: 8%
Snacks: 7%
Daily Delivered Fresh & Chilled Foods:
13%
Processed Foods & Beverages: 18%
Fast Foods: 6%
Tobacco: 38%
Size of Store 75 square meters
Number of Employees 2 full timer, 7 part timer
Number of Items in Inventory 3,000 SKU
Daily Sales W1.5 million
Number of Consumers Daily 350
Per Consumer Purchase Amount W3,700 Source: Estimates based on The Yearbook of Retail Industry 2014, Korea Chain Store Association
Table 12: Profile of Major Convenience Store Chains (2013)
Company Name Store Name Annual Sales Total Stores
BGF Korea Co., Ltd. CU W3.1 trillion 7,939
GS Retail Co., Ltd. GS25 W4.7 trillion 7,774
Korea Seven Co., Ltd. Seven Eleven W2.6 trillion 6,444
Ministop Korea Co., Ltd. Ministop W791 billion 1,897 Source: The Yearbook of Retail Industry 2014, Korea Chain Store Association
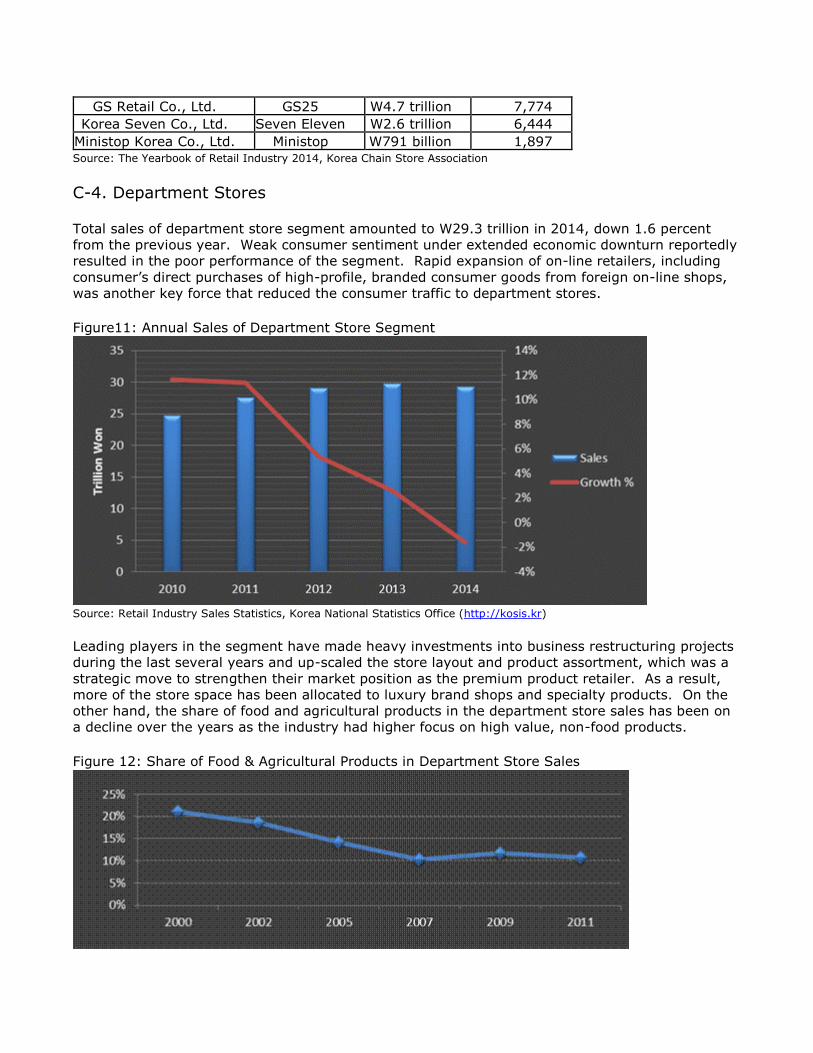
C-4. Department Stores
Total sales of department store segment amounted to W29.3 trillion in 2014, down 1.6 percent
from the previous year. Weak consumer sentiment under extended economic downturn reportedly
resulted in the poor performance of the segment. Rapid expansion of on-line retailers, including
consumer’s direct purchases of high-profile, branded consumer goods from foreign on-line shops,
was another key force that reduced the consumer traffic to department stores.
Figure11: Annual Sales of Department Store Segment
Source: Retail Industry Sales Statistics, Korea National Statistics Office (http://kosis.kr)
Leading players in the segment have made heavy investments into business restructuring projects
during the last several years and up-scaled the store layout and product assortment, which was a
strategic move to strengthen their market position as the premium product retailer. As a result,
more of the store space has been allocated to luxury brand shops and specialty products. On the
other hand, the share of food and agricultural products in the department store sales has been on
a decline over the years as the industry had higher focus on high value, non-food products.
Figure 12: Share of Food & Agricultural Products in Department Store Sales
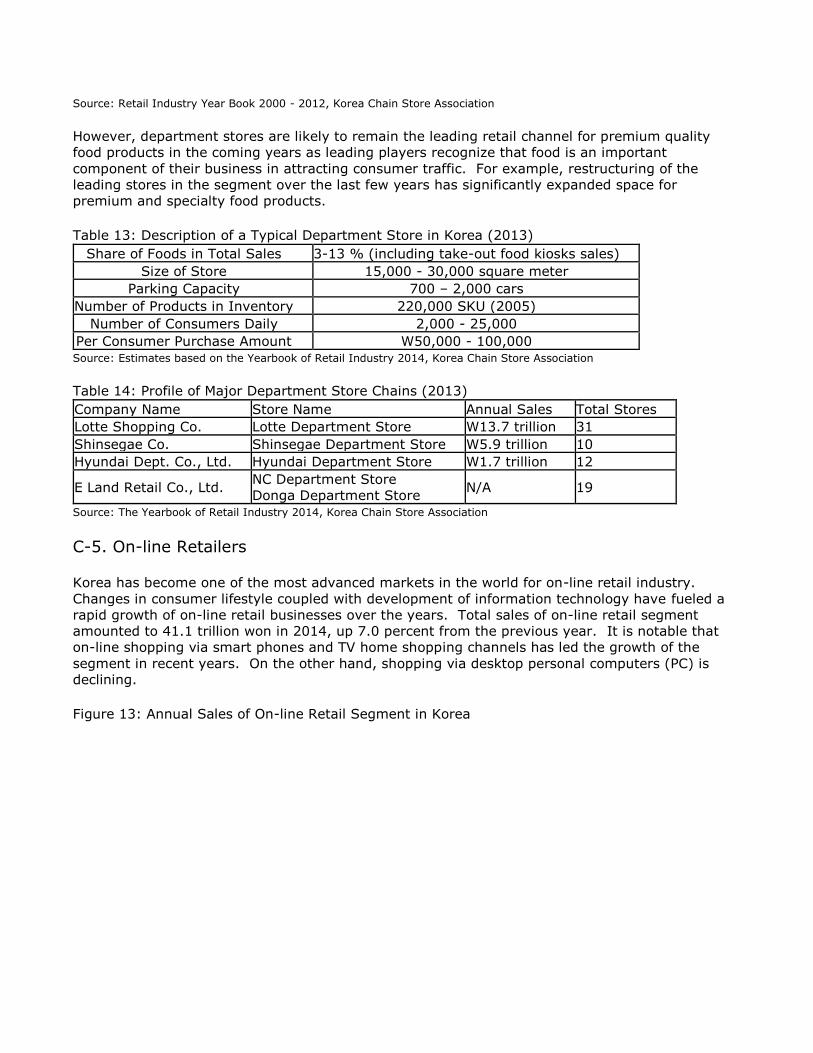
Source: Retail Industry Year Book 2000 - 2012, Korea Chain Store Association
However, department stores are likely to remain the leading retail channel for premium quality
food products in the coming years as leading players recognize that food is an important
component of their business in attracting consumer traffic. For example, restructuring of the
leading stores in the segment over the last few years has significantly expanded space for
premium and specialty food products.
Table 13: Description of a Typical Department Store in Korea (2013)
Share of Foods in Total Sales 3-13 % (including take-out food kiosks sales)
Size of Store 15,000 - 30,000 square meter
Parking Capacity 700 – 2,000 cars
Number of Products in Inventory 220,000 SKU (2005)
Number of Consumers Daily 2,000 - 25,000
Per Consumer Purchase Amount W50,000 - 100,000 Source: Estimates based on the Yearbook of Retail Industry 2014, Korea Chain Store Association
Table 14: Profile of Major Department Store Chains (2013)
Company Name Store Name Annual Sales Total Stores
Lotte Shopping Co. Lotte Department Store W13.7 trillion 31
Shinsegae Co. Shinsegae Department Store W5.9 trillion 10
Hyundai Dept. Co., Ltd. Hyundai Department Store W1.7 trillion 12
E Land Retail Co., Ltd. NC Department Store
Donga Department Store N/A 19
Source: The Yearbook of Retail Industry 2014, Korea Chain Store Association
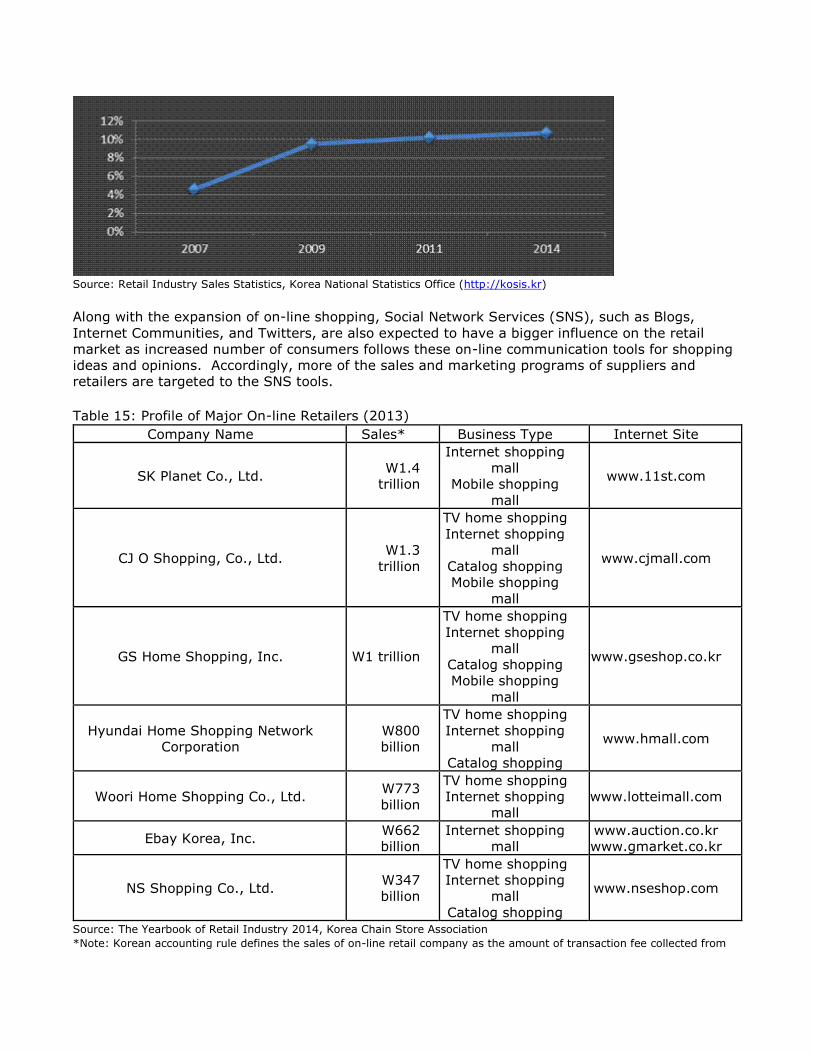
C-5. On-line Retailers
Korea has become one of the most advanced markets in the world for on-line retail industry.
Changes in consumer lifestyle coupled with development of information technology have fueled a
rapid growth of on-line retail businesses over the years. Total sales of on-line retail segment
amounted to 41.1 trillion won in 2014, up 7.0 percent from the previous year. It is notable that
on-line shopping via smart phones and TV home shopping channels has led the growth of the
segment in recent years. On the other hand, shopping via desktop personal computers (PC) is
declining.
Figure 13: Annual Sales of On-line Retail Segment in Korea

Source: Retail Industry Sales Statistics, Korea National Statistics Office (http://kosis.kr);
The Yearbook of Retail Industry 2014, Korea Chain Store Association
Figure 14: Sales of Mobile & TV Home Shopping
Source: Retail Industry Yearbook 2015, Korea Chamber of Commerce;
The Yearbook of Retail Industry 2014, Korea Chain Store Association
Currently food and agricultural products account for a minor, 10.7 percent of the overall segment
sales (or W4.4 trillion won) as of 2014. However, it is likely that the sales of food and agricultural
products in the segment will grow gradually in the coming years as most of the leading
conventional retailers (hypermarkets and grocery supermarkets) are making efforts to expand
sales through their on-line version stores. For example, E-Mart, the leading hypermarket store
chain, launched its new internet store (www.emart.co.kr) in 2010. Orders made through the
internet store can be picked up at conventional E Mart stores, or can be delivered to home (at no
cost for purchases over certain amount) within the day (for orders made by certain time of the
day) or at reserved time in the following day. It is notable that internet E Mart store offers much
wider selections of products than conventional E Mart store.
Table 15: Share of Food & Agricultural Products in On-line Shopping Segment Sales
Source: Retail Industry Sales Statistics, Korea National Statistics Office (http://kosis.kr)
Along with the expansion of on-line shopping, Social Network Services (SNS), such as Blogs,
Internet Communities, and Twitters, are also expected to have a bigger influence on the retail
market as increased number of consumers follows these on-line communication tools for shopping
ideas and opinions. Accordingly, more of the sales and marketing programs of suppliers and
retailers are targeted to the SNS tools.
Table 15: Profile of Major On-line Retailers (2013)
Company Name Sales* Business Type Internet Site
SK Planet Co., Ltd. W1.4
trillion
Internet shopping
mall
Mobile shopping
mall
www.11st.com
CJ O Shopping, Co., Ltd. W1.3
trillion
TV home shopping
Internet shopping
mall
Catalog shopping
Mobile shopping
mall
www.cjmall.com
GS Home Shopping, Inc. W1 trillion
TV home shopping
Internet shopping
mall
Catalog shopping
Mobile shopping
mall
www.gseshop.co.kr
Hyundai Home Shopping Network
Corporation
W800
billion
TV home shopping
Internet shopping
mall
Catalog shopping
www.hmall.com
Woori Home Shopping Co., Ltd. W773
billion
TV home shopping
Internet shopping
mall
www.lotteimall.com
Ebay Korea, Inc. W662
billion
Internet shopping
mall
www.auction.co.kr
www.gmarket.co.kr
NS Shopping Co., Ltd. W347
billion
TV home shopping
Internet shopping
mall
Catalog shopping
www.nseshop.com
Source: The Yearbook of Retail Industry 2014, Korea Chain Store Association
*Note: Korean accounting rule defines the sales of on-line retail company as the amount of transaction fee collected from
transactions intermediated, unless the product or service sold was owned by the on-line retail company. Therefore, the actual value of products transacted through the on-line retailers should be much bigger than the sales figure shown in this table. For example, total value of products and services transacted through Ebay Korea amounted to W8.1 trillion in 2010, but only W354 billion was recorded as the sales of the company.
C-6. Franchise Specialty Grocery Retailers
Growing consumer demand for more efficient shopping channel for specialty food and agricultural
products provides a new growth niche in the market for specialty grocery retailers under franchise
management that offer deep assortment of products within the target product category (as called
“category killer”) at value price. Due to the smaller space and capital input needed, specialty
grocery retailers are spreading in the metropolitan markets where large-scale retail stores have
limited access. Currently health & beauty and organic & natural foods are the leading categories of
products that the specialty grocery retailers are focusing on. However, the segment is likely to
expand its target categories further in the coming years into new areas, such as Home & Garden,
Home Baking, and Drugs Store.
Table 16: Profile of Major Franchise Specialty Grocery Retailers (2013)
Company Store Name Sales Products Stores
Sales
from
Foods
CJ Oliveyoung Olive Young W547
billion Health & Beauty 380 7.7%
Chorokmaeul Co.,
Ltd.
Chorok
Maeul
W138
billion
Organic & Natural
Foods 346
Over
90%
GS Watsons Co.,
Ltd. Watsons
W100
billion Health & Beauty 90 N/A
ORGA Whole Foods ORGA W89
billion
Organic & Natural
Foods 85 96.5%
Source: The Yearbook of Retail Industry 2014, Korea Chain Store Association
D. Traditional Retail Businesses - Wet Markets and Independent Small Grocers
Despite the rapid expansion of the modern format large-scale retail segments, traditional retailers,
mainly regional wet markets and family-operated small grocers, remain active in old metropolitan
areas as well as in rural areas where the environment has yet to merit entry of large-scale
hypermarkets or grocery supermarkets. In addition, policy makers have introduced a series of
regulations over the years that intended to restrict expansion of large-scale retailers under the
strong social initiative of protecting small businesses. For example, large-scale retailers have been
banned from operating shuttle buses provided to the shoppers in distant areas since 2001. A new
regulation introduced in 2011 have prohibited opening of new stores by large-scale retailers within
the direct vicinity of designated “traditional market zones”. However, marketers in general agree
that traditional retailers would continue a decline in the coming years unless they find a way to
meet the consumer demand for value price, convenience, and quality.
There is no official data that tracks the size of traditional retail industry in Korea. Korean
government statistics (Retail & Wholesale Industry Survey) indicate that there were a total of
99,263 “food & beverage” retail stores in Korea that hired less than five employees in 2011.
Traditional retailers tend to focus on a limited assortment of fresh products, such as grains,
produce, seafood, and meats, and carry less variety of processed foods. Imported products that
are distributed in significant volume through traditional retailers include fresh fruits and
vegetables, processed fruits, dried vegetables, seafood, meat, spices, cereals, and cooking oils.

Regional wholesale markets run by provincial governments serve as a key distribution channel of
fresh agricultural and fishery products to traditional retailers. Independent wholesalers, most of
them specialized in a limited category of products, are the major distributor of processed foods to
the traditional retailers.
III. Competition
Locally grown or manufactured products present a significant competition to many American
products. Although limited in volume, Korean agriculture produces a considerable variety of raw
agricultural products, including rice, fresh vegetables (cabbage, radish, cucumber, pumpkin, onion,
potato, sweet potato, green onion, mushroom, garlic, etc.), fruits (apple, pear, tangerine orange,
grape, persimmon, water melon, strawberry, kiwi, etc.), seafood, beef, pork, chicken, eggs, and
fluid milk. In addition, Korea has a strong food processing industry that manufactures a wide
variety of processed products, including processed meat, seafood, vegetables, fruits, noodles,
sauces, oils, grain flour, beverages, snacks, confectioneries, dairies, and liquors. Domestically
produced products should better reflect the tastes and consumption trends of local consumers than
imported products. Furthermore, Korean consumers are generally biased toward locally grown and
manufactured products and willingly pay premium on domestic products.
Table 17: Korea’s Self-Sufficiency Rate for Agricultural and Fishery Products
Product 1990 2000 2010
Grains Total 43.8% 30.8% 26.7%
Rice 108.3% 102.9% 104.6%
Wheat 0.1% 0.1% 1.7%
Corn 1.9% 0.9% N/A
Beans 20.1% 6.8% 31.7%
Vegetables 98.9% 97.7% 89.3%
Fruits 102.5% 88.7% 81.1%
Beef 53.6% 53.2% 43.2%
Pork 100.3% 91.6% 80.9%
Chicken 100% 79.9% 79.7%
Eggs 100% 100% 99.8%
Milk & Dairies 92.8% 81.2% 65.4%
Fish & Clams 121.7% 132.6% N/A
Fat & Oil 8.0% 3.2% N/A Source: Korea Rural Economic Institute report 2011 (www.krei.re.kr)
Korea relies heavily on imports for input ingredients for the local processing industry as well as for
consumer-oriented products for the retail industry that are not grown or manufactured enough in
Korea. Many U.S. products face rising competition in the Korean market from products from
export oriented countries, including China, EU, Australia, Chile, and South Asian countries. Many
of the products from competitor countries offer either lower price or higher quality than U.S.
products and accordingly have built up significant market shares in Korea. China, for example, has
become the leading supplier of fresh and processed vegetables, seafood, and spices to Korea
based on price. EU has become the leading supplier of premium whiskies, wine, specialty cheeses,
chocolate confectioneries, pasta, and olive oil to Korea based on quality. Increased consumer
demand for more diversified tastes will further generate competitive pressure on American
products in Korea.
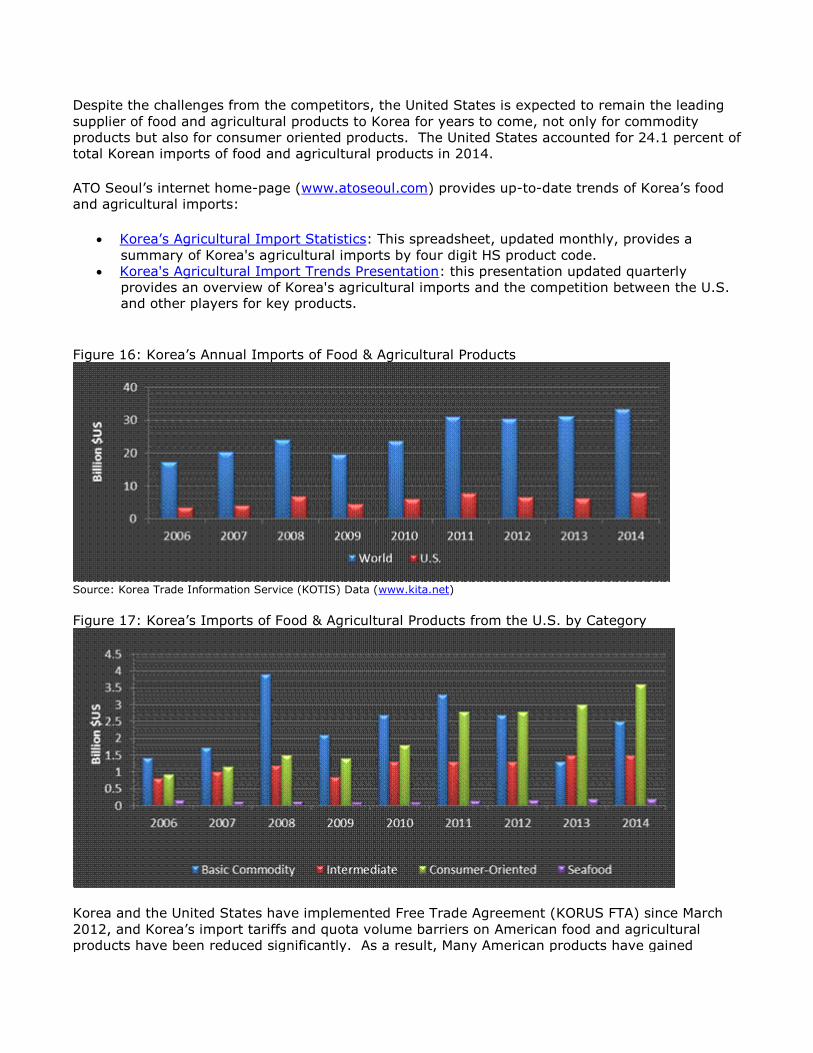
Despite the challenges from the competitors, the United States is expected to remain the leading
supplier of food and agricultural products to Korea for years to come, not only for commodity
products but also for consumer oriented products. The United States accounted for 24.1 percent of
total Korean imports of food and agricultural products in 2014.
ATO Seoul’s internet home-page (www.atoseoul.com) provides up-to-date trends of Korea’s food
and agricultural imports:
Korea’s Agricultural Import Statistics: This spreadsheet, updated monthly, provides a
summary of Korea's agricultural imports by four digit HS product code.
Korea's Agricultural Import Trends Presentation: this presentation updated quarterly
provides an overview of Korea's agricultural imports and the competition between the U.S. and other players for key products.
Figure 16: Korea’s Annual Imports of Food & Agricultural Products
Source: Korea Trade Information Service (KOTIS) Data (www.kita.net)
Figure 17: Korea’s Imports of Food & Agricultural Products from the U.S. by Category
Korea and the United States have implemented Free Trade Agreement (KORUS FTA) since March
2012, and Korea’s import tariffs and quota volume barriers on American food and agricultural
products have been reduced significantly. As a result, Many American products have gained

competitive advantage over competitors that lacked free trade agreements with Korea. ATO Seoul
website provides detailed information about the agreed effects of KORUS FTA, including FTA
Product Briefs on over 40 high prospective products
(http://www.atoseoul.com/fta/fta_page2_final.asp).
Shifts of currency exchange rates among competitor countries have been another important factor
that affected the price competition in Korea. Between January 2014 and January 2015, the value
of U.S. dollar rose 5.1 percent against Korean won, while Euro and Australian dollar value declined
7.8 percent and 3.7 percent respectively. As a result, import cost of American products to the
Korean importer went up comparatively to European and Australian products.
Figure 18: Shifts of Exchange Rates of U.S. Dollar against Korean Won
Source: Korea Exchange Bank
IV. Best Product Prospects* *Note: All import value figures in this section is based on Korea Trade Information Service (KOTIS)
database
A. Products Present in the Market Which Have Good Sales Potential
1. Beef: The United States shipped $706 million of beef to Korea in 2014, up 33.5 percent from
the previous year, which accounted for 42.2 percent of Korea’s total beef imports.
Beef is considered a premium meat in Korea. Over 720 thousand metric tons is annually
consumed, with over 50 percent of it being imported. Over 82 percent of imported beef is frozen
because about 70 percent of imported beef is used in the HRI sector. Additional 10 percent is used
by processing industry. The rest 20 percent is marketed through the retail stores. The top
imported cuts are short ribs, accounting for over 40 percent of total imports, followed by loin,
briskets, and fore shank meat.
The United States and Korea agreed to fully open up the market for U.S. beef in 2008. However,
Korean beef importers and U.S. exporters reached a commercial understanding that, as a
transitional measure, only U.S. beef from cattle less than 30 months of age will be shipped to
Korea. Products produced at plants that have been approved under the EV and QSA program
provided by the Agricultural Marketing Service are allowed to export beef to Korea. While eligible
under the protocol, imports of processed products from animals less than 30 months of age are not
being shipped because the Korea Food and Drug Administration (KFDA) has yet to lift its
suspension that would allow for products that meet the OIE standards.

2. Pork: Pork is the most popular meat among Korean consumers with annual consumption
exceeding 1.5 million metric tons, nearly one-third of it imported. The United States, Canada and
Chile account for 32 percent, 12 percent and 9 percent of total imports, while the European Union
countries account for roughly 36 percent. Over 93 percent of imported pork is frozen, and
primarily used for processing, but there are growing opportunities for imports of chilled pork for
use in the HRI sector and retail sector. The top imported cuts are pork bellies, picnics and Boston
butt. Pork imports from the United States totaled $384 million in 2014, up 28 percent from the
previous year.
3. Processed meats (sausages, hams of non beef ingredients): Busy lifestyle and introduction of
western recipes generate increased demand for imported processed meat products such as hams
and sausages. Imports of processed meat products (falling under HS 1601) from the United States
amounted to $28 million in 2014, up 13.8 percent from the previous year.
4. Poultry meats (largely chicken): Per capita poultry meat consumption in Korea is now second
only to pork and is expected to continue to grow in the coming years. In 2014, poultry meat
imports totaled nearly $252 million of which almost $98 million was from the United States. About
80 percent of imported chicken meat is frozen chicken legs. By the way, due to outbreaks of Avian
Influenza in the United States, imports of American poultry meats are currently restricted as of
March 2015.
5. Dairy products (mainly cheese): Koreans are developing taste for cheese. Cheese and curd
imports from the United States amounted to $301 million in 2014, up 59.9 percent from the
previous year. Although a majority of the cheese and curd imported are used by local processors,
increased volume is marketed through the retail sector. Imports of butter from the United States
amounted to $6.5 million, up 24.7 percent from the previous year.
6. Seafood: Korea is an outstanding seafood market with good growth potential for a wide variety
of imported products. The domestic supply is decreasing due to the depletion of near sea fishery
resources and increased restrictions on international deep-sea fishing. On top of that, Korean
importers are seeking alternative source of seafood that can replace Japanese products due to
safety concerns (there was explosion of nuclear power plants in Hukusima, Japan in March 2011).
Seafood imports from the United States totaled $217 million in 2014, up 6.2 percent from the
previous year. Imports of fresh/chilled fish fillet and crustaceans in particular showed a very
strong growth, 23.6 percent and 81.6 percent respectively to $64.9 million and $44.5 million.
Major species currently imported from the United States include Alaska Pollack, Pollack surimi,
Pollack roes, tuna, skate, mackerel, hagfish, halibut, scallop, cod, salmon, angler fish, rock fish,
lobster, crabs, and sea cucumber.
7. Fresh fruits: Seasonal fluctuations in local fresh fruit supply as well as consumers’ strong
demand for new taste generate increased imports of fresh fruits. Imports of fresh fruits from the
United States totaled $384 million in 2014, up 2.7 percent from the previous year. Major
American fresh fruits imported include: citrus ($196 million), grapes ($32 million), and cherries
($123 million).
8. Tree nuts: Consumption of tree nuts continues to increase due to highly publicized health
benefits of eating nuts (in particular almonds and walnuts). Korea relies almost entirely on
imports to meet the demand. Imports of tree nuts from the United States amounted to $346
million in 2014, up 22.9 percent from the previous year.
9. Processed fruits and nuts: Processed fruits and nut products are gaining consumer popularity
due to their natural and healthy image. Imports of processed fruit and nut products (HS 0811 –
0814) from the United States totaled amounted to $31.4 million, up 16.6 percent from the
previous year.

10. Fruit juices: Increased attention to healthy diet generates strong consumption of fruit juices in
Korea. In particular, more consumers are switching to higher quality products such as ‘Not from
concentrate’ or ‘No artificial ingredient added’ products. Imports of fruit juices from the United
States totaled $55.5 million 2015. A majority of the imported fruit juices are blended and bottled
by local processors in Korea.
11. Coffee: As more Korea consumers are switching to espresso coffee from instant coffee, imports
of coffee beans and powder in both bulk and retail package are on a rapid increase. Korea’s
imports of coffee products totaled $527 million in 2014, up 26.9 percent from the previous year.
Imports from the United States amounted to $35.5 million.
12. Confectionery products (chocolates & candies): Imports of chocolate based confectionary
products from the United States amounted to $95.6 million in 2014, up 5.8 percent from the
previous year. Imports of sugar based confectionery products from the United States amounted to
$30.2 million, up 41.1 percent from the previous year.
13. Bread, cakes, and pastry: Introduction of western food culture generates increased demand for
imported bread, pastry, and cake products. Imports from the United States amounted to $76.3
million in 2014, up 20.9 percent from the previous year.
14. Prepared Sauces: Introduction of foreign recipes generates increased demand for imported
sauces and condiments. Imports of prepared sauces from the United States amounted to $29.9
million in 2014, up 3.7 percent from the previous year.
15. Alcohol Beverages: Korea remains one of the leading markets in the world for alcohol
beverages. Increase of female drinkers and demand for diversified tastes among young
consumers are likely to expand the market for imported beer, wine and distilled spirits in the
coming years. Imports from the United States amounted to $21.5 million for wine; $7.3 million for
beer; and $9.9 million for distilled consumer spirits in 2014.
16. Flavored mineral water (soft drinks): Demand for new taste generates strong demand for
imported soft drinks. Imports of flavored mineral water from the United States amounted to $25.1
million in 2014.
17. Rice: Minimum market access (MMA) program that Korea has established for rice trade under
World Trade Organization (WTO) maintains significant imports of American rice into Korea. Rice
imports from the United States amounted to $22.3 million in 2014. Although a majority of the
imported rice is currently used by processors and food service sector, increased number of retail
stores is likely to offer the imported rice in the coming year to attract consumers with diversified
taste.
B. Products Not Present in Significant Quantities But Which Have Good Sales Potential
1. Pasta: Italian cuisine is gaining popularity among the Korean consumers, generating increased
demand for related products, including pasta noodles. Among the $139.9 million of pasta products
imported in 2014, imports from the United States amounted to mere $1.3 million. Traders point
out that the United States, a leading supplier of semolina wheat should also have a potential to
become a major supplier of pasta noodles.
2. Wheat flour: There is a market potential for imported wheat flour as the price of locally milled

products continues to rise. Among the $14.6 million of wheat flour imported into Korea in 2014,
imports from the United States amounted to less than $1 million. Traders point out that imported
wheat flour needs modifications to meet the specifications required by local recipes.
3. Bakery premixes (including frozen dough): The idea of home baking is spreading among young
housewives, which should generate increased opportunity for imported bakery premixes.
4. Olive oil: Demand for olive oil remains strong as consumers are seeking healthier alternatives
for conventional cooking oils. However, among the $57 million of olive oil imported in 2014,
imports from the United States amounted to less than $1 million.
5. Processed turkey meat: Many Korean consumers still maintain a negative image on turkey
meat. However, processed turkey products (hams in particular) are likely to gain more local
followers, especially among young consumers who have traveled to the United States and have
developed tastes for related recipes. Additionally, low fat diet, which is followed by a significant
number of health-conscious Koreans, should help improve the image of turkey meat
6. Premium seafood: There is a growing potential for premium American seafood products such as
lobster, crabs (King, Snow, and Dungeness), black cod, halibut, scallop and wild caught Alaskan
salmon in Korea as affluent consumers are looking for premium, healthier alternatives for beef and
other meat dishes. However few Korean consumers have understanding about the quality of
premium seafood from the United States. For example, few local consumers are aware of the
quality difference between the farmed Norwegian salmon and wild-caught Alaskan salmon.
7. Vegetables: Although Korea is self-sufficient in many varieties of fresh vegetables, seasonal
fluctuations in the local supply and unfavorable growing condition for foreign varieties are resulting
in an increased demand for imports. China has emerged as the leading supplier of vegetables to
Korea in both fresh and processed category. However, Korean consumers’ strong attention to
quality and safety may generate increased opportunity to American suppliers in the coming year.
Among $199 million of fresh vegetables that Korea imported in 2014, imports from the United
States amounted to $13.9 million (mostly potatoes, lettuce, and cabbages).
8. Pecans, Pistachios: Over 99 percent of tree nuts that Korea imported from the United States are
almonds and walnuts. Pecans and pistachios have a good market potential in Korea if Korean
consumers understanding about the health benefits of eating pecans and pistachios improves.
9. Prepared foods: Demand for Home Meal Replacement (HMR) products is on a rapid increase,
reflecting busier lifestyle of Korean consumers. Ready-to-serve, prepared foods or microwavable
instant foods targeting the retail sector have a good potential. But marketers point out that
imported prepared foods in general need modifications to meet local consumer’s taste.
10. Processed organic food: Korea and the United States established an equivalency agreement on
processed organic food in 2014, which allows American processed organic food certified under
USDA National Organic Program (NOP) to enter Korea without local certification. As a result,
American suppliers should develop increased export opportunity to Korea.
11. Specialty fruits: Diversified consumer taste generates increased demand for imported specialty
fruits. Key American products with good growth potential include lemon, lime, grapefruits,
avocado, pomegranate, and blueberries.
C. Products Not Present Because They Face Significant Barriers

1. Because of the risk of transferring pests, trade of fresh fruits and vegetables are only possible
when Korea approves phytosanitary standards of the United States through a pest risk assessment
process, which takes a considerable amount of time for both laboratory and field studies. Many
American fresh fruits, including apples, pear, peach, strawberries, and berries other than
blueberries from state of Oregon are currently banned for imports into Korea as there is no
phytosanitary import agreement established on these products between Korea and the United
States.
2. Imports of approved fresh fruits and vegetables are frequently restricted for phytosanitary
issues, such as outbreaks of fruit flies. Outbreaks of animal diseases, such as swine cholera, avian
influenza, and bovine spongiform encephalopathy (BSE), also restrict imports of related animal
products into Korea. U.S. suppliers should contact established Korean importers or FAS Seoul for
up-to-date information on regulatory issues that restrict imports. Restrictions currently in place
include:
(1) Beef jerky and other processed foods containing beef ingredients are currently restricted for
BSE risk.
(2) Lamb meat and other meat from ruminant animals, except for beef meat from cattle under 30
months of age, are restricted for BSE risk. Korea’s imports of meat from ruminant animals other
than beef totaled $42.9 million in 2014, up 56.3 percent from the previous year.
(3) American elk antlers currently have no access to the Korean market due to Chronic Waste
Disease risk. Korea’s imports of antlers totaled $31.2 million in 2014, up 11.2 percent from the
previous year.
(4) Korea maintains an import ban on fresh potatoes from many American states due to nematode
risk.
(5) Due to outbreaks of Avian Influenza in the United States, imports of American poultry meat
products are currently restricted as of March 2015.
3. Unprocessed organic agricultural products: Korean regulation does not recognize USDA NOP
organic certification for unprocessed agricultural products. American unprocessed organic
agricultural products such as organic rice and organic oranges are required to obtain certification
by Korea’s accredited certifying agents to enter Korea. Because of high cost (and the certification
should be renewed every year), Korean importers are reluctant to import unprocessed organic
agricultural products unless there is big enough demand for the product. Furthermore, there is a
high chance for imported unprocessed organic agricultural products (fresh vegetables and fruits in
particular) to be fumigated with chemical agents to prevent potential pest risk during the import
quarantine inspection process, which disqualifies the product from “organic” status.
4. The Korean Food Code has yet to further evolve to recognize the standards and rules already
established in foreign countries. As a result, imported products allowed in foreign countries but do
not meet the Korean regulation are restricted. For example, cheese and processed dairy products
made from non-heat treated milk are currently restricted because Korean food code mandates that
cheese and processed dairy products be made solely from heat treated milk.
5. The Korean Food Additive Code defines specifications and usage standards for individual food
additives. Korea utilizes a “positive list” system for food additives meaning any food additive not
listed in the code for target use is prohibited. The Korean standard differs from the CODEX
standard in some cases and consequently may prohibit entry of American products manufactured
solely under the CODEX or American standard.

V. Key FAS/USDA Contacts and Further Information
A. USDA/FAS Offices in Korea
1. For information about the Korean agricultural market and regulations, please contact:
U.S. Agricultural Trade Office Seoul (ATO)
Korean Address: Room 303, Leema Building, 146-1, Susong-dong, Jongro-gu, Seoul, Korea
U.S. Mailing Address: U.S. Embassy Seoul, Unit 15550-ATO, APO, AP 96205-5550
Telephone: +82-2 6951-6848 Fax: +82-2 720-7921
E-mail: [email protected]
Internet homepage: www.atoseoul.com
Agricultural Affairs Office, U.S. Embassy Seoul (AAO)
Korean Address: U.S. Embassy, 82, Sejong-ro, Jongro-gu, Seoul, Korea
U.S. Mailing Address: U.S. Embassy Seoul, Unit 15550-AgAff, APO, AP 96205-5550
Telephone: +82-2 397-4297 Fax: +82-2 738-7147
E-mail: [email protected]
2. For further information about sanitary/export certificate requirements, please contact:
U.S. Animal Plant and Health Inspection Service Seoul (APHIS)
Korean Address: Room 303, Leema Building, 146-1, Susong-dong, Jongro-gu, Seoul, Korea
U.S. Mailing Address: U.S. Embassy Seoul, Unit 15550-APHIS, APO, AP 96205-5550
Telephone: +82-2 725-5495 Fax: +82-2 725-5496
E-mail: [email protected]
Internet Homepage: www.aphis.usda.gov
B. State Regional Trade Groups (SRTG) For information about export assistant programs offered by State Regional Trade Groups, please
contact:
Western United States Agricultural Trade Association (WUSATA)
2500 Main Street, Suite 110, Vancouver, WA 98660-2697, USA
Telephone: 360-693-3373 Fax: 360-693-3464
E-mail: [email protected]
Website: www.wusata.org
Food Export Association of the Midwest USA
309 W. Washington St., Suite 600, Chicago, Illinois 60606, USA
Telephone: 312-334-9200 Fax: 312-334-9230
E-mail: [email protected]
Website: www.foodexport.org
Food Export USA - Northeast Region of the United States
150 S. Independence Mall West, 1036 Public Ledger Building, Philadelphia, PA 19106, USA
Telephone: 215-829-9111 Fax: 215-829-9777
E-mail: [email protected]
Website: www.foodexportusa.org

Southern United States Agricultural Trade Association (SUSTA)
2 Canal Street Suite 2515, New Orleans, LA 70130, USA
Telephone: 504-568-5986 Fax: 504-568-6010
E-mail: [email protected]
Website: www.susta.org
C. Additional Sources of Information & Support
1. For information on the non-agricultural commercial and industrial products in Korea, please
contact:
U.S. Commercial Service
Korean Address: U.S. Embassy, 82, Sejong-ro, Jongro-gu, Seoul, Korea
U.S. Mailing Address: U.S. Embassy Seoul, Unit 15550-USCS, APO, AP 96205-5550
Telephone: +82-2 397-4535 Fax: +82-2 739-1628
E-mail: [email protected]
Homepage: www.buyusa.gov/korea
2. The American Chamber of Commerce in Korea (AMCHAM) offers a local network of American
businesses by sector, through which its over 1,000 member companies can share market
intelligence and collaborate on new business opportunities.
Address: #4501 Trade Tower, 159-1 Samsung-dong, Gangnam-gu, Seoul, Korea
Telephone: +82-2 564-2040 Fax: +82-2 564-2050
E-mail: [email protected]
Homepage: www.amchamkorea.org