THIS REPORT CONTAINS ASSESSMENTS OF COMMODITY AND … · Exchange Rate (Kshs/USD)1 85.07 86.00...
15
THIS REPORT CONTAINS ASSESSMENTS OF COMMODITY AND TRADE ISSUES MADE BY USDA STAFF AND NOT NECESSARILY STATEMENTS OF OFFICIAL U.S. GOVERNMENT POLICY Date: GAIN Report Number: Approved By: Prepared By: Report Highlights: Kenya’s fast growing middle class, rapid urbanization, an expanding modern food retail and food service sectors continue to drive demand for high-value consumer-oriented products. As a result, FAS/Nairobi projects Kenya’s consumer-oriented food imports including edible fish and seafood products to reach $300 million in 2014. The best product prospects for U.S. exporters include tree nuts (almonds and pistachios), pasta, sauces, mixed condiments and seasonings, dried fruits, wine, and pet food. Carol N. Kamau Kate Snipes 2014 Exporter Guide Exporter Guide Kenya 12/18/2014 Required Report - public distribution
Transcript of THIS REPORT CONTAINS ASSESSMENTS OF COMMODITY AND … · Exchange Rate (Kshs/USD)1 85.07 86.00...
THIS REPORT CONTAINS ASSESSMENTS OF COMMODITY AND TRADE ISSUES MADE BY
USDA STAFF AND NOT NECESSARILY STATEMENTS OF OFFICIAL U.S. GOVERNMENT
POLICY
Date:
GAIN Report Number:
Approved By:
Prepared By:
Report Highlights:
Kenya’s fast growing middle class, rapid urbanization, an expanding modern food retail and food
service sectors continue to drive demand for high-value consumer-oriented products. As a result,
FAS/Nairobi projects Kenya’s consumer-oriented food imports including edible fish and seafood
products to reach $300 million in 2014. The best product prospects for U.S. exporters include tree nuts
(almonds and pistachios), pasta, sauces, mixed condiments and seasonings, dried fruits, wine, and pet
food.
Carol N. Kamau
Kate Snipes
2014 Exporter Guide
Exporter Guide
Kenya
12/18/2014
Required Report - public distribution
SECTION I. MARKET OVERVIEW
Economic Situation
Kenya remains an economic powerhouse in the East African region, and the fifth largest in Sub-Saharan
Africa with Gross Domestic Product (GDP) estimated at $55.2 billion (2013). The Economic
Intelligence Unit (EIU) estimates real GDP to grow by 5.2 percent in 2014, and quicken to 5.7 percent
in 2015. EIU also projects an annual average economic growth rate of 5.9 percent in 2015-to-2019, and
5.5 percent from 2021 to 2030. Ongoing investment in infrastructure development, increased regional
trade within the East African Community (EAC), large irrigation projects, and strong consumer demand
are the key factors driving economic growth. Ongoing discovery of oil deposits also lifts up growth
prospects by opening new investments and business opportunities.
Kenya is a net importer of agricultural commodities and food products. Value of agricultural exports to
Kenya increased at annual average rate of five percent between 2009 and 2013 calendar years. In the
past three calendar years, 2011, 2012, and 2013 agricultural, fish, and forestry products imports
averaged $2 billion of which products worth $250 million comprised of high-value consumer foods and
beverages, with the United States supplying food products worth $10 million. Limitations in Kenya’s
agro processing sector, a fast growing middle class and population, an expanding food service and
modern food retail sector, offers U.S. exporters’ opportunities to tap into Kenya’s agricultural food
market.
In addition, Kenya is a gateway to East Africa and a trade hub. It offers easy connections to other
countries, has a relatively highly skilled work force, and is a financial hub. Many regional importers
and retailers are based in Nairobi and Mombasa.
However, Kenya continues to grapple with several challenges that slow economic growth and
development:
Security risks associated with terrorism and general crime;
Inadequate/weak infrastructure;
Corruption (ranked 145 globally out of 175 countries);
High cost of energy/power;
Inadequate water due to recurrent droughts (which affects agricultural production, hydroelectric
capacity, and manufacturing); and
Limited and weak internet connectivity.
The following table and narrative summarizes Kenya’s key economic trends and agricultural products
imports:
Economic Trends 2011 2012 2013 2014E 2015
F
Population (million)1 42.0 43.2 44.4 45.5 46.7
Population Growth Rate (%)1 2.46 2.46 2.46 2.36 2.32
Formal Sector Employment (million)2 2.08 2.16 2.27 2.30 2.40
Informal Sector Employment (million)2 12.12 12.78 13.52 14.00 14.50
Public Sector Employment ('000s)2 643 662 688 700 720
Nominal Gross Domestic Product (GDP) (in million
USD)1 41,955 50,333 55,241 60,648 65,805
GDP per capita (US$ at PPP)1 2,585 2,736 2,837 2,951 3,096
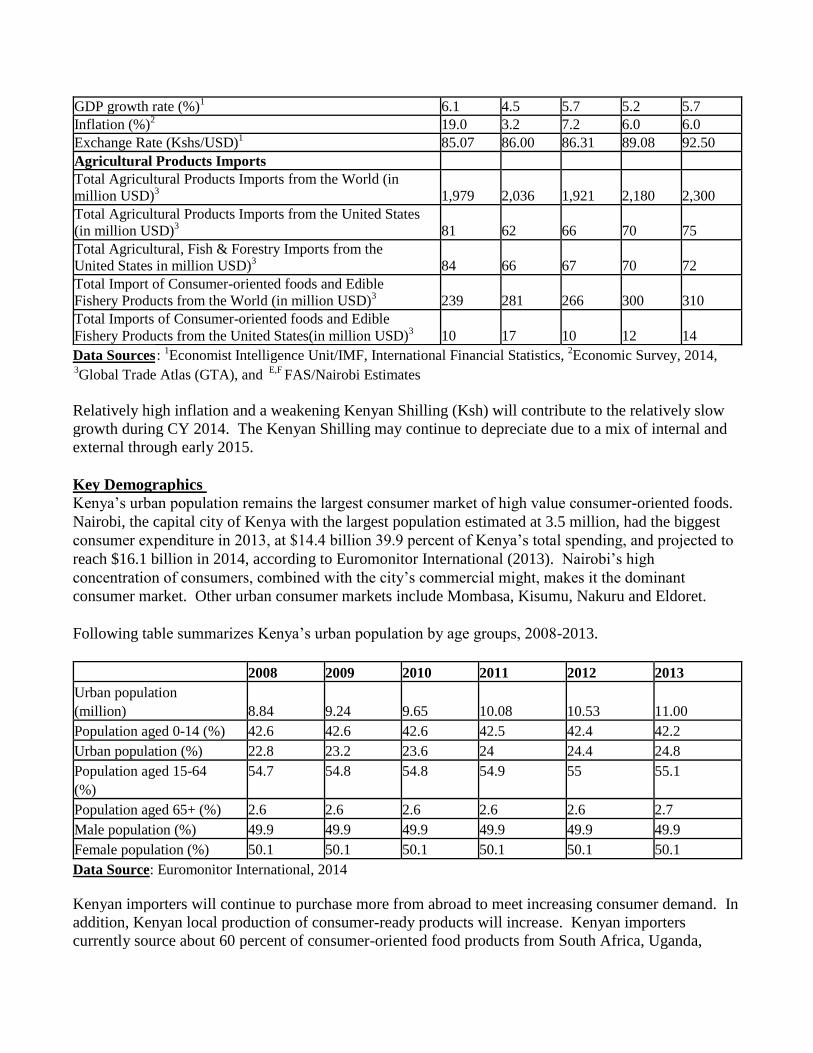
GDP growth rate (%)1 6.1 4.5 5.7 5.2 5.7
Inflation (%)2 19.0 3.2 7.2 6.0 6.0
Exchange Rate (Kshs/USD)1 85.07 86.00 86.31 89.08 92.50
Agricultural Products Imports
Total Agricultural Products Imports from the World (in
million USD)3 1,979 2,036 1,921 2,180 2,300
Total Agricultural Products Imports from the United States
(in million USD)3 81 62 66 70 75
Total Agricultural, Fish & Forestry Imports from the
United States in million USD)3 84 66 67 70 72
Total Import of Consumer-oriented foods and Edible
Fishery Products from the World (in million USD)3 239 281 266 300 310
Total Imports of Consumer-oriented foods and Edible
Fishery Products from the United States(in million USD)3 10 17 10 12 14
Data Sources: 1Economist Intelligence Unit/IMF, International Financial Statistics,
2Economic Survey, 2014,
3Global Trade Atlas (GTA), and
E,F FAS/Nairobi Estimates
Relatively high inflation and a weakening Kenyan Shilling (Ksh) will contribute to the relatively slow
growth during CY 2014. The Kenyan Shilling may continue to depreciate due to a mix of internal and
external through early 2015.
Key Demographics
Kenya’s urban population remains the largest consumer market of high value consumer-oriented foods.
Nairobi, the capital city of Kenya with the largest population estimated at 3.5 million, had the biggest
consumer expenditure in 2013, at $14.4 billion 39.9 percent of Kenya’s total spending, and projected to
reach $16.1 billion in 2014, according to Euromonitor International (2013). Nairobi’s high
concentration of consumers, combined with the city’s commercial might, makes it the dominant
consumer market. Other urban consumer markets include Mombasa, Kisumu, Nakuru and Eldoret.
Following table summarizes Kenya’s urban population by age groups, 2008-2013.
2008 2009 2010 2011 2012 2013
Urban population
(million)
8.84
9.24
9.65
10.08
10.53
11.00
Population aged 0-14 (%) 42.6 42.6 42.6 42.5 42.4 42.2
Urban population (%) 22.8 23.2 23.6 24 24.4 24.8
Population aged 15-64
(%)
54.7 54.8 54.8 54.9 55 55.1
Population aged 65+ (%) 2.6 2.6 2.6 2.6 2.6 2.7
Male population (%) 49.9 49.9 49.9 49.9 49.9 49.9
Female population (%) 50.1 50.1 50.1 50.1 50.1 50.1
Data Source: Euromonitor International, 2014
Kenyan importers will continue to purchase more from abroad to meet increasing consumer demand. In
addition, Kenyan local production of consumer-ready products will increase. Kenyan importers
currently source about 60 percent of consumer-oriented food products from South Africa, Uganda,
Egypt and Europe. The price sensitivity and competition from new local suppliers have resulted in
fluctuations of imports from the United States, but we project the trend will continue upward.
Best consumer-oriented product prospects include almonds, pasta, prunes, dates, sauces and
condiments, wine and beer. See Section IV for a detailed analysis.
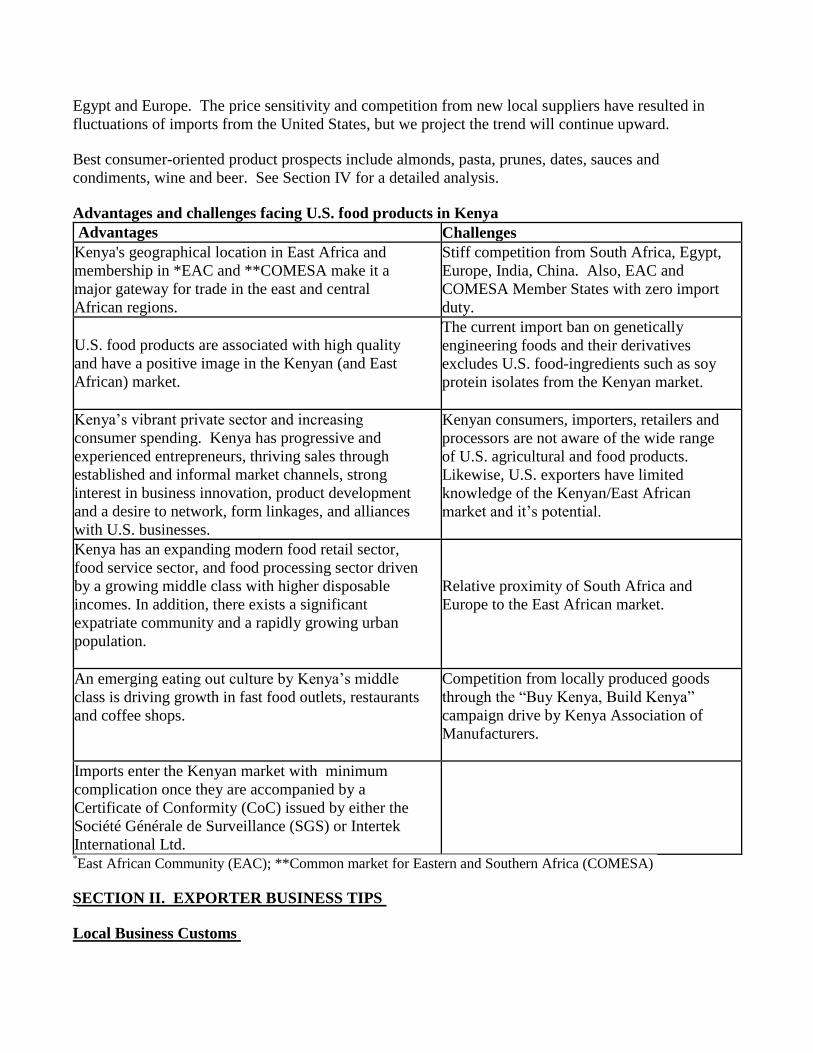
Advantages and challenges facing U.S. food products in Kenya
Advantages Challenges
Kenya's geographical location in East Africa and
membership in *EAC and **COMESA make it a
major gateway for trade in the east and central
African regions.
Stiff competition from South Africa, Egypt,
Europe, India, China. Also, EAC and
COMESA Member States with zero import
duty.
U.S. food products are associated with high quality
and have a positive image in the Kenyan (and East
African) market.
The current import ban on genetically
engineering foods and their derivatives
excludes U.S. food-ingredients such as soy
protein isolates from the Kenyan market.
Kenya’s vibrant private sector and increasing
consumer spending. Kenya has progressive and
experienced entrepreneurs, thriving sales through
established and informal market channels, strong
interest in business innovation, product development
and a desire to network, form linkages, and alliances
with U.S. businesses.
Kenyan consumers, importers, retailers and
processors are not aware of the wide range
of U.S. agricultural and food products.
Likewise, U.S. exporters have limited
knowledge of the Kenyan/East African
market and it’s potential.
Kenya has an expanding modern food retail sector,
food service sector, and food processing sector driven
by a growing middle class with higher disposable
incomes. In addition, there exists a significant
expatriate community and a rapidly growing urban
population.
Relative proximity of South Africa and
Europe to the East African market.
An emerging eating out culture by Kenya’s middle
class is driving growth in fast food outlets, restaurants
and coffee shops.
Competition from locally produced goods
through the “Buy Kenya, Build Kenya”
campaign drive by Kenya Association of
Manufacturers.
Imports enter the Kenyan market with minimum
complication once they are accompanied by a
Certificate of Conformity (CoC) issued by either the
Société Générale de Surveillance (SGS) or Intertek
International Ltd.
*East African Community (EAC); **Common market for Eastern and Southern Africa (COMESA)
SECTION II. EXPORTER BUSINESS TIPS
Local Business Customs

The principles of customary business courtesy, especially replying promptly to request for price
quotations and orders, are a prerequisite for export success.
In general, Kenyan business executives are relatively informal and open. The use of first or surname
name at an early stage of a business relationship is acceptable. Friendship and mutual trust are highly
valued and once this trust is earned, a productive working relationship can be expected.
Business gifts are not common but business entertainment like lunches, golf, and cocktails are common
courtesies during major deals and agreements. Kenyan businessmen appreciate quality and service and
are ready to pay extra if convinced of a product's overall superiority. The market is still somewhat price
sensitive, so, care must be taken to assure that the delivery dates are closely maintained and that after-
sales service is promptly honored with higher value purchases. While there are numerous factors that
may interfere with prompt shipment, the U.S. exporter should allow for additional shipping time to
Kenya and ensure the Kenyan buyer is continuously updated on changes in shipping schedules and
routing. It is better to quote a later delivery date that can be guaranteed than an earlier one that is not
completely certain. Since Kenyan importers generally do a lower volume of business than the U.S.
exporters, U.S. exporters should be ready to sell smaller lots than is the custom in the United States.
The U.S. exporter should maintain close liaison with the importer to exchange information and ideas.
The importer should serve as a good source of market information and as appraiser of product market
acceptance. In most instances, mail, fax or telephone call are sufficient but understanding developed
through periodic personal visits is the best way to keep the importers apprised of new developments and
to resolve problems quickly. As is the case in most markets, vigorous and sustained promotion is often
needed to launch new products.
General Consumer Tastes and Preferences
High-end consumer has become more sophisticated demanding quality and exceptional service.
Compared to the low-end consumer whose buying decisions are price-based, the high-end consumer’s
buying decision is to an extent driven by brand awareness. With the anticipated modest growth in the
economy, consumer spending is expected to increase.
Kenyan food retailers stock a wide range of products to meet a diverse set of consumer tastes and
preferences. Consumers can’t always depend on a particular imported brand to be available in the
supermarkets and must be flexible to stock up or try other, similar products. Many products known in
the United States under brands from companies like Kraft Foods, Heinz, Post and Betty Crocker are
sometimes available in the Kenyan marketplace, even though the product may have been produced
outside the United States and with non-U.S. food ingredients. However, other brands that use 100
percent U.S. products such as American Garden have penetrated Kenya’s modern food retailing market,
and have significant market share in certain food categories like peanut butter and condiments.
Food Standards and Regulations
The main regulatory agencies for imported food products include Kenya Bureau of Standards (KEBS),
Kenya Plant Health Inspectorate Service (KEPHIS), National Biosafety Authority (NBA), Department
of Veterinary Services (DVS), and Department of Public Health (DPH).
Please refer to the latest FAS/Nairobi’s Food and Agricultural Import Regulations (FAIRS) Country
report for more information.
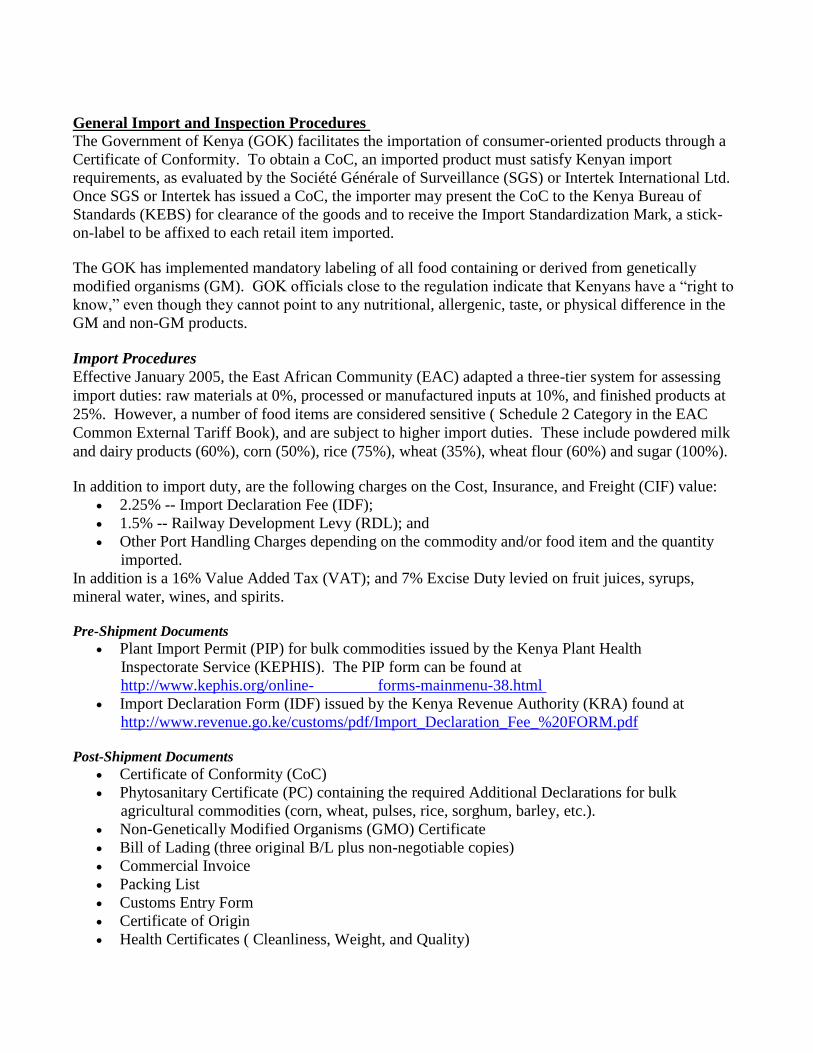
General Import and Inspection Procedures
The Government of Kenya (GOK) facilitates the importation of consumer-oriented products through a
Certificate of Conformity. To obtain a CoC, an imported product must satisfy Kenyan import
requirements, as evaluated by the Société Générale of Surveillance (SGS) or Intertek International Ltd.
Once SGS or Intertek has issued a CoC, the importer may present the CoC to the Kenya Bureau of
Standards (KEBS) for clearance of the goods and to receive the Import Standardization Mark, a stick-
on-label to be affixed to each retail item imported.
The GOK has implemented mandatory labeling of all food containing or derived from genetically
modified organisms (GM). GOK officials close to the regulation indicate that Kenyans have a “right to
know,” even though they cannot point to any nutritional, allergenic, taste, or physical difference in the
GM and non-GM products.
Import Procedures
Effective January 2005, the East African Community (EAC) adapted a three-tier system for assessing
import duties: raw materials at 0%, processed or manufactured inputs at 10%, and finished products at
25%. However, a number of food items are considered sensitive ( Schedule 2 Category in the EAC
Common External Tariff Book), and are subject to higher import duties. These include powdered milk
and dairy products (60%), corn (50%), rice (75%), wheat (35%), wheat flour (60%) and sugar (100%).
In addition to import duty, are the following charges on the Cost, Insurance, and Freight (CIF) value:
2.25% -- Import Declaration Fee (IDF);
1.5% -- Railway Development Levy (RDL); and
Other Port Handling Charges depending on the commodity and/or food item and the quantity
imported.
In addition is a 16% Value Added Tax (VAT); and 7% Excise Duty levied on fruit juices, syrups,
mineral water, wines, and spirits.
Pre-Shipment Documents
Plant Import Permit (PIP) for bulk commodities issued by the Kenya Plant Health
Inspectorate Service (KEPHIS). The PIP form can be found at
http://www.kephis.org/online- forms-mainmenu-38.html
Import Declaration Form (IDF) issued by the Kenya Revenue Authority (KRA) found at
http://www.revenue.go.ke/customs/pdf/Import_Declaration_Fee_%20FORM.pdf
Post-Shipment Documents
Certificate of Conformity (CoC)
Phytosanitary Certificate (PC) containing the required Additional Declarations for bulk
agricultural commodities (corn, wheat, pulses, rice, sorghum, barley, etc.).
Non-Genetically Modified Organisms (GMO) Certificate
Bill of Lading (three original B/L plus non-negotiable copies)
Commercial Invoice
Packing List
Customs Entry Form
Certificate of Origin
Health Certificates ( Cleanliness, Weight, and Quality)
Insurance Certificate
Other Documents requested depending on the agricultural commodity or food product:
Fumigation Certificate
Radiation Certificate
Noxious Weed Certificate
Free from Karnal Bunt Certificate
SECTION III. MARKET SECTOR STRUCTURE AND TRENDS
With thousands of square feet malls coming up in Kenya’s urban centers, food retailing sector is
growing rapidly. The major supermarket chains include Nakumatt (the largest in terms of annual sales
turnover), Tuskys, Uchumi, Naivas, Ukwala, and Chandarana.
Retailers entice customers into their stores through a variety of product promotions and convenience
services including 24-hour operations, customer loyalty shopping cards, and special offers. Local
producers and importers of consumer-oriented products have in-store promotions, billboards, brochures
and/or flyers to advertise products.
Refer to Section IV for best high-value product prospects.
Food Processing Sector
U.S. suppliers of food ingredients may, from time-to-time, find opportunities in Kenya's food processing
sector. Local ingredient production does not always meet the processing industry’s demand, including
for soy, corn, wheat and rice and their milled products. U.S. cooperators link Kenyan food processors
with their members to supply the food ingredients. The market development activities by U.S.
cooperators in Kenya and the East African region have increased the level of knowledge of U.S. food
ingredients including soy-based products, U.S. wheat, U.S. peas, lentils, and dry beans.
Hotels, Restaurants and Institutions (HRI)
Kenya’s consumer foodservice market is rapidly expanding, estimated at $168 million in 2013, up 169
percent since 2008, according to Euromonitor International.
In the past three years, international fast food chain franchises, including America’s Kentucky Fried
Chicken (KFC), Naked Pizza Inc., and Subway Ltd. have been established in Kenya. Domino’s Pizza
and Cold Stone Creamery opened outlets in late 2014. KFC opened Kenya’s first drive through outlet
on December 1st, 2014, the fifth of its outlets in Nairobi, and plans to double this number in the next two
years. Sandwich chain Subway has partnered with Vivo Energy Kenya, the company that distributes
and markets Shell branded fuels and lubricants to open more Subway outlets in their gas stations, with
the ultimate goal of increasing the number of outlets to 20. Domino’s Pizza has two outlets while Cold
Stone Creamery has three, all opened in December 2014 in Nairobi (Central Business District,
Westlands and Gigiri). Both chains to open 16 franchised outlets in Kenya in the next two years in
areas frequented by middle class shoppers. Other foreign-owned fast food outlets in Nairobi s include
Java House, Ocean Basket, Spurs and Innscor Kenya Ltd. Most of the food-service outlets source their
food products locally especially the fresh produce, and limited processed products from importers and
retailers such as ketchup, breakfast cereals, condiments, confectionery and nuts.
International hotels chains have also entered Kenya’s hotel industry such as Best Western, Kempinski,
Marriot, Dusit International and Accor. Radisson Blu, a subsidiary of Carlson Rezidor plans to launch
its first Kenyan hotel with 271 rooms in Nairobi’s Upper Hill area, in 2015. Nairobi’s prominence as a
business and conferencing center is a key driver of this growth. An additional 1,437 hotel beds will be
available in Nairobi within the next five years, according to Kenya’s Business Daily Newspaper.
Distribution Channel:
Most Kenyan food retailers and food service providers do not directly import U.S. food products but
purchase them from local importers. Local importers usually source U.S. products from consolidators
in the United States, United Arab Emirates (Dubai), South Africa and Europe; sometimes as a result of
contacts established at trade shows such as the annual Gulfood Show held in Dubai. The importers then
sell the goods directly to the food retailers, hotels and restaurants, and/or indirectly through appointed
distributors/agents. U.S. food manufacturers and distribution companies do not generally have a direct
presence in Kenya.
Kenyan food processors and importers collaborate with USDA cooperators including: the World
Initiative for Soy in Human Health (WISHH); U.S. Dry Bean Council; USA Dry Pea and Lentil
Council; American Peanut Council; U.S. Wheat Associates; and, the U.S. Grains Council to develop
market for U.S. food ingredients. Market development activities include in-country technical seminars,
trade servicing visits and short-term specialized training in the United States.
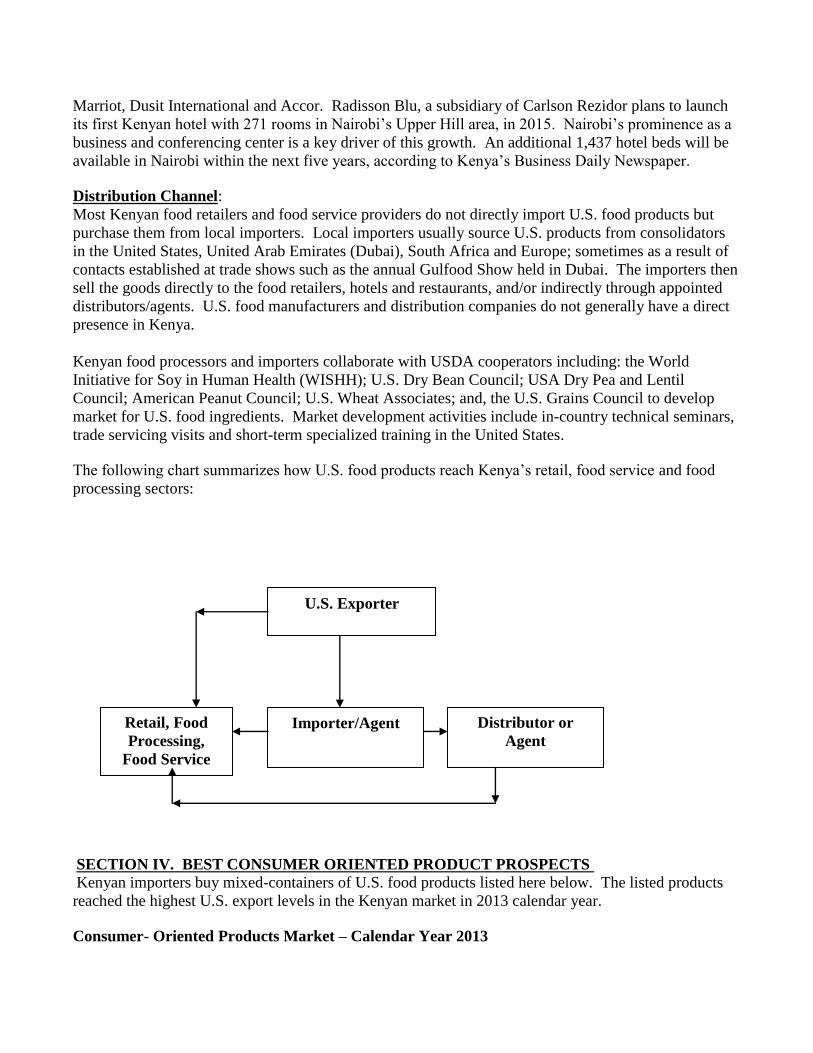
The following chart summarizes how U.S. food products reach Kenya’s retail, food service and food
processing sectors:
SECTION IV. BEST CONSUMER ORIENTED PRODUCT PROSPECTS
Kenyan importers buy mixed-containers of U.S. food products listed here below. The listed products
reached the highest U.S. export levels in the Kenyan market in 2013 calendar year.
Consumer- Oriented Products Market – Calendar Year 2013
U.S. Exporter
Retail, Food
Processing,
Food Service
Sector
Importer/Agent Distributor or
Agent
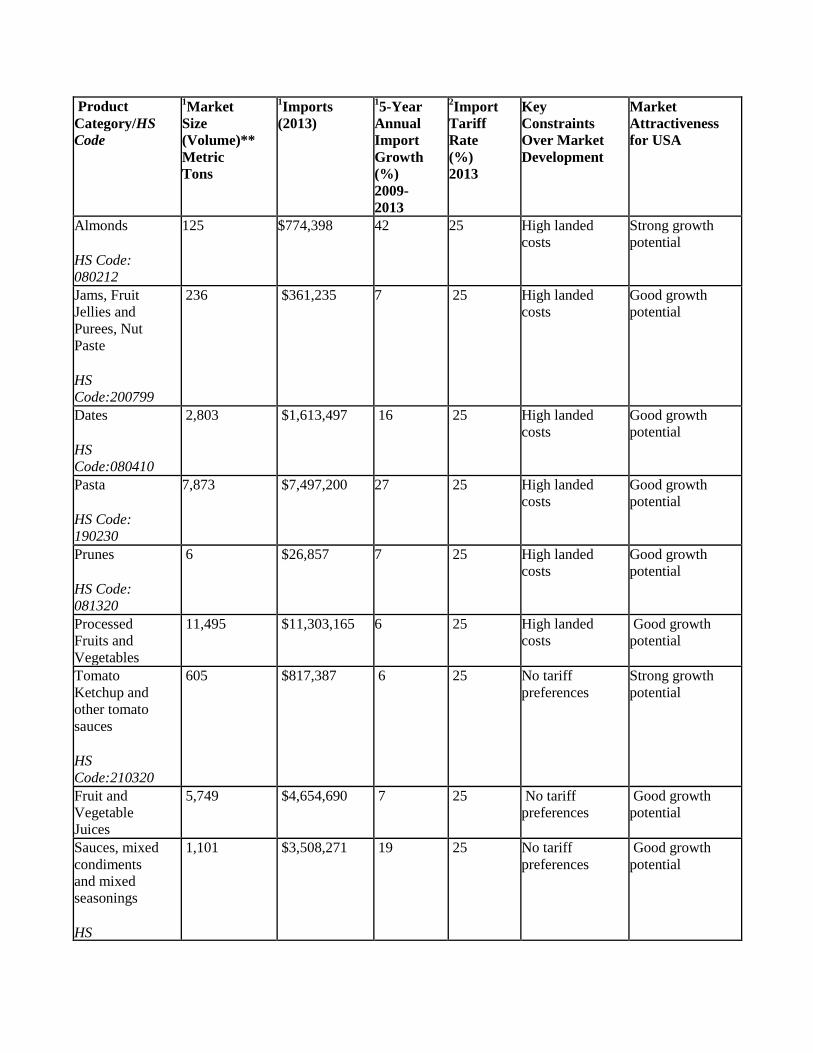
Product
Category/HS
Code
1Market
Size
(Volume)** Metric
Tons
1Imports
(2013)
15-Year
Annual
Import
Growth
(%) 2009-
2013
2Import
Tariff
Rate
(%) 2013
Key
Constraints
Over Market
Development
Market
Attractiveness
for USA
Almonds
HS Code:
080212
125 $774,398 42 25 High landed
costs Strong growth
potential
Jams, Fruit
Jellies and
Purees, Nut
Paste
HS
Code:200799
236 $361,235 7 25 High landed
costs Good growth
potential
Dates
HS
Code:080410
2,803 $1,613,497 16 25 High landed
costs Good growth
potential
Pasta
HS Code:
190230
7,873 $7,497,200 27 25 High landed
costs Good growth
potential
Prunes
HS Code:
081320
6 $26,857 7 25 High landed
costs Good growth
potential
Processed
Fruits and
Vegetables
11,495 $11,303,165 6 25 High landed
costs Good growth
potential
Tomato
Ketchup and
other tomato
sauces
HS
Code:210320
605 $817,387 6 25 No tariff
preferences Strong growth
potential
Fruit and
Vegetable
Juices
5,749 $4,654,690 7 25 No tariff
preferences Good growth
potential
Sauces, mixed
condiments
and mixed
seasonings
HS
1,101 $3,508,271 19 25 No tariff
preferences Good growth
potential
Code:210390
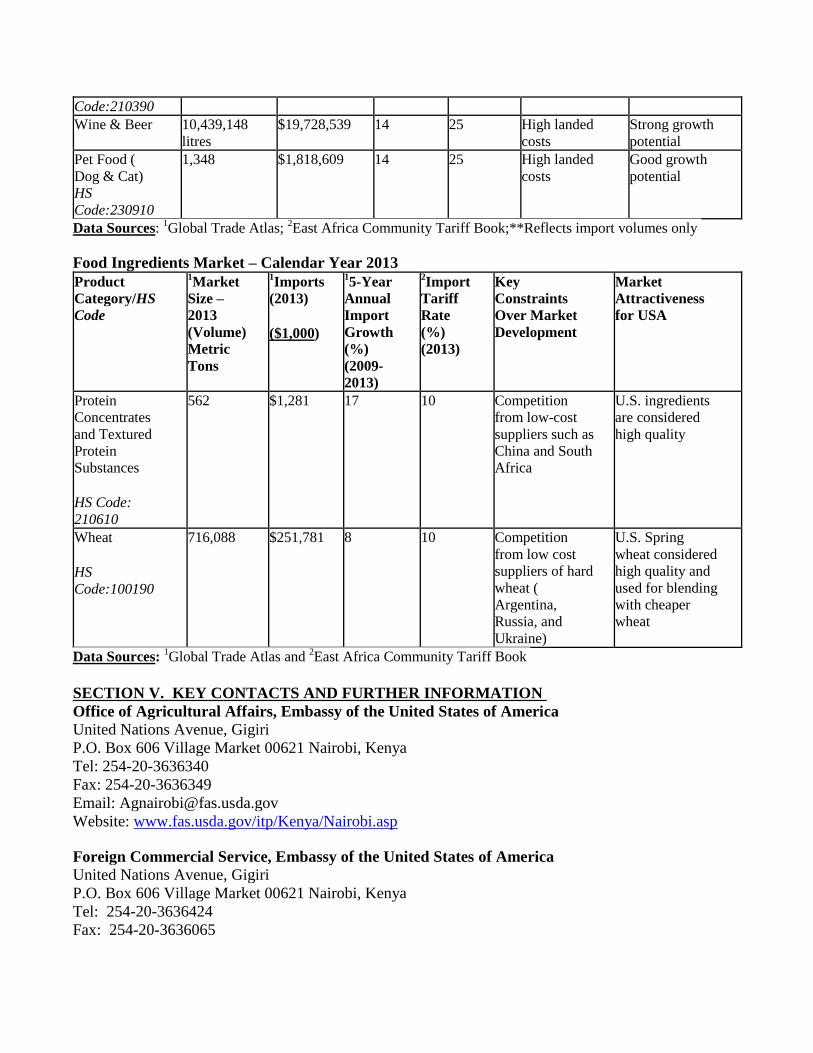
Wine & Beer 10,439,148
litres $19,728,539 14 25 High landed
costs Strong growth
potential
Pet Food (
Dog & Cat) HS
Code:230910
1,348 $1,818,609 14 25 High landed
costs Good growth
potential
Data Sources: 1Global Trade Atlas;
2East Africa Community Tariff Book;**Reflects import volumes only
Food Ingredients Market – Calendar Year 2013
Product
Category/HS
Code
1Market
Size –
2013 (Volume) Metric
Tons
1Imports
(2013) ($1,000)
15-Year
Annual
Import
Growth
(%) (2009-
2013)
2Import
Tariff
Rate
(%) (2013)
Key
Constraints
Over Market
Development
Market
Attractiveness
for USA
Protein
Concentrates
and Textured
Protein
Substances
HS Code:
210610
562 $1,281 17 10 Competition
from low-cost
suppliers such as
China and South
Africa
U.S. ingredients
are considered
high quality
Wheat
HS
Code:100190
716,088 $251,781 8 10 Competition
from low cost
suppliers of hard
wheat (
Argentina,
Russia, and
Ukraine)
U.S. Spring
wheat considered
high quality and
used for blending
with cheaper
wheat
Data Sources: 1Global Trade Atlas and
2East Africa Community Tariff Book
SECTION V. KEY CONTACTS AND FURTHER INFORMATION
Office of Agricultural Affairs, Embassy of the United States of America
United Nations Avenue, Gigiri
P.O. Box 606 Village Market 00621 Nairobi, Kenya
Tel: 254-20-3636340
Fax: 254-20-3636349
Email: [email protected]
Website: www.fas.usda.gov/itp/Kenya/Nairobi.asp
Foreign Commercial Service, Embassy of the United States of America
United Nations Avenue, Gigiri
P.O. Box 606 Village Market 00621 Nairobi, Kenya
Tel: 254-20-3636424
Fax: 254-20-3636065

Email: [email protected]
Website: www.buyusa.gov/kenya
Kenya Bureau of Standards (KEBS)
P.O. Box 54974 Nairobi, Kenya
Tel: 254-20-6948000 or 69028201/401/410
Fax: 254-20-609660/6004031
Email: [email protected]
Website: www.kebs.org and www.kenyapvoc.com
Customs and Excise Department
The National Treasury
P.O.Box 30007 Nairobi, Kenya
Tel: 254-20-715540
Fax: 254-20-718417
Website: www.revenue.go.ke and www.kra.go.ke
Kenya Plant Health Inspectorate Service (KEPHIS)
P.O. Box 49592 Nairobi, Kenya
Tel: 254-20-3536171/2 or 3597201/2/3
Mobile: 254-722516221, 254-733874274
Fax: 254-20-882265
Email: [email protected]
Website: www.kephis.org
Department of Veterinary Services (DVS)
P.O. Private Bag 00625 Kabete, Kenya
Tel: 254-20-8043441631383/2231/1287
Fax: 254-20-2026212
Cell: 254-722376237
Email: [email protected]
Ministry of Health
Public Health Department
P.O. Box 30016-00100 Nairobi, Kenya
Tel: 254-20-2717077
Fax: 254-20-2710055
Website: www.publichealth.go.ke
SGS North America Inc.
236 32nd Avenue
Brookings, SD 57006 USA
Tel: 605-692-7611
Fax: 605-692 -7617
Website: www.us.sgs.com/
SGS Kenya Limited
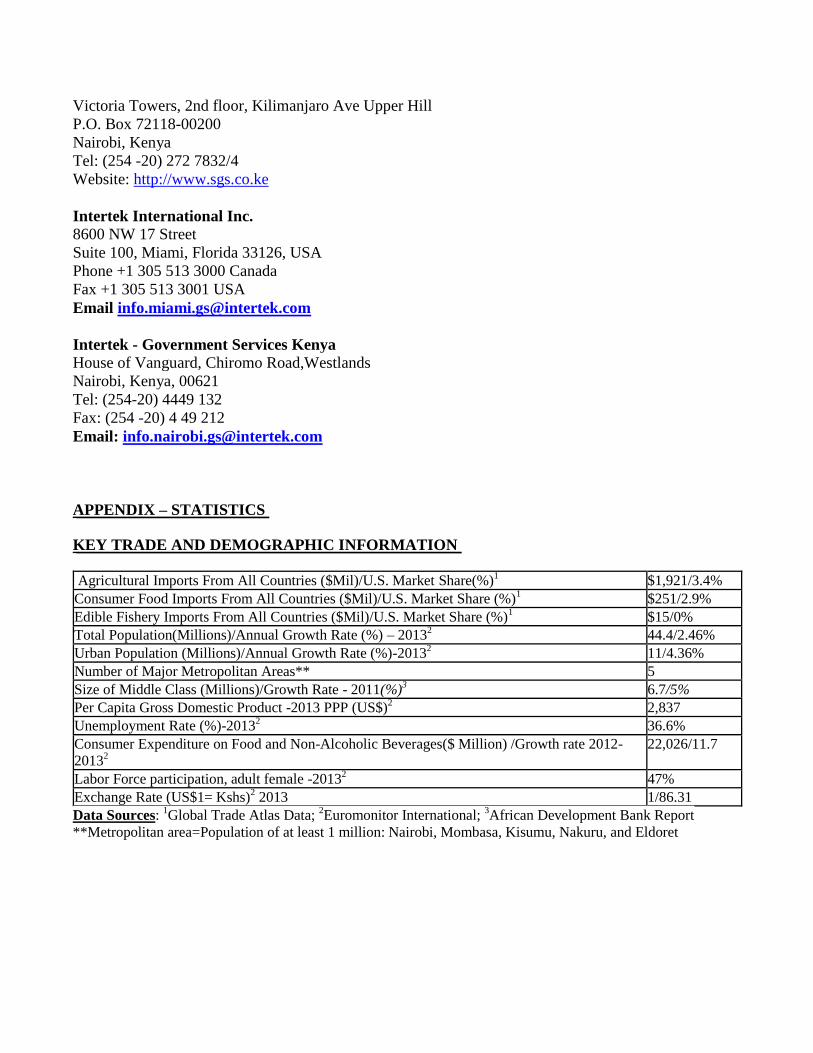
Victoria Towers, 2nd floor, Kilimanjaro Ave Upper Hill
P.O. Box 72118-00200
Nairobi, Kenya
Tel: (254 -20) 272 7832/4
Website: http://www.sgs.co.ke
Intertek International Inc.
8600 NW 17 Street
Suite 100, Miami, Florida 33126, USA
Phone +1 305 513 3000 Canada
Fax +1 305 513 3001 USA
Email [email protected]
Intertek - Government Services Kenya
House of Vanguard, Chiromo Road,Westlands
Nairobi, Kenya, 00621
Tel: (254-20) 4449 132
Fax: (254 -20) 4 49 212
Email: [email protected]
APPENDIX – STATISTICS
KEY TRADE AND DEMOGRAPHIC INFORMATION
Agricultural Imports From All Countries ($Mil)/U.S. Market Share(%)1 $1,921/3.4%
Consumer Food Imports From All Countries ($Mil)/U.S. Market Share (%)1 $251/2.9%
Edible Fishery Imports From All Countries ($Mil)/U.S. Market Share (%)1 $15/0%
Total Population(Millions)/Annual Growth Rate (%) – 20132 44.4/2.46%
Urban Population (Millions)/Annual Growth Rate (%)-20132 11/4.36%
Number of Major Metropolitan Areas** 5
Size of Middle Class (Millions)/Growth Rate - 2011(%)3 6.7/5%
Per Capita Gross Domestic Product -2013 PPP (US$)2 2,837
Unemployment Rate (%)-20132 36.6%
Consumer Expenditure on Food and Non-Alcoholic Beverages($ Million) /Growth rate 2012-
20132
22,026/11.7
Labor Force participation, adult female -20132 47%
Exchange Rate (US$1= Kshs)2 2013 1/86.31
Data Sources: 1Global Trade Atlas Data;
2Euromonitor International;
3African Development Bank Report
**Metropolitan area=Population of at least 1 million: Nairobi, Mombasa, Kisumu, Nakuru, and Eldoret
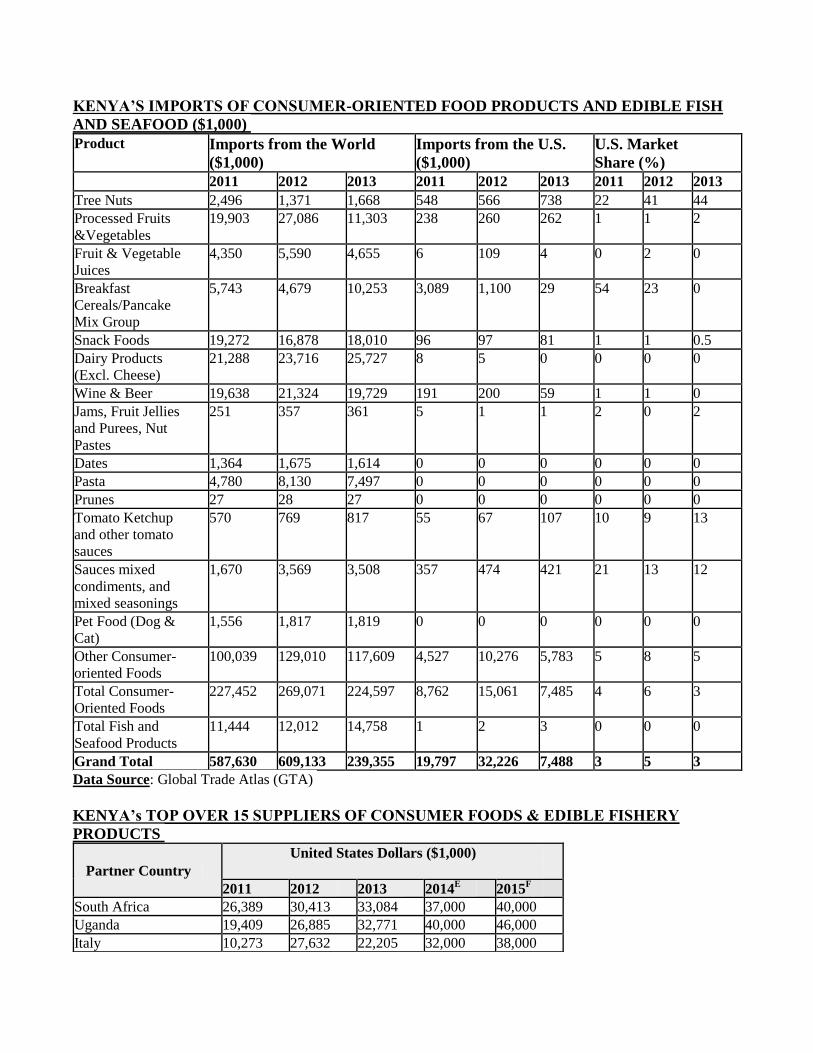
KENYA’S IMPORTS OF CONSUMER-ORIENTED FOOD PRODUCTS AND EDIBLE FISH
AND SEAFOOD ($1,000)
Product Imports from the World
($1,000)
Imports from the U.S.
($1,000)
U.S. Market
Share (%)
2011 2012 2013 2011 2012 2013 2011 2012 2013
Tree Nuts 2,496 1,371 1,668 548 566 738 22 41 44
Processed Fruits
&Vegetables 19,903 27,086 11,303 238 260 262 1 1 2
Fruit & Vegetable
Juices 4,350 5,590 4,655 6 109 4 0 2 0
Breakfast
Cereals/Pancake
Mix Group
5,743 4,679 10,253 3,089 1,100 29 54 23 0
Snack Foods 19,272 16,878 18,010 96 97 81 1 1 0.5
Dairy Products
(Excl. Cheese) 21,288 23,716 25,727 8 5 0 0 0 0
Wine & Beer 19,638 21,324 19,729 191 200 59 1 1 0
Jams, Fruit Jellies
and Purees, Nut
Pastes
251 357 361 5 1 1 2 0 2
Dates 1,364 1,675 1,614 0 0 0 0 0 0
Pasta 4,780 8,130 7,497 0 0 0 0 0 0
Prunes 27 28 27 0 0 0 0 0 0
Tomato Ketchup
and other tomato
sauces
570 769 817 55 67 107 10 9 13
Sauces mixed
condiments, and
mixed seasonings
1,670 3,569 3,508 357 474 421 21 13 12
Pet Food (Dog &
Cat) 1,556 1,817 1,819 0 0 0 0 0 0
Other Consumer-
oriented Foods 100,039 129,010 117,609 4,527 10,276 5,783 5 8 5
Total Consumer-
Oriented Foods 227,452 269,071 224,597 8,762 15,061 7,485 4 6 3
Total Fish and
Seafood Products 11,444 12,012 14,758 1 2 3 0 0 0
Grand Total 587,630 609,133 239,355 19,797 32,226 7,488 3 5 3
Data Source: Global Trade Atlas (GTA)
KENYA’s TOP OVER 15 SUPPLIERS OF CONSUMER FOODS & EDIBLE FISHERY
PRODUCTS
Partner Country
United States Dollars ($1,000)
2011 2012 2013 2014E 2015
F
South Africa 26,389 30,413 33,084 37,000 40,000
Uganda 19,409 26,885 32,771 40,000 46,000
Italy 10,273 27,632 22,205 32,000 38,000

France 15,182 24,876 19,302 24,000 26,000
Egypt 12,757 15,415 15,096 17,000 18,000
Netherlands 14,074 11,969 13,348 12,000 13,000
Denmark 14,766 9,169 13,151 11,000 11,500
India 6,571 8,896 10,839 13,000 15,000
United Kingdom 7,169 10,879 8,055 10,000 11,000
United States 8,762 15,061 7,201 9,000 9,500
Germany 10,417 5,209 7,036 4,000 2,000
Belgium 2,309 8,104 6,574 10,000 12,000
Spain 2,597 3,060 6,303 8,000 10,000
China 5,069 6,090 6,017 7,000 7,200
Brazil 4,456 3,392 5,217 5,000 6,000
United Arab Emirates 2,894 4,839 4,866 6,000 7,000
Turkey 2,650 5,048 4,562 6,000 7,000
Tanzania 9,744 8,271 4,271 2,000 2,500
Others 51,963 43,864 31,131 21,500 11,000
World 227,451 269,072 251,029 274, 500 292,700
Data Source: GTA
KENYA’S TOP 15 SUPPLIERS OF EDIBLE FISH AND SEAFOOD
Partner Country
United States Dollars ($1,000)
2011 2012 2013 2014E 2015
F
China 797 835 2,987 3,700 4,800
Seychelles 5,165 3,931 2,890 1,700 580
Tanzania 403 1,771 1,667 2,500 3,200
Philippines 0 88 1,070 1,500 2,000
Korea South 559 626 861 1000 1,100
Japan 794 1,082 732 800 800
Yemen 219 544 724 1,000 1,250
Thailand 301 368 702 900 1,100
Cote d Ivoire 0 0 697 930 800
India 194 306 499 640 800
Vietnam 118 823 463 800 1000
Uganda 111 101 417 500 700
United Kingdom 261 251 206 200 200
Norway 179 163 189 200 200
Hong Kong 0 0 119 160 200
Others 2,341 1,124 535 400 1,000
World 11,442 12,013 14,758 16,930 19,730
Data Source: GTA