This presenter has nothing Using Quality Improvement to...
66
Using Quality Improvement to Optimize Pediatric Discharge Efficiency Christine White MD, MAT Associate Professor-Hospital Medicine Cincinnati Children’s Hospital Cincinnati, Ohio James Anderson Center for Health Systems Excellence This presenter has nothing to disclose November 2, 2016
Transcript of This presenter has nothing Using Quality Improvement to...

Using Quality Improvement to Optimize Pediatric Discharge Efficiency
Christine White MD, MATAssociate Professor-Hospital MedicineCincinnati Children’s HospitalCincinnati, Ohio
James Anderson Center for Health Systems Excellence
This presenter has nothing
to disclose
November 2, 2016

Objectives
• Describe strategies for focusing discharge planning
processes around medical readiness criteria,
regardless of time of day
• Describe the application of quality improvement
principles to improving discharge efficiency
• Highlight the key high reliability processes used for
implementing and sustaining improvement

Case
At 8am, a 3 year old female admitted with community
acquired pneumonia has been stable on room air all
night without respiratory distress
• Afebrile x 24 hours
• Tolerates her first oral antibiotic dose
• Drinking well

But…
Why does she stay until 1:00pm?
Can we eliminate this waste?

Background
• The Institute of Medicine urges us to provide care that is timely and efficient
• A 2009 study by Srivastava et al found that nearly 1 in 4 patients experienced a medically unnecessary prolonged hospital stay of at least 1 day
• Prior studies focused on set discharge time goals such as 11:00 am

Background at Cincinnati Children’s Hospital Medical Center (CCHMC)
In 2012, there were 7000 admissions to our 3 Hospital Medicine units
• Highest admitting units from Emergency Department and Pediatric Intensive Care Unit
• Thus, Hospital Medicine discharge delays affect flow throughout the hospital which may lead to
• Delayed admissions or transfers
• Canceled or delayed surgeries

Discharge Prediction
• In 2008, CCHMC began predicting the time of discharges in 4 hour time buckets to• Anticipate bed availability
• Place patients on the appropriately skilled nursing unit
• These predictions took into account medical, social and system level factors
• Success defined as patient going home in the predicted bucket or the bucket prior
• By 2010, discharge predictions had improved but flow hadn’t and system delays persisted


Refocusing: Our New Theory
• We needed to address system issues to improve efficiency:
• Lack of shared discharge goals for patients
• Patients with the same diagnoses had goals that varied by physician
• Goals were not shared with nursing staff or families
• Discharge planning occurred last minute
• Shift focus to plan discharge around medical readiness, regardless of time of day

AIM
To increase the percentage of Hospital Medicine patients admitted to one of three inpatient units with one of 11 common diagnoses discharged within two hours* of meeting medically-ready criteria from 42% to 80% by June 30, 2013
*If criteria were met between 9:00 pm – 7:00 am, patients were not expected to leave until 9am.

Other Measures
• Nurse and Physician Process Measures
• Secondary Measures:
•Length of stay (LOS)
•Average daily census
•Total occupied beds at 8am /number of days in the month

Balancing Measures
• 30-day Readmission Rates
• Family Satisfaction

Key Drivers
Increase the
percentage of
Hospital Medicine
patients with one of
11 common
inpatient diagnoses
discharged within
two hours of
meeting medically
ready criteria from
42% to 80% by
June 30, 2013
Frontline Staff Buy-in and
Shared Ownership
Discharge Barrier
Identification with Mitigation
Plans established
Team Performance
Transparency with
Preoccupation with Failure
Discharge Criteria Defined

11 Diagnoses
• Asthma
• Bronchiolitis
• Osteomyelitis
• Hyperbilirubinemia
• Fever of Uncertain Source
• Cellulitis
• Gastroenteritis/Dehydration
• Urinary Tract Infection
• Pneumonia
• Croup
• Constipation

Physicians define criteria
in EMR on admission
Patient meets medically-
ready criteria
Nurse places time stamp in
EMR
If patient does not leave
within 2 hours, nurses
document reason why
The Process

Process Measures
• Physician process measure: the percentage of admitted patients with medically-ready discharge orders
• Nurse process measure: the percentage of patients with the medically-ready time stamp placed in the electronic medical record (EMR)

EMR Discharge Criteria: Physician View
© 2013 Epic Systems Corporation. Used with permission.

EMR Discharge Criteria: Nurse View
© 2013 Epic Systems Corporation. Used with permission.

Time Stamp Documentation
© 2013 Epic Systems Corporation. Used with permission.

Screenshot of “button”
© 2013 Epic Systems Corporation. Used with permission.

Nurse Documentation of Failure
© 2013 Epic Systems Corporation. Used with permission.

Baseline Failure Reasons

Optimizing Discharge Efficiency% Discharged within 2 Hours of Medically Ready
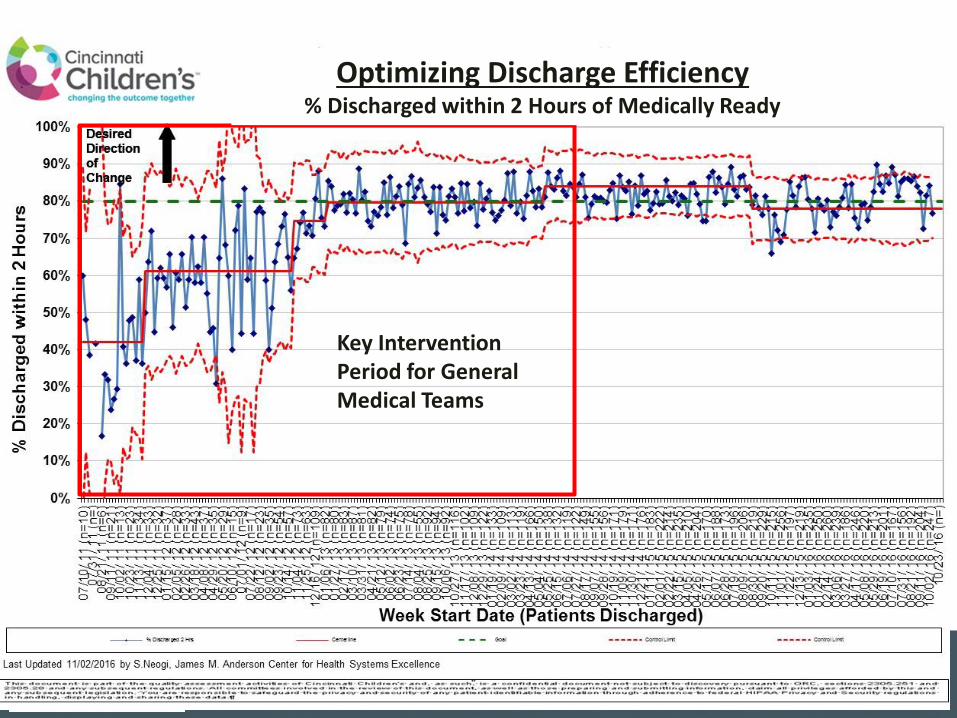
Key Intervention Period for General Medical Teams
Optimizing Discharge Efficiency% Discharged within 2 Hours of Medically Ready

Key stakeholder buy-in
and shared ownership
6 Pilot Diagnoses

Standardization of Discharge Criteria
• Based on available evidence and expert consensus
• Diagnosis-specific goals
• For example, stable without supplemental oxygen
for 6 hours for patients with bronchiolitis
• Did not include non-medical items
• For example, medications filled by pharmacy
• Embedded in physician admission order sets
• Modifiable

EMR Discharge Criteria: Physician View
© 2013 Epic Systems Corporation. Used with permission.

Leveraging of Nursing Performance Management System
• A pay-for performance managerial system to plan,
evaluate and reward individual employee performance
• Goals align with strategic priorities
• In Oct 2011, one unit included the discharge outcome
as the unit’s goal
• That unit’s performance improved from 34-60%


Key stakeholder buy-in
and shared ownership
Second and third unit
performance management

Discharge Barriers Defined andMitigation Plans Established
• Focused on the top 2 failure reasons:
• Subspecialty Consult timeliness
• Medication Delays
• Accounted for 35% of the failures

Key stakeholder buy-in
and shared ownership
Timeliness of consults

Subspecialty Consult Timeliness
• Many patients admitted with asthma exacerbations
receive an asthma team consult
• Staffed by pulmonary medicine or
allergy/immunology attendings
• Help with medication adjustment, diagnostic
testing and outpatient follow-up

Asthma Team Consult Timeliness Interventions
• Prioritized consults based on predicted
discharge time
• Instituted a brief consult note with asthma
team recommendations

Key stakeholder buy-in
and shared ownership
Timeliness of consults
Pharmacy process
optimization

Pharmacy Process Optimization
• On admission, nurses documented the families’
preferred pharmacy in the EMR
• At CCHMC Pharmacy:
• Filling prioritization based on predicted discharge
time
• Pharmacist start time shifted to 7 am
• Delivery of medications Mon-Fri from 8 am to 5
pm

Pharmacy Process Optimization
• Flu shot
• Order modified to eliminate
“upon discharge” phrase
• Stocked on the floor

Key stakeholder buy-in
and shared ownership
Timeliness of consults
Pharmacy process
optimization
Preoccupation With Failure

Preoccupation with Failure
• Daily automated reports generated from the EMR:
• Detailed all the process and outcome failures
from the day prior
• Allowed for:
• Identification & mitigation of physician process
failures
• Learn about outcome failures

Daily Report 42
Numerator for the outcome
measure
Denominator for the outcome
measure
Time the patient left the
hospital

Time the patient MET
medically ready criteria
Failure reason
Daily ReportPhysician process
measure: medically
ready order place

Key stakeholder buy-in
and shared ownership
Timeliness of consults
Pharmacy process
optimization
Preoccupation With Failure
Process Expansion

Expansion to all diagnoses
• Challenging for frontline providers to remember
which patients qualified
• Shift from work by exclusion model to an all inclusive
model
• In Nov 2012, we applied the processes to ALL HM
patients
• General admission order set

General Admission Order Set
© 2013 Epic Systems Corporation. Used with permission.

Key stakeholder buy-in
and shared ownership
Timeliness of consults
Pharmacy process
optimization
Preoccupation With Failure
Process Expansion
Transparency of Data

Transparency of Data
• Feedback to physician teams:
• Weekly emails to attendings
• Poster in resident conference rooms with team compliance
• Daily emails about outcome failures
• Feedback to nursing units:
• Run charts posted on the unit
• Discussions at monthly staff meetings

Poster in Resident Conference Room

Key stakeholder buy-in
and shared ownership
Timeliness of consults
Pharmacy process
optimization
Preoccupation With Failure
Process Expansion
Transparency of Data
Second and third unit
performance management

Discharge Failure Reasons Comparison

0%
10%
20%
30%
40%
50%
60%
70%
80%
90%
100%
07
/10
/ 11
(n
=1
0)
08
/14
/ 11
(n
=)
09
/18
/ 11
(n
=1
5)
10
/23
/ 11
(n
=2
3)
11
/27
/ 11
(n
=3
0)
01
/01
/ 12
(n
=2
9)
02
/05
/ 12
(n
=2
8)
03
/11
/ 12
(n
=3
7)
04
/15
/ 12
(n
=2
9)
05
/20
/ 12
(n
=2
9)
06
/24
/ 12
(n
=1
9)
07
/29
/ 12
(n
=9
)
09
/02
/ 12
(n
=3
5)
10
/07
/ 12
(n
=4
7)
11
/11
/ 12
(n
=7
0)
12
/16
/ 12
(n
=1
09)
01
/20
/ 13
(n
=7
5)
02
/24
/ 13
(n
=1
04)
03
/31
/ 13
(n
=8
1)
05
/05
/ 13
(n
=8
0)
06
/09
/ 13
(n
=9
2)
07
/14
/ 13
(n
=7
8)
08
/18
/ 13
(n
=9
0)
09
/22
/ 13
(n
=8
7)
10
/27
/ 13
(n
=1
16)
12
/01
/ 13
(n
=1
15)
01
/05
/ 14
(n
=1
25)
02
/09
/ 14
(n
=1
09)
03
/16
/ 14
(n
=1
20)
04
/20
/ 14
(n
=1
74)
05
/25
/ 14
(n
=1
38)
06
/29
/ 14
(n
=1
33)
08
/03
/ 14
(n
=1
30)
09
/07
/ 14
(n
=1
55)
10
/12
/ 14
(n
=1
53)
11
/16
/ 14
(n
=1
74)
12
/21
/ 14
(n
=1
76)
01
/25
/ 15
(n
=2
19)
03
/01
/ 15
(n
=2
06)
04
/05
/ 15
(n
=2
10)
05
/10
/ 15
(n
=1
98)
06
/14
/ 15
(n
=1
82)
07
/19
/ 15
(n
=1
96)
08
/23
/ 15
(n
=1
73)
09
/27
/ 15
(n
=2
09)
11
/01
/ 15
(n
=2
56)
12
/06
/ 15
(n
=2
09)
01
/10
/ 16
(n
=2
46)
02
/14
/ 16
(n
=2
58)
03
/20
/ 16
(n
=)
% D
isc
ha
rge
d w
ith
in 2
Ho
urs
Week Start Date (Patients Discharged)
Optimizing Discharge Efficiency% Discharged within 2 Hours of Medically Ready
General Medical Teams
% Discharged 2 Hrs Centerline Goal Control Limit Control Limit
Desired
Direction
of
Change
Last Updated 03/02/2016 by S.Neogi, James M. Anderson Center for Health Systems Excellence
Desired
Direction
of
Change
Increase in Medically
Clear Mental Health
Patients Admitted to
General Medical
Teams

Other Measures


Secondary Measures
• Median Length of Stay significantly decreased from 1.57
to 1.44 days (p=0.01)
• Asthma was the only individual admission diagnosis with a
statistically significant improvement in LOS
• Exclusion of asthma patients still demonstrated a significant
decrease in LOS for the remaining compiled diagnoses
• Average daily census increased from 36.4 to 42.9
(17.5% increase in occupancy)

Balancing Measures
• Readmission rates remained similar for individual
diagnoses and overall (4.60% to 4.21%; p=0.24)
• Family satisfaction remained high

Lessons Learned
• Discharge prediction was the framework for our study but didn’t improve flow
• Decreasing clinical variability in discharge criteria was an essential first step
• Taking advantage of habits and patterns was necessary
• Multidisciplinary collaboration was key to our success

Where are We Now?
• Improving discharge efficiency:
• Focusing Hospital Medicine complex patients with chronic conditions
• Spread to other services and units
• Working on consistent modification of the medically ready orders based on clinical course
• Working on improving the timeliness of the EMR timestamp


Cardiology: Patients Discharged Before Noon
I2S2 Project
RCIC project
Baseline Period
0%
10%
20%
30%
40%
50%
60%
70%
80%
90%
100%
01/0
1/ 1
3 (
n=13
0)
02/0
1/ 1
3 (
n=12
1)
03/0
1/ 1
3 (
n=11
1)
04/0
1/ 1
3 (
n=11
7)
05/0
1/ 1
3 (
n=13
9)
06/0
1/ 1
3 (
n=13
2)
07/0
1/ 1
3 (
n=14
4)
08/0
1/ 1
3 (
n=13
8)
09/0
1/ 1
3 (
n=13
3)
10/0
1/ 1
3 (
n=15
7)
11/0
1/ 1
3 (
n=12
9)
12/0
1/ 1
3 (
n=11
3)
01/0
1/ 1
4 (
n=11
7)
02/0
1/ 1
4 (
n=10
7)
03/0
1/ 1
4 (
n=10
4)
04/0
1/ 1
4 (
n=14
1)
05/0
1/ 1
4 (
n=13
0)
06/0
1/ 1
4 (
n=10
9)
07/0
1/ 1
4 (
n=11
8)
08/0
1/ 1
4 (
n=11
2)
09/0
1/ 1
4 (
n=10
9)
10/0
1/ 1
4 (
n=90
)
11/0
1/ 1
4 (
n=69
)
12/0
1/ 1
4 (
n=52
)
01/0
1/ 1
5 (
n=66
)
02/0
1/ 1
5 (
n=63
)
03/0
1/ 1
5 (
n=67
)
04/0
1/ 1
5 (
n=81
)
05/0
1/ 1
5 (
n=99
)
06/0
1/ 1
5 (
n=87
)
07/0
1/ 1
5 (
n=10
6)
08/0
1/ 1
5 (
n=80
)
09/0
1/ 1
5 (
n=81
)
10/0
1/ 1
5 (
n=10
3)
11/0
1/ 1
5 (
n=89
)
12/0
1/ 1
5 (
n=97
)
01/0
1/ 1
6 (
n=10
2)
02/0
1/ 1
6 (
n=93
)
03/0
1/ 1
6 (
n=99
)
04/0
1/ 1
6 (
n=84
)
05/0
1/ 1
6 (
n=80
)
06/0
1/ 1
6 (
n=94
)
07/0
1/ 1
6 (
n=96
)
08/0
1/ 1
6 (
n=83
)
09/0
1/ 1
6 (
n=)
10/0
1/ 1
6 (
n=)
% D
isc
ha
rged
beo
fre
no
on
Month & Year (Total Patients Discharged)
% Discharged before noon A6C
Centerline Control Limit Control Limit
Desired Direction of
Change
Last Updated 09/23/2016 by Smriti Neogi, James M. Anderson Center for Health Systems Desired Direction of
Change * due to construction on A6C , April 2015 data is from med ready population

Next Steps
• Shifting focus of interventions to address:
• Parent/patient concerns
• Transportation
• Continue spread to other services, units and hospitals

Publications
White CM, Statile AM, White DL, Elkeeb D, Tucker K,
Herzog D, Warrick SD, Warrick DM, Hausfeld J,
Schondelmeyer A, Schoettker PJ, Kiessling P, Farrell M,
Kotagal U, Ryckman FC. “Using quality improvement to
optimise paediatric discharge efficiency.” BMJ Qual Saf
2014 Jan; 23(1): 1-9
Statile AM, Schondelmeyer AC, Thomson JE, Brower L,
Davis B, Redel J, Hausfeld J, Tucker K, White DL,
White CM. “Improving Discharge Efficiency in Medically
Complex Pediatric Patients.” Pediatrics 2016 Aug;
138(2).

Thank You to Our Team
• Angela Statile, MD, MEd
• Denise L. White, PhD, MBA
• Amanda Schondelmeyer, MD
• Dena Elkeeb, MD
• Karen Tucker, MSN, MBA, RN
• Stephen D. Warrick, MD
• Denise M. Warrick, MD
• Matthew Carroll, MD
• Paul Yelton, MSCS
• Shelly Miller, Family Member
• Julie Hausfeld, BSN, RN
• Pamela Kiessling, MSN, RN
• Michael Farrell, MD
• Uma Kotagal, MBBS, MSc
• Frederick C. Ryckman, MD
• David Mayhaus, MS, PharmD
• Melissa Healy, RPH
• Karen McDowell, MD
• Patrick Brady, MD, MSc
• Laura Brower, MD

Questions or Comments?

Resources
Iantorno S, Fieldston E. Hospitals are not hotels: high-quality discharges occur around the clock. JAMA Pediatr 2013;167(7):596-97
Institute of Medicine, Committee on Quality Health Care in America. Crossing the Quality Chasm - A New Health System for the 21st Century. Washington, DC: National Academy Press, 2001
Optimizing Patient Flow: Moving Patients Smoothly Through Acute Care Settings. Secondary Optimizing Patient Flow: Moving Patients Smoothly Through Acute Care Settings. 2003. IHI innovation Series white paper. Cambridge, MA: Institute for Healthcare Improvement. Available at: www.IHI.org (accessed 29 May 2013)
Srivastava R, Stone B, Patel R, et al. Delays in discharge in a tertiary care pediatric hospital. J Hosp Med 2009;4(8):481-85