This presentation has 2 goals. The first goal is to check ... · This presentation has 2 goals. The...
17
1
Transcript of This presentation has 2 goals. The first goal is to check ... · This presentation has 2 goals. The...
1

This presentation has 2 goals. The first goal is to check some basic
assumptions about LED lighting and BPA’s programs, to get everybody assumptions about LED lighting and BPA’s programs, to get everybody
on the same page. If you disagree with something presented here,
please let me know, either at the end of the slides, or by email. You
probably already know most of this information, so I’ll run through it
quickly. If you want to look in more detail, the slides will be posted on
the e3tnw website in the LED TAG portal.
The second goal is to show how we picked the list of topics that we did,
as a starting place for this TAG. I’ll give an introduction, and then John
Wilson will take a closer look, from the perspective of the BPA Programs
Group.
2
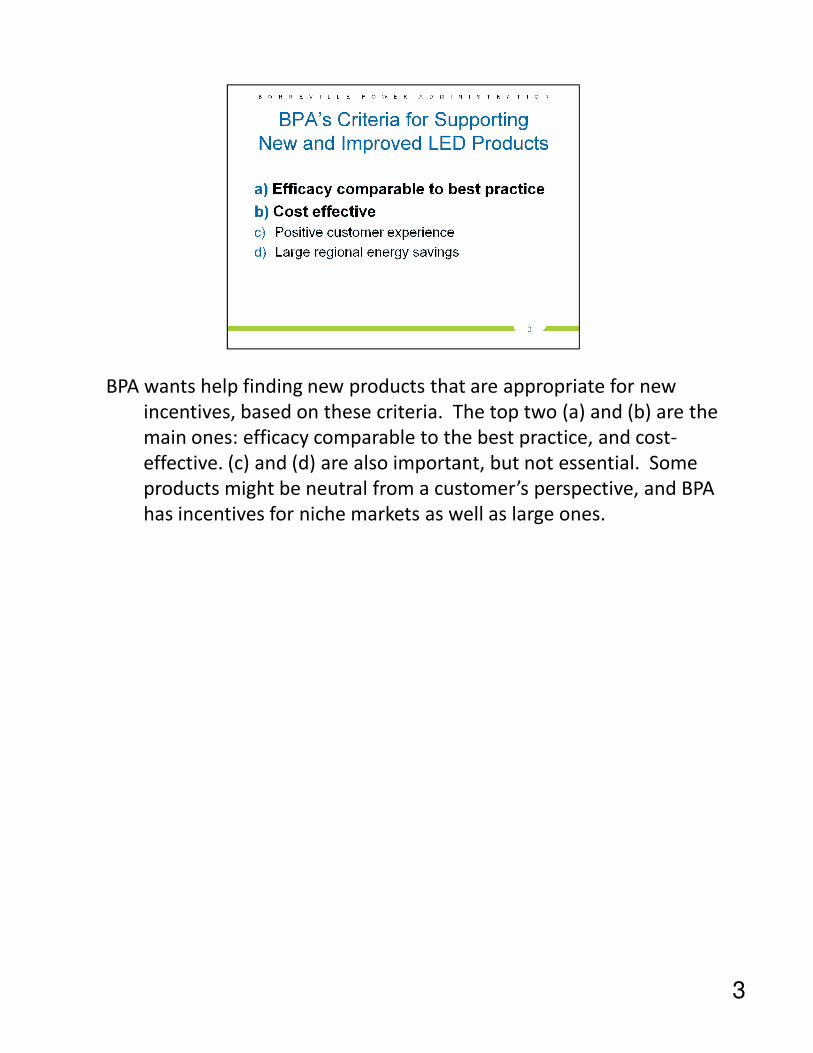
BPA wants help finding new products that are appropriate for new
incentives, based on these criteria. The top two (a) and (b) are the
main ones: efficacy comparable to the best practice, and cost-
effective. (c) and (d) are also important, but not essential. Some
products might be neutral from a customer’s perspective, and BPA
has incentives for niche markets as well as large ones.
3
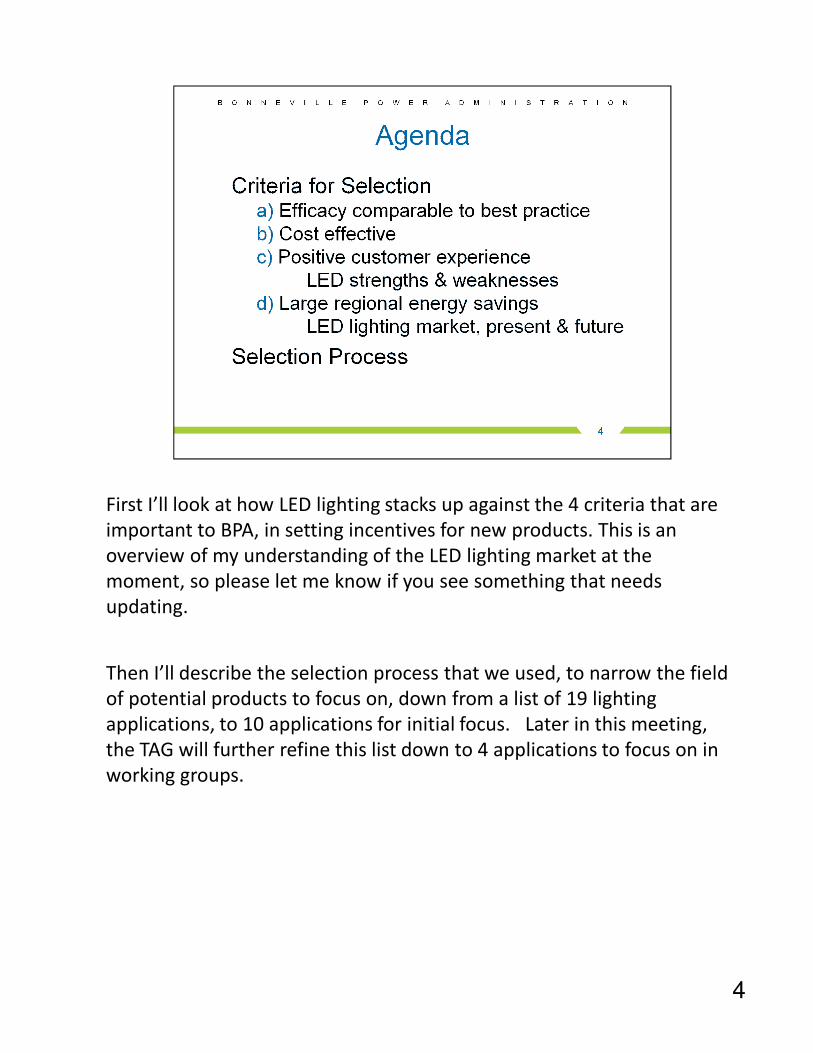
First I’ll look at how LED lighting stacks up against the 4 criteria that are
important to BPA, in setting incentives for new products. This is an important to BPA, in setting incentives for new products. This is an
overview of my understanding of the LED lighting market at the
moment, so please let me know if you see something that needs
updating.
Then I’ll describe the selection process that we used, to narrow the field
of potential products to focus on, down from a list of 19 lighting
applications, to 10 applications for initial focus. Later in this meeting,
the TAG will further refine this list down to 4 applications to focus on in
working groups.
4
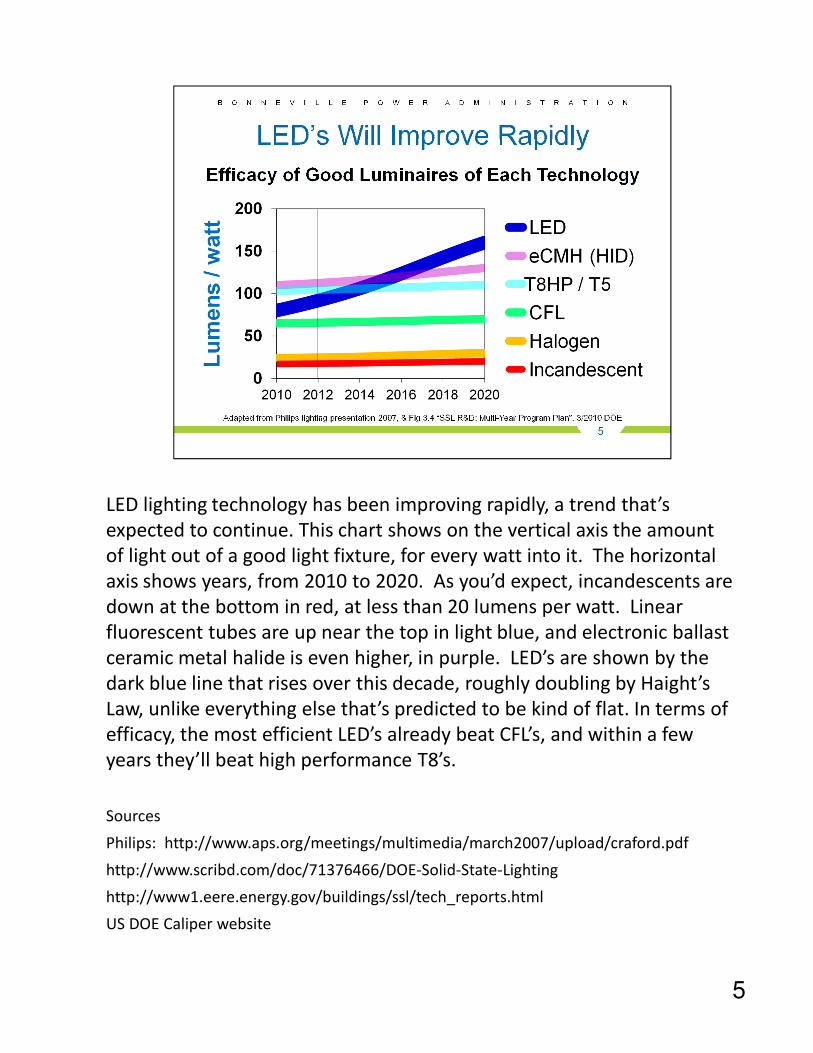
LED lighting technology has been improving rapidly, a trend that’s
expected to continue. This chart shows on the vertical axis the amount
5
expected to continue. This chart shows on the vertical axis the amount
of light out of a good light fixture, for every watt into it. The horizontal
axis shows years, from 2010 to 2020. As you’d expect, incandescents are
down at the bottom in red, at less than 20 lumens per watt. Linear
fluorescent tubes are up near the top in light blue, and electronic ballast
ceramic metal halide is even higher, in purple. LED’s are shown by the
dark blue line that rises over this decade, roughly doubling by Haight’s
Law, unlike everything else that’s predicted to be kind of flat. In terms of
efficacy, the most efficient LED’s already beat CFL’s, and within a few
years they’ll beat high performance T8’s.
Sources
Philips: http://www.aps.org/meetings/multimedia/march2007/upload/craford.pdf
http://www.scribd.com/doc/71376466/DOE-Solid-State-Lighting
http://www1.eere.energy.gov/buildings/ssl/tech_reports.html
US DOE Caliper website

While the best LED’s perform well today in terms of energy efficiency,
there’s a broad range of products, from 100 lumens per watt all the way
6
there’s a broad range of products, from 100 lumens per watt all the way
down to below 20, comparable to incandescent. At present, BPA
incentives for LED lights require at least 40 lumens/watt.

In general, LED’s tend to be more expensive than the incumbent
products, so cost effectiveness is a big question. I’ll mention it here, and products, so cost effectiveness is a big question. I’ll mention it here, and
John Wilson will say more in the next presentation.
In some applications, expensive LED’s are cost-effective based on the
total cost of ownership. For instance, LED’s work well in parking lots,
because they cut down on maintenance visits.
On the other hand, the $50 A-lamp that recently won the L-prize is
competing with a $5 CFL for about the same energy savings. That’s hard
to justify, but it might work where CFL’s don’t work, for instance
replacing incandescent lamps in hotel lobbies running 24/7.
Since LED prices are dropping and products are improving quickly, we’re
excited about getting updated advice from TAG members about the
latest LED pricing.
7

As you know, these are some of the advantages of LED lighting over
incumbent technologies. The relative value of each feature depends on incumbent technologies. The relative value of each feature depends on
the particular application.
8
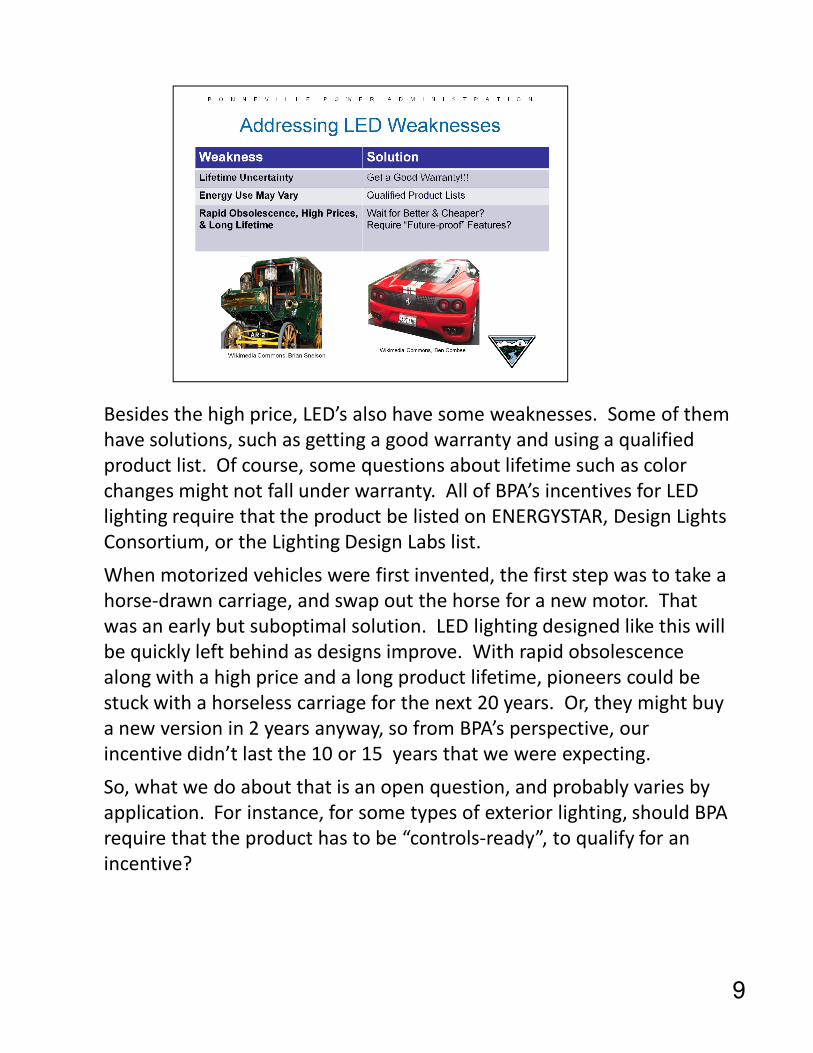
Besides the high price, LED’s also have some weaknesses. Some of them
have solutions, such as getting a good warranty and using a qualified
product list. Of course, some questions about lifetime such as color
changes might not fall under warranty. All of BPA’s incentives for LED
lighting require that the product be listed on ENERGYSTAR, Design Lights lighting require that the product be listed on ENERGYSTAR, Design Lights
Consortium, or the Lighting Design Labs list.
When motorized vehicles were first invented, the first step was to take a
horse-drawn carriage, and swap out the horse for a new motor. That
was an early but suboptimal solution. LED lighting designed like this will
be quickly left behind as designs improve. With rapid obsolescence
along with a high price and a long product lifetime, pioneers could be
stuck with a horseless carriage for the next 20 years. Or, they might buy
a new version in 2 years anyway, so from BPA’s perspective, our
incentive didn’t last the 10 or 15 years that we were expecting.
So, what we do about that is an open question, and probably varies by
application. For instance, for some types of exterior lighting, should BPA
require that the product has to be “controls-ready”, to qualify for an
incentive?
9

Now that we’ve looked at customer experience, let’s look at the
potential energy savings across the total installed base of lighting. This
chart shows that for electric lighting, the largest energy consumption is
in commercial linear fluorescent lights, the big purple rectangle. After
that, it’s residential incandescent lights in the red square on the left, and
third place goes to High Intensity Discharge in green, that’s mainly used
outdoors.
When you add up all the different categories for lighting in the US, the
total is 700 Terawatt hours/year. In the Northwest, the relative
distribution of the different technologies is similar. Just as a reminder,
the slides will be on the e3tnw TAG portal website if you want to take a
closer look later.
Source: http://www1.eere.energy.gov/buildings/ssl/tech_reports.html
10

In 2010, LED’s were a tiny part of the market. In the same year that
lighting in the United States used 700 terawatt hours of electricity, LED
lighting saved less than 3 terawatt hours, total.
This chart shows that most of those energy savings in 2010 were in This chart shows that most of those energy savings in 2010 were in
lighting for Parking, Area and Flood.
As a percentage of all the energy in lighting, the energy savings from
LEDs are not very big yet.
11

This chart shows the market value of LED lighting sales, as a percentage
of the market value of all lighting sales globally, predicted by McKinsey.
In 2010, shown in blue on the left, LED’s were miniscule in all markets
except architectural. But they’re growing fast.
By 2016, shown as blue plus red, they’re predicted to constitute the
majority of the market in Architectural, Hospitality, Retail and
Residential. That’s because they’re mainly competing with incandescent
and halogen technologies, where the energy savings and long lifetime
are major benefits.
By 2020 shown as blue plus red plus green, LED is predicted to takeover
most of the outdoor market as well, and make substantial progress in
office and industrial.
12

Here’s an example of how one efficiency program is responding to LED
lighting. In their commercial & industrial lighting program, Efficiency
Vermont already gets about 25% of energy savings from LED lights. They
expect LED’s to comprise the majority of their energy savings by 2014,
and pretty much take over by 2020. The top four colors, orange, light
blue, purple and green, are all LED lighting, and the red line is controls.
Their whole fluorescent program, in dark blue at the bottom, that’s most
of their energy savings this year, will drop by almost 30% every year until
it’s gone in 2020.
Source: adapted from “Efficiency Vermont Perspective: C&I Lighting
Program Results & Plans” 2012
https://conduitnw.org/pages/file.aspx?rid=664
13

Just as a reminder, here are BPA’s criteria for where we want to apply
new incentives.
Next I’ll talk about how we narrowed down the field of things to
consider.consider.
14

In the E3TNW database and the TAG process, we use the word In the E3TNW database and the TAG process, we use the word “technology” for each category that the group considers. We’re looking at different applications of LED lighting, and we’ll call each application a “technology”. Sometimes that seems a little goofy, so please humor us.
Here is a chart showing 19 lighting applications or “technologies” on the left. Out of them, we picked a smaller subset of 10, for the TAG to focus on.
In the center, the column heading “BPA LC” tells whether BPA already provides commercial incentives for this application. “EE Progr” indicates interest in this application by the BPA Energy Efficiency Program Department, as High, Medium or Low. “Regional Potential” is a rough estimate of the size of potential electricity savings in the Pacific Northwest, as High, Medium or Low. The product development timeline shows our estimated timeline of product development over the next 5 years. Another consideration that’s not shown here, is how easily LED’s compete with the incumbent best practice. Based on all of this information, we ranked each row with a high, medium or low priority, for initial consideration by the TAG.
15

Based on the previous slide, we chose 10 areas with a medium or high
priority, for the initial focus. This chart has a rough draft of some details
about those 10 areas. During the TAG process, working groups will focus
on 4 of these, to dive into more details about the benefits of LED’s in
each market, and the gaps that could be addressed with research by
BPA. By the way, wall packs were a last-minute addition that are on the
list but not in this slide.
16

E3tnw.org web page
A-Lamp Replacement http://www.e3tnw.org/ItemDetail.aspx?id=214
Outdoor Residential http://www.e3tnw.org/ItemDetail.aspx?id=411
Parking Garage http://www.e3tnw.org/ItemDetail.aspx?id=418
Linear Commercial Office Lighting
(including troffers and pendants)http://www.e3tnw.org/ItemDetail.aspx?id=401
High- and Low-Bay Retrofit Lamps http://www.e3tnw.org/ItemDetail.aspx?id=413
High- & Low-Bay Luminaires http://www.e3tnw.org/ItemDetail.aspx?id=402
Outdoor Commercial Flood http://www.e3tnw.org/ItemDetail.aspx?id=414
Area & Parking Lot http://www.e3tnw.org/ItemDetail.aspx?id=417
Street Lighting http://www.e3tnw.org/ItemDetail.aspx?id=78
This table lists the same 9 applications shown in the previous slide, with
internet links to the E3TNW.org database pages about each application.
Please explore any topics of interest, and feel free to edit the E3TNW
website.
17
Street Lighting http://www.e3tnw.org/ItemDetail.aspx?id=78