This paper is published as part of a themed issue on ... · This paper is published as part of a...
9
This paper is published as part of a PCCP themed issue on recent developments in X-ray absorption spectroscopy Guest Editor: Jeroen Anton van Bokhoven Editorial Recent developments in X-ray absorption spectroscopy J. A. van Bokhoven, Phys. Chem. Chem. Phys., 2010 DOI: 10.1039/c0cp90010a Perspectives Parameter-free calculations of X-ray spectra with FEFF9 John J. Rehr, Joshua J. Kas, Fernando D. Vila, Micah P. Prange and Kevin Jorissen, Phys. Chem. Chem. Phys., 2010 DOI: 10.1039/b926434e The atomic AXAFS and Δμ XANES techniques as applied to heterogeneous catalysis and electrocatalysis D. E. Ramaker and D. C. Koningsberger, Phys. Chem. Chem. Phys., 2010 DOI: 10.1039/b927120c Advances in high brilliance energy dispersive X-ray absorption spectroscopy Sakura Pascarelli and Olivier Mathon, Phys. Chem. Chem. Phys., 2010 DOI: 10.1039/b926509k Communication μ-XANES mapping of buried interfaces: pushing microbeam techniques to the nanoscale Paolo Ghigna, Sonia Pin, Giorgio Spinolo, Mark A. Newton, Michele Zema, Serena C. Tarantino, Giancarlo Capitani and Francesco Tatti, Phys. Chem. Chem. Phys., 2010 DOI: 10.1039/c000195c Papers L-edge XANES analysis of photoexcited metal complexes in solution Renske M. van der Veen, Joshua J. Kas, Christopher J. Milne, Van-Thai Pham, Amal El Nahhas, Frederico A. Lima, Dimali A. Vithanage, John J. Rehr, Rafael Abela and Majed Chergui, Phys. Chem. Chem. Phys., 2010 DOI: 10.1039/b927033g EXAFS as a tool to interrogate the size and shape of mono and bimetallic catalyst nanoparticles Andrew M. Beale and Bert M. Weckhuysen, Phys. Chem. Chem. Phys., 2010 DOI: 10.1039/b925206a X-Ray absorption in homogeneous catalysis research: the iron-catalyzed Michael addition reaction by XAS, RIXS and multi-dimensional spectroscopy Matthias Bauer and Christoph Gastl, Phys. Chem. Chem. Phys., 2010 DOI: 10.1039/b926385c Combined TPRx, in situ GISAXS and GIXAS studies of model semiconductor-supported platinum catalysts in the hydrogenation of ethene Sonja A. Wyrzgol, Susanne Schäfer, Sungsik Lee, Byeongdu Lee, Marcel Di Vece, Xuebing Li, Sönke Seifert, Randall E. Winans, Martin Stutzmann, Johannes A. Lercher and Stefan Vajda, Phys. Chem. Chem. Phys., 2010 DOI: 10.1039/b926493k Near sulfur L-edge X-ray absorption spectra of methanethiol in isolation and adsorbed on a Au(111) surface: a theoretical study using the four-component static exchange approximation Sebastien Villaume, Ulf Ekström, Henrik Ottosson and Patrick Norman, Phys. Chem. Chem. Phys., 2010 DOI: 10.1039/b926109e Influence of additives in defining the active phase of the ethylene oxychlorination catalyst N. B. Muddada, U. Olsbye, L. Caccialupi, F. Cavani, G. Leofanti, D. Gianolio, S. Bordiga and C. Lamberti, Phys. Chem. Chem. Phys., 2010 DOI: 10.1039/b926502n First-principles calculations of X-ray absorption spectra at the K-edge of 3d transition metals: an electronic structure analysis of the pre-edge Delphine Cabaret, Amélie Bordage, Amélie Juhin, Mounir Arfaoui and Emilie Gaudry, Phys. Chem. Chem. Phys., 2010 DOI: 10.1039/b926499j First steps in combining modulation excitation spectroscopy with synchronous dispersive EXAFS/DRIFTS/mass spectrometry for in situ time resolved study of heterogeneous catalysts Davide Ferri, M. Santosh Kumar, Ronny Wirz, Arnim Eyssler, Oxana Korsak, Paul Hug, Anke Weidenkaff and Mark A. Newton, Phys. Chem. Chem. Phys., 2010 DOI: 10.1039/b926886c Novel opportunities for time-resolved absorption spectroscopy at the X-ray free electron laser B. D. Patterson and R. Abela, Phys. Chem. Chem. Phys., 2010 DOI: 10.1039/c003406a Published on 05 May 2010. Downloaded by TU Berlin - Universitaetsbibl on 19/02/2015 13:06:54. View Article Online / Journal Homepage / Table of Contents for this issue
Transcript of This paper is published as part of a themed issue on ... · This paper is published as part of a...
This paper is published as part of a PCCP themed issue on recent developments in X-ray absorption spectroscopy Guest Editor: Jeroen Anton van Bokhoven
Editorial
Recent developments in X-ray absorption spectroscopy J. A. van Bokhoven, Phys. Chem. Chem. Phys., 2010 DOI: 10.1039/c0cp90010a
Perspectives
Parameter-free calculations of X-ray spectra with FEFF9 John J. Rehr, Joshua J. Kas, Fernando D. Vila, Micah P. Prange and Kevin Jorissen, Phys. Chem. Chem. Phys., 2010 DOI: 10.1039/b926434e
The atomic AXAFS and Δμ XANES techniques as applied to heterogeneous catalysis and electrocatalysis D. E. Ramaker and D. C. Koningsberger, Phys. Chem. Chem. Phys., 2010 DOI: 10.1039/b927120c
Advances in high brilliance energy dispersive X-ray absorption spectroscopy Sakura Pascarelli and Olivier Mathon, Phys. Chem. Chem. Phys., 2010 DOI: 10.1039/b926509k
Communication
μ-XANES mapping of buried interfaces: pushing microbeam techniques to the nanoscale Paolo Ghigna, Sonia Pin, Giorgio Spinolo, Mark A. Newton, Michele Zema, Serena C. Tarantino, Giancarlo Capitani and Francesco Tatti, Phys. Chem. Chem. Phys., 2010 DOI: 10.1039/c000195c
Papers
L-edge XANES analysis of photoexcited metal complexes in solution Renske M. van der Veen, Joshua J. Kas, Christopher J. Milne, Van-Thai Pham, Amal El Nahhas, Frederico A. Lima, Dimali A. Vithanage, John J. Rehr, Rafael Abela and Majed Chergui, Phys. Chem. Chem. Phys., 2010 DOI: 10.1039/b927033g
EXAFS as a tool to interrogate the size and shape of mono and bimetallic catalyst nanoparticles Andrew M. Beale and Bert M. Weckhuysen, Phys. Chem. Chem. Phys., 2010 DOI: 10.1039/b925206a
X-Ray absorption in homogeneous catalysis research: the iron-catalyzed Michael addition reaction by XAS, RIXS and multi-dimensional spectroscopy Matthias Bauer and Christoph Gastl, Phys. Chem. Chem. Phys., 2010 DOI: 10.1039/b926385c
Combined TPRx, in situ GISAXS and GIXAS studies of model semiconductor-supported platinum catalysts in the hydrogenation of ethene Sonja A. Wyrzgol, Susanne Schäfer, Sungsik Lee, Byeongdu Lee, Marcel Di Vece, Xuebing Li, Sönke Seifert, Randall E. Winans, Martin Stutzmann, Johannes A. Lercher and Stefan Vajda, Phys. Chem. Chem. Phys., 2010 DOI: 10.1039/b926493k
Near sulfur L-edge X-ray absorption spectra of methanethiol in isolation and adsorbed on a Au(111) surface: a theoretical study using the four-component static exchange approximation Sebastien Villaume, Ulf Ekström, Henrik Ottosson and Patrick Norman, Phys. Chem. Chem. Phys., 2010 DOI: 10.1039/b926109e
Influence of additives in defining the active phase of the ethylene oxychlorination catalyst N. B. Muddada, U. Olsbye, L. Caccialupi, F. Cavani, G. Leofanti, D. Gianolio, S. Bordiga and C. Lamberti, Phys. Chem. Chem. Phys., 2010 DOI: 10.1039/b926502n
First-principles calculations of X-ray absorption spectra at the K-edge of 3d transition metals: an electronic structure analysis of the pre-edge Delphine Cabaret, Amélie Bordage, Amélie Juhin, Mounir Arfaoui and Emilie Gaudry, Phys. Chem. Chem. Phys., 2010 DOI: 10.1039/b926499j
First steps in combining modulation excitation spectroscopy with synchronous dispersive EXAFS/DRIFTS/mass spectrometry for in situ time resolved study of heterogeneous catalysts Davide Ferri, M. Santosh Kumar, Ronny Wirz, Arnim Eyssler, Oxana Korsak, Paul Hug, Anke Weidenkaff and Mark A. Newton, Phys. Chem. Chem. Phys., 2010 DOI: 10.1039/b926886c
Novel opportunities for time-resolved absorption spectroscopy at the X-ray free electron laser B. D. Patterson and R. Abela, Phys. Chem. Chem. Phys., 2010 DOI: 10.1039/c003406a
Publ
ishe
d on
05
May
201
0. D
ownl
oade
d by
TU
Ber
lin -
Uni
vers
itaet
sbib
l on
19/0
2/20
15 1
3:06
:54.
View Article Online / Journal Homepage / Table of Contents for this issue
Spatially resolved 3D micro-XANES by a confocal detection scheme Geert Silversmit, Bart Vekemans, Sergey Nikitenko, Sylvia Schmitz, Tom Schoonjans, Frank E. Brenker and Laszlo Vincze, Phys. Chem. Chem. Phys., 2010 DOI: 10.1039/c004103n
Wavelet transform EXAFS analysis of mono- and dimolybdate model compounds and a Mo/HZSM-5 dehydroaromatization catalyst Robert O. Savinelli and Susannah L. Scott, Phys. Chem. Chem. Phys., 2010 DOI: 10.1039/b926474d
Electronic structure of alumina-supported monometallic Pt and bimetallic PtSn catalysts under hydrogen and carbon monoxide environment Jagdeep Singh, Ryan C. Nelson, Brian C. Vicente, Susannah L. Scott and Jeroen A. van Bokhoven, Phys. Chem. Chem. Phys., 2010 DOI: 10.1039/c000403k
Determination of CO, H2O and H2 coverage by XANES and EXAFS on Pt and Au during water gas shift reaction Neng Guo, Bradley R. Fingland, W. Damion Williams, Vincent F. Kispersky, Jelena Jelic, W. Nicholas Delgass, Fabio H. Ribeiro, Randall J. Meyer and Jeffrey T. Miller, Phys. Chem. Chem. Phys., 2010 DOI: 10.1039/c000240m
Complementarity between high-energy photoelectron and L-edge spectroscopy for probing the electronic structure of 5d transition metal catalysts Toyli Anniyev, Hirohito Ogasawara, Mathias P. Ljungberg, Kjartan T. Wikfeldt, Janay B. MacNaughton, Lars-Åke Näslund, Uwe Bergmann, Shirlaine Koh, Peter Strasser, Lars G.M. Pettersson and Anders Nilsson, Phys. Chem. Chem. Phys., 2010 DOI: 10.1039/b926414k
In situ time-resolved DXAFS for the determination of kinetics of structural changes of H-ZSM-5-supported active Re-cluster catalyst in the direct phenol synthesis from benzene and O2 Mizuki Tada, Yohei Uemura, Rajaram Bal, Yasuhiro Inada, Masaharu Nomura and Yasuhiro Iwasawa, Phys. Chem. Chem. Phys., 2010 DOI: 10.1039/c000843p
Sulfur poisoning mechanism of steam reforming catalysts: an X-ray absorption near edge structure (XANES) spectroscopic study Yongsheng Chen, Chao Xie, Yan Li, Chunshan Song and Trudy B. Bolin, Phys. Chem. Chem. Phys., 2010 DOI: 10.1039/b925910b
Peroxide-like intermediate observed at hydrogen rich condition on Pt(111) after interaction with oxygen Janay B. MacNaughton, Lars-Åke Näslund, Toyli Anniyev, Hirohito Ogasawara and Anders Nilsson, Phys. Chem. Chem. Phys., 2010 DOI: 10.1039/b926409b
Publ
ishe
d on
05
May
201
0. D
ownl
oade
d by
TU
Ber
lin -
Uni
vers
itaet
sbib
l on
19/0
2/20
15 1
3:06
:54.
View Article Online

Complementarity between high-energy photoelectron and L-edge
spectroscopy for probing the electronic structure of 5d transition
metal catalysts
Toyli Anniyev,ab
Hirohito Ogasawara,bMathias P. Ljungberg,
c
Kjartan T. Wikfeldt,cJanay B. MacNaughton,
abLars-Ake Naslund,
ab
Uwe Bergmann,bShirlaine Koh,
dPeter Strasser,
eLars G.M. Pettersson
cand
Anders Nilsson*abc
Received 14th December 2009, Accepted 4th May 2010
First published as an Advance Article on the web 5th May 2010
DOI: 10.1039/b926414k
We demonstrate the successful use of hard X-ray photoelectron spectroscopy (HAXPES) for
selectively probing the platinum partial d-density of states (DOS) in a Pt–Cu nanoparticle
catalyst which shows activity superior to pure Pt towards the oxygen-reduction reaction (ORR).
The information about occupied Pt d-band states was complemented by Pt L2-edge X-ray
absorption near-edge spectroscopy (XANES), which probes unoccupied valence states. We found
a significant electronic perturbation of the Pt projected d-DOS which was narrowed and shifted to
higher binding energy compared to pure platinum. The effect of this electronic structure
perturbation on the chemical properties of the nanoparticle surface is discussed in terms of the
d-band model. We have thereby demonstrated that the combination of L-edge spectroscopy
and HAXPES allows for an experimental derivation of the valence electronic structure in an
element-specific way for 5d metal catalysts.
1. Introduction
Catalysis facilitates chemical transformations in the chemical
industry providing many products of importance for daily life,
from fertilizers and plastics to pharmaceuticals.1,2 Catalysis is
vital in the current energy sector related to crude-oil processing
and Fischer–Tropsch synthesis of gasoline. It will also play a
major role in the development of future sustainable techno-
logies, such as photocatalytic CO2 reduction to synthetic fuels
and electrochemical energy-conversion devices for the trans-
portation sector.
As early as in the 1930s scientists identified the electronic
structure3,4 as a major factor that controls the activity of solids
towards heterogeneous catalytic reactions. The understanding
of the role of the electronic structure in determining the
reactivity of the catalyst evolved into a simple d-band model.5
It has been successful in relating the adsorption properties
of rate-limiting intermediates in catalytic processes to the electronic
structure of the catalyst based on the energy position of the
center of the d-band.5,6 To fully take advantage of this
development it will be essential to develop experimental tools
that can probe the d-band of catalytic nanoparticles in both
the occupied and unoccupied regions of the electronic struc-
ture. We can then establish an experimental relationship
between electronic structure and catalytic reactivity which
can be compared with theory.
There are several spectroscopic techniques available to
probe the electronic structure of solids, the most widely used
being X-ray photoelectron spectroscopy (XPS), ultra-violet
photoemission spectroscopy (UPS), X-ray absorption spectro-
scopy (XAS) and X-ray emission spectroscopy (XES).7,8 XPS
is a powerful non-destructive probe of the occupied electronic
levels of solids. In the UV regime both the surface sensitivity
and the photoionization cross section of the valence shell are
the highest.9 Furthermore, the low-energy region has provided
high momentum resolution using angular resolved measure-
ments of single-crystal substrates allowing for a detailed
determination of the band structure.9
In order to probe specifically the electronic structure of
transition metal nanoparticle catalysts using XPS severe
challenges must be overcome. In particular, strong spectral
contributions from the catalyst support (oxides, amorphous
carbon) and residual contaminations could dominate the
valence band spectra. However, this hurdle can be overcome
by utilizing the difference in photon energy dependence of
photoionization cross sections of the active catalyst and its
support. By tuning the photon energy, the contribution from
the support can be selectively suppressed and the catalyst
density of states in the valence shell extracted. This is particularly
effective for probing the electronic structure of bimetallic
alloys where the components have different excitation energy
a Stanford Institute for Materials and Energy Sciences,SLAC National Accelerator Laboratory, 2575 Sand Hill Rd,Menlo Park, CA-94025, USA. E-mail: [email protected]
b Stanford Synchrotron Radiation Lightsource, SLAC NationalAccelerator Laboratory, 2575 Sand Hill Rd, Menlo Park,CA-94025, USA
c FYSIKUM, Albanova University Center, Stockholm University,S-106 91 Stockholm, Sweden
dDepartment of Chemical and Biomolecular Engineering,University of Houston, Houston, Texas 77204
eDepartment of Chemistry, Chemical Engineering Division,Technical University Berlin, 10623 Berlin, Germany
5694 | Phys. Chem. Chem. Phys., 2010, 12, 5694–5700 This journal is �c the Owner Societies 2010
PAPER www.rsc.org/pccp | Physical Chemistry Chemical Physics
Publ
ishe
d on
05
May
201
0. D
ownl
oade
d by
TU
Ber
lin -
Uni
vers
itaet
sbib
l on
19/0
2/20
15 1
3:06
:54.
View Article Online

dependence of their valence shell cross-sections. A good
example would be Pt-3d bimetallic alloy catalysts which are
important catalysts for the oxygen reduction reaction (ORR)
in polymer electrolyte membrane fuel cells.
Valence band spectra measured at low photon energies
are dominated by the contribution from the 3d metal valence
band; the situation is reversed for high photon energies, i.e. at
hn= 8 keV the calculated Pt 5d cross-section (3.1 � 102 barns)
is at least an order of magnitude larger than the 3d cross-
section of any 3d transition metal (the smallest is for Sc
3d= 4.77 � 10�2 barns, the largest for Zn 3d= 15.7 barns).10
Thus, the extension of XPS towards hard X-rays is invaluable
for this application. A pioneering experiment,11 done at 8 keV,
demonstrated the feasibility of hard X-ray photoelectron
spectroscopy (HAXPES) measurements. However, the very
low count rate attainable at the time rendered the technique
useless for any practical applications. It was not until the
development of high-brilliance third-generation synchrotron
radiation facilities that successful measurements of core levels12,13
and valence band14,15 using hard X-rays became possible.
Now, however, HAXPES has become one of the most power-
ful techniques with a wide range of applications, from bulk
electronic structure of strongly correlated materials and solar
cells, to multilayer structures; recent reviews of the technique
are available.16,17
While XPS is used to probe the occupied electronic states,
XAS is used to probe the unoccupied valence states. XAS at
the Pt L-edge probes 2p-to-5d transitions. The first intense
spectral feature in the X-ray absorption near-edge struc-
ture (XANES) is called white line (WL) and represents the
unoccupied DOS in the 5d band.18–20 Conventional XANES
spectra are broadened by the finite lifetime of the core hole
created in the process of absorption. To overcome this
fundamental limitation a high energy-resolution fluorescence
detection (HERFD) X-ray spectroscopy was proposed by
Hamalainen and colleagues,21 who measured sub-lifetime
resolved XANES bymonitoring characteristic fluorescence with
resolution better than the natural line width of the core hole. De
Groot et al.22 measured HERFD spectra of the Pt 5d band
using resonant inelastic X-ray scattering (RIXS) and observed
sharpening of spectral features with respect to conventional
XAS. Safonova et al.23 were able to observe changes in the
unoccupied Pt 5d states upon adsorption of COmolecules using
HERFD. Thus this method allows fine-structure in the spectra
to be resolved and is effective for determining small differences
in the unoccupied DOS for, e.g., Pt-based catalytic materials.
The first measurements of the L2 and L3 edges of Pt were
performed by Qi and colleagues.24 These absorption edges of Pt
are dominated by the dipole allowed transitions 2p1/2 to 5d3/2(L2) and 2p3/2 to 5d3/2,5/2 (L3). Compared to the L3-edge which
has an intense white line, the L2 edge of Pt only shows small
structures. The white line in the L2 edge was even thought to be
absent based on conventional XANES. This was attributed to
the fact that the L2 edge of Pt only makes transitions to the 5d3/2band that is almost filled. However, de Groot et al.22 showed
that when measured using HERFD the L2 absorption edge of
Pt has nonzero white line intensity.
Here, we report on the valence band electronic structure of a
Pt–Cu nanoparticle catalyst studied with high resolution, high
photon energy XPS and on XAS at the Pt L2-edge using
a novel inelastic scattering concept where the life time
broadening of the L-edge can be reduced. In particular we
demonstrate the complementarity of high-energy photo-
electron and L-edge spectroscopies for probing the electronic
structure of 5d transition metal catalysts.
2. Experimental details
The hard X-ray photoelectron spectra (HAXPES) were measured
at beamline BL47XU of the Spring-8 synchrotron radiation
facility. The UHV system was equipped with a Gammadata
Scienta R4000 spectrometer with a total resolution better than
250 meV. The soft X-ray photoelectron measurements were
performed under ultra high vacuum (UHV) conditions with a
base pressure better than 10�10 torr at the undulator beamline
5–1 of the Stanford Synchrotron Radiation Lightsource
(SSRL). The UHV system was equipped with an electron
energy analyzer (VG-Scienta SES-100) for XPS measurements
with total energy resolution better than 0.4 eV for 1480 eV and
0.2 eV for 150 eV. The incident photon energy was varied
between 150 eV and 1480 eV. The Pt L2-edge XAS spectra
were measured at beamline 6–2 at SSRL in RIXS mode
following the Lg1 emission channel.25
The experiments were performed on polycrystalline Pt and
Cu3Pt foil samples and a dealloyed Pt–Cu bimetallic nano-
particle electrocatalyst. The synthesis of the dealloyed nano-
particle electrocatalyst is a two-step process involving the
preparation of the carbon-supported Cu-rich precursor alloy
nanoparticles (Cu3Pt) followed by partial electrochemical
surface dissolution of Cu (dealloying). The Cu-rich catalyst
precursors were prepared by a conventional impregnation-
reductive annealing method involving liquid Pt and Cu salts
and a high surface area carbon support (the details of the
synthesis are given elsewhere26). We compare the electronic
structure of the dealloyed Pt–Cu nanoparticle catalyst to that
of polycrystalline Pt and Cu3Pt foil samples. No significant
core level shift in the Pt 4f level was observed compared to foil
samples indicating that the Pt atoms are in the metallic state.
We computed the d-band density of states (d-DOS) for bulk
platinum and for the Cu3Pt alloy with the GPAW code27
(https://wiki.fysik.dtu.dk/gpaw/). The LDA functional was
used with default PAW (Projector Augmented Wave)28 setups
and grid spacing. The d-DOS was computed by summing the
local density of states of the Pt atomic d-orbitals.
For bulk platinum the smallest orthorhombic unit cell was
used (four atoms in the cell) with the experimental lattice
constant of 3.92 A. A Monkhorst–Pack grid of 20 � 20 � 20
k-points was used and was seen to be well converged with
respect to the d-DOS. For the alloy, the unit cell, containing
one Pt and 3 Cu atoms, was first optimized, giving a lattice
parameter of 3.682 A, then a 3 � 3 � 3 FCC supercell
containing 108 atoms was created by putting the 27 Pt atoms
and 81 Cu atoms randomly at the lattice positions. Finally, the
atomic positions were relaxed using the EMT potential.29 The
d-DOS was in this case calculated using 2 � 2 � 2 k-points
which can be assumed to be reasonably well converged due to
the disorder in the system and the size of the supercell.
This journal is �c the Owner Societies 2010 Phys. Chem. Chem. Phys., 2010, 12, 5694–5700 | 5695
Publ
ishe
d on
05
May
201
0. D
ownl
oade
d by
TU
Ber
lin -
Uni
vers
itaet
sbib
l on
19/0
2/20
15 1
3:06
:54.
View Article Online
Contributions from all 27 Pt atoms were summed to give the
configurationally averaged d-DOS.
The Pt L2-edge XAS calculations were performed with the
real-space multiple-scattering FEFF8.430 code. Self-consistent
potentials were calculated out to 6 A around the absorbing
atom, which provides converged results; the convergence with
respect to the full multiple-scattering (FMS) radius was
probed by varying it between 5 A and up to 11 A in the case
of bulk Pt. All spectra showed good convergence, except for a
remaining sensitivity even for the very largest atomic clusters
in the bulk Pt white-line intensity and in the small peak around
13.277 keV. The Hedin-Lundqvist model was used for the self-
energy and the scattering potential of the absorbing atom was
calculated without a core-hole, corresponding to a completely
screened core-hole in the final state. To simulate sub-lifetime
broadening in the experiments, the imaginary component of
the self-energy was reduced by 2 eV.
3. Results and discussion
In order to obtain the Pt 5d contribution to the valence band
spectra, we utilize the different dependence on photon energy
for photoelectron emission from the Pt 5d and Cu 3d bands.
Table 1 summarizes the values of atomic Cu 3d and Pt 5d
photoionization cross-sections calculated by Scofield10 and
Band et al.31 At low photon energies, the Cu 3d cross-section
is more than 20 times larger than that of Pt 5d, while at high
photon energies the Cu 3d cross-section drops much faster
than that for Pt 5d. To illustrate how we are able to suppress
the Cu contribution by varying the incident photon energy, it
is useful to examine the hn dependence of valence band spectra
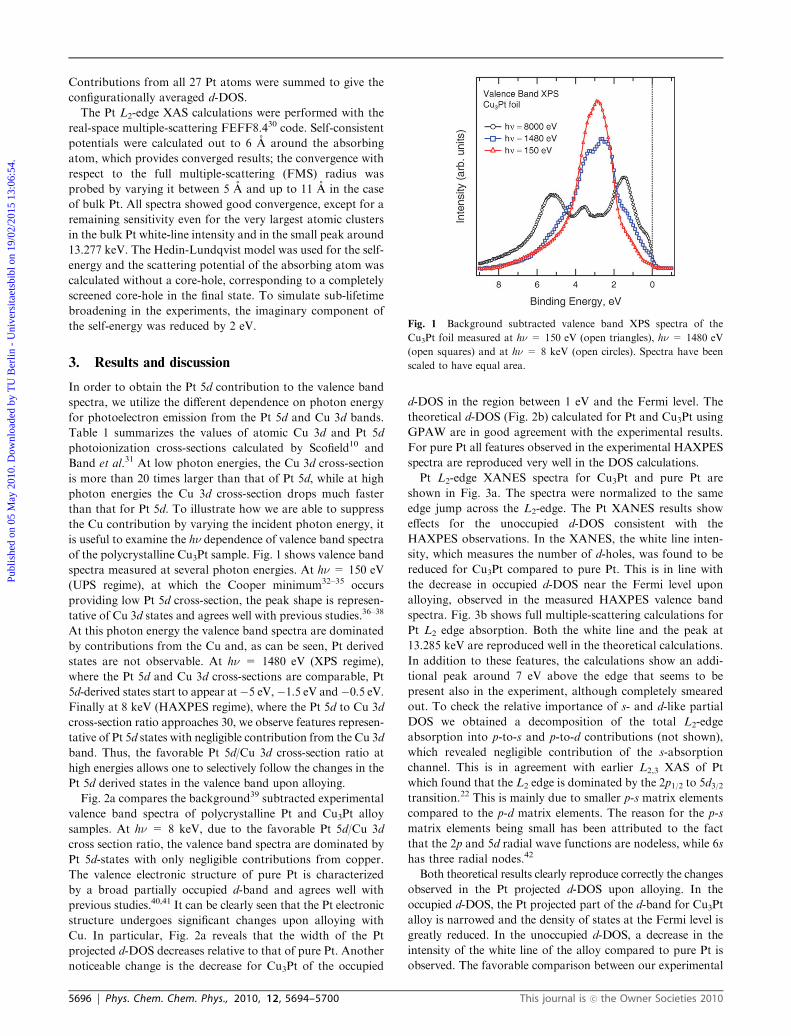
of the polycrystalline Cu3Pt sample. Fig. 1 shows valence band
spectra measured at several photon energies. At hn = 150 eV
(UPS regime), at which the Cooper minimum32–35 occurs
providing low Pt 5d cross-section, the peak shape is represen-
tative of Cu 3d states and agrees well with previous studies.36–38
At this photon energy the valence band spectra are dominated
by contributions from the Cu and, as can be seen, Pt derived
states are not observable. At hn = 1480 eV (XPS regime),
where the Pt 5d and Cu 3d cross-sections are comparable, Pt
5d-derived states start to appear at�5 eV,�1.5 eV and�0.5 eV.Finally at 8 keV (HAXPES regime), where the Pt 5d to Cu 3d
cross-section ratio approaches 30, we observe features represen-
tative of Pt 5d states with negligible contribution from the Cu 3d
band. Thus, the favorable Pt 5d/Cu 3d cross-section ratio at
high energies allows one to selectively follow the changes in the
Pt 5d derived states in the valence band upon alloying.
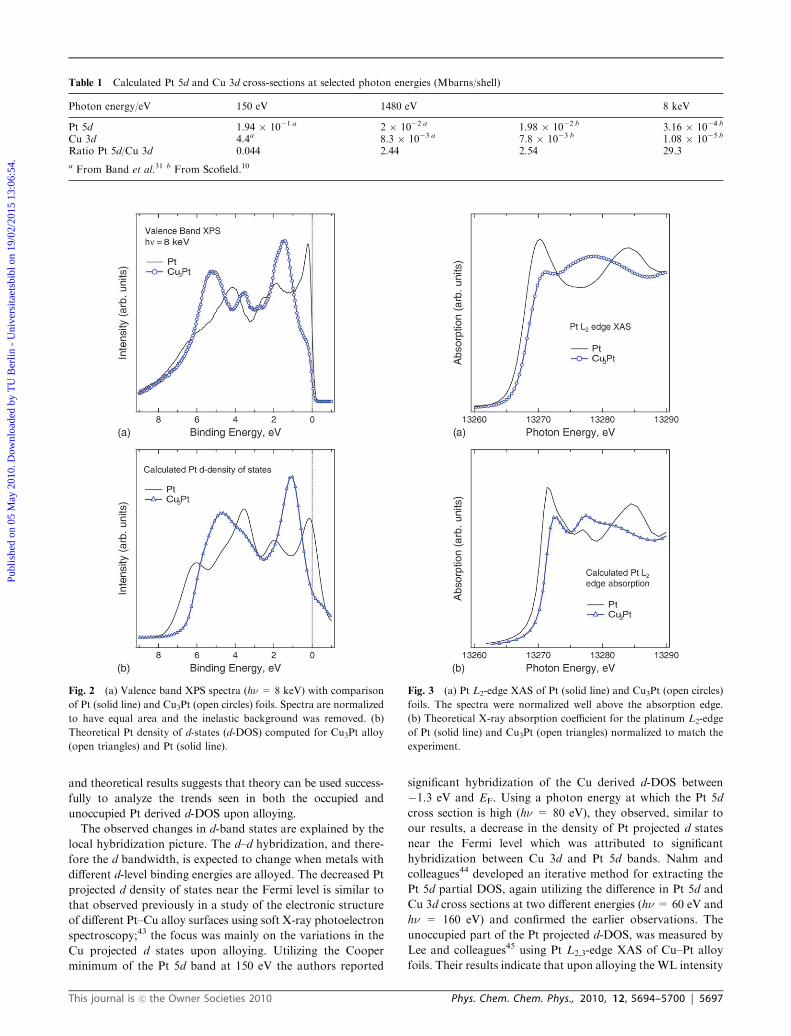
Fig. 2a compares the background39 subtracted experimental
valence band spectra of polycrystalline Pt and Cu3Pt alloy
samples. At hn = 8 keV, due to the favorable Pt 5d/Cu 3d
cross section ratio, the valence band spectra are dominated by
Pt 5d-states with only negligible contributions from copper.
The valence electronic structure of pure Pt is characterized
by a broad partially occupied d-band and agrees well with
previous studies.40,41 It can be clearly seen that the Pt electronic
structure undergoes significant changes upon alloying with
Cu. In particular, Fig. 2a reveals that the width of the Pt
projected d-DOS decreases relative to that of pure Pt. Another
noticeable change is the decrease for Cu3Pt of the occupied
d-DOS in the region between 1 eV and the Fermi level. The
theoretical d-DOS (Fig. 2b) calculated for Pt and Cu3Pt using
GPAW are in good agreement with the experimental results.
For pure Pt all features observed in the experimental HAXPES
spectra are reproduced very well in the DOS calculations.
Pt L2-edge XANES spectra for Cu3Pt and pure Pt are
shown in Fig. 3a. The spectra were normalized to the same
edge jump across the L2-edge. The Pt XANES results show
effects for the unoccupied d-DOS consistent with the
HAXPES observations. In the XANES, the white line inten-
sity, which measures the number of d-holes, was found to be
reduced for Cu3Pt compared to pure Pt. This is in line with
the decrease in occupied d-DOS near the Fermi level upon
alloying, observed in the measured HAXPES valence band
spectra. Fig. 3b shows full multiple-scattering calculations for
Pt L2 edge absorption. Both the white line and the peak at
13.285 keV are reproduced well in the theoretical calculations.
In addition to these features, the calculations show an addi-
tional peak around 7 eV above the edge that seems to be
present also in the experiment, although completely smeared
out. To check the relative importance of s- and d-like partial
DOS we obtained a decomposition of the total L2-edge
absorption into p-to-s and p-to-d contributions (not shown),
which revealed negligible contribution of the s-absorption
channel. This is in agreement with earlier L2,3 XAS of Pt
which found that the L2 edge is dominated by the 2p1/2 to 5d3/2transition.22 This is mainly due to smaller p-s matrix elements
compared to the p-d matrix elements. The reason for the p-s
matrix elements being small has been attributed to the fact
that the 2p and 5d radial wave functions are nodeless, while 6s
has three radial nodes.42
Both theoretical results clearly reproduce correctly the changes
observed in the Pt projected d-DOS upon alloying. In the
occupied d-DOS, the Pt projected part of the d-band for Cu3Pt
alloy is narrowed and the density of states at the Fermi level is
greatly reduced. In the unoccupied d-DOS, a decrease in the
intensity of the white line of the alloy compared to pure Pt is
observed. The favorable comparison between our experimental
Fig. 1 Background subtracted valence band XPS spectra of the
Cu3Pt foil measured at hn = 150 eV (open triangles), hn = 1480 eV
(open squares) and at hn = 8 keV (open circles). Spectra have been
scaled to have equal area.
5696 | Phys. Chem. Chem. Phys., 2010, 12, 5694–5700 This journal is �c the Owner Societies 2010
Publ
ishe
d on
05
May
201
0. D
ownl
oade
d by
TU
Ber
lin -
Uni
vers
itaet
sbib
l on
19/0
2/20
15 1
3:06
:54.
View Article Online
and theoretical results suggests that theory can be used success-
fully to analyze the trends seen in both the occupied and
unoccupied Pt derived d-DOS upon alloying.
The observed changes in d-band states are explained by the
local hybridization picture. The d–d hybridization, and there-
fore the d bandwidth, is expected to change when metals with
different d-level binding energies are alloyed. The decreased Pt
projected d density of states near the Fermi level is similar to
that observed previously in a study of the electronic structure
of different Pt–Cu alloy surfaces using soft X-ray photoelectron
spectroscopy;43 the focus was mainly on the variations in the
Cu projected d states upon alloying. Utilizing the Cooper
minimum of the Pt 5d band at 150 eV the authors reported
significant hybridization of the Cu derived d-DOS between
�1.3 eV and EF. Using a photon energy at which the Pt 5d
cross section is high (hn = 80 eV), they observed, similar to
our results, a decrease in the density of Pt projected d states
near the Fermi level which was attributed to significant
hybridization between Cu 3d and Pt 5d bands. Nahm and
colleagues44 developed an iterative method for extracting the
Pt 5d partial DOS, again utilizing the difference in Pt 5d and
Cu 3d cross sections at two different energies (hn= 60 eV and
hn = 160 eV) and confirmed the earlier observations. The
unoccupied part of the Pt projected d-DOS, was measured by
Lee and colleagues45 using Pt L2,3-edge XAS of Cu–Pt alloy
foils. Their results indicate that upon alloying the WL intensity
Table 1 Calculated Pt 5d and Cu 3d cross-sections at selected photon energies (Mbarns/shell)
Photon energy/eV 150 eV 1480 eV 8 keV
Pt 5d 1.94 � 10�1 a 2 � 10�2 a 1.98 � 10�2 b 3.16 � 10�4 b
Cu 3d 4.4a 8.3 � 10�3 a 7.8 � 10�3 b 1.08 � 10�5 b
Ratio Pt 5d/Cu 3d 0.044 2.44 2.54 29.3
a From Band et al.31 b From Scofield.10
Fig. 2 (a) Valence band XPS spectra (hn = 8 keV) with comparison
of Pt (solid line) and Cu3Pt (open circles) foils. Spectra are normalized
to have equal area and the inelastic background was removed. (b)
Theoretical Pt density of d-states (d-DOS) computed for Cu3Pt alloy
(open triangles) and Pt (solid line).
Fig. 3 (a) Pt L2-edge XAS of Pt (solid line) and Cu3Pt (open circles)
foils. The spectra were normalized well above the absorption edge.
(b) Theoretical X-ray absorption coefficient for the platinum L2-edge
of Pt (solid line) and Cu3Pt (open triangles) normalized to match the
experiment.
This journal is �c the Owner Societies 2010 Phys. Chem. Chem. Phys., 2010, 12, 5694–5700 | 5697
Publ
ishe
d on
05
May
201
0. D
ownl
oade
d by
TU
Ber
lin -
Uni
vers
itaet
sbib
l on
19/0
2/20
15 1
3:06
:54.
View Article Online
in the L3-edge decreases, consistent with the decrease in
number of unoccupied d-states. However their L2-edge XAS
results show an increased WL intensity for the Cu–Pt alloys
compared to pure Pt, contrary to our findings. We explain the
contradiction by the lack of adequate resolution in their
spectra due to lifetime broadening inherently present in con-
ventional XANES. As a consequence of this limitation the
L2-edgeWL is absent and, therefore, a broad feature at 13280 eV
instead was regarded as a WL.
Finally, we show the results on the carbon-supported
Pt–Cu alloy nanoparticle catalyst prepared by electrochemical
dealloying. A family of Pt–Cu nanoparticle catalysts prepared
in the same manner exhibit enhanced ORR activities of up to
5–6 times compared to pure Pt catalysts.26
The average size of the Pt–Cu nanoparticle catalysts was
B3.4 nm.46 Table 2 summarizes the compositional analysis of
the nanoparticle catalyst.w The derived concentration profile
of the dealloyed nanoparticles suggests a core–shell structure
where the shell consists of Pt atoms while the core is
50%–50% in composition. This structure is interesting since
the Pt-shell can assume the lattice constant of the core, which
is smaller than the bulk lattice constant of Pt. This will result
in a strained shell46 which will change the electronic structure
and, as consequence, the reactivity of the surface Pt atoms. On
the other hand there may also be a non-negligible chemical
interaction between the core Cu atoms and the surface Pt
atoms. These two effects combined are likely underlying causes
of the enhanced reactivity observed for the thus prepared
nanoparticle catalyst.
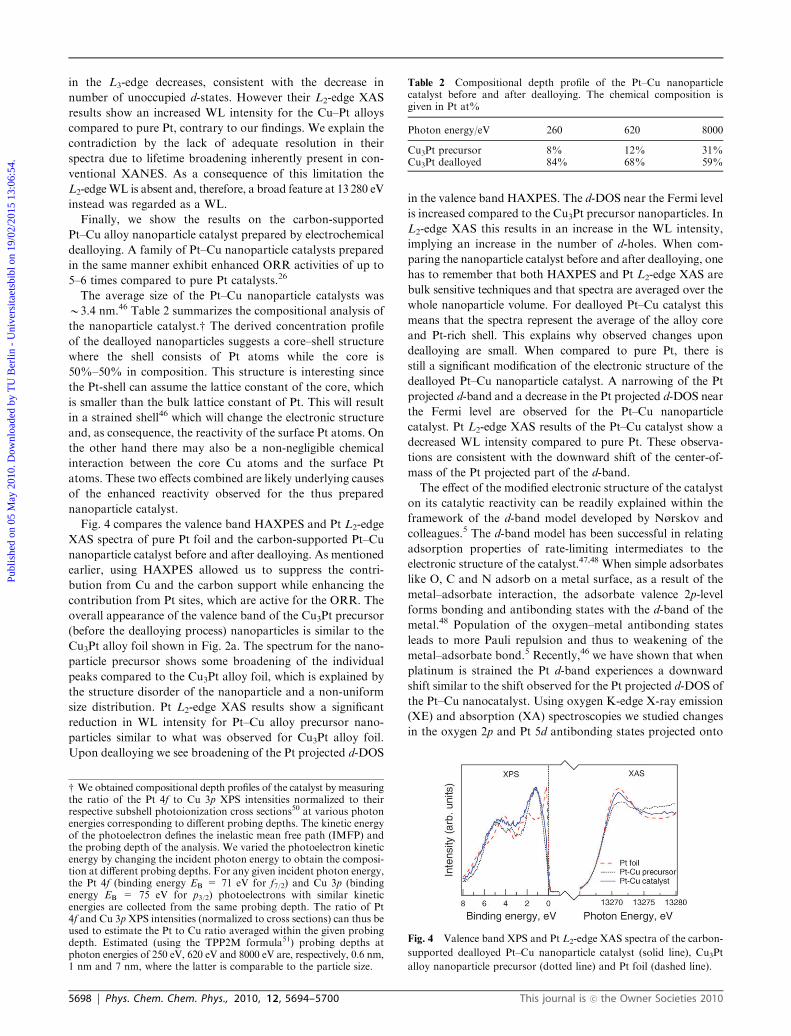
Fig. 4 compares the valence band HAXPES and Pt L2-edge
XAS spectra of pure Pt foil and the carbon-supported Pt–Cu
nanoparticle catalyst before and after dealloying. As mentioned
earlier, using HAXPES allowed us to suppress the contri-
bution from Cu and the carbon support while enhancing the
contribution from Pt sites, which are active for the ORR. The
overall appearance of the valence band of the Cu3Pt precursor
(before the dealloying process) nanoparticles is similar to the
Cu3Pt alloy foil shown in Fig. 2a. The spectrum for the nano-
particle precursor shows some broadening of the individual
peaks compared to the Cu3Pt alloy foil, which is explained by
the structure disorder of the nanoparticle and a non-uniform
size distribution. Pt L2-edge XAS results show a significant
reduction in WL intensity for Pt–Cu alloy precursor nano-
particles similar to what was observed for Cu3Pt alloy foil.
Upon dealloying we see broadening of the Pt projected d-DOS
in the valence band HAXPES. The d-DOS near the Fermi level
is increased compared to the Cu3Pt precursor nanoparticles. In
L2-edge XAS this results in an increase in the WL intensity,
implying an increase in the number of d-holes. When com-
paring the nanoparticle catalyst before and after dealloying, one
has to remember that both HAXPES and Pt L2-edge XAS are
bulk sensitive techniques and that spectra are averaged over the
whole nanoparticle volume. For dealloyed Pt–Cu catalyst this
means that the spectra represent the average of the alloy core
and Pt-rich shell. This explains why observed changes upon
dealloying are small. When compared to pure Pt, there is
still a significant modification of the electronic structure of the
dealloyed Pt–Cu nanoparticle catalyst. A narrowing of the Pt
projected d-band and a decrease in the Pt projected d-DOS near
the Fermi level are observed for the Pt–Cu nanoparticle
catalyst. Pt L2-edge XAS results of the Pt–Cu catalyst show a
decreased WL intensity compared to pure Pt. These observa-
tions are consistent with the downward shift of the center-of-
mass of the Pt projected part of the d-band.
The effect of the modified electronic structure of the catalyst
on its catalytic reactivity can be readily explained within the
framework of the d-band model developed by Nørskov and
colleagues.5 The d-band model has been successful in relating
adsorption properties of rate-limiting intermediates to the
electronic structure of the catalyst.47,48 When simple adsorbates
like O, C and N adsorb on a metal surface, as a result of the
metal–adsorbate interaction, the adsorbate valence 2p-level
forms bonding and antibonding states with the d-band of the
metal.48 Population of the oxygen–metal antibonding states
leads to more Pauli repulsion and thus to weakening of the
metal–adsorbate bond.5 Recently,46 we have shown that when
platinum is strained the Pt d-band experiences a downward
shift similar to the shift observed for the Pt projected d-DOS of
the Pt–Cu nanocatalyst. Using oxygen K-edge X-ray emission
(XE) and absorption (XA) spectroscopies we studied changes
in the oxygen 2p and Pt 5d antibonding states projected onto
Table 2 Compositional depth profile of the Pt–Cu nanoparticlecatalyst before and after dealloying. The chemical composition isgiven in Pt at%
Photon energy/eV 260 620 8000
Cu3Pt precursor 8% 12% 31%Cu3Pt dealloyed 84% 68% 59%
Fig. 4 Valence band XPS and Pt L2-edge XAS spectra of the carbon-
supported dealloyed Pt–Cu nanoparticle catalyst (solid line), Cu3Pt
alloy nanoparticle precursor (dotted line) and Pt foil (dashed line).
w We obtained compositional depth profiles of the catalyst by measuringthe ratio of the Pt 4f to Cu 3p XPS intensities normalized to theirrespective subshell photoionization cross sections50 at various photonenergies corresponding to different probing depths. The kinetic energyof the photoelectron defines the inelastic mean free path (IMFP) andthe probing depth of the analysis. We varied the photoelectron kineticenergy by changing the incident photon energy to obtain the composi-tion at different probing depths. For any given incident photon energy,the Pt 4f (binding energy EB = 71 eV for f7/2) and Cu 3p (bindingenergy EB = 75 eV for p3/2) photoelectrons with similar kineticenergies are collected from the same probing depth. The ratio of Pt4f and Cu 3p XPS intensities (normalized to cross sections) can thus beused to estimate the Pt to Cu ratio averaged within the given probingdepth. Estimated (using the TPP2M formula51) probing depths atphoton energies of 250 eV, 620 eV and 8000 eV are, respectively, 0.6 nm,1 nm and 7 nm, where the latter is comparable to the particle size.
5698 | Phys. Chem. Chem. Phys., 2010, 12, 5694–5700 This journal is �c the Owner Societies 2010
Publ
ishe
d on
05
May
201
0. D
ownl
oade
d by
TU
Ber
lin -
Uni
vers
itaet
sbib
l on
19/0
2/20
15 1
3:06
:54.
View Article Online

the oxygen atom. The XES and XAS results revealed that
when the Pt d band experiences a downward shift it pulls more
of the antibonding states of oxygen below the Fermi level
(antibonding states of oxygen on pure Pt are located above the
Fermi level), which results in more occupation of the anti-
bonding states. This results in weaker bonding of oxygen
species to the strained Pt surface. Combined HAXPES and
Pt L2-edge XAS results of the Pt–Cu nanoparticle catalyst
indicate a downward shift of the Pt projected d-DOS similar to
that observed for the strained Pt surface, so the conclusion can
be transferred directly to the Pt–Cu nanoparticle catalyst, i.e.
the downward shift of the Pt projected d-DOS reduces the
binding energy of oxygen species adsorbed on the surface of
the dealloyed Pt–Cu nanoparticle catalyst. Theoretical results
based on the microkinetic model developed by Hammer and
Nørskov47 for the oxygen reduction reaction49 suggest a
volcano relationship between ORR rate and the binding energy
of the oxygen species. The volcano shape implies that a
downward shift of the Pt d-band enhances the ORR activity
by reducing the binding energy of intermediate oxygen species
and, thus, reducing the activation barriers for proton- and
electron-transfer processes. This interpretation explains con-
sistently observed changes in the Pt projected d-DOS of the
dealloyed Pt–Cu nanoparticle electrocatalyst and its enhanced
ORR reactivity.
4. Conclusion
In summary, the present study demonstrates the feasibility of
hard X-ray photoelectron spectroscopy (HAXPES) to study
the valence band electronic structure of Pt–Cu nanoparticle
catalysts. We found a significant electronic perturbation of the
Pt projected part of the d-DOS: it becomes narrower and shifts
to higher binding energy in the dealloyed Pt–Cu nanoparticles
compared to bulk Pt. The downshift of the d-band is con-
firmed by Pt L2-edge X-ray absorption measurements which
probe the unoccupied valence states. The electronic structure
was used to explain the enhanced activity of the catalysts
towards ORR within the theoretical framework of the d-band
model. We argue, within the d-band model, that the downward
shift of the Pt projected d-DOS leads to a weakening of the
chemical bond between oxygen species and catalyst surface
atoms and thus to enhanced ORR reactivity.
The development of HAXPES gives a new unique addi-
tional capability to investigate the electronic structure of
transition metal catalysts that is complementary to L-edge
spectroscopy since it probes directly the occupied part of the
valence band. The technique will be applicable in general for
most d-band metal catalysts since the cross section of the metal
will be enhanced in comparison to the valence band emission
from C, N and O atoms in the support. This enhancement is
particularly strong for the 5d transition metal series where also
the partial 5d density of states can be projected for alloy
catalysts. It can form the basis to determine the d-band center
and width in real nanoparticle catalysts on supports and allow
a direct comparison with theory. Furthermore, the technique
can be extended to ambient pressures allowing for in situ
monitoring of the catalyst electronic structure under reaction
conditions during gas phase catalytic reactions. This requires a
modification of the energy analyzer to incorporate a differen-
tial pumping section. The technique of HAXPES can thus be
widely applied to transition metal catalysts and complement
conventional L-edge spectroscopy as probe of the electronic
structure.
Acknowledgements
This work was supported by the Division of Materials Sciences
and Engineering, Office of Basic Energy Sciences, US Depart-
ment of Energy, under the auspices of the President’s Hydrogen
Fuel Initiative, and by the Swedish national research council.
This research was partly carried out at the Stanford Synchrotron
Radiation Laboratory, a national user facility operated by
Stanford University on behalf of the US Department of
Energy, Office of Basic Energy Sciences. Portions of this
research were performed at Spring-8 with the approval of Japan
Synchrotron Radiation Research Institute as Nanotechnology
Support Project of the Ministry of Education, Culture, Sports,
Science and Technology (Proposal No. 2007A2005 and
2008A1671/BL-47XU). A generous grant of computer time at
the Swedish NSC national computing center is gratefully
acknowledged. P.S. acknowledges support from UNICAT
cluster of excellence in catalysis funded by the GermanNational
Science Foundation and located at the Technical University
Berlin, Germany.
Notes and references
1 J. Hagen, Industrial catalysis: a practical approach, Wiley-VCH,Weinheim, 2nd edn, 2006.
2 H. F. Rase, Handbook of commercial catalysts: heterogeneouscatalysts, CRC Press, Boca Raton, Florida, 2000.
3 S. Roginsky and E. Schulz, Zeitschrift Fur Physikalische Chemie–Stochiometrie Und Verwandtschaftslehre, 1928, 138, 21–41.
4 A. S. Russell, Nature, 1926, 117, 47–48.5 B. Hammer and J. K. Nørskov, in Advances in Catalysis, AcademicPress Inc, San Diego, 2000, vol. 45, pp. 71–129.
6 A. Nilsson, L. G. M. Pettersson, B. Hammer, T. Bligaard,C. H. Christensen and J. K. Nørskov, Catal. Lett., 2005, 100,111–114.
7 A. Nilsson, J. Electron Spectrosc. Relat. Phenom., 2002, 126, 3–42.8 A. Nilsson and L. G. M. Pettersson, Surf. Sci. Rep., 2004, 55,49–167.
9 S. Hufner, Photoelectron spectroscopy: principles and applications,Springer, Berlin, New York, 3rd edn, 2003.
10 J. H. Scofield, Theoretical Photoionization Cross Sections from 1 to1500 keV, Lawrence Livermore Laboratory Report UCRL-51326,Livermore, California, 1973.
11 I. Lindau, P. Pianetta, S. Doniach and W. E. Spicer, Nature, 1974,250, 214–215.
12 H. Ogasawara, A. Kotani, P. Le Fevre, D. Chandesris andH. Magnan, Phys. Rev. B: Condens. Matter Mater. Phys., 2000,62, 7970–7975.
13 A. Chainani, T. Yokoya, Y. Takata, K. Tamasaku, M. Taguchi,T. Shimojima, N. Kamakura, K. Horiba, S. Tsuda, S. Shin,D. Miwa, Y. Nishino, T. Ishikawa, M. Yabashi, K. Kobayashi,H. Namatame, M. Taniguchi, K. Takada, T. Sasaki, H. Sakuraiand E. Takayama-Muromachi, Phys. Rev. B: Condens. MatterMater. Phys., 2004, 69, 180508.
14 A. Sekiyama, T. Iwasaki, K. Matsuda, Y. Saitoh, Y. Onuki andS. Suga, Nature, 2000, 403, 396–398.
15 K. Kobayashi, M. Yabashi, Y. Takata, T. Tokushima, S. Shin,K. Tamasaku, D. Miwa, T. Ishikawa, H. Nohira, T. Hattori,Y. Sugita, O. Nakatsuka, A. Sakai and S. Zaima, Appl. Phys.Lett., 2003, 83, 1005–1007.
This journal is �c the Owner Societies 2010 Phys. Chem. Chem. Phys., 2010, 12, 5694–5700 | 5699
Publ
ishe
d on
05
May
201
0. D
ownl
oade
d by
TU
Ber
lin -
Uni
vers
itaet
sbib
l on
19/0
2/20
15 1
3:06
:54.
View Article Online

16 W. Drube, Nucl. Instrum. Methods Phys. Res., Sect. A, 2005, 547,87–97.
17 C. S. Fadley, Nucl. Instrum. Methods Phys. Res., Sect. A, 2005,547, 24–41.
18 F. W. Lytle, P. S. P. Wei, R. B. Greegor, G. H. Via andJ. H. Sinfelt, J. Chem. Phys., 1979, 70, 4849–4855.
19 L. F. Mattheiss and R. E. Dietz, Phys. Rev. B: Condens. Matter,1980, 22, 1663–1676.
20 E. Bus and J. A. van Bokhoven, J. Phys. Chem. C, 2007, 111,9761–9768.
21 K. Hamalainen, D. P. Siddons, J. B. Hastings and L. E. Berman,Phys. Rev. Lett., 1991, 67, 2850–2853.
22 F. M. F. de Groot, M. H. Krisch and J. Vogel, Phys. Rev. B:Condens. Matter Mater. Phys., 2002, 66, 195112.
23 O. V. Safonova, M. Tromp, J. A. van Bokhoven, F. M. F. deGroot, J. Evans and P. Glatzel, J. Phys. Chem. B, 2006, 110,16162–16164.
24 B. Qi, I. Perez, P. H. Ansari, F. Lu and M. Croft, Phys. Rev. B:Condens. Matter, 1987, 36, 2972–2975.
25 P. Glatzel and U. Bergmann, Coord. Chem. Rev., 2005, 249, 65–95.26 S. Koh and P. Strasser, J. Am. Chem. Soc., 2007, 129, 12624.27 J. J. Mortensen, L. B. Hansen and K. W. Jacobsen, Phys. Rev. B:
Condens. Matter Mater. Phys., 2005, 71, 035109.28 P. E. Blochl, Phys. Rev. B: Condens. Matter, 1994, 50,
17953–17979.29 K.W. Jacobsen, P. Stoltze and J. K. Nørskov, Surf. Sci., 1996, 366,
394–402.30 A. L. Ankudinov, B. Ravel, J. J. Rehr and S. D. Conradson, Phys.
Rev. B: Condens. Matter Mater. Phys., 1998, 58, 7565–7576.31 I. M. Band, Y. I. Kharitonov and M. B. Trzhaskovskaya, At. Data
Nucl. Data Tables, 1979, 23, 443–505.32 J. W. Cooper, Phys. Rev., 1962, 128, 681–693.33 G. Rossi, I. Lindau, L. Braicovich and I. Abbati, Phys. Rev. B:
Condens. Matter, 1983, 28, 3031–3042.34 U. Fano and J. W. Cooper, Rev. Mod. Phys., 1968, 40, 441–507.
35 S. T. Manson and J. W. Cooper, Phys. Rev., 1968, 165, 126–138.36 P. Steiner, S. Hufner, A. J. Freeman and D. S. Wang, Solid State
Commun., 1982, 44, 619–622.37 L. F. Wagner, Z. Hussain, C. S. Fadley and R. J. Baird, Solid State
Commun., 1977, 21, 453–457.38 J. Stohr, F. R. McFeely, G. Apai, P. S. Wehner and D. A. Shirley,
Phys. Rev. B: Solid State, 1976, 14, 4431–4438.39 D. A. Shirley, Phys. Rev. B: Solid State, 1972, 5, 4709–4714.40 S. Kowalczyk, R. Pollak, D. A. Shirley and L. Ley, Phys. Lett. A,
1972, 41, 455–456.41 N. V. Smith, G. K. Wertheim, S. Hufner and M. M. Traum, Phys.
Rev. B: Solid State, 1974, 10, 3197–3206.42 H. Ebert, J. Stohr, S. S. P. Parkin, M. Samant and A. Nilsson,
Phys. Rev. B: Condens. Matter, 1996, 53, 16067–16073.43 M. L. Shek, P. M. Stefan, I. Lindau and W. E. Spicer, Phys. Rev.
B: Condens. Matter, 1983, 27, 7288–7300.44 T. U. Nahm, J. Y. Kim, S. J. Oh, S. M. Chung, J. H. Park,
J. W. Allen, K. Jeong and S. Kim, Phys. Rev. B: Condens. Matter,1996, 54, 7807–7815.
45 Y. S. Lee, K. Y. Lim, Y. D. Chung, C. N. Whang and Y. Jeon,Surf. Interface Anal., 2000, 30, 475–478.
46 P. Strasser, S. Koh, T. Anniyev, J. Greeley, K. More, C. Yu,Z. Liu, S. Kaya, D. Nordlund, H. Ogasawara, M. F. Toney andA. Nilsson, Nat. Chem., 2010, DOI: 10.1038/nchem.623.
47 B. Hammer and J. K. Nørskov, Nature, 1995, 376, 238–240.48 A. Nilsson, L. G. M. Pettersson and J. K. Nørskov, Chemical
bonding at surfaces and interfaces, Elsevier, Amsterdam, Boston,MA, 1st edn, 2008.
49 J. K. Nørskov, J. Rossmeisl, A. Logadottir, L. Lindqvist,J. R. Kitchin, T. Bligaard and H. Jonsson, J. Phys. Chem. B,2004, 108, 17886–17892.
50 J. J. Yeh and I. Lindau, At. Data Nucl. Data Tables, 1985, 32,1–155.
51 S. Tanuma, C. J. Powell and D. R. Penn, Surf. Interface Anal.,1993, 20, 77–89.
5700 | Phys. Chem. Chem. Phys., 2010, 12, 5694–5700 This journal is �c the Owner Societies 2010
Publ
ishe
d on
05
May
201
0. D
ownl
oade
d by
TU
Ber
lin -
Uni
vers
itaet
sbib
l on
19/0
2/20
15 1
3:06
:54.
View Article Online