This is “Buildings”, chapter 7 from the...
114
This is “Buildings”, chapter 7 from the book Entrepreneurship and Sustainability (index.html) (v. 1.0). This book is licensed under a Creative Commons by-nc-sa 3.0 (http://creativecommons.org/licenses/by-nc-sa/ 3.0/) license. See the license for more details, but that basically means you can share this book as long as you credit the author (but see below), don't make money from it, and do make it available to everyone else under the same terms. This content was accessible as of December 29, 2012, and it was downloaded then by Andy Schmitz (http://lardbucket.org) in an effort to preserve the availability of this book. Normally, the author and publisher would be credited here. However, the publisher has asked for the customary Creative Commons attribution to the original publisher, authors, title, and book URI to be removed. Additionally, per the publisher's request, their name has been removed in some passages. More information is available on this project's attribution page (http://2012books.lardbucket.org/attribution.html?utm_source=header) . For more information on the source of this book, or why it is available for free, please see the project's home page (http://2012books.lardbucket.org/) . You can browse or download additional books there. i
Transcript of This is “Buildings”, chapter 7 from the...

This is “Buildings”, chapter 7 from the book Entrepreneurship and Sustainability (index.html) (v. 1.0).
This book is licensed under a Creative Commons by-nc-sa 3.0 (http://creativecommons.org/licenses/by-nc-sa/3.0/) license. See the license for more details, but that basically means you can share this book as long as youcredit the author (but see below), don't make money from it, and do make it available to everyone else under thesame terms.
This content was accessible as of December 29, 2012, and it was downloaded then by Andy Schmitz(http://lardbucket.org) in an effort to preserve the availability of this book.
Normally, the author and publisher would be credited here. However, the publisher has asked for the customaryCreative Commons attribution to the original publisher, authors, title, and book URI to be removed. Additionally,per the publisher's request, their name has been removed in some passages. More information is available on thisproject's attribution page (http://2012books.lardbucket.org/attribution.html?utm_source=header).
For more information on the source of this book, or why it is available for free, please see the project's home page(http://2012books.lardbucket.org/). You can browse or download additional books there.
i
www.princexml.com
Prince - Non-commercial License
This document was created with Prince, a great way of getting web content onto paper.

Chapter 7
Buildings
Buildings represent significant opportunities to reduce adverse environmentalimpacts and provide healthier work and living spaces through new design andrenovation. Building construction is the largest sector of US manufacturing. Theindustry consumes approximately 40 percent of all energy, 72 percent of electricity,and releases around 28 percent of all greenhouse gas emissions. Typicallyoverlooked are buildings’ additional water consumption and landfill wastegenerated during construction and renovation activity. Given the high proportionof time—estimated to be 90 percent—people spend indoors, materials and energychoices for buildings are tied closely to health and productivity. There are manyways innovative sustainability practices can target building design and interiorfurnishings to make positive changes. In fact, the building sector presents some ofthe most accessible opportunities to develop innovative strategies for increasingprofits and addressing environmental and related community quality-of-lifeconcerns.
In this chapter we look at building industry issues from three different standpoints.The Project Frog case illustrates the benefits and challenges facing a new companythat offers state-of-the-art building design using optimally clean and efficientenergy design and materials. Initially targeting the education market to help reducethe number of students housed in temporary trailer classrooms, Project Frog offersa dramatically more energy efficient and healthier alternative to school districtsthat need to expand classroom space. This chapter also provides backgroundinformation on LEED, the US Green Building Council’s standards for Leadership inEnergy and Environmental Design. The LEED discussion is followed by ahypothetical, but nonetheless realistic, case called Greening Facilities: HermesMicrotech Inc. that provides insight into building design decision-makingprocesses. The background note subsequent to the Hermes case is titled“Environment, Entrepreneurship, and Innovation: Systems Efficiency Strategies forIndustrial and Commercial Facilities” and offers additional information about whybuilding redesign can be very challenging unless systems thinking is applied. Thechapter ends with a case on Shaw Industries, a company that addresses buildinginterior furnishing choices through innovative redesign of carpeting systems.
406

7.1 Project Frog: Sustainability and Innovation in Building Design
LEARNING OBJECTIVES
1. Evaluate opportunities and challenges for sustainability innovationwithin the modular building market.
2. Analyze the value of collaborations for innovation.3. Examine the stages of growth for a start-up firm active in the
sustainability space.
Introduction
Project Frog was an innovative designer of kits to rapidly build energy-efficient,greener, healthier, and affordable buildings. The company was transitioning fromstart-up to the next phase of growth just as the 2008–10 economic recessionbrought virtually all new building construction to a halt across the United States.Conditions forced the company to rethink strategy, conserve cash, and furtherrefine its product and its processes. The company’s Crissy Field project, completedin early 2010, provided a critically important demonstration of the company’sdesigns, and as the economy began to turn around in 2010, geographic expansionand new markets segments—possibly government, retail, and health care—wereplanned. Architect, designer, and founder Mark Miller; president Adam Tibbs; andnew CEO Ann Hand also hoped to meet more aggressive margin targets that wouldenable the company to triple revenue and be profitable early in 2011, only fiveyears after start-up. Venture capital1 funding from RockPort Capital Partners andinvestor exit expectations required rapid ramping up of projects in the short run.Miller summarized the overlap of Project Frog’s products and lead venture capitalinvestor’s interests: “Their vision for energy and resource efficiency and innovativeproducts is perfectly aligned with the Project Frog approach: to be better, greener,faster and cheaper.”Project FROG, “Project FROG, Makers of Smart BuildingSystems, Closes Series B Funding with RockPort Capital Partners,” news release,Business Wire, November 19, 2008, accessed January 28, 2011,http://www.thefreelibrary.com/Project+,+Makers+of+Smart+Building+Systems,+Closes+Series+B...-a0189242085.
In late spring 2010, having just moved from an operating role to a board position,Miller was focused on strategic concerns and how best to explain and sell hisproduct to a broader range of buyers, including the military and potentiallydisaster-relief agencies. The Project Frog office, a short walk from San Francisco’sEmbarcadero district, was informal and open. Although Miller occupied the only
1. Money provided to start-ups,often at high risk but with thepossibility of high returns, inorder for those companies togrow and bring new productsto market.
Chapter 7 Buildings
407
office with a door, it was bounded by two glass walls and a clear acrylic panel heused as a whiteboard. He could often be found crisscrossing the office or standing atsomeone’s workstation or at the table where Tibbs sat. Meanwhile, new CEO AnnHand had set up her computer, sharing the long table with Tibbs. She sought totranslate her experience at BP as senior vice president of global marketing andinnovation into a strategy for Project Frog to build its brand and scale up. Thesenior team saw huge potential in Project Frog, but they had many decisions tomake and priorities to set. Most important, they wanted to ensure Project Frog metkey business goals as they focused on preparing to give the venture capitalinvestors a successful exit in just a few years, either taking the company public orfinding a buyer.
History
Mark Miller was no stranger to new design and enterprises in architecture. Hegraduated from Haverford College in 1984 and earned his master’s in architectureand a prestigious Keasbey Fellowship at Cambridge University. He went to KualaLumpur as a Henry Luce Scholar, helping design refugee camps among otherprojects and deepening his strong interest in the relationship between culture andarchitecture. He also was certified by the American Institute of Architects. Millerlater served as director of corporate and technology projects and director of theAsia Projects Group for the firm Kaplan McLaughlin Diaz in San Francisco, where hisportfolio included Euro Disney. In 2000, he used $50,000 in personal savings to startMKThink, a design and architecture firm in San Francisco focused on innovativearchitectural design. Staff that included anthropologists conducted careful humanbehavior research to understand what people in work spaces truly need for highproductivity and high performance. MKThink designed advanced offices andcampuses for Sun Microsystems and General Electric’s Warren Tech Center inMichigan and worked extensively with Stanford University on several projects,including a dozen at the law school, work for the education and engineeringschools, and the business school’s relocation analysis.
Around 2000, Miller began to think seriously about the education market andtemporary or portable classrooms, the trailers that frequently begin as stopgapsand become permanent features of many schools despite their unhealthy interiorenvironments and energy inefficiency. Miller said, “Design should speak to theissues of the day, and technology needs to enable the human condition, notdominate it. So what are the issues of today? Well, we’ve got a problem: 35% of thekids in the state of California go to school in out-of-date trailers. That’s an issue ofthe day. It’s how do you educate kids in public schools and what are their facilitieslike in solving that systematically? We have the technology, we have theknowledge. We can solve this.”Andrea Larson and Mark Meier, Project FROG:Sustainability and Innovation in Building Design, UVA-ENT-0158 (Charlottesville:
Chapter 7 Buildings
7.1 Project Frog: Sustainability and Innovation in Building Design 408

Darden Business Publishing, University of Virginia, 2010). Other quotations in thissection, unless otherwise noted, also refer to this case study.
Solutions oriented, Miller saw an opportunity to meet the challenge. Whilerelatively cheap, how well did existing buildings address how students learn andwhat teachers need to be high-performing instructors? How could technology anddesign come together to create healthier schools while addressing the desperateneed for more classrooms as well as rising and more volatile energy costs? Whyaccept existing answers? Smart buildings were emerging as alternatives. Estimateswere that school overcrowding and insufficient tax revenues to government to payfor new school facilities would continue to force public school students into trailerclassrooms, and this was not just California’s problem.
MKThink had always had a research component that enabled it to considerproblems in its field, write half a dozen white papers a year, and present atconferences. By 2004, that research focused on the problem of unhealthy learningenvironments for children’s education. After all, 60 percent of the firm’s work wasrelated to education. The group knew it had a solution, but not yet a new company,when it devised the basic idea for modular buildings that would be better places forkids to learn and more energy efficient. “I’m making a product that makes a systemthat becomes a kit. You could call it Lego and Tinker Toys on steroids,” Miller said.Witnessing the devastation and aftermath of the 2004 Indonesian tsunami andHurricane Katrina in 2005 in the United States confirmed for Miller that betterbuildings also needed to be constructed quickly. “That was the birth ofFrog”—Flexible Response to Ongoing Growth—Miller told GreenerBuildings magazine.“Frogs are green. They only jump forward and—one of my favorites—each frog is aprince with the message, ‘Do not be afraid of what’s not familiar.’ Because if youembrace it, it is a prince.”Leslie Gueverra, “Project FROG Becomes a Cinderella Storyfor Modular Construction,” GreenerBuildings, November 25, 2008, accessed January28, 2011, http://www.greenbiz.com/news/2008/11/25/project-frog-becomes-cinderella -story-modular-construction.
By late 2005, Miller had decided to form a new company with two MKThinkpartners and two others, an industrial designer and a metal fabricator with a strongrecord of working well together. Together with angel investors, family and friendsinitially contributed $1.2 million to launch Project Frog in 2006. Their drivingmantra was “better, greener, faster, cheaper.” Their mission was to “provide globalimpact and market leadership in green building products and systems.” Milleremphasized what Project Frog was not: “We are not a construction company. Weare not about better trailers.”
Chapter 7 Buildings
7.1 Project Frog: Sustainability and Innovation in Building Design 409

The metal fabricator, Bakir Begovic, became board vice chairman for Project Frog.He received his BS in mechanical, industrial, and manufacturing engineering fromCalifornia Polytechnic State University in 1996. He had previous experience invarious high-tech firms. Begovic was founding principal of B&H Engineering, asemiconductor manufacturing and technology firm with an emphasis on metalfabrication, manufacture, and assembly. He was also chair of the board of directorsfor Acteron, a coating company.
Indeed, Project Frog needed such architectural and high-tech manufacturingexpertise because it hoped to combine and optimize the best of modular andtraditional construction—cheap and mass-manufactured and also energy efficientand conducive to occupant comfort and productivity. To achieve all these results,Project Frog needed to innovate. Since 1947, productivity in manufacturing in theUnited States had increased sevenfold. In construction, in contrast, productivityhad actually declined slightly. If Project Frog could harness the efficiency ofmanufacturing and bring it into the field of construction, the company couldradically outperform the industry, which was used to margins of only a few percent.Instead of conceiving of a classroom as the culmination of a long, uniqueconstruction process involving myriad players, Miller conceived of it as a“technology-infused product,” likening it to an iPhone, that could be producedfrom standardized parts and plans on a large scale in a variety of locations. ProjectFrog would thereby consolidate many tasks that were normally parceled amongarchitects, engineers, and contractors, making the process more efficient and hencecheaper for the consumer and more profitable for Project Frog. In some sense,buying a Project Frog building was like purchasing a PC kit or an IKEA bookshelf: alot of thought went into designing and configuring the components, but it was up tothe end user to assemble them or hire someone who could.
The company’s buildings, erected from standardized kits it designed andcontractors assembled, would require less energy and materials to build and tooperate. They offered spacious layouts designed to aid user productivity, health,and comfort. Units offered abundant natural light, state-of-the-art clean airsystems, high-performance heating, ventilation, and air-conditioning (HVAC)systems, customized microclimate controls, and excellent acoustic performance.They also could be built faster because they did not require a new architecturaldesign, engineering analysis, lengthy approval processes each time, nor did theyrequire as much work and coordination of supplies from contractors. Project Frogmodules also used recycled material, from steel beams to carpets and tiles, andwere designed to support green “living” roofs and solar panels. Finally, moreefficient design meant fewer machines and less labor were needed to assemble abuilding with fewer materials wasted. The net impact could be significant: eventhough construction was about 5 percent of the US economy, buildings accountedfor about 40 percent of energy use and produced about two-thirds of landfill waste.
Chapter 7 Buildings
7.1 Project Frog: Sustainability and Innovation in Building Design 410
Sophisticated design and modeling software enabled this reconceptualization fromconstruction process to manufactured product. Project Frog’s engineeringdesigners began with SolidWorks, software used to design products as diverse asairplanes and cell phones. The designers infused into their plans and predictiveperformance models data about the actual environmental performance of buildingmaterials—data that were regularly updated with measurements from newbuildings. This design and analysis became the core of Project Frog’s competenceand intellectual property, which was the subject of several patent applications. Thecompany also consulted Loisos+Ubbelohde, based in nearby Alameda, California, tohelp develop the energy modeling for its initial Project Frog kit system. That energyfirm had previously worked on the Gap’s headquarters in New York and Apple’sFifth Avenue store.Sarah Rich, “Project Frog’s 21st-Century Buildings,” Dwell, April1, 2009, accessed January 30, 2011, http://www.dwell.com/articles/project-frogs-21st-century -buildings.html. George Loisos and Susan Ubbelohde haddirected significant government and university research programs on buildingenergy use and efficiency, and their collaboration was a significant addition to theFrog design team.
Better control of manufacturing allowed Project Frog to use a set of basic parts withminor modifications to produce an array of products. Project Frog chose, however,to outsource the actual fabrication to others instead of having to build its owncapacity. Project Frog sought partners to supply the steel structure, glass panels,curtain walls, ceilings, and finishing, such as external siding or carpets. A reporterfor Forbes magazine described the result: “They snap together for a not bad look, asif a bunch of Swedish designers got hold of a really big Erector set.”Quentin Hardy,“Ideas Worth Millions,” Forbes, January 29, 2009, accessed January 30, 2011,http://www.forbes.com/2009/01/29/innovations-venture-capital-technology_0129_innovations.html.
Miller chose to focus on the educational market in the early days of the company.Education is the largest segment of the $400 billion construction market,accounting for about one-fourth of both the traditional and modular market.Furthermore, few people are involved in making the decisions relative to the size ofthe project, schools generally desire to go green and efficient, and they don’t have alot of money but often need buildings quickly. Educational institutions have longneeded to add or subtract space rapidly as schools and communities change.California had issued bonds at various times since 2002 to raise money to constructnew schools to keep pace with its population. Compounding that growth, Californiawas trying to reduce its average class size, requiring even more space. Hence whenfunding was available, construction could easily fall behind demand. Miller hadseen Frog’s previous portable, temporary choices.
Chapter 7 Buildings
7.1 Project Frog: Sustainability and Innovation in Building Design 411

Schools would also save time on design because they would choose from a limitednumber of prefabricated choices and configure and combine them as needed.Project Frog’s designs were precertified in California by the Division of the StateArchitect, saving about six months on permitting individual projects. (The Divisionof the State Architect oversaw the design and construction of K−12 schools andcommunity colleges and also developed and maintained building codes.) The StateAllocation Board Office of Public School Construction noted that it took two to fouryears to design, build, and inhabit an average school for two thousand students,while portable classrooms took nine to fifteen months to plan and inhabit. Finally,students learned better when indoor air and light quality were better, thus schoolshad often been proponents of green construction.
Studies from 1999 through 2006 provided evidence of the link between green designand student performance. Window area correlated with improvement in math andreading, better air reduced asthma and other ailments that affected attendance, andimproved temperature control increased the ability of students and teachers toconcentrate. Meanwhile, money saved from operating more efficient buildingscould be used to educate students. Project Frog thus used passive design, largewindows and coatings, and other methods to improve learning and cut costs.California had strict energy-efficiency standards under Title 24, and the statespecifically allotted $100 million in 2009 for High Performance Incentive grants toimprove energy efficiency or maximize daylight in K−12 schools.
That grant, however, was still in the future when Project Frog began with two pilotprojects in California, a preschool and racing school. The results pleased customers,but Project Frog was not making enough money from them. The company received$2.2 million from angel investors in 2007 and had revenue around $3.7 million withsixteen full-time employees. However, it was burning about $300,000 per month andhad missed project completion deadlines. Nonetheless, in 2008 Miller projected togenerate over $50 million in revenue by 2010. Then portents of a recession began toappear.
Completed Projects as of Spring 2010
Project Frog gained momentum with a number of projects (see Note 7.3 "ProjectExamples"). The following are the most notable ones:
• Child Development Center at City College San Francisco, 2007.Constructed 9,400 square feet of space for children, teachers, andadministrators.
Chapter 7 Buildings
7.1 Project Frog: Sustainability and Innovation in Building Design 412

• Jim Russell Racing Drivers School Learning and TechnologyCenter, Sonoma, California, 2007. Constructed 14,000 square feet ofclassroom and meeting space.
• Greenbuild Conference Boston, 2008. Constructed and unveiled the1,280-square-foot Frog 2.0 in one week.
• Jacoby Creek Charter School, Bayside, California, 2009. Replaced aNorthern California school’s trailers with Frog classrooms, paid for bya state grant.
• Vaughn Next Century Learning Center, Los Angeles, 2010. Built a3,000-square-foot structure for the charter school’s InfrastructureCareer Academy, designed to train students in green-collar jobs.
• Crissy Field Center, San Francisco, 2010. Built Golden Gate NationalPark a 7,400-square-foot education center to Leadership in Energy andEnvironmental Design (LEED) Gold standards, including classrooms,offices, and a café.
• Watkinson School, classrooms for Global Studies Program,Connecticut, 2010. Built 3,800 square feet of Frog Zero classroom andlab space.
Chapter 7 Buildings
7.1 Project Frog: Sustainability and Innovation in Building Design 413

Project Examples
Figure 7.1Project Frog Modules Linked to Make the Child Development Center, City College of San Francisco
Figure 7.2Interior of Project Frog Demonstration Classroom
Source: Project Frog.
Chapter 7 Buildings
7.1 Project Frog: Sustainability and Innovation in Building Design 414
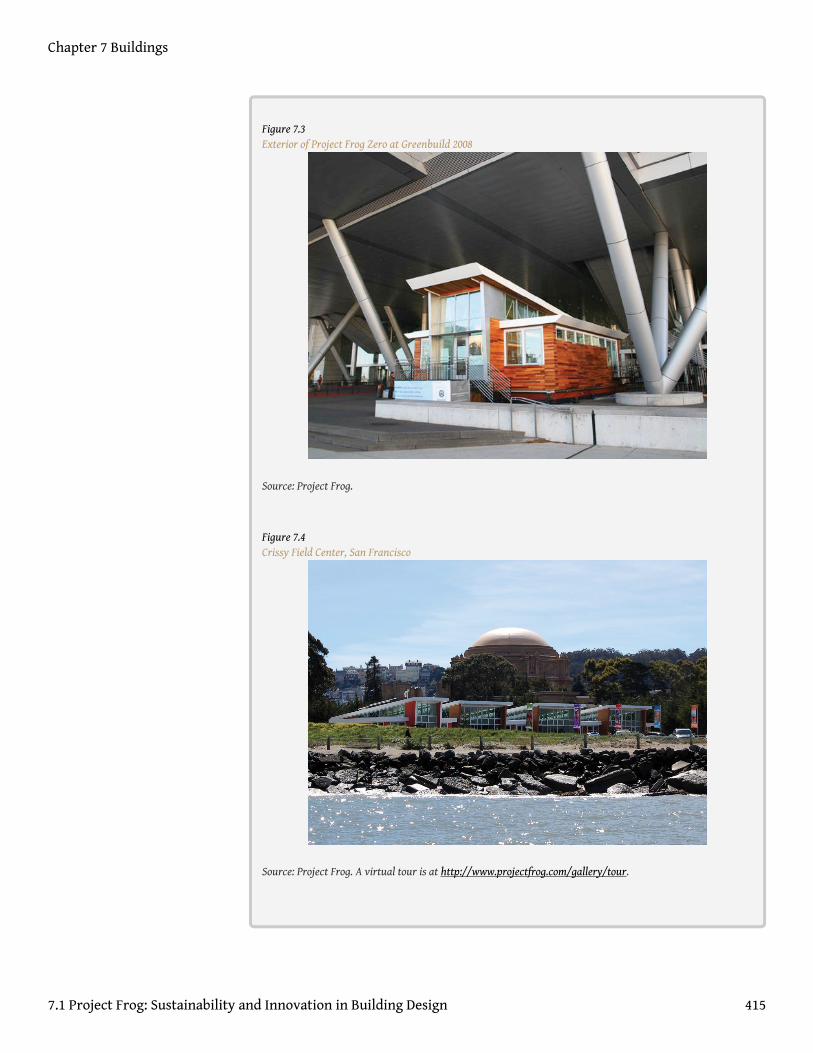
Figure 7.3Exterior of Project Frog Zero at Greenbuild 2008
Source: Project Frog.
Figure 7.4Crissy Field Center, San Francisco
Source: Project Frog. A virtual tour is at http://www.projectfrog.com/gallery/tour.
Chapter 7 Buildings
7.1 Project Frog: Sustainability and Innovation in Building Design 415
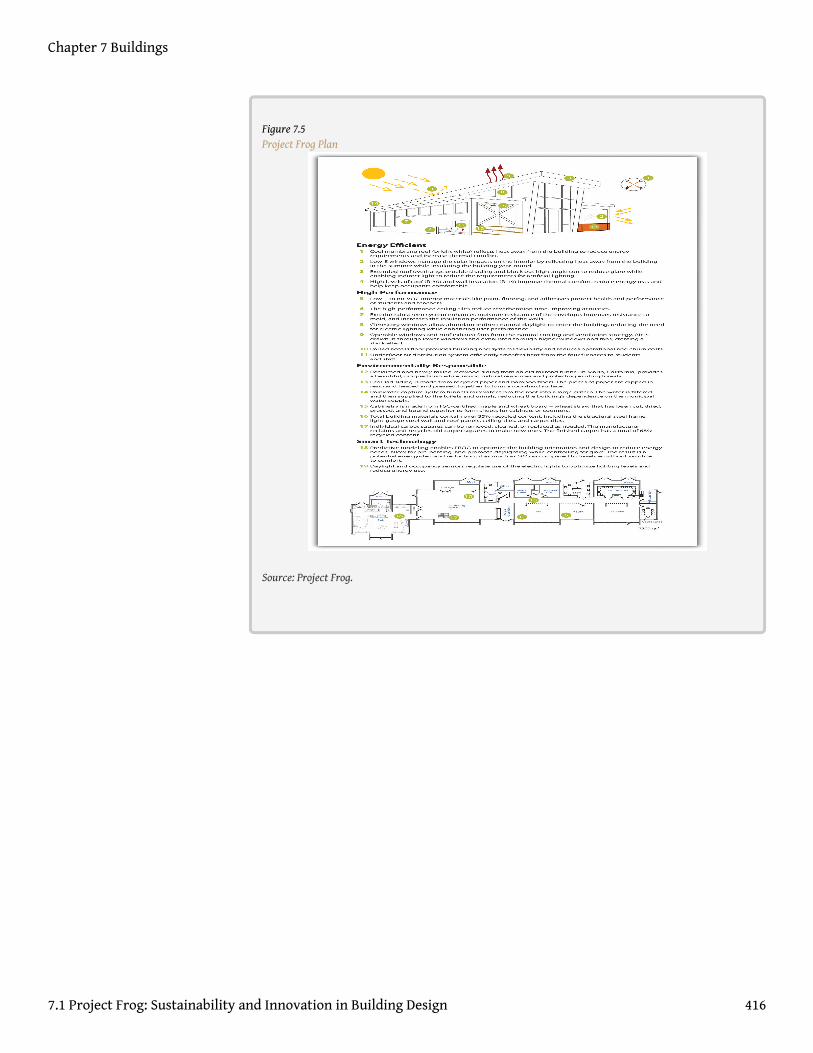
Figure 7.5Project Frog Plan
Source: Project Frog.
Chapter 7 Buildings
7.1 Project Frog: Sustainability and Innovation in Building Design 416

Figure 7.6Diagram of Project Frog Office
Customers were pleased with the buildings’ performance. Project Frog’s purchaseprice was 25–40 percent lower than traditional construction. Operating costs couldbe as much as 50–70 percent lower than conventional or trailer construction. Thenew Frog Zero units could claim 75 percent energy demand reduction through useof occupancy and daylight sensors, smart wall panels that absorbed and reflectedlight, natural light optimization, glare control, superior air quality, microclimatecustomization through advanced climate control technology, and enhancedacoustics. Carpeting and interiors were screened for toxicity. Conventionalportables typically were equipped with pressed-wood furniture, vinyl walls, andnew paint and carpet; these alternatives were superior to standard options, whichcould release invisible toxic gases known as volatile organic compounds (VOCs). Themost advanced line, the Frog Zero buildings, produced more energy than they usedand were energy neutral. Built from renewable or recyclable materials, the unitscould be disassembled easily and were designed with 100 percent recyclabilitypotential.
Chapter 7 Buildings
7.1 Project Frog: Sustainability and Innovation in Building Design 417

However, the major appeal of any unconventional classroom construction wastypically price. Project Frog’s California prices were between prices for traditionalconstruction and portable or trailer classrooms. In California, laws had actuallymandated that 30 percent of new classroom construction be portables, to avoidoverbuilding classrooms that would become vacant when birth rates declined. Butsome school districts facing unexpected and shifting population demographicsfound themselves housing 50 percent of their students in portables that rangedfrom relatively new to over forty years old. In Florida, 75 percent of portables thatwere intended as temporary structures were later classified as “permanent”classroom spaces. Estimates for 2009 placed six million students in portableclassrooms. In 2003, it was estimated 220,000 portable classrooms served publicschool systems nationwide. Perception of lower quality was often justified;portables were poorly suited to music and language learning and they had heatingand cooling inefficiencies, absence of natural light, and poor air quality, all of whichundermined performance of students and teachers.
The Industry
As of June 2009, all but seven states had some kind of energy-efficiencyrequirements for government buildings.Pew Center on Global Climate Change,“Building Standards for State Buildings,” June 16, 2009, accessed January 30, 2011,http://www.pewclimate.org/what_s_being_done/in_the_states/leed_state_buildings.cfm. About half those states required LEED Basic or equivalentcertification specifically, and increasingly, states such as California andmunicipalities such as Boston and San Francisco required any large newconstruction or renovation to meet green building standards. LEED, created by theUS Green Building Council (USGBC), was widely used to measure building efficiencyand environmental impact and came in various levels, from Basic to Platinum.Other rating systems existed, especially as LEED Basic came to be considered too laxor inappropriate for homes or other structures, but LEED continued to be theindustry norm. Buildings earned points toward certification based on site selectionand design, environmental performance, and other attributes. The US GeneralServices Administration (GSA), which oversaw many federal properties andpurchases, began requiring LEED Silver certification in 2009. A study by McGraw-Hill Construction calculated the size of the green building market to be $10 billionin 2005 and $42 billion in 2009, and it estimated the market would be worthbetween $96 billion and $140 billion by 2013, with the education sector accountingfor 15–30 percent of that market.McGraw-Hill Construction, 2009 Green Outlook:Trends Driving Change, accessed January 26, 2011, http://construction.com/market_research/reports/GreenOutlook.asp.
Meeting those standards and the needs of the client, however, traditionallyinvolved an array of people. Architects devised plans and construction engineers
Chapter 7 Buildings
7.1 Project Frog: Sustainability and Innovation in Building Design 418
decided how to implement them safely. Government agencies had to approve thoseplans, and then an array of craftspeople—masons, carpenters, electricians, glaziers,and so on—were marshaled by a general contractor to execute the plans. Each newparticipant took a slice of the profit and decreased efficiency by not having aninfluence on the end-to-end life-cycle design but only on one small piece.Furthermore, involving more people increased the chance for delay and costoverruns, and the longer a project continued, the more likely weather or supplydisruptions could slow it further. A single building could take years to plan andbuild. Hence construction typically had low margins and was unattractive toventure capitalists.
Indeed, when Project Frog sought investors, it found itself being compared to steelmanufacturers. Investors had no idea how to value the company accurately: itwasn’t traditional construction, nor was it traditional manufacturing. Project Frogcombined many of the previously disparate aspects of construction in itspredesigned, preapproved kit, which sped construction and limited the number ofpeople involved, including distinct craft unions that would fight for their shares ofthe project. That increased the company’s profit while decreasing cost to clients.Miller encountered one other problem he didn’t anticipate: Project Frog was toofast. Schools typically forecast building new classrooms five to ten years out andhad correspondingly sluggish procurement processes. Consequently, schools had ahard time determining how to buy something that could be standing and in use sixmonths later.
Changes and Challenges
Project Frog president Adam Tibbs had shown a proclivity for entrepreneurialinitiatives early, having started and sold a lawn-mowing company as a kid beforeearning his bachelor of arts in English from Columbia University in 1995. He workedas an editorial assistant for the Columbia University Press, where he gravitatedtoward digital publications, and then joined Nicholson NY, an Internet and softwareconsulting company, where he managed major projects from 1996 to 1998. In 1999he founded Bluetip, a software development and incubator company. Bluetip spunoff and sold several companies before Tibbs entered real estate development in NewYork and the Virgin Islands. He bought a house in the country and set out to write anovel. He also consulted for nonprofits and often borrowed Miller’s office when hecame to San Francisco, where his friend and eventual wife worked at MKThink.Eventually he went to work for Project Frog, where he arrived as president in June2007.
In 2008 Project Frog began to redesign its base module and reorganize its businessprocesses. Tibbs noticed that the original Project Frog designs were simplyoverbuilt; the same result could be achieved with less material and less design time.
Chapter 7 Buildings
7.1 Project Frog: Sustainability and Innovation in Building Design 419
Tibbs was quick to note, “If you remove green from the table, the way we do thingsis still better. The innovation is business processes in an industry that doesn’t haveany business processes.” Looking back, Tibbs recalled, “We stopped selling andredesigned from the ground up. We tried to bring intelligence in-house and keep itthere.” The international law firm Wilson Sonsini Goodrich & Rosati was brought into “clean up” the company’s procedures and documentation.
Meanwhile, Miller and his team examined their previous projects and relied oninput from their own green material researchers as well as suppliers, especiallysteel manufacturer Tom Ahlborn, about how to improve environmentalperformance and efficiency. Ahlborn was based in California. He made the frame forthe modules and also assembled them on-site. Hence his experience allowedengineers to make improvements along the entire life cycle of the project. Aftereighteen months of design, the 1,280-square-foot Frog 2.0 was unveiled at theGreenbuild Conference in Boston, where contractor Fisher Development Inc.assembled the demo module in only seven days to allay fears that Project Frogwould miss deadlines again. The new design also earned California’s Division ofState Architect (DSA) precertification and an award from the Modular BuildingInstitute. The new Frog 2.0 was anticipated to be 25–40 percent cheaper to build and50–75 percent cheaper to operate, which meant it was baseline LEED Silver andcould potentially be energy neutral when outfitted with photovoltaic panels (part ofthe Frog Zero option.) The components were recyclable or compostable andengineered for seismic design category E (which included San Francisco; the highestcategory was F.) Moreover, the building could withstand 110-mile-per-hour windsand be assembled in one-half to one-fifth the time of a traditional building. Sincethe basic plans had to be approved by engineering and architecture firms in fiftystates, Frog 2.0 also streamlined documentation and certification.
On the financial side, the Wilson Sonsini law firm introduced Project Frog to a fewventure capital companies. A deal for $8 million in Series B funding closed inNovember 2008. A partner from the venture capital fund joined Project Frog’s boardof directors. The partner said of the new partnership, “This is a truly pioneeringcompany. Project FROG is developing dynamic concepts from a product design andmanufacturing platform and applying those innovations to the building industry.Project FROG has a critical grasp on the technical and market advancements thatwill be game changers in the green building industry. These attributes solidifyProject FROG’s position as a leader in this fast growing marketplace.”RockportCapital, “Project FROG Closes $8MM Series B Financing Led by RockPort CapitalPartners,” press release, November 19, 2008, accessed January 30, 2011,http://www.rockportcap.com/press-releases/project-frog-closes-8mm-series-b-financing-led-by-rockport-capital-partners.
Chapter 7 Buildings
7.1 Project Frog: Sustainability and Innovation in Building Design 420

Though still $4 million short of its goal, Project Frog kept costs low and in 2010raised an additional $5.2 million through debt financing and promissorynotes.Project FROG, “Project FROG, Makers of Smart Building Systems, Closes SeriesB Funding with RockPort Capital Partners,” news release, Business Wire, November19, 2008, accessed January 30, 2011, http://www.reuters.com/article/2008/11/19/idUS111863+19-Nov-2008+BW20081119. In 2008, Project Frog won the CrunchiesAward for Best Clean Tech company, given for compelling start-ups and Internet ortechnology innovation. Things continued to look up for the company when theOffice of Naval Research asked the venture capital community about greenbuildings. The military was particularly interested in energy efficiency after payingexorbitant sums to keep fuel on the front lines in Iraq and Afghanistan. It hadbegun to see energy efficiency as a national security issue and sustainability(making sure the military had a positive footprint in terms of community,ecological, and health impacts of its operations) as key to continuing to operatebases in communities around the world. The investors recommended Project Frog,which eventually began work with the Navy on projects in Hawaii.
Even as Project Frog continually strove to distinguish itself from traditional trailermanufacturers, competition emerged from other modular groups. Miller believedthat modular offerings sacrificed quality and green features. Nonetheless, theyremained attractive to some clients such as cash-strapped schools.
New Hire, Next Steps, and Exit Strategy
Project Frog needed a way to stay ahead of the competition. Its improved Frog 2.0certainly would help, and Frog Zero was the first energy-neutral building of itskind; streamlining business practices was now a priority. Project Frog turned to itssupply chain to boost efficiency and profit.
Ash Notaney had worked with Booz Allen on strategy and supply-chain issues fortwelve years. Through a mutual friend, he met Adam Tibbs and began to offeradvice to the company about supply-chain management. In January 2010, he washired. He noticed right away that people at Project Frog talked to one another;meetings were rare, which kept people available at their desks for interaction; thehierarchy was flat; and there were no corporate silos. “I don’t think we even had anorganizational chart until one of the investors asked to see one,” Notaneyrecalled.Andrea Larson and Mark Meier, Project FROG: Sustainability and Innovation inBuilding Design, UVA-ENT-0158 (Charlottesville: Darden Business Publishing,University of Virginia, 2010). Other quotations in this section, unless otherwisenoted, also refer to this case study. The spirit of collaboration was reflected in theoffice space: there were no cubicles, just tables where people worked side by side.Notaney literally sat with marketing to one side and the president to the other.Exposed HVAC conduits and hanging lights marked the building for what it was: a
Chapter 7 Buildings
7.1 Project Frog: Sustainability and Innovation in Building Design 421

renovated roundhouse for streetcars that used to run along the Embarcadero.About two dozen employees were at work in the office on a given day, and probablytwo-thirds were under thirty years old. Clear plastic bins held sample materialsfrom Project Frog buildings: exterior siding, interior wall, flooring, even bolts.Engineers continually manipulated plans on their SolidWorks screens.
Notaney began working with suppliers to collaborate more with Project Frog. TheCrissy Field, Vaughan, and Jacoby projects used the same company to manufactureand assemble most of the kit. That company was Ahlborn Structural Steel. TomAhlborn, in particular, had been an excellent partner, continuing to suggest ways toimprove the steel manufacture and assembly. Project Frog in return helped him cutcosts and shared projected sales and volume of purchases over the coming yearwith increasingly detailed projections for closer time periods. Ahlborn became thepreferred vendor for steel in any project unless contract stipulations or geographymade it impossible. The company also used the same construction firm, FisherDevelopment Inc., for three of its installations. Fisher was based in San Franciscobut worked nationally as a general contractor and construction manager. Thecompany had worked with clients such as Williams-Sonoma and Hugo Boss and hadassembled Project Frog’s demonstration module at the Greenbuild Conference.Fisher had also worked on the Watkinson School in Connecticut. Although no singleProject Frog building gave Fisher much money, he appreciated that constructionwas predictable and short, which allowed him to finish a project at a profit andmove on. Moreover, he believed Project Frog was ripe to expand into marketsbeyond education and consequently all the small buildings would begin to add up.
Meanwhile, Project Frog worked with YKK and its partner Erie ArchitecturalProducts to procure exterior glass panels and curtain walls. The new glass panelscould be installed legally and technically by steel unions, which meant ProjectFrog’s contractors no longer needed to have glaziers on-site. The panels could alsobe modified for optimal performance in different environmental conditions. Roofpanel suppliers were also involved, but to date the most effective relationships hadbeen with Ahlborn and Fisher. Notaney was working to develop strategicpartnerships with other suppliers.
The relationship with Fisher made sense for Tibbs as well. “We pick a guy we trustto fulfill our brand promise and make it a pleasurable experience,” he said. After all,the company wanted to meet aggressive targets for margins and revenue. Thecompany needed to sell the value of the learning experience its buildings created.Further, Tibbs wanted the company to grow not just by getting more deals in moremarkets but by keeping more of the money for Project Frog from each deal byintegrating more features into its own manufactured kit. A switch to ceilings thatintegrated insulation and panels as well as the structural frame moved the companyfurther along that path.
Chapter 7 Buildings
7.1 Project Frog: Sustainability and Innovation in Building Design 422

Tibbs continued to push for automating more of the design, improving algorithms,filing patents, and infringing on the company’s earlier patents. He brought in GTCLaw Group of Boston for patent advice. Tibbs wanted a way for clients to selectfeatures through online models and see the corresponding performancecharacteristics of the different designs. Once a plan was chosen, the computer couldconfirm the design, print a plan for the architect, and print any necessary partsdesigns and orders for suppliers.
In 2010, Project Frog raised an additional $5.2 million through convertible notes.That brought another venture capital director onto the company’s board. He joinedAnn Hand, who had a spot by virtue of being Project Frog’s CEO; Miller, who hadmoved out of daily operations not long after Hand had arrived; and the lead venturecapital partner from the B round. The fifth seat on the board, by charter designatedfor an independent member, remained vacant.
By summer of 2010, the market seemed to be improving, and Project Frog was ontrack to double its revenue that year. In fact, Project Frog was poised to flourish in amarket that had changed radically from 2007. Miller said, “We mitigate risk. Clientsare smarter and much more rigorous about goals and timeframes. Everyone wantsto do green. That’s changed. It has to be green, and it has to be cost-effective. Theygo together. That’s just the way it is now.”
The Crissy Field Center in Golden Gate National Park attracted 1,500 people to itsgrand opening and made a strong impression on visitors. Hundreds of peoplebecame Facebook fans of Project Frog. Guided tours of the center continued to drawmany visitors through spring 2010 as did the building’s café. Miller said with pride,“People walk into Crissy Field and say, ‘I want one of these.’ People don’t usuallybuy buildings that way.” But now with Project Frog, they could. In 2010 Project Froghad something very tangible and attractive to sell.
Miller continued to ponder how best to present his product. The company offered aunique synthesis of product and technology; sometimes he called it a product-oriented technology company. He liked the idea of portraying Project Frog as anintegrated space and energy package in one leased product rather than a buildingwith a mortgage that would also cut a client’s energy costs. Furthermore, if pricesreached the levels they had in 2007, breakeven could be cut in half. Miller wanted tounderline that in a way people could understand and incorporate into theiraccounting. He worried, however, that the company might default downward into aconventional construction company if it did not maintain its industry expertise andvision for innovation at the edge of the industry.
Chapter 7 Buildings
7.1 Project Frog: Sustainability and Innovation in Building Design 423
The decision about an exit strategy also remained. Project Frog could go public. Italso could court potential buyers. Yet many attitudes still reflected the confusionearly investors felt about Project Frog’s business. The venture capitalists struggledto find comps (comparable firms) to do the valuation. Various corporations withrelated business entities had expressed interest in investing in Project Frog. Eachsaw something it liked because the company integrated so many previously distinctbusinesses. Tibbs conjectured a global construction company or European modularbuilding maker could make a bid. “We have about a three-year expectation to exit,”Tibbs said. “I’m hoping to accelerate that.” The whiteboard behind him was coveredwith red marker goals and graphs for the coming years. “If things go according toplan, we should be profitable by Q1 next year. For me, going public would be morefun because I’ve never done that before.”
Project Frog and its venture capitalist investors appeared to share a businessphilosophy about green and what Mark Miller referred to as “edge of the gridenergy areas”—the overlooked but attractive opportunities for innovation now thatbusinesses and consumers were interested in saving energy and willing to invest intechnology controls. The buyer had to get over the conventional “first cost”mentality, however. The new approach required monetizing the life cycle of thesolution. It might mean taking facilities off the balance sheet.
Mark Miller was interested in these options, but his mind was focused on moreimmediate concerns:
We have to make sales and we have to execute. We have the product designed anddefined. Now we need revenue. We’re inventing a category though. The VCsunderstand that and they like us, but aren’t sure how to think about us. We wereone of the last VC deals done before the economy collapsed. And of course themarket stopped for us too. I mean schools have no money and states are basicallybailing out. And sales cycles are long because buyers have to be educated. We haveour work cut out for us.
Chapter 7 Buildings
7.1 Project Frog: Sustainability and Innovation in Building Design 424

Figure 7.7 Energy Consumption by Sector in the US Economy
Source: Energy Information Administration, Annual Energy Review 2010, http://www.eia.doe.gov/aer/txt/ptb0201a.html.
Chapter 7 Buildings
7.1 Project Frog: Sustainability and Innovation in Building Design 425

Award Criteria: City College of San Francisco, Child Development Center
Thermal Comfort Strategy
The units at CCSF strongly support thermal comfort, enhancing occupantproductivity and satisfaction. The number of operable windows for ventilationexceeds minimum requirements. The efficiency/quality of thermal comfortwith the Raised Floor System is superior to overhead or wall mounted, fandiffused systems in most modular units. Air is supplied by multiple floordiffusers, creating an upward flow of fresh air via natural convection andexhausted through ceiling return outlets, unlike overhead systems that mixcool and heated air near the ceiling, spending energy forcing it down to userzones. Cool air is supplied at higher temps/lower velocity than overheadsystems, reducing discomfort from high air speed/cold spots. Energy savingsare due to diffusers’ close proximity to occupants and user-defined location,direction, and flow; the living roof that supports consistent indoortemperatures; R-19 rigid expanded polystyrene (EPS) in the roof and the floor;and R-15 EPS in the walls.
Indoor Air Quality Strategy
The CCSF classrooms exemplify FROG’s effort to circumvent the healthproblems, low test scores and high absentee rates posed by indoor air pollution.We use Low/No VOC carpet tiles, ceiling tiles and interior paint. Sealants meet/exceed the requirements of the Bay Area Air Quality Management DistrictRegulation 8, Rule 51. Intersept antimicrobial preservative in the carpet tilescombats a broad spectrum of bacteria/fungi. BioBlock inhibits the spread ofmold/mildew on ceiling tiles. Under floor air distribution delivers outside airfrom below directly to the occupants’ breathing zone. New air replacescontaminated air instead of diluting it with old air, the method of mostportables. FROG units allow for up to 100% outside air, providing clean air tothe occupants, reducing any remaining VOCs/bacteria in occupied areas. Unlikemost portables’ fiberglass batt insulation, FROG’s Ultratouch cotton fiberinsulation resists microbial growth; doesn’t cause skin irritation;formaldehyde-free.
Daylighting Strategy
Chapter 7 Buildings
7.1 Project Frog: Sustainability and Innovation in Building Design 426

The FROG building’s integrated system of customizable window wall units,sunshades and clerestory windows allow the interiors of the CCSF classrooms tobe illuminated far more naturally and efficiently than any other modularclassroom. The customizable window wall system (85% of the exterior walls)consists of interchangeable window/wall panels of user-specified colors/materials. Each 2’× 4’ panel can be high performance glass or insulatedcomposite panel. Design customization allows a perfect balance between theneed for abundant light in some areas (i.e. play/learning rooms) and less inothers (i.e. nap areas), shadow reduction and/or heat gain. Sunshades aremounted to the south and west side of the curtain walls to protect eachclassroom from an excess of direct sunlight and reduce glare. A signaturefeature of FROG’s structure is the unique clerestory. Each unit’s sloped roofassembly is enveloped on three sides by clerestory windows that flood the unitwith natural light.
Acoustic Strategy
The acoustical ceiling panels used at CCSF contain a 70% Noise ReductionCoefficient (NRC). This reduces most echoing within the building, thusincreasing speech clarity. In addition to the R-19 roof insulation (with space foran additional R-19), the living roof reduces outside noise transmission. Theunder floor air distribution system implements a pressurized plenum andharnesses natural convection to assist the airflow out of the floor diffusers anddirectly into the occupied zone, eliminating the noisy ducts of traditionalportable models carrying air being pushed at high velocities. Most modularclassrooms use a wall-mounted HVAC system, resulting in high levels of noise.Project FROG eliminates this excess noise with its Powerpak, which places theHVAC system in an exterior room separated from the learning area by anauxiliary room or restroom and an extra thick wall filled with sound-attenuating insulation.
Energy-Efficiency Strategy
The FROG units at CCSF use high quality recycled/recyclable materials,including recyclable acoustic ceiling tiles (75% recycled content (RC)); raisedfloor tiles (33.9% RC:1.8% post consumer (PC)/22.1% post industrial(PI));Ultratouch batt insulation (85% PI recycled natural fibers). Carpet tiles (44% RC)and vinyl tiles (92% RC, 25% PC) can be replaced individually (instead of theentire floor) and reused. Most modular buildings consist of wood; all FROG units
Chapter 7 Buildings
7.1 Project Frog: Sustainability and Innovation in Building Design 427

are steel (up to 100% RC) which can always be recycled. Non-steel materials (i.e.wood) are field cut, creating excess waste; FROG parts are cut in a metal shopand all excess is recycled. The FROG units are designed for minimal sitedisruption. Each unit’s foundation takes up less than 1/2 of the overall sq.footage of the unit itself, requiring only 7.5 cu yards concrete. The living roofreduces rainwater runoff; serves as a protective layer, increasing the building’slifespan; and contributes to water/air purification.
Architectural Excellence
Customized and flexible, the new campus at CCSF is architecturally stylishinside and out. Exciting and expanding upward, the undulating roofline rises inthe middle and lowers at the sides to provide a dramatic expression. The grandcurved rear (which hides unsightly mechanical equipment) is trimmed withrounded edges to set a modern tone. The customized exterior earth tone colorswere chosen to blend with the surrounding neighborhood context. The windowwall system has interesting patterns of wall vs. window to create a uniqueexterior and functional interior. To foster creativity and encouragecollaboration, the interior is full of natural light with optimal acoustics andclear sight lines. The careful configuration and positioning of the units createsa comfortable and safe campus environment, and is truly beautiful from everyangle.
Economic Practicality
By using FROG units, CCSF realized significant economic savings that willmultiply over time. Due to grouping/orientation, the CCSF FROG units are morethan 30% more energy efficient than Title 24 requires. FROGS are built quicklyenabling buyers to save on construction escalation costs (up to 12% per year).Since FROG units are California DSA Pre-Certified buildings and can beapproved “over-the-counter”, the permit fees are lower than traditionalconstruction. FROG installation costs are lower than traditional constructionsince units can be installed on a variety of surfaces with minimal waste, sitepreparation, clean-up, and landscaping. FROG buildings will perform optimallyand inline with permanent structures. Costs associated with removal,demolition, and temporary building replacements are eliminated. The use ofsteel and glass eliminates roof/wall/flooring degradation for low long termcosts. FROG modular building requires less on-site skilled labor.
Chapter 7 Buildings
7.1 Project Frog: Sustainability and Innovation in Building Design 428

Other
Energy Efficiency: FROG succeeded in making CCSF the most energy efficient ofits kind. The raised floor system delivers air via floor diffusers directly to theoccupied zone, creating an upward flow of fresh air of natural convection. Byusing higher-temperature air for cooling, the system can utilize outside air fora longer period, thereby reducing HVAC energy consumption. The natural lightfrom the clerestory/window walls decrease the artificial light necessary forinternal illumination. The glass is Solarban70XL Solar Control Low-E and blocks63% of the direct solar heat, reducing the energy and costs of cooling, while stillhaving the benefits of natural light. The smart lighting system balances theamount of natural light with Daylight Sensors, allowing for less energy usageand lowers wasted energy with Occupancy Sensors. Photovoltaic panelsproduce energy onsite for the units use and distribute back to the city gridwhen not in use.Modular Business Institute, “City College of SanFrancisco—Child Development Center,” accessed January 30, 2011,http://www.modular.org/Awards/AwardEntryDetail.aspx?awardentryid=370.
Project Frog Wins 2008 Crunchies Award for “Best Clean Tech”
SAN FRANCISCO, Calif.—January 13, 2009—Project FROG, San Francisco-basedmanufacturer of LEED rated high performance building systems, is pleased toannounce it was honored on Friday with a 2008 Crunchies Award for “BestClean Tech” company. The Crunchies, co-hosted by GigaOm, VentureBeat,Silicon Valley Insider and TechCrunch, is an annual industry award thatrecognizes and celebrates the most compelling start-ups, internet andtechnology innovations of the year. “We were honored just to be included as afinalist, so we were surprised and thrilled to receive the award for Best CleanTech Company,” said Mark Miller, founder and CEO of Project FROG. “CleanTechnology is an emerging field with tremendous opportunity for innovation,and we have great need for creative entrepreneurs, venture capitalists andespecially prescient media such as the sponsors of the Crunchies. The otherfinalists are remarkable companies with important innovation and technology,and it’s a privilege to be recognized among them.” The awards were host tomore than 80 nominees across 16 categories, and winners included Facebook,GoodGuide, Amazon Web Services and Google Reader. Better Place was therunner-up in the Clean Tech category.
About Project FROG
Chapter 7 Buildings
7.1 Project Frog: Sustainability and Innovation in Building Design 429

Better, greener, faster, cheaper. Smart. Project Frog, Inc. is a venture-backedcompany founded in 2006 with the mission of designing and manufacturingsmart buildings—high-performance, green building systems that are healthy,quick to deploy, affordable, sustainable and permanent. The company’sleadership team comprises award-winning business professionals, engineers,architects as well as accomplished entrepreneurs and innovative builders. FROG(Flexible Response to Ongoing Growth) products are contemporary, highlyfunctional, energy efficient, quick-to-deploy and adaptable. The recipient ofnumerous industry awards, Project FROG is at the forefront of change for a newstandard in green building. For more information, visithttp://www.projectfrog.com.Cleantech PR Wire, “Project FROG Wins 2008Crunchies Award for ‘Best Clean Tech,’” press release, January 13, 2009,accessed March 7, 2011, http://www.ct-si.org/news/press/item.html?id=5279.
Project Frog Building Systems for the Future
I caught a small segment of an Anderson Cooper 360 show that highlighted thefirst energy-efficient building in New England. It’s also the only independentschool in Hartford Connecticut. Watkinson School—Center for Science andGlobal Studies is a Project Frog design. Project Frog’s website states it “makesthe most technologically advanced, energy-efficient building systems on theplanet. Employing innovative clean technology across the constructionspectrum.” I was impressed, but than [sic] again I’ve always been in the modern,contemporary mode, what is Project Frog’s style.
Watkinson School needed a new building and fast. So in keeping with the themeof science and global studies that surely covers global climate change, theschool went with Project Frog’s building plans/concepts, and 7 months later theschool was ready. It leaves no carbon footprint and cost far less to run than aconventional building.
Check out the segment I saw on CNN and Project Frog’s website for moreinformation. To me this looks like the way to go for charter Schools, new officebuildings, retail, and hopefully homes of the future. And the biggest news here,it’s cheaper than standard building structures. Project Frog’s website lists thequalities of its buildings:
Chapter 7 Buildings
7.1 Project Frog: Sustainability and Innovation in Building Design 430

Better
Healthier low VOC, high air quality, abundant daylight
Higher quality engineered, factory built, premium materials
Safer 2008 IBC, zone 4 seismic, 110+mph wind
Greener
Materials high recycled content
Operations 50–70% less consumption
Waste Reduction near zero on-site construction waste
Faster
Purchase single integrated point of purchase
Permit weeks not months
Build 5× faster than traditional construction
Cheaper
Purchase 25–40% less first cost
Operate 50–75% less operational cost
Recycle 100% recycle potential
I think we’re going to hear a whole lot more about Project Frog. Finally acompany that presents a win, win situation for new building construction. Ohforgot to include that local contractors put up the buildings too.
Other Stories
http://green.venturebeat.com/2010/01/19/project-frog-leaps-ahead-with-5-2m-for-greener-school-buildings
FOR IMMEDIATE RELEASE CONTACT: Nikki Tankursley (September 29, 2009)
Chapter 7 Buildings
7.1 Project Frog: Sustainability and Innovation in Building Design 431

415-814-8520“Project Frog Building Systems for the Future,” BlogsMonroe.com,March 23, 2010, accessed April 5, 2010, http://www.blogsmonroe.com/world/2010/03/project-frog-building-systems-for-the-future.
Ann Hand, New CEO at Project Frog
World-Class Green Energy Executive to Grow Markets and Scale Business forLeading Manufacturer of Smart Buildings
SAN FRANCISCO—(BUSINESS WIRE)—Project Frog(http://www.projectfrog.com), leading manufacturer of smart buildingsystems, announced today that Ann Hand has joined the company as ChiefExecutive Officer. She will provide strategic leadership as Project FROG seeks tocapitalize on the high growth market for green buildings with its innovativehigh performance building systems.
“I am delighted that Ann has decided to join the Project FROG team,” saidfounder Mark Miller. “I look forward to working closely with her to develop ournext generation of green building products and accelerate our growth. Ann hasa great track record of building scalable businesses with sustainability as acornerstone.”
Ann is a highly experienced executive within the clean energy sector and comesto Project FROG from BP where she was Senior Vice President of Global BrandMarketing and Innovation with responsibility for driving operationalperformance across 25,000 retail gas stations. Prior to that role, she was CEO ofBP’s Global Liquefied Petroleum Gas business unit and oversaw 3,000 employeesin 15 countries. Before BP, Ann held marketing, finance and operation positionsat Exxon Mobil and McDonald’s Corporation.
“I believe in the mission of this company, the quality of its people and thepotential of our technology to transform the building industry,” said Ann. “Iwas fortunate to have the satisfaction of making things ‘a little better’ at BP,and am compelled by the opportunity at Project FROG to change how buildingsare built and redefine standards for how they perform…we can makeconstruction a lot better.”
Chapter 7 Buildings
7.1 Project Frog: Sustainability and Innovation in Building Design 432

Chuck McDermott, a Project FROG board member and General Partner atRockPort Capital Partners says, “Ann is a very dynamic executive whounderstands how to create vision and build brands. We’re confident that shewill provide important leadership as Project FROG diversifies products thatgrow markets and monetize its game-changing innovation.”
About Project FROG
Better, Greener, Faster. Smart. Project FROG makes the most technologicallyadvanced, energy-efficient building systems on the planet. Employinginnovative clean technology across the construction spectrum, Project FROGaims to transform the building industry by creating new standards for healthybuildings that significantly reduce energy consumption and construction waste.Venture funding from Rockport Capital facilitated entrance into education andgovernmental markets in California, New England and Hawaii. Near-term plansinclude expansion into new geographies and market sectors.
Project Frog’s smart building systems are frequent recipients of industryawards for their design and performance. For more information, visithttp://www.projectfrog.com.
About RockPort Capital Partners
RockPort Capital Partners, http://www.rockportcap.com, is a leading venturecapital firm partnering with clean tech entrepreneurs around the world tobuild innovative companies and bring disruptive technologies and products tothe 21st century. RockPort’s investment approach is distinguished bycollaboration with management teams to foster growth and create value.Combining domain expertise with policy and international experience,RockPort has a proven track record of leveraging its insights and networks tofoster growth and create value.Business Wire, “Ann Hand New CEO at ProjectFROG,” news release, September 22, 2009, accessed September 1, 2010,http://www.businesswire.com/news/home/20090922005679/en/Ann-Hand-CEO-Project-FROG.
Chapter 7 Buildings
7.1 Project Frog: Sustainability and Innovation in Building Design 433

Interview with CEO Ann Hand
http://alisterpaine.info/2009/11/16/ceo-interview-ann-hand-of-project-frog
Time-Lapse Video of Project Frog Building at Greenbuild
http://it.truveo.com/Project-FROG-at-Greenbuild-2008/id/2823405421
Rating Environmental Performance in the Building Industry:Leadership in Energy and Environmental Design (LEED)
LEED provides building owners and operators a concise framework for identifyingand implementing practical and measurable green building design, construction,operations and maintenance solutions.US Green Building Council, “Intro—WhatLEED Is,” accessed January 28, 2011, http://www.usgbc.org/DisplayPage.aspx?CMSPageID=1988.
- US Green Building Council
Environmentally preferable, “sustainable,” or “green” building uses optimal andinnovative design and construction to provide economic, health, environmental,and social benefits. Green buildings cost little or nothing more to build thanconventional facilities and typically cost significantly less to operate and maintainwhile having a smaller impact on the environment.Davis Langdon, Cost of GreenRevisited: Reexamining the Feasibility and Cost Impact of Sustainable Design in the Light ofIncreased Market Adoption, July 2007, accessed January 28, 2011,http://www.centerforgreenschools.org/docs/cost-of-green -revisited.pdf; StevenWinter Associates Inc., GSA LEED Cost Study, October 2004, accessed January 28, 2011,http://www.wbdg.org/ccb/GSAMAN/gsaleed.pdf; US Green BuildingCouncil–Chicago Chapter, Regional Green Building Case Study Project: A Post-OccupancyStudy of LEED Projects in Illinois, Fall 2009, accessed January 28, 2011,http://www.usgbc-chicago.org/wp-content/uploads/2009/08/Regional-Green-Building-Case-Study-Project-Year-1-Report.pdf. These savings plus a burnishedenvironmental reputation and improved indoor comfort mean green buildings cancommand higher rents and improve occupant productivity.Piet Eichholtz, Nils Kok,
Chapter 7 Buildings
7.1 Project Frog: Sustainability and Innovation in Building Design 434

and John M. Quigley, “Doing Well by Doing Good? Green Office Buildings” (Programon Housing and Urban Policy Working Paper No. W08-001, Institute of Business andEconomic Research, Fisher Center for Real Estate & Urban Economics, University ofCalifornia, Berkeley, 2008), accessed January 28, 2011,http://www.jetsongreen.com/files/doing_well_by_doing_good_green_office_buildings.pdf In addition, green buildings’ life-cycle costing provides amore accurate way to evaluate long-term benefits than the traditional focus oninitial construction cost alone.Andrea Larson, Jeff York, and Mark Meier, “RatingPerformance in the Building Industry: Leadership in Energy and EnvironmentalDesign” (UVA-ENT-0053), 2010 Darden Case Collection. All other references in thissection, unless otherwise noted, come from this source.
Although many were interested in the idea of green building, in the early 1990sgreen building was difficult to define, which slowed the market adoption of itsprinciples and practices. In response, the USGBC was formed in 1993 in associationwith the American Institute of Architects, the leading US architectural designorganization. By 2000, USGBC had about 250 members that included propertyowners, designers, builders, brokers, product manufacturers, utilities, finance andinsurance firms, professional societies, government agencies, environmentalgroups, and universities. Those council members helped create the LEED ratingsystem, released to the public in 2000. The LEED standard intended to transform thebuilding market by providing guidelines, certification, and education for greenbuilding. Thus architects, clients, and builders could identify and acquire pointsacross a variety of environmental performance criteria and then apply forindependent certification, which verified the green attributes of the building forothers, such as buyers or occupants.
LEED quickly expanded as it filled the need for a reliable definition of greenbuilding. Within two years of its release, LEED captured 3 percent of the US market,including 6 percent of commercial and institutional buildings under design thatyear. By 2003, USGBC had more than three thousand members, more than fiftybuildings had been LEED certified, and more than six hundred building projectstotaling more than ninety-one million square feet were registered for futurecertification in fifty US states and fifteen countries.US Green Building Council,Building Momentum: National Trends and Prospects for High-Performance Green Buildings,February 2003, 1, 11, 13, accessed January 28, 2011, http://www.usgbc.org/Docs/Resources/043003_hpgb_whitepaper.pdf.
LEED found multiple proponents. In December 2005, USGBC made the ScientificAmerican 50, the magazine’s prestigious international list of “people andorganizations worldwide whose research, policy, or business leadership has playeda major role in bringing about the science and technology innovations that areimproving the way we live and offer the greatest hopes for the future.”US Green
Chapter 7 Buildings
7.1 Project Frog: Sustainability and Innovation in Building Design 435

Building Council, “USGBC Named to ‘Scientific American 50,’” news release, January 1,2006, accessed January 28, 2011, http://www.usgbc.org/News/PressReleaseDetails.aspx?ID=2045. The federal government, through divisions suchas the General Services Administration and US military, began providing incentivesand requiring that its projects be LEED certified. The trademarked LEEDcertification became the de facto green building code for many locations, such asthe cities of Santa Monica and San Francisco, or was rewarded with tax breaks, suchas in New York, Indiana, and Massachusetts. Corporate and public sectororganizations with certified or registered buildings soon included Genzyme, Honda,Toyota, Johnson & Johnson, IBM, Goldman Sachs, Ford, Visteon, MIT, and HermanMiller.
By July 2010, USGBC membership had jumped to over 30,000, more than 155,000building professionals had been credentialed formally in the LEED system, and 6,000buildings had been certified as meeting LEED criteria. The LEED system had beenrevised and expanded to include homes, renovation, and neighborhooddevelopment, not just individual, new commercial buildings. Almost half the statesof the United States had begun to require LEED or equivalent certification for moststate buildings. Hence, despite its shortcomings and competition, LEED remains thebest-known green building program, and USGBC remains a committee-based,member-driven, and consensus-focused nonprofit coalition leading a nationalconsensus to promote high-performance buildings that are environmentallyresponsible, profitable, and healthy places to live and work.
Why the Building Industry?
Buildings consume many resources and produce much waste. In the United States,buildings consume about 40 percent of all energy, including 72 percent ofelectricity, and 9 percent of all water, or forty trillion gallons daily. As a result,buildings produce about 40 percent of all greenhouse gas emissions. They alsoproduce solid waste. A 2009 EPA study estimated that in one year, buildingconstruction, renovation, and demolition alone produced 170 million tons of debris,about half of which went straight to landfills.D&R International Ltd., “1.1: BuildingsSector Energy Consumption,” in 2009 Buildings Energy Data Book (Silver Spring, MD:US Department of Energy, 2009), 1–10, accessed January 28, 2011,http://buildingsdatabook.eren.doe.gov/docs/DataBooks/2009_BEDB_Updated.pdf;D&R International Ltd., “8.1: Buildings Sector Water Consumption,” in 2009 BuildingsEnergy Data Book (Silver Spring, MD: US Department of Energy, 2009), 8-1, table 8.1.1,accessed January 28, 2011, http://buildingsdatabook.eren.doe.gov/docs/DataBooks/2009_BEDB_Updated.pdf; US Green Building Council, “Green Building Facts,”accessed March 23, 2011, http://www.usgbc.org/ShowFile.aspx?DocumentID=5961;US Environmental Protection Agency, Estimating 2003 Building-Related Constructionand Demolition Materials Amounts, accessed January 28, 2011, http://www.epa.gov/
Chapter 7 Buildings
7.1 Project Frog: Sustainability and Innovation in Building Design 436

wastes/conserve/rrr/imr/cdm/pubs/cd-meas.pdf. Since Americans spend 90percent of their time indoors, the building environment is also key to overallhealth.
The construction industry has major economic impacts. Construction andrenovation is the largest sector of US manufacturing, and buildings and buildingproducts span more Standard Industrial Classification codes than any otherindustrial activity. The value of new construction put in place rose from $800 billionin 1993 to peak at nearly $1.2 trillion in 2006, equal to 5 to 8 percent of GDP overthat span. About half of construction in the past two decades has been residentialand about one-third commercial, manufacturing, office, or educational space(Figure 7.8 "US Construction Trends"). Including highways and other nonbuildingconstruction, total construction is roughly 70 percent private and 30 percentpublic.US Census Bureau, “Construction Spending: Total Construction,” accessedSeptember 3, 2010, http://www.census.gov/const/www/totpage.html. Hence thebuilding sector presents some of the most accessible opportunities to developinnovative strategies for increasing profits and addressing environmental andrelated community quality-of-life concerns.
Figure 7.8 US Construction Trends
Source: Created by author from US Census Bureau data available from http://www.census.gov/const/C30/ototall.xls. The total value put in place for 1993–2009 includes both public and private projects, whereas values for
Chapter 7 Buildings
7.1 Project Frog: Sustainability and Innovation in Building Design 437

separate categories before 2002 include only private construction since public projects were not disaggregated bycategory until that time.
Buildings, however, have some characteristics that can impede environmentaldesign. They have a thirty- to forty-year life cycle from planning, design, andconstruction through operations and maintenance (O&M) and renovation toultimate demolition or recycling. This long, varied life span requires advanceplanning to maximize environmental benefits and minimize harm and can lockolder, less efficient, or hazardous technologies such as asbestos or lead paint inplace. Indeed, advance planning is key. Structural and site design is the mostimportant factor determining performance and cost throughout a building’s life.
LEED Silver-Qualified PNC Firstside Center
Figure 7.9PNC Firstside Center
Source: US Green Building Council: Overview,” 2008, accessed March 7, 2011, http://leedcasestudies.usgbc.org/overview.cfm?ProjectID=62.
Buildings also involve multiple stakeholders, which can complicate optimization ofthe system. Costs are borne by one or more parties, such as owners, operators, and
Chapter 7 Buildings
7.1 Project Frog: Sustainability and Innovation in Building Design 438

tenants. This division can hamper maximizing the overall efficiency of the building,as various groups vie for their own advantage or simply fail to coordinate theirefforts. Wages and benefits paid to occupant employees dwarf all other expensesbut are typically not included in building life-cycle costs. Depending on thearrangement, a tenant may pay for most of O&M but have had no say in the originaldesign or site selection. A system such as LEED can make all parties aware ofenvironmental performance and thus help them collaborate to improve it whilealso assuring others that the building has been designed to a certain standard.
How LEED Works
USGBC created the LEED Green Building rating system to, in the council’s words,transform the building market by doing the following:
• Defining green building by establishing a common standard ofmeasurement
• Promoting integrated, whole-building design practices• Recognizing environmental leadership in the building industry• Stimulating competition• Raising consumer awareness of green building benefits
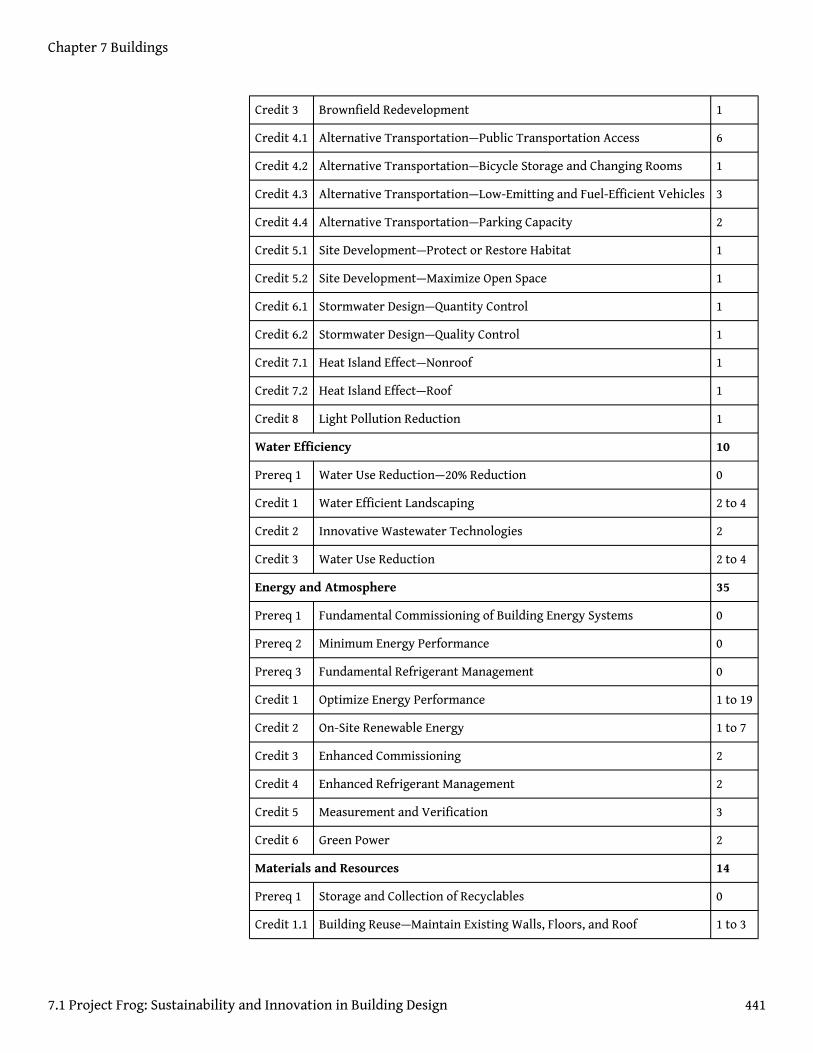
To achieve these goals, LEED provides a comprehensive framework for assessing theenvironmental performance of a building over its lifetime as measured through thefollowing categories (Table 7.1 "LEED for New Construction Rating System"):
• Sustainable sites. Minimizing disruption of the ecosystem and newdevelopment.
• Water efficiency. Using less water inside and in landscaping.• Energy and atmosphere. Minimizing energy consumption and
emissions of pollutants.• Materials and resources. Using recycled or sustainable building
materials and recycling construction debris.• Indoor environmental quality. Maximizing indoor air quality,
daylight, and comfort.• Innovation and design process. Fostering breakthroughs and best
practices.• Regional priorities. Credits that vary by site to reward local priorities.
Projects within a given LEED rating system can earn points in each category and allpoints are equal, no matter the effort needed to achieve them. For instance,installing bike racks and a shower in an office building can earn one point forSustainable Sites, as can redeveloping a brownfield. Merely including a LEED
Chapter 7 Buildings
7.1 Project Frog: Sustainability and Innovation in Building Design 439
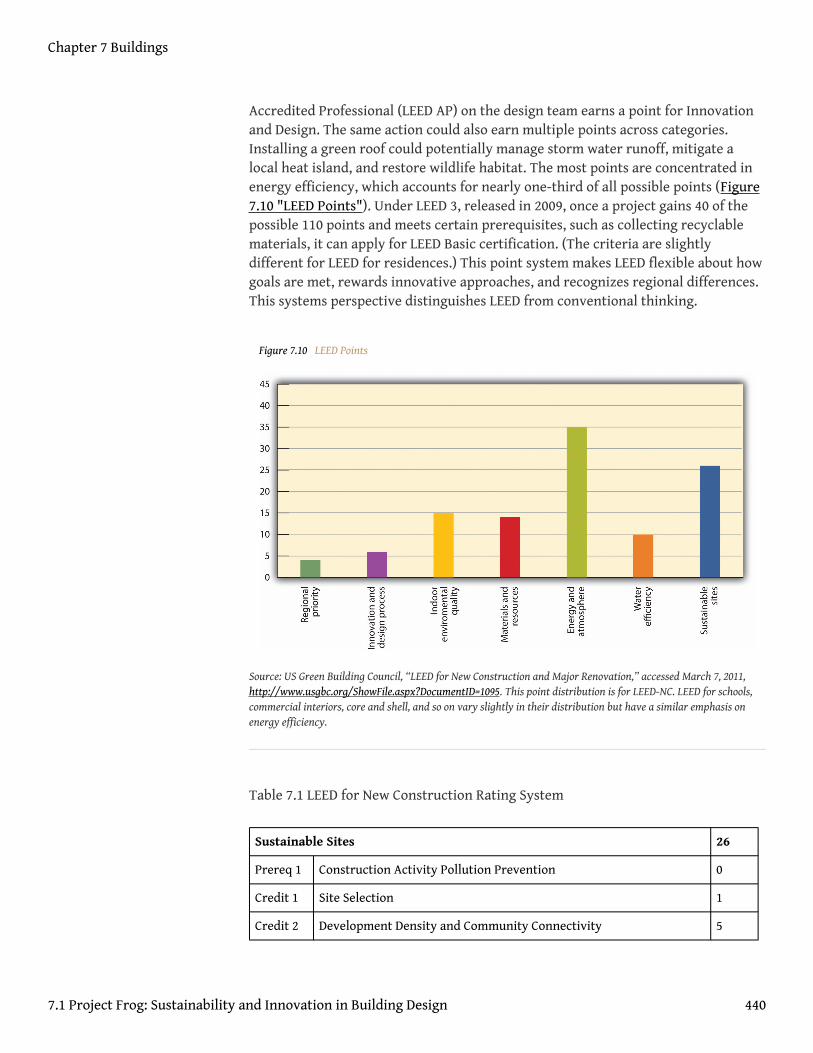
Accredited Professional (LEED AP) on the design team earns a point for Innovationand Design. The same action could also earn multiple points across categories.Installing a green roof could potentially manage storm water runoff, mitigate alocal heat island, and restore wildlife habitat. The most points are concentrated inenergy efficiency, which accounts for nearly one-third of all possible points (Figure7.10 "LEED Points"). Under LEED 3, released in 2009, once a project gains 40 of thepossible 110 points and meets certain prerequisites, such as collecting recyclablematerials, it can apply for LEED Basic certification. (The criteria are slightlydifferent for LEED for residences.) This point system makes LEED flexible about howgoals are met, rewards innovative approaches, and recognizes regional differences.This systems perspective distinguishes LEED from conventional thinking.
Figure 7.10 LEED Points
Source: US Green Building Council, “LEED for New Construction and Major Renovation,” accessed March 7, 2011,http://www.usgbc.org/ShowFile.aspx?DocumentID=1095. This point distribution is for LEED-NC. LEED for schools,commercial interiors, core and shell, and so on vary slightly in their distribution but have a similar emphasis onenergy efficiency.
Table 7.1 LEED for New Construction Rating System
Sustainable Sites 26
Prereq 1 Construction Activity Pollution Prevention 0
Credit 1 Site Selection 1
Credit 2 Development Density and Community Connectivity 5
Chapter 7 Buildings
7.1 Project Frog: Sustainability and Innovation in Building Design 440
Credit 3 Brownfield Redevelopment 1
Credit 4.1 Alternative Transportation—Public Transportation Access 6
Credit 4.2 Alternative Transportation—Bicycle Storage and Changing Rooms 1
Credit 4.3 Alternative Transportation—Low-Emitting and Fuel-Efficient Vehicles 3
Credit 4.4 Alternative Transportation—Parking Capacity 2
Credit 5.1 Site Development—Protect or Restore Habitat 1
Credit 5.2 Site Development—Maximize Open Space 1
Credit 6.1 Stormwater Design—Quantity Control 1
Credit 6.2 Stormwater Design—Quality Control 1
Credit 7.1 Heat Island Effect—Nonroof 1
Credit 7.2 Heat Island Effect—Roof 1
Credit 8 Light Pollution Reduction 1
Water Efficiency 10
Prereq 1 Water Use Reduction—20% Reduction 0
Credit 1 Water Efficient Landscaping 2 to 4
Credit 2 Innovative Wastewater Technologies 2
Credit 3 Water Use Reduction 2 to 4
Energy and Atmosphere 35
Prereq 1 Fundamental Commissioning of Building Energy Systems 0
Prereq 2 Minimum Energy Performance 0
Prereq 3 Fundamental Refrigerant Management 0
Credit 1 Optimize Energy Performance 1 to 19
Credit 2 On-Site Renewable Energy 1 to 7
Credit 3 Enhanced Commissioning 2
Credit 4 Enhanced Refrigerant Management 2
Credit 5 Measurement and Verification 3
Credit 6 Green Power 2
Materials and Resources 14
Prereq 1 Storage and Collection of Recyclables 0
Credit 1.1 Building Reuse—Maintain Existing Walls, Floors, and Roof 1 to 3
Chapter 7 Buildings
7.1 Project Frog: Sustainability and Innovation in Building Design 441

Credit 1.2 Building Reuse—Maintain 50% of Interior Nonstructural Elements 1
Credit 2 Construction Waste Management 1 to 2
Credit 3 Materials Reuse 1 to 2
Credit 4 Recycled Content 1 to 2
Credit 5 Regional Materials 1 to 2
Credit 6 Rapidly Renewable Materials 1
Credit 7 Certified Wood 1
Indoor Environmental Quality 15
Prereq 1 Minimum Indoor Air Quality Performance 0
Prereq 2 Environmental Tobacco Smoke (ETS) Control 0
Credit 1 Outdoor Air Delivery Monitoring 1
Credit 2 Increased Ventilation 1
Credit 3.1 Construction IAQ Management Plan—During Construction 1
Credit 3.2 Construction IAQ Management Plan—Before Occupancy 1
Credit 4.1 Low-Emitting Materials—Adhesives and Sealants 1
Credit 4.2 Low-Emitting Materials—Paints and Coatings 1
Credit 4.3 Low-Emitting Materials—Flooring Systems 1
Credit 4.4 Low-Emitting Materials—Composite Wood and Agrifiber Products 1
Credit 5 Indoor Chemical and Pollutant Source Control 1
Credit 6.1 Controllability of Systems—Lighting 1
Credit 6.2 Controllability of Systems—Thermal Comfort 1
Credit 7.1 Thermal Comfort—Design 1
Credit 7.2 Thermal Comfort—Verification 1
Credit 8.1 Daylight and Views—Daylight 1
Credit 8.2 Daylight and Views—Views 1
Innovation and Design Process 6
Credit 1.1 Innovation in Design: Specific Title 1
Credit 1.2 Innovation in Design: Specific Title 1
Credit 1.3 Innovation in Design: Specific Title 1
Credit 1.4 Innovation in Design: Specific Title 1
Chapter 7 Buildings
7.1 Project Frog: Sustainability and Innovation in Building Design 442

Credit 1.5 Innovation in Design: Specific Title 1
Credit 2 LEED Accredited Professional 1
Regional Priority Credits 4
Credit 1.1 Regional Priority: Specific Credit 1
Credit 1.2 Regional Priority: Specific Credit 1
Credit 1.3 Regional Priority: Specific Credit 1
Credit 1.4 Regional Priority: Specific Credit 1
Total 110
Source: US Green Building Council, “LEED for New Construction and MajorRenovation,” accessed March 7, 2011, http://www.usgbc.org/ShowFile.aspx?DocumentID=1095.
LEED has been amended regularly to respond to emerging needs. Partly in reactionto criticism that LEED focused too narrowly on new commercial construction,USGBC developed different LEED rating systems for different types of projects. Inaddition to the original LEED for New Construction and Major Renovation (LEED-NC), there are now LEED for Schools, LEED for Existing Building Operations andMaintenance (LEED-EB O&M), LEED for Commercial Interiors (LEED-CI), and LEEDfor Core and Shell (LEED-CS), all of which use the above categories and have similar,albeit slightly different, distributions of the 110 possible points among thecategories.Rating systems are available at US Green Building Council, “LEEDResources and Tools: LEED 2009 Addenda,” accessed September 3, 2010,http://www.usgbc.org/DisplayPage.aspx?CMSPageID=2200#BD+C. The more recentLEED for Neighborhood Development (LEED-ND) and LEED for Homes have the samepoint approach but different categories. LEED-ND awards points for Innovation andDesign and Regional Priorities plus Smart Location and Linkage, NeighborhoodPattern and Design, and Green Infrastructure and Buildings. LEED for Homes largelyfollows the categories of other building types but also has Locations and Linkagesdistinct from Sustainable Sites to encourage walking, infill, and so forth; Awarenessand Education to encourage homeowners to educate others; and a Home SizeAdjustment to acknowledge that bigger homes, efficiency notwithstanding,consume more resources than smaller ones. LEED for Homes also has 136, not 110,possible points with a lower threshold for Basic certification. LEED for Retail andLEED for Healthcare (versus more generic commercial buildings covered by LEED)were in development as of July 2010 and likely to be launched within a year.
Chapter 7 Buildings
7.1 Project Frog: Sustainability and Innovation in Building Design 443

Sample LEED Rating System Version 2.1 Credit
Energy & Atmosphere Credit 1: Optimize Energy Performance 1–10 Points
Intent
Achieve increasing levels of energy performance above the prerequisitestandard to reduce environmental impacts associated with excessive energyuse.
Requirements
Reduce design energy cost compared with the energy cost budget for energysystems regulated by ASHRAE/IESNA Standard 90.1-1999 (withoutamendments), as demonstrated by a whole building simulation using theEnergy Cost Budget Method described in Section 11 of the Standard.
Table 7.2 Comparison of New versus Existing Buildings
New buildings (%) Existing buildings (%) Points
15 5 1
20 10 2
25 15 3
30 20 4
35 25 5
40 30 6
45 35 7
50 40 8
55 45 9
60 50 10
Source: Data from ASHRAE/IESNA Standard 90.1-1999.
Chapter 7 Buildings
7.1 Project Frog: Sustainability and Innovation in Building Design 444

Regulated energy systems include heating, cooling, fans, and pumps (HVAC),service hot water, and interior lighting. Nonregulated systems include plugloads, exterior lighting, garage ventilation and elevators (verticaltransportation). Two methods can be used to separate energy consumption forregulated systems. The energy consumption for each fuel may be proratedaccording to the fraction of energy used by regulated and nonregulated energy.Alternatively, separate meters (accounting) may be created in the energysimulation program for regulated and nonregulated energy uses.
If an analysis has been made comparing the proposed design to local energystandards and a defensible equivalency (at minimum) to ASHRAE/IESNAStandard 90.1-1999 has been established, then the comparison against the localcode may be used in lieu of the ASHRAE
Standard Project teams are encouraged to apply for innovation credits if theenergy consumption of nonregulated systems is also reduced.
Optimize Energy Performance: 1–10 Points
Submittals
Complete the LEED Letter Template incorporating a quantitative summary tableshowing the energy-saving strategies incorporated in the building design.
Demonstrate via summary printout from energy simulation software that thedesign energy cost is less than the energy cost budget as defined in ASHRAE/IESNA 90.1-1999, Section 11.
Potential Technologies and Strategies
Design the building envelope and building systems to maximize energyperformance. Use a computer simulation model to assess the energyperformance and identify the most cost-effective energy efficiency measures.Quantify energy performance as compared with a baseline building.Reprintedcourtesy of the US Green Building Council, LEED 2009 for New Construction andMajor Renovations Rating System (Washington DC: US Green Building Council,
Chapter 7 Buildings
7.1 Project Frog: Sustainability and Innovation in Building Design 445
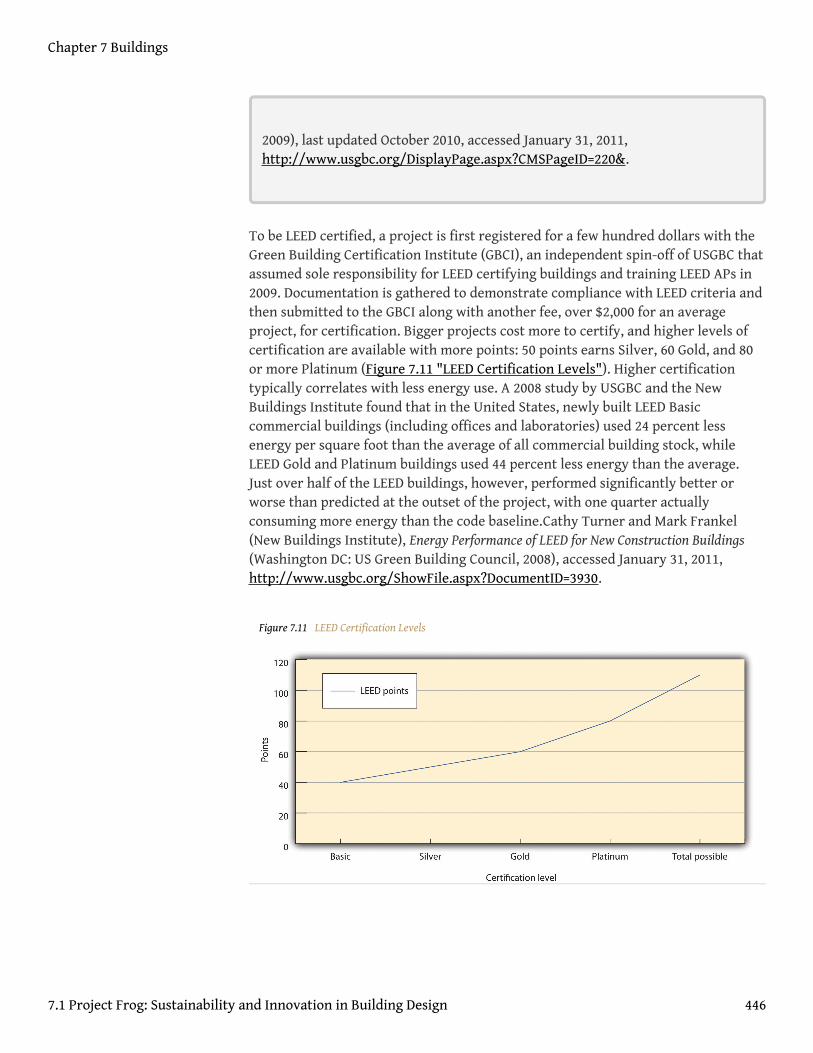
2009), last updated October 2010, accessed January 31, 2011,http://www.usgbc.org/DisplayPage.aspx?CMSPageID=220&.
To be LEED certified, a project is first registered for a few hundred dollars with theGreen Building Certification Institute (GBCI), an independent spin-off of USGBC thatassumed sole responsibility for LEED certifying buildings and training LEED APs in2009. Documentation is gathered to demonstrate compliance with LEED criteria andthen submitted to the GBCI along with another fee, over $2,000 for an averageproject, for certification. Bigger projects cost more to certify, and higher levels ofcertification are available with more points: 50 points earns Silver, 60 Gold, and 80or more Platinum (Figure 7.11 "LEED Certification Levels"). Higher certificationtypically correlates with less energy use. A 2008 study by USGBC and the NewBuildings Institute found that in the United States, newly built LEED Basiccommercial buildings (including offices and laboratories) used 24 percent lessenergy per square foot than the average of all commercial building stock, whileLEED Gold and Platinum buildings used 44 percent less energy than the average.Just over half of the LEED buildings, however, performed significantly better orworse than predicted at the outset of the project, with one quarter actuallyconsuming more energy than the code baseline.Cathy Turner and Mark Frankel(New Buildings Institute), Energy Performance of LEED for New Construction Buildings(Washington DC: US Green Building Council, 2008), accessed January 31, 2011,http://www.usgbc.org/ShowFile.aspx?DocumentID=3930.
Figure 7.11 LEED Certification Levels
Chapter 7 Buildings
7.1 Project Frog: Sustainability and Innovation in Building Design 446
Source: US Green Building Council, “LEED 2009: Technical Advancements to the LEED Rating System,” accessedMarch 7, 2011, http://www.usgbc.org/DisplayPage.aspx?CMSPageID=1971. These point values apply to all LEEDrating systems except LEED for Homes.
LEED 3 was intended to address some of these prediction problems as well ascriticisms that LEED could reward, for instance, a building for air-conditioning thedesert as long as it did so more efficiently than comparable buildings. LEED 3 addedonline tools to facilitate planning and certification. It also harmonized criteriaamong its rating systems for different types of projects and added points tocategories that made a larger overall difference in energy use, such as building nearexisting public transportation infrastructure instead of a more remote location.LEED already had been twice revised prior to LEED 3, and USGBC continues tosupport LEED as it evolves and expands.
To simplify use and speed adoption, LEED refers to existing industry standards ofpractice. LEED for Homes specifies ANSI (American National Standards Institute)Z765 for calculating square footage for the Home Size Adjustment. LEED forOperations and Maintenance adheres to ASHRAE (American Society of Heating,Refrigeration, and Air-Conditioning Engineers) standards for ventilation andvarious American Standards for Testing and Materials (ASTM) standards forlighting and reflectance.
Many credits require submission of a letter signed by the architect, engineer,owner, or responsible party and verification of the claims in language provided by aspecific LEED template. To maintain the credibility of the third-party rating system,claims to credits are subject to auditing by GBCI.
Green Building Costs and Benefits
There are multiple aspects of green building cost and benefits. For LEEDcertification in particular, direct project costs include the administrative costs ofthe application process and fees, which can run into the thousands of dollars, aswell as the financial impacts on building design, construction, and operation, due toimplementation of LEED-related measures. These costs should be evaluated in termsof total cost of ownership, including both first costs and operating costs over thebuilding’s life cycle. Indirect costs are often harder to assess but are worthy ofconsideration.
Green building can add little to nothing to total design and construction cost, atleast for the lower levels of LEED certification or equivalent green building codes. Astudy by global construction consultant Davis Langdon in 2006 found “no
Chapter 7 Buildings
7.1 Project Frog: Sustainability and Innovation in Building Design 447

significant difference in average costs for green buildings as compared to nongreenbuildings. Many project teams are building green buildings with little or no addedcost to the amount a traditional building costs, and with budgets well within thecost range of nongreen buildings with similar programs.”Davis Langdon, Cost ofGreen Revisited: Reexamining the Feasibility and Cost Impact of Sustainable Design in theLight of Increased Market Adoption, July 2007, accessed January 28, 2011,http://www.centerforgreenschools.org/docs/cost-of-green- revisited.pdf. Greendesign may require particular attention and effort in the initial phases, and designcosts are generally higher, but more and more firms see green as part of thestandard package, not an addition. Other studies of specific buildings by the GSAand various organizations found that green design might cost a few percentagepoints more but significantly reduced operating costs and improved occupantcomfort.Steven Winter Associates Inc., GSA LEED Cost Study, October 2004, accessedJanuary 28, 2011, http://www.wbdg.org/ccb/GSAMAN/gsaleed.pdf; US GreenBuilding Council–Chicago Chapter, Regional Green Building Case Study Project: A Post-Occupancy Study of LEED Projects in Illinois, Fall 2009, accessed January 28, 2011,http://www.usgbc-chicago.org/wp-content/uploads/2009/08/Regional-Green-Building-Case-Study-Project-Year-1-Report.pdf. The City of Portland, Oregon, forexample, had eighteen LEED buildings in 2004 and saved more than $1 million peryear in avoided wastewater treatment costs and another $1 million a year in lowerenergy bills.Mike Italiano (board member, US Green Building Council), personalcommunication, March 14, 2003.
In some cases, highly innovative design features might retard both market andregulatory acceptance of green buildings (especially at the local level where greendesign knowledge may be low), slowing the project timetable and increasing costs.For example, regulators who are unfamiliar with constructed wetlands might doubttheir effectiveness as a way to reduce the impacts of storm water runoff. Similarly,the real estate market in some areas, due to a lack of familiarity, might question thevalue of a geothermal heating system, or condo association rules might prohibit asupplemental solar electric system.
Nonetheless, green building, especially when certified to LEED or another standard,offers many benefits. Environmentally, it reduces the strain on the local ecosystem,conserves resources and habitat, and improves indoor air quality. Economically,green building lowers operating costs, can garner tax incentives, improves publicimage, can lower insurance costs, improves employee productivity and attendance,and increases market value. Indeed, in a 2008 study, Piet Eichholtz andcollaborators compared 700 hundred Energy Star and LEED-certified officebuildings to 7,500 conventional ones and found that the green office buildings hadhigher occupancy rates and could charge slightly higher rents, making the marketvalue of a green building typically $5 million greater than its conventionalequivalent.The report states, “The results show that large increases in the supply of
Chapter 7 Buildings
7.1 Project Frog: Sustainability and Innovation in Building Design 448
green buildings during 2007–2009, and the recent downturns in property markets,have not significantly affected the rents of green buildings relative to those ofcomparable high quality property investments; the economic premium to greenbuilding has decreased slightly, but rents and occupancy rates are still higher thanthose of comparable properties.” The report also concludes that green certificationcommands higher rental premiums and asset value at resale: “We find that greenbuildings have rents and asset prices that are significantly higher than thosedocumented for conventional office space, while controlling specifically fordifferences in hedonic attributes and location using propensity score weights.” PietEichholtz, Nils Kok, and John M. Quigley, The Economics of Green Building, 3, 20,accessed January 26, 2011, http://www.ctgbc.org/archive/EKQ_Economics.pdf.
Given these benefits, green building will likely expand. With so much money on theline, the need for verified environmental performance and design standards willremain strong.
Alternatives to and Criticisms of LEED
Despite growth in the green building market, in 2009, $42 billion represented lessthan 10 percent of total building construction. One criticism of LEED is that as avoluntary standard, it does not force enough change fast enough. Public policyanalyst David Hart concluded LEED “is inevitably bumping up against its limits” anddoes not “act assertively to pull along the trailing edge of ‘brown building’practice.”David M. Hart, “Don’t Worry About the Government? The LEED-NC ‘GreenBuilding’ Rating System and Energy Efficiency in US Commercial Buildings” (MIT-IPC-Energy Innovation Working Paper 09-001, Industrial Performance Center,Massachusetts Institute of Technology, 2009), accessed January 31, 2011,http://web.mit.edu/ipc/publications/pdf/09-001.pdf. As more governments andorganizations adopt LEED or similar standards because it gives them an established,reliable metric, the market could shift more quickly toward greener construction.
A second persistent criticism of LEED has been that basic certification doesn’trepresent much improvement over conventional building. As recently as 2010,renowned architect Frank Gehry criticized LEED for crediting “bogus stuff” thatdoesn’t truly pay off.Blair Kamin, “Frank Gehry Holds Forth on Millennium Park,the Modern Wing, and Why He’s Not into Green Architecture,” Cityscapes (blog),Chicago Tribune, April 7, 2010, accessed January 31, 2011,http://featuresblogs.chicagotribune.com/theskyline/2010/04/looking-down-on-the-stunning-view-of-the-frank-gehry- designed-pritzker-pavilion-from-the-art-institute-of-chicagos-renzo-pian.html. LEED certification in this line of reasoningdistracts people from more ambitious targets, and the money spent on registrationand certification—ranging from about $2,000 for smaller buildings for USGBCmembers to $27,500 for larger buildings for nonmembers—could instead be spent
Chapter 7 Buildings
7.1 Project Frog: Sustainability and Innovation in Building Design 449

on more environmental improvements.For costs, see Green Building CertificationInstitute, “Current Certification Fees,” 2010, accessed January 31, 2011,http://www.gbci.org/main-nav/building-certification/resources/fees/current.aspx; and Green Building Certification Institute, “Registration Fees,”accessed January 31, 2011, http://www.gbci.org/Certification/Resources/Registration-fees.aspx. For criticism, see Anya Kamenetz, “The Green Standard?,”Fast Company, October 1, 2007, accessed January 31, 2011,http://www.fastcompany.com/magazine/119/the-green-standard.html?page=0%2C0. Such fees also mean USGBC and GBCI have an economic stake inmaking LEED the dominant standard of certification. USGBC has even criticizedCalifornia’s State Building Code for the CalGreen label because USGBC feared thelabel would create confusion and detract from LEED’s value.“California’s BuildingCode Turns a Deeper Shade of Green,” Green Business, January 14, 2010, accessedJanuary 31, 2011, http://www.greenbiz.com/news/2010/01/14/californias-building-code-turns-deeper-shade-green.
Finally, LEED unabashedly focuses on energy use as its main criterion forenvironmental performance. That has led to criticism from the nonprofitEnvironment and Human Health Inc. (EHHI) that LEED does too little to keep toxicmaterials out of buildings. An EHHI report from 2010 urged USGBC to discourage“chemicals of concern” such as phthalates and halogenated flame retardants and toinclude more medical professionals on its board. A USGBC vice president said hewas willing to collaborate with critics to improve LEED, provided the expectationswere reasonable: “LEED could say there should be no chemicals in any building andno energy used and no water and every building should give back water and energy.We could do all that, and no one would use the rating system. We can only take themarket as far as it’s willing to go.”Suzanne Labarre, “LEED Buildings RatedGreen…and Often Toxic,” Fast Company, June 3, 2010, accessed January 31, 2011,http://www.fastcompany.com/1656162/are-leed-buildings-unhealthy. Also TristanRoberts, “New Report Criticizes LEED on Public Health Issues,” EnvironmentalBuilding News, June 3, 2010, accessed January 31, 2011,http://www.buildinggreen.com/auth/article.cfm/2010/6/3/New-Report- Criticizes-LEED-on-Public-Health-Issues.
Yet LEED seems to have found just where the market is willing to go. Othercertification systems exist but have not attained the status that LEED has. GreenGlobes, for instance, began in 2000, the same year as LEED, and had an onlinecomponent from its inception. Green Globes offers a similar performance ratingsystem, and certification is often cheaper than LEED. Green Globes is moreprevalent in Canada, but in the United States it is being incorporated as ANSI’sofficial green building standard.Green Globes, “What Is Green Globes?,” accessedSeptember 3, 2010, http://www.greenglobes.com/about.asp. The US EPA alsoawards Energy Star certification to buildings in the seventy-fifth or higher
Chapter 7 Buildings
7.1 Project Frog: Sustainability and Innovation in Building Design 450
percentile for energy use in their category. Builders can apply by designing forEnergy Star and completing an online application; actual operating data, however,are necessary to earn the final Energy Star label.Energy Star, “The Energy Star forBuildings & Manufacturing Plants,” accessed January 26, 2011,http://www.energystar.gov/index.cfm?c=business.bus_bldgs. There is no fee forcertification. Finally, various regional certification programs exist, from EarthCraftin the southeast United States to Build It Green in California. These systems tend tobe tailored more specifically to their locations.
Green building has become increasingly desirable. LEED and other certificationsystems have helped to make it even more desirable by creating trust. Builders,regulators, or the average person can know that LEED certification guarantees amodicum of environmental considerations without having to know a thing aboutwhat those are or how they work in the building. LEED in particular has provenpowerful and flexible enough to spread internationally and to undergo frequentrevision of its existing rating systems and expansion into brand new ones.
KEY TAKEAWAYS
• Challenging the building and construction industry and its submarketswith new products and unprecedented supply-chain requirementsrequires managing not only technology development but also marketperception and accepted practices.
• Economic downturns add unique opportunities and challenges for newventures.
• Meeting third-party standards offers market differentiation.
EXERCISES
1. Put together an analysis of the major elements of entrepreneurialventuring and sustainability innovation applied to Project Frog.
2. In teams, identify a differentiated and innovative company andinterview senior management about their market and how theyovercame challenges to convince early customers to accept theirproduct or service.
Chapter 7 Buildings
7.1 Project Frog: Sustainability and Innovation in Building Design 451

7.2 Greening Facilities: Hermes Microtech Inc.
LEARNING OBJECTIVES
1. Compare internal and external impediments to a company’s shift towarda sustainability strategy for a new building design.
2. Understand how and why decision participants might end up at crosspurposes in implementing green building designs.
3. Identify traits of successful sustainability innovation processes.
The next case is Hermes Microtech.This case was prepared by Batten fellow ChrisLotspeich in collaboration with author Andrea Larson. Andrea Larson and ChrisLotspeich, “Greening” Facilities: Hermes Microtech, Inc., UVA-ENT-0054 (Charlottesville:Darden Business Publishing, University of Virginia, 2004). Case can be accessedthrough the Darden Case Collection at https://store.darden.virginia.edu. Created asan amalgam of various company experiences, this case shows the decision-makingcomplexity of building design and construction. The viewpoints of variousparticipants provide insights into why sustainability concerns change decisionprocesses and therefore can be so difficult for conventional organizations.
Greening Facilities: Hermes Microtech Inc.
Heather GlenName has been changed. This case is an amalgamation of differentbusiness scenarios that case researcher/writer Chris Lotspeich created. The case isnot about one single company and none of the names are real; note tongue-in-cheekchoice of names. pushed back in her chair in her office at Hermes Microtech Inc.,which gave her a commanding view of the books, binders, notes, and messages piledaround her computer. The sunset was fading out over the Pacific, and as the last ofher colleagues left, she welcomed the quiet opportunity to contemplate the taskbefore her. Hermes CEO Alden Torus had just approved the most important projectin Glen’s career to date, and she didn’t want to waste any time getting started. Glenhad one month to organize an initial meeting of all key participants involved increating and building Hermes’s new headquarters. For the first time, the companywould bring together professionals from each phase of facilities design,construction, and operation to initiate project planning, and Glen would run themeeting. Although she was not the construction project manager, Glen was going totry to change the way her company built and ran its facilities to make them moreenvironmentally friendly—and in the process transform the company itself.
Chapter 7 Buildings
452

Much had happened in the eighteen months since Glen had been appointed specialprojects coordinator by Sandy Strand, Hermes’s executive vice president ofenvironment and facilities (E&F). Strand had asked her to lead efforts to makeenvironmental quality a higher priority in the company’s buildings and facilities, agoal the CEO shared. Glen’s work in implementing energy-efficiency improvementsat one of their microchip factories had produced mixed results. She learned a greatdeal about the technical potential for improvement from that pilot project, but hermost valuable lessons concerned the organizational dynamics of the design-buildeffort. She realized that the most important factors for success—as well as thegreatest challenges—lay in renovating the decision-making process rather than indifferent design and technology choices.
As dusk fell and the cubicles outside her office sank into shadow, photo sensorsincreased the brightness of the fluorescent light fixtures above Glen’s desk. Shesipped another mouthful of coffee to stave off any drowsiness that might follow themeal she had just shared with Torus and Strand. Torus had called the dinnermeeting to discuss how best to make the company’s next planned facility anenvironmentally friendly or “green” building. He wanted that to happen because hebelieved it would benefit the company, and he had supported Strand and Glen’sefforts. Yet Torus knew it would be a challenge to change the way the organizationwent about the design-build process.
“I am realistic about the constraints on my ability to effect change on this topic,”Torus had told them. “My time and attention are consumed with more traditionalcore business issues. I can make it clear to others that I support the goal ofenvironmental improvements, but I need to rely on you to make it happen.” Torusasked Strand and Glen to suggest how best to proceed. He liked Glen’s proposal thateveryone involved in the full life cycle of the building join in an initial integrateddesign workshop to initiate the project. “I can’t spare the time to attend the fullmeeting, but I can kick it off with introductory remarks,” Torus said to her. “Sendme a one-page memo with the three to five most important things you want me tosay.”
After dinner, Glen had returned to the office to draft an e-mail invitation toworkshop participants. In her mind’s eye, she saw their faces, and reviewed theirroles in the project and in the greening efforts to date.
The Hermes Story
Hermes was a medium-sized microelectronics manufacturer based in California’sSilicon Valley. The company started as a military contractor but grew to focus onconsumer electronics through a series of mergers, acquisitions, and spin-offs. It
Chapter 7 Buildings
7.2 Greening Facilities: Hermes Microtech Inc. 453

made a mix of microchips spanning a range of capabilities and applications, fromcomplex and costly chips for personal computers and cellular phones to simpler,cheaper devices for consumer appliances and automobiles. Hermes was essentially acomponent maker; almost all its customers were original equipment manufacturers(OEMs). Its ten manufacturing facilities, three R&D laboratories, and twenty salesoffices in the United States, Europe, and Asia employed ten thousand people andgenerated annual revenues of $1 billion, with a net profit of $100 million.
Hermes CEO Alden Torus had been with the company since its founding twenty-fiveyears earlier. The son of immigrants, he had started in the product developmentdepartment and worked his way up through the ranks. Torus was an effective andcharismatic engineer with a good head for business strategy and an encyclopedicmemory for detail. He epitomized the corporate culture at Hermes: hardworkingand production focused, he put in long hours to help develop and launch newproducts. Torus understood the importance of the first-mover advantage in thefast-paced microelectronics industry. Innovation was highly valued at Hermes, andproduct R&D was a spending priority.
Microchip Market Dynamics
Microchips were a commodity, competition was stiff, and profit margins wererelatively narrow. The industry’s business cycle was highly variable, typified byregular and significant swings in price and profits. The driving influence was therapid pace of technological development, characterized by Moore’s Law, which sayscomputing processing power doubles every eighteen months. Racing each other aswell as technical evolution, makers churned out increasingly sophisticatedproducts, shrinking both transistor sizes and product development periods. Time tomarket was a critical competitive factor. The time available for new productlaunches did not often exceed eighteen months, including process and yieldimprovements. The sector was sensitive to macroeconomic conditions, particularlyconsumer spending. More than 85 percent of Hermes’s revenues came from chipsembedded in consumer products.
Another influence on supply and demand fluctuations was the uneven or “lumpy”process of step function increases in production capacity. Microchip manufacturingwas capital intensive, and new fabrication facilities—“fabs”—took many months tobring online. When chip demand rose far enough, competing manufacturersresponded quickly and invested in new capacity. Those fabs tended to come onlineat about the same time; the surge in supply depressed prices, inventories built up,and the market slumped. Eventually demand and prices rose again, followed by anew round of investment in manufacturing capacity for the latest products.
Chapter 7 Buildings
7.2 Greening Facilities: Hermes Microtech Inc. 454

Chip fabs were costly and complex. Microchips were made on silicon wafers in aseries of steps that were carried out within high-tech devices called tools, each ofwhich cost millions of dollars. The tools operated inside carefully climate-controlled environments called clean rooms. Microelectronics production was verysensitive to disruption and contamination by microscopic particles. Line stoppagescould ruin production batches and cost more than $1 million dollars per day or asmuch as tens of thousands of dollars per minute for some product lines. Cleanrooms were isolated seismically from the rest of the fab on dedicated supportpillars, so that vibrations from minor earthquakes or even nearby truck traffic didnot disrupt the tools. Process water was deionized and highly filtered before beingpiped into the clean room and the tools.
Fabs had extensive HVAC systems with high-performance filters to maintain theclean room’s temperature, humidity, and quantity of airborne particulates withinstringent parameters. The air handlers, fans, pumps, furnaces, and chillers werelocated outside the clean room and delivered conditioned air and cooling water intothe clean room via ducts and pipes. Those HVAC systems typically made up 40–50percent of a fab’s electricity consumption. Fab electricity use ranged from threemillion to fifteen million watts or megawatts (MW), depending on the size of thefacility.
The Evolution of Hermes’s Environmental Strategy
Microchip manufacturing involved numerous hazardous materials, toxic emissions,and energy-intensive processes. Maintaining worker safety and managing pollutionwas a critical function. Potentially dangerous emissions were highly regulated andstrictly controlled. Traditionally, environmental health and safety (EHS)management and strategy had focused on end-of-the-pipe problems and solutions,such as treating acid-contaminated exhaust air before it was released into theatmosphere. More recently, increased attention and effort had focused on pollutionprevention strategies that reduced dangerous emissions by changes in productionprocesses. Such strategies could meet regulated emissions control requirements atless cost than end-of-the-pipe methods and often yielded economic benefitsthrough waste reduction and other manufacturing improvements. Hermes’senvironmental activities were representative of the industry in that regard. In themid-1990s, Hermes consolidated the EHS department and the maintenancedepartment into one E&F department.
CEO Alden Torus did not pay much attention to environmental issues during mostof his career. Like most of his colleagues, he regarded pollution control as a cost ofdoing business, driven by compliance with ever-increasing government regulations.He considered such matters to be the responsibility of the environment andfacilities department but neither a high priority for senior management nor a
Chapter 7 Buildings
7.2 Greening Facilities: Hermes Microtech Inc. 455

central element of corporate strategy. He maintained that perspective during histenure as VP of production and his early years as CEO.
Torus’s perspective began to change when his young son developed a rare form ofcancer. During the course of his son’s treatment, he discovered that several otherchildren in his neighborhood had the same type of cancer. His teenage daughterwas passionate about environmental issues and had often complained about theextent of environmental contamination in Silicon Valley, asking her father to dosomething about it. Chemical feedstocks and by-products of electronicsmanufacturing had contaminated groundwater at more than one hundredlocations. Santa Clara County had twenty-nine federally designated “Superfund”toxic waste sites, the highest concentration in the nation. Torus began to wonder ifthat had anything to do with his son’s illness. His son recovered after long anddifficult treatment, but other children with the same disease died. Although no linkto any specific chemical or site was established, that family crisis prompted Torusto rethink his views on industrial pollution.
Prompted by his children, Torus began to explore new perspectives. His friendSandy Strand, Hermes’s VP of E&F, had long been interested in the potentialbusiness opportunities described by leading advocates of the integration of ecologyand commerce (see Figure 7.12 "Hermes Microtech Organizational Chart (Partial)"for an organizational chart). Strand introduced Torus to the writing of suchthinkers as Paul Hawken, Amory Lovins, and William McDonough and the work oforganizations such as The Natural Step, the Coalition for EnvironmentallyResponsible Economies, and the World Business Council for SustainableDevelopment. Torus learned about new business tools and strategies, includingenvironmental management systems, green design, and industrial ecology. Heheard from other CEOs about businesses in a wide range of industries that werefinding profit and competitive advantage through innovation and collaborationwith leading practitioners. Soon Torus joined Strand in the belief that Hermes couldrealize many business benefits by incorporating more environmental and socialfactors with traditional economic considerations into what author John Elkingtoncalled a new “triple bottom line.”
Chapter 7 Buildings
7.2 Greening Facilities: Hermes Microtech Inc. 456

Figure 7.12 Hermes Microtech Organizational Chart (Partial)
But where would they begin? Torus and Strand shared a long-term view of thetransitional process of moving their industry (and the world economy) toward thevision of a more sustainable condition. Neither man advocated rapid changewithout regard to cost. They continued to believe that their priority was economicsuccess and that building the business case for green business initiatives wasessential. They recognized that they were well ahead of most of their colleagues onthose issues and were pragmatic about the potential scope and pace of change,particularly within the managerial constraints of executive responsibility in apublicly traded company. They had limited time and attention to devote to a newstrategic initiative, capital resources were perpetually constrained, and thecompany lacked experience with many of the promising approaches. Yet theywanted to start somewhere—and steadily, if slowly, develop momentum fororganizational change.
Hermes’s Green Initiatives
Torus began by sharing his vision of the future with the company and the publicand declaring his support for prudent green business initiatives. His advocacy didnot require much of his time, but it provided crucial top-level support for the
Chapter 7 Buildings
7.2 Greening Facilities: Hermes Microtech Inc. 457

employees who would carry most of the responsibility for project implementation.Initial efforts would pursue incremental improvements toward clear, measurableobjectives. Those efforts would be supported by education and training,recruitment of skilled staff, and outside expertise where necessary. Hermes hadbuilt its success on innovation and rigorous quality management.
Torus set two initial priorities: (1) development of a new, more environmentallyfriendly line of chips and (2) a 20 percent improvement in energy and waterefficiency over five years. Those programs would have to pay for themselves withinfive years.
The green chip project would be implemented by the R&D and operations divisionsof the production department, headed by Executive VP of Production Christopher“Chip” Smith. In addition to traditional areas of performance improvement, thenew microprocessor had a design goal of using at least 15 percent less electricitythan the previous model, which would appeal to OEM buyers and consumersbecause it would extend the battery life of portable devices such as laptops and cellphones. Manufacturing process improvements would reduce waste and toxicpollution. Hermes would advertise these attributes to differentiate their product,attract environmentally conscious consumers, and boost sales, thereby (hopefully)paying for the effort.
The energy and water efficiency effort would be implemented by the facilitiesmaintenance division of the E&F department and the operations division of theproduction department. The program would pay for itself through avoided costs.The program would be headed up by Heather Glen, then a special assistant toStrand. At the time, Glen was a bright young electrical engineer and recent MBAgraduate who had sought a position with Hermes because she had heard about thecompany’s greening efforts and wanted to work in that field. She had been atHermes for one year and had spent most of that time pulling together an overviewof all its fabs’ environmental performance and energy and water use. She had alsoinitiated a pilot program to save energy through lighting retrofits at the company’sheadquarters and two other office spaces, which were successful though small inscope.
Initial Efforts: The F3 Fab Energy Survey
Strand hired a team of consultants led by Rocky Mountain Institute (RMI), anonprofit research and consulting organization. He had seen a lecture by AmoryLovins, RMI’s CEO and a resource efficiency pioneer, in which Lovins describedRMI’s energy-efficiency work in fabs that saved up to half of the HVAC energy cost-effectively. He invited Lovins to meet with Torus, who agreed to a pilot effort at
Chapter 7 Buildings
7.2 Greening Facilities: Hermes Microtech Inc. 458
Hermes’s F3 fab near Dallas, Texas. Glen was designated project coordinator andliaison with RMI.
F3 was chosen because it was one of the most energy-intensive fabs in the company,water costs were relatively high, and a significant expansion was planned. Thefacility was built in the early 1970s by another firm and had been acquired byHermes in the late 1980s. A renovation called Phase I was done in the late 1990s toaccommodate a new production line, with only minor changes to the original HVACsystem. A new addition was planned with another clean room and dedicated HVACutilities, called Phase II. The initial drawings for Phase II had been completed byExpedia Design Company, Hermes’s long-standing architectural and engineeringdesign vendor. EDC was a fab design vendor to several firms in the industry and hada reputation for speed and competitive fees.
The RMI consulting team was led by Bill Greenman, an architect with an MBA and abackground in green design. Technical services were provided by Peter Rumsey andJohn Blumberg from Rumsey Engineers, an engineering design firm and frequentRMI partner that specialized in energy-efficient HVAC systems for clean rooms andgreen buildings. Their objective was to briefly survey F3 to identify existingopportunities for improvement and conduct a streamlined design review ofExpedia’s plans for the rehab. The deliverable was a report with a list ofrecommendations that would be practical but general in nature, rather than adetailed engineering study based on performance measurements. The report wouldnot include design plans or payback calculations. That introductory visit wasintended to identify potential areas of improvement for further investigation and toprovide an opportunity for the company and the consultants to learn more abouteach other. The limited scope of work also kept the consulting fees low.
Glen had been to the F3 site only once before, although she had worked with itsfacilities staff on her energy performance assessment. She flew from the company’sheadquarters in the Silicon Valley to Texas and met the RMI team there for the two-day survey. The team spent the first morning describing their approach and beingbriefed on the facility. They then toured the site for the rest of that day and muchof the second, working with the chief engineer and facilities staff to understandHVAC and controls systems, water use, and operating procedures. At the end of thesecond day, the team presented its initial conclusions and recommendations in ameeting attended by facilities staff, the site’s general manager Regina Shinelle,Expedia’s Phase II project manager Art Schema, and Strand, who flew in for theoccasion.
The RMI team estimated that low- and no-cost changes to F3’s current operationscould save up to 10 percent of the HVAC electricity almost immediately, such as
Chapter 7 Buildings
7.2 Greening Facilities: Hermes Microtech Inc. 459

utilizing evaporative “free” cooling in dry periods by operating all the coolingtowers in parallel at low speed to reduce reliance on electric chillers. Another 15–25percent savings were attainable with modest retrofit investments and estimatedpaybacks of two to three years, including pumping and fan system upgrades.Significant investments could reduce site HVAC energy use by more than 50percent, requiring changes to Expedia’s Phase II design to allow consolidation of thetwo clean rooms’ independent process cooling systems into a centralized plantserving both buildings. The estimated payback period would be at least five years ifit were to be conducted as a retrofit, once Phase II had been completed, or muchsooner if combined with proposed Phase II energy-efficiency improvements.
The RMI team noted that significant opportunities for energy efficiency were notcaptured by the current Phase II design. These included larger low-friction airhandlers with smaller fan motors and variable-speed drives, high-performancecooling towers, heat-reflective coatings on rooftop air intake ducts, and upgradedsensors and controls. Such measures would decrease HVAC energy use and cost by30 to 60 percent, with paybacks ranging from immediate to several years dependingon the measure. They would also increase construction costs, although somecomponent capital costs would fall due to smaller equipment such as motors andchillers. The extent of this proposed redesign would be significant and would takeweeks or even months.
With the exception of the centralized cooling plant, most recommended measureswould not interrupt production and involved no intrusion into the clean roomspace. All the suggested methods had been demonstrated within the industry butnot all in one place, and few had been tried within Hermes. RMI suggested thatHermes establish energy performance benchmarks to be used as guidelines for bothexisting fab operations and new design specifications.
Rumsey Engineers’ Blumberg worked on water efficiency measures and proposed amethod for reclaiming wastewater for evaporative cooling. But when heinvestigated techniques for reusing some of the acid rinse water that drained froma tool, the production manager rebuked him for interfering with manufacturingmatters and the idea was dropped.
The Phase II review also noted that Expedia’s design was an almost exact replica ofanother Hermes fab that was more than ten years old, which itself was based onblueprints from the 1970s. That became apparent when the team asked about apiping diagram showing an unusual zigzag in midair, and a facilities engineernamed Steve Sparks replied that there was a structural pillar in that location in thefab these plans were drawn from—a pillar absent in Phase II. It did not appear to the
Chapter 7 Buildings
7.2 Greening Facilities: Hermes Microtech Inc. 460

RMI team that any performance improvements had been incorporated into thesuccessive iterations of that design.
Such “copy exactly” practices were common in the microelectronics industry.Microchip manufacturing was extremely complicated. The sequence involvedthousands of process variables and chemical interactions that were so complex as todefy full comprehension. Performance parameters and specifications were exacting,as minor deviations could be disastrous, and if problems occurred they needed to beisolated and identified. Time-to-market deadlines were unforgiving, and meetingthem required an extraordinary level of control over process variables. Therefore,when something worked, it was copied exactly. A pilot production line for newproduct development was essentially “cloned” in numbers to create a high-volumemanufacturing facility. That mind-set shaped all aspects facilities design, even areasoutside the clean room that did not require such stringent inflexibility. “Copyexactly” reduced fab design effort, time, and cost but also hindered the adoption oftechnological and process improvements, including energy-conserving features.
Implementation Challenges
A few weeks after the survey in Texas, RMI and Rumsey Engineers submitted a briefreport (see Table 7.3 "Executive Summary of Recommendations from RumseyEngineers’ Review of Baseline Ventilation System Design for Hermes Office BuildingRenovation") summarizing their observations and recommendations, which wascirculated at the site and among senior management including Strand, Torus, andSmith. Meetings were held to discuss the recommendations and strategies forimplementation. The reactions were mixed.
Chapter 7 Buildings
7.2 Greening Facilities: Hermes Microtech Inc. 461

Table 7.3 Executive Summary of Recommendations from Rumsey Engineers’ Reviewof Baseline Ventilation System Design for Hermes Office Building Renovation
SpecificationsBaselineDesignCriteria
Proposed DesignCriteria—Larger Ducts
Proposed DesignCriteria—Larger Ducts and
Lower Face Velocity Air Handler
Duct specAvg.diameteris 36 in.
Avg. diameter is 40 in.Increase duct area 20%(reduce external pressureloss by 36%).
Avg. diameter is 40 in. Increaseduct area 20% and increase airhandler size (reduce total pressureloss by 36%).
Design facevelocity (fpm)
500 500 400
Design flow(cfm)
50,000 50,000 50,000
Design totalstatic pressure(in.)
4.5 3.6 2.9
Internalpressure loss(AHU; in.)
2 2.0 1.3
Externalpressure loss(ducting; in.)
2.5 1.6 1.6
Assumptions:
Building Size = 50,000 square feet (SF)
Design CFM = 50,000 cubic feet per minute (cfm)
Operating CFM = 32,500 cfm for proposed design (with VFD); 50,000 cfm for basecase (without VFD)
Operating hours per year = 3,560 (10 hours per day)
Chapter 7 Buildings
7.2 Greening Facilities: Hermes Microtech Inc. 462

SpecificationsBaselineDesignCriteria
Proposed DesignCriteria—Larger Ducts
Proposed DesignCriteria—Larger Ducts and
Lower Face Velocity Air Handler
Fan efficiency(%)
70 70 70
Motor efficiency(%)
90 90 90
Operating facevelocity (fpm)
500 400 400
Operatingflow (cfm)
50,000 32,500 32,500
Operatingtotal staticpressure (in.)
4.5 2.0 1.7
Internalpressure loss(AHU; in.)
2 1.1 0.8
Externalpressure loss(ducting; in.)
2.5 0.9 0.9
Fan efficiency(%)
70 70 70
Motor efficiency(%)
90 90 90
Assumptions:
Building Size = 50,000 square feet (SF)
Design CFM = 50,000 cubic feet per minute (cfm)
Operating CFM = 32,500 cfm for proposed design (with VFD); 50,000 cfm for basecase (without VFD)
Operating hours per year = 3,560 (10 hours per day)
Chapter 7 Buildings
7.2 Greening Facilities: Hermes Microtech Inc. 463

SpecificationsBaselineDesignCriteria
Proposed DesignCriteria—Larger Ducts
Proposed DesignCriteria—Larger Ducts and
Lower Face Velocity Air Handler
Motor HP 60 50 50
Motor VFD No Yes Yes
Annualoperatinghours
3,560 3,560 3,560
Annual energyuse (kWh)
149,000 44,000 37,000
Annual energycost ($)
22,350 6,500 5,550
Assumptions:
Building Size = 50,000 square feet (SF)
Design CFM = 50,000 cubic feet per minute (cfm)
Operating CFM = 32,500 cfm for proposed design (with VFD); 50,000 cfm for basecase (without VFD)
Operating hours per year = 3,560 (10 hours per day)
Case 1 Case 2 Case 3
Baselinedesign
Proposeddesign—larger
duct case
Proposeddesigncost (orsavings)
Proposeddesign—larger
duct andlarger air
handler case
Proposeddesigncost (orsavings)
Capital costs
Ductcost ($)
120,000 130,000 10,000 130,000 10,000
Chapter 7 Buildings
7.2 Greening Facilities: Hermes Microtech Inc. 464

Case 1 Case 2 Case 3
Baselinedesign
Proposeddesign—larger
duct case
Proposeddesigncost (orsavings)
Proposeddesign—larger
duct andlarger air
handler case
Proposeddesigncost (orsavings)
FanmotorsVFD cost($)
10,000 10,000 10,000 10,000
Airhandlercost ($)
60,000 60,000 0 63,000 3,000
Marginalcost ($)
20,000 23,000
Operating costs
Fanmotorenergycost/y($)
22,350 6,500 (15,850) 5,550 (16,800)
Payback
$20,000 ÷$15,850per yr. =1.3 yrs.
$23,000 ÷$16,800/yr. = 1.4yrs.
ROI$15,850 ÷$20,000 =79%
$16,800 ÷$23,000 =73%
The RMI team had been greeted with initial skepticism by the site’s facilities staffmembers, who were wary of outside interference, had never heard of RMI, and wereconfused about the unusual nonprofit-corporate consulting partnership. ChiefEngineer Tom Dowit had been a particularly reluctant participant. It was rumoredthat Dowit had called the survey “just another far-fetched scheme of thoseenvironment division idealists” that was going to cost his facilities division moneyand distract him from his primary job of ensuring that the production divisioncould maximize output. He was openly skeptical during RMI’s initial presentations,although as the survey progressed, he grudgingly acknowledged the value of someof the team’s observations, stating at one point that he would have made some ofthe same improvements if he’d been given permission and funding. But he grew
Chapter 7 Buildings
7.2 Greening Facilities: Hermes Microtech Inc. 465
defensive—and at one point openly derisive—during the final presentation as theteam described opportunities to save tens of thousands of dollars.
Glen realized that Dowit might have feared that the consultants were making himlook bad by finding large cost savings he had not uncovered himself in recent years.But she also understood why he might have taken a highly cautious approach tonew techniques. The facilities engineering staff had a difficult job, with a great dealof responsibility for maintaining highly complex and sensitive productionequipment. They had limited input into tool selection and operation, yet whensomething went wrong, they often got the blame. The facilities department budgetwas constantly squeezed, pressuring engineers to cut corners. Many productionmanagers viewed facilities as an overhead cost center that played a subordinatesupport role to manufacturing’s revenue generation.
The rest of Dowit’s staff agreed that many of the recommendations were technicallyfeasible and had already successfully implemented some operational changes sincethe visit. Their initial skepticism about “a bunch of academics who were cominghere to write on blackboards and waste our time” subsided over the course of thesurvey as the RMI team’s skills became apparent, and most people quickly came torespect the consultants’ abilities and ideas. The staff would need additional moneyfor retrofits to capture further savings. A few of the consultants’ ideas had beensuggested in the past by site facilities staff, including measures used at otherHermes fabs, but most had been rejected because they did not meet the site’srequirement that retrofit investments have a maximum payback period of eighteenmonths.
Facilities Engineer Steve Sparks enthusiastically supported the energy-efficiencyefforts and confided in Glen. He lamented the inefficiency of F3’s older equipment,pointing out that Dowit kept it running on a “shoestring budget.” Dowit blamed thespending constraints on the comptroller, but Sparks suspected that Dowit was alsocurrying favor with the production department by minimizing O&M spending.Sparks had worked at another fab just after Dowit had left there as chief engineer(the same facility Expedia had used as a template for Phase II). Sparks thought thatDowit’s cost cutting might have helped him get promoted to this position at F3, butit had also run down the mechanical systems and left his successor with deferredupkeep costs. “To be fair,” Sparks added, “Dowit is not unusual in this carefulapproach, he’s good at it and he has been rewarded for it. This is typical of thefacilities culture at Hermes.”
F3 General Manager Shinelle had little interest in any project that divertedattention from production and no interest in slowing down the Phase II expansion.She did not meet the RMI team until their final presentation and did not say much
Chapter 7 Buildings
7.2 Greening Facilities: Hermes Microtech Inc. 466

then or in subsequent meetings; what she did say tended to agree with Dowit. “Thisfacility works, and energy is 2 percent of the cost of our chips,” she said. “I can’tspend time worrying about it. We need to use our limited investment capital to getnew, high-quality products quickly to market.” Glen had the impression thatShinelle participated only reluctantly and would not have done so at all if it wasn’tclear that Strand had requested she host the pilot energy survey. Ultimately,Shinelle agreed to direct Dowit’s staff to select “a few” of the more cost-effectivemeasures that met the site’s eighteen-month payback criteria, and she wouldapprove those facilities funding requests.
Nevertheless, Shinelle refused to make any changes to the Phase II design thatwould slow the project timeline. Nudged by Strand, she directed Dowit to checkwith Expedia and see if there was still time to order more efficient motors than theinexpensive but relatively low-efficiency types specified in the design—as long asthe cost premium did not exceed 10 percent. “The production division can’t affordto pay more for this expansion,” she insisted. “We lose tens of thousands of dollarsof sales revenue every week that we delay getting Phase II manufacturing up andrunning. We have to stay within budget and on schedule.” Glen understood thatShinelle’s annual performance bonus was probably tied to that very achievementand that in any event the facilities division would be paying the utility bills.
Expedia’s Art Schema had been unsure how to respond to the design reviewcomments during the on-site presentation. Although his primary clients Shinelleand Dowit seemed to think that the RMI team’s input wouldn’t change much ifanything about Phase II, Schema could see that Strand supported the consultants’efforts. Schema limited his comments to polite expressions of interest in thefindings and promised to give them detailed consideration.
Within a week of receiving the RMI report, Schema sent a critique of the designreview to F3, and Shinelle e-mailed copies to Glen and Strand. Expedia’s point-by-point response acknowledged the merit of a few of RMI’s suggestions but dismissedmost of the recommendations as too costly, impractical, or impossible. The tenor ofthe response was that half of RMI’s recommendations were off-base and the otherhalf were nothing new to Expedia. Schema’s cover letter read in part: “Expediaprovides superior reliability and security. Our architects and engineers have builtour close relationship with Hermes by delivering economical designs that work, asproven in previous projects. We leverage our skills and experience to consistentlydeliver low bids and rapid turnaround times, which benefit both Hermes andExpedia. We are open to discussions about changes to design criteria at any timewith you, our valued clients.”
Chapter 7 Buildings
7.2 Greening Facilities: Hermes Microtech Inc. 467
Shinelle defended Expedia’s approach and service in her attached e-mail. “Expediahas always been there for us and has never let us down. They have played a key rolein Hermes’s agility and speed in product development and launch. Let’s not mess upa good partnership with untested ideas.” It occurred to Glen that both Shinelle andSmith had risen through the ranks of the production department boosted byreputations as star managers of fab construction projects—success stories thatExpedia had helped build. In addition, Shinelle’s product quality and yield record atF3 was unmatched across Hermes’s manufacturing sites for its consistency, and shehad a reputation for bringing new products to market very rapidly.
Mixed Results
Six months later, Glen and Strand regarded the F3 survey as only a partial success.On the upside, technical results were positive. F3 facilities staff had successfullyimplemented most of the RMI team’s low- and no-cost recommendations. Sparksand his colleagues were impressed by the new techniques, welcomed corporate-level support for investment in system improvements, and were openly supportiveof the energy-efficiency efforts. They convinced Dowit to request that the RMI teamreturn to conduct more detailed analysis of some of the more involvedrecommendations. The fact that Torus had mentioned the pilot effort at F3 in acompanywide webcast address, praising the site manager and chief engineer’sefforts, helped their cause. But unlike the first visit, which was underwritten byStrand’s office, subsequent fees would have to come from the site’s operatingbudget. Shinelle agreed to allocate them in principle but said no such expenditurescould be undertaken until the following quarter at the earliest.
On the downside, F3’s Phase II expansion project went ahead as designed. Somemotor efficiency upgrades were incorporated at the last minute at minimal extracost, but the scramble to change equipment orders at a late stage in a tight scheduleresulted in some grumbling by Dowit and Schema.
Strand’s environment department had engaged the RMI team to conduct similargeneral surveys at two more sites in Oregon and the Silicon Valley, accompanied byGlen in each case. The visits occurred three months after the F3 survey, and theteam’s recommendations had been submitted but not acted upon. Those visits hadparalleled the experience at F3. The team worked with facilities division staff onenergy improvements that did not risk interfering with production. (Manufacturingwater efficiency was no longer investigated following Blumberg’s rebuke at F3.)Technical efficiency opportunities were similar; so, too, were the politicaldynamics. Some facilities staff members were skeptical, but receptivity increased asawareness of the RMI team’s capabilities spread by word of mouth and directexperience. Production staff members were more wary; the word going around thedepartment was that the energy program was an expensive nuisance.
Chapter 7 Buildings
7.2 Greening Facilities: Hermes Microtech Inc. 468

Expedia seemed to be torn about the energy program. Its design work was directlychallenged by the consultants’ critiques, its managers’ personal networks andalliances were aligned with Hermes’s production department (the one that hired it),and its designers were not keen to devote a great deal of effort to restructure itscost-effective copy-exactly approach. However, Expedia also wanted to please itsclient and recognized that Hermes’s CEO was interested. Glen noted that ArtSchema, the Hermes account manager at Expedia, had avoided directly criticizingthe RMI team’s work—that had been left to subordinates—and had signaled hisopenness to discussing new frameworks for doing business. In a brief aside as ameeting broke up, he told Glen, “We can design more energy-efficient systems;Hermes has never asked us to.”
The Change Agent’s Dilemma
Glen saw her task as essentially intrapreneurial. She was trying to harnessresources to realize a new vision of the future. She marveled at how difficult it wasto be innovative even in a company built around the creation of new ideas,techniques, and products. She faced a big challenge in trying to change business asusual, pushing against a persistent headwind of inertia and resistance to newmethods. The semiconductor industry was typified by a very cautious andconservative corporate culture, stemming from exacting technical and processrequirements, safety risks posed by hazardous materials, the high cost of downtime,and brutal competition in a fast-moving marketplace. (It wasn’t for nothing thatIntel CEO Andy Grove’s book was titled Only the Paranoid Survive.)
Glen had to persuade many people to change the way they did things, both withdifferent departments at Hermes and with outside vendors. She sometimes felt likean outsider herself during the site visits; even colleagues from the facilities divisionof her own department viewed her as an environment division staffer from thecorporate office. Glen was grateful that the RMI team could back up its claims withpractical expertise. Her position afforded little formal authority to dictate change,although executive endorsement lent her informal authority, and her trainingprovided only limited credibility with facilities engineers. The RMI team lackedauthority but was building credibility with demonstrated skills, one site survey at atime, complementary to her strengths.
Her colleagues knew she had Strand and even Torus backing her, but executive timeand attention was very limited, she was left to her own means to manage theprocess and implement change. Glen sensed that the production-focused skeptics inthe opposing camp would respond positively to the energy program when she orStrand were present but would then return to the status quo as soon as theefficiency advocates weren’t looking, hoping they could wait it out until the CEO
Chapter 7 Buildings
7.2 Greening Facilities: Hermes Microtech Inc. 469

retired and the issue dissipated. She recalled the Chinese saying about that attitudeamong middle management: “Heaven is high and the Emperor is far away.”
A New Opportunity: The Green Headquarters Building
Despite his authority as CEO and personal credibility as a successful manager andleader, Alden Torus could not afford to dedicate much political and social capital toany efforts not directly focused on commercial success. Yet his interest insustainable business opportunities remained strong, and he wanted to choose hisinterventions carefully to provide the greatest leverage for change. If he was goingto risk his reputation and get out ahead of his colleagues on an unfamiliar issue, hewanted it to count. He was pleased with the early phases of the energy and waterefficiency efforts, although it was becoming clear that the process of organizationallearning and transformation would not be rapid. He wanted to expand awarenessof—and attention to—environmental dimensions of commerce that went beyondusing resources more efficiently.
One strategy under consideration was to establish companywide emissionsreductions targets for gases that contributed to climate change. Specified targetscould provide coherence to energy-efficiency efforts across the company’s facilitiesand prevent individual sites from “cream skimming” only those opportunities withthe most attractive paybacks—an approach that often rendered longer payoffmeasures uneconomic under current investment criteria. Torus suspected thatbundling projects for investment would increase the average payback periods butyield larger overall emissions reductions. Internal emissions trading might furtherreduce the total cost of such efforts by directing funds to the highest-leverageopportunities.
Torus saw a good opportunity in the company’s decision to consolidate thecorporate headquarters and western US sales offices into one location. He asked theboard of directors to support construction of a green building and invited RMI’sLovins and Greenman to the board meeting to describe the potential benefits. Greenbuildings used more environmentally friendly materials and design andconstruction practices and typically reduced utility bills by as much as 50 percentthrough energy and water efficiency. They did not have to cost more to build thanconventional buildings, although they required careful design attention. The boardwas intrigued by research indicating that worker productivity typically increased ingreen buildings by an average of 5 percent, which would be even more valuable tothe company than eliminating the utility bills entirely.
“But what constitutes ‘green’ building?” the board asked. Lovins and Greenman hadsaid that each project was unique, and there were no simple standards to apply to a
Chapter 7 Buildings
7.2 Greening Facilities: Hermes Microtech Inc. 470
design, no Band-Aids that would make it green. However, third-party accreditationwas available through the LEED rating system established in 2000 by the US GreenBuilding Council (USGBC), a respected consensus coalition of stakeholders from allaspects of the building industry. LEED certification required that best practices beused in certain core aspects of building construction and operation. It provided alist of techniques and practices, most of which were rooted in existing industrystandards. Designers and builders could incorporate features chosen from thismenu of options to earn points toward certification. LEED provided a framework foraction with defined objectives and established criteria for what was “green.” USGBCdata from scores of completed projects indicated that the basic level of certificationadded 0–5 percent to a building’s initial cost (not factoring in typical operating costsavings), and the primary factor in that variability was the skill and experience ofthe design-build team. LEED was well received in the industry, grew rapidly, andwithin three years of its release was being applied to more than 5 percent of allplanned commercial and institutional construction and major renovation projectsin the United States.
The board approved the project. Torus believed the building would provide a potenteducational symbol of the business benefits of green design and serve as a tool fororganizational learning. He thought it likely that the new headquarters’ innovativedesign approaches would appeal to Hermes’s corporate culture, particularly that ofthe production department. He liked the idea that strategic planning and newproduct conceptual development would occur in a unique facility.
As with other Hermes facilities, the new office building development was beingmanaged by the production department. (Most Hermes buildings projects wereproduction related, so to simplify administration the production departmentoversaw all new construction.) Torus had decided to make the new headquarters agreen building after the project had already begun. The plan had been tocompletely renovate a four-story, fifty-thousand-square-foot office building in theSilicon Valley. The project management team had been designated, and the designand construction contractors had already been chosen based on their conceptualdesign: Hermes’s traditional partners, Expedia Design Company and AdvancedBuilding Services (ABS). Art Schema was the Expedia project manager, and WilliamDitt was the ABS construction manager. Both had worked extensively with Hermesfacilities in the past but had minimal experience with green building techniques.The next project milestone was to be a review of Expedia’s initial plans for thebuilding core and utilities, but Torus had put the process on hold when he decidedto seek board approval to make the renovation a LEED building project. It was nottoo late to change the design to meet that new objective.
Torus decided to build on both the momentum of the energy-efficiency programand RMI’s program. RMI and Rumsey Engineers would be retained as design
Chapter 7 Buildings
7.2 Greening Facilities: Hermes Microtech Inc. 471
consultants, based on their growing credibility in the company and reputation asleaders in the green design field. Glen was tasked with leading the greening efforttoward the goal of attaining LEED certification and continuing her role as liaison tothe RMI team.
Executive VP of Production Chip Smith had chosen Regina Shinelle as projectmanager and Tom Dowit as chief engineer. Glen could not help wondering whetherthat was a positive development and what Smith’s true intentions were. Smith hadnot revealed much about his opinion of the greening efforts; although he actedsupportive in Torus’s presence, on most issues he embodied the productiondepartment’s perspective. Now Glen would be working with the two people who hadpresented the most stubborn resistance to her efforts and who did not share herpriorities. If the renovation failed to attain LEED certification or performed poorly,it would be a major setback to the sustainability program. But if the collaborativeeffort resulted in an economical, high-performance LEED building, it would bringpositive recognition to all participants and perhaps create greater buy-in forsustainability efforts among the skeptics companywide.
Glen was pleased that Steve Sparks had been named facilities director for the newheadquarters. He had been the most enthusiastic supporter of the efficiency effortsat F3, and his persistent efforts had played a key role in successful implementationof the recommended measures, despite more hesitant colleagues. Glen hadsuggested to Strand that Sparks would be an ideal internal candidate for theposition. Sparks was excited about the promotion and the opportunity to be moreinvolved in green design.
Greening Strategies
Glen’s primary proposal as the project’s sustainability coordinator was to arrangean integrated design process called a charrette. This multidisciplinary-facilitatedmeeting would bring together project participants, stakeholders, and outsideexperts in the same room (often around the same table) at the earliest practicalpoint in a project. The goal was to clarify desired outcomes, identify obstacles, anddevise strategies for attaining the best overall result. That integrative processhelped participants to understand their differing perspectives and incentives,exchange ideas, build trust, work out problems, and create consensus. Theapproach took some time, but the investment of extra effort could significantlyimprove plans and specifications, streamline construction, reduce total costs, andincrease building performance. “An axiom of design is that all the big mistakes aremade on the first day,” Greenman told Glen. “Most of a building’s life-cycle cost isdetermined by the tiny fraction of the budget spent on initial design. Carpentersknow it makes sense to measure twice and cut once. A charrette helps us to dothat.”
Chapter 7 Buildings
7.2 Greening Facilities: Hermes Microtech Inc. 472
The charrette was to last for two days and would be held in Hermes’s R&D centerconference facilities. Hermes R&D staff had used similar techniques for productdesign, but it had never been tried in a facilities project. Participants commentedthat never before had all the parties spanning the service life of a Hermes buildingproject met together simultaneously.
The meeting would begin with team introductions, followed by presentations ongreen design and LEED by the RMI team (which had obtained excellent results inpast charrettes). Glen planned to describe the list of LEED requirements and thecredit areas that she thought were best suited for exploration. There were severalareas she identified as readily achievable and many more worthy of deeperexploration. The group would pick an initial set of LEED credit areas to pursue. Thatwould take much of the first day.
The most detailed technical subject would be a collective consideration of HVACdesign alternatives. Rumsey Engineers had reviewed the preliminary design drawnup by Expedia before the green objectives were set—now called the baseline case.Rumsey had submitted a proposal outlining recommendations for increasing theventilation system efficiency. It involved spending more money on construction tosave money on operation. The executive summary of recommendations andestimated costs and benefits was to be circulated to each participant. Thatdiscussion would begin on the first day and carry over to the second day ifnecessary.
The last and most difficult topic, but perhaps the most important, would concernpotential policy and procedural changes that might foster more efficient facilitiesinvestments. Hermes’s traditional approach to requiring, financing, designing,building, and operating its facilities was functional but not optimal. The energy-efficiency program of retrofit improvements had proven that there was widespreadwaste of energy and capital within the company’s facilities. It had also highlightedaspects of the process that hindered improvement. It was in the interest ofmanagement and shareholders to create a more efficient process.
Most of those issues were not unique to Hermes but were characteristic of theindustry. Buildings were made in a collective but not well-optimized productionprocess. As Greenman put it, “If a camel is a horse designed by a committee, thanmost buildings are camels.” Some decisions produced short-term savings for certainparticipants but degraded building performance or imposed long-term costs on theowners and occupants. Usually those choices made business sense to each decisionmaker and were not intended to cause problems elsewhere. Those challenges were afunction of the rules of the game, and it was worth exploring whether changing anyof those rules would produce better buildings. Glen’s discussion would examine the
Chapter 7 Buildings
7.2 Greening Facilities: Hermes Microtech Inc. 473
participants’ roles, incentives and disincentives, and the impact of financial andinvestment criteria. It had the potential to make some participants uncomfortablebut also to yield significant process improvements.
Those thoughts were racing in Glen’s mind on the night Torus had approved thecharrette. She was excited and a little anxious as she set out to draft a meetinginvitation and brief description. She hoped that the charrette would reduce ratherthan inflame any latent (or blatant) tensions and conflicts among participants.Greenman had assured her the process usually worked surprisingly well, but shecould see how achieving consensus might also seem like herding cats. Sheconsidered the cast of characters she now had to work with, each representing adifferent organization or department, and made notes summarizing herinterpretation of each participant’s perspective going into the project.
She needed to identify the obstacles and opportunities in the group dynamic andselect strategies that provided the highest leverage for change. The CEO had offeredher the opportunity to try a few new approaches and policies that he couldannounce in his introductory remarks. She thought that a small number of well-targeted measures could “change the rules of the game” for key participants in thedesign-build process by providing different incentives or by removing importantdisincentives. That would help steer the group’s decision toward a successfuloutcome for this project, and perhaps for future facilities as well.
Charrette ParticipantsHermes Personnel
• Regina Shinelle, project manager, production department,facilities division. “I’ve got to get this facility built on time and underbudget. The faster the construction and the lower the capitalexpenditure, the bigger my bonus. I’ve relied on Expedia Designcontractors in the past for prompt and reliable service. There is noroom in this process for trial and error.”
• Tom Dowit, project chief engineer, environment department,facilities division. “It’s my job to ensure facility operations supportproduction, while minimizing risk and cost. I don’t have the money orleeway to do anything expensive or risky. I’ve got to maintain thesystems and pay the utility bills, and if my costs go down this year, mybudget gets cut next year. Keep it simple, and if it ain’t broke don’t fixit—that’s my philosophy. I’ve been doing this a long time, and myapproach works. That’s why I’ve been asked to oversee the design andconstruction process and contractors for this new building project. Iuse the value engineering process to review all aspects of design andconstruction, and either approve or reject proposed elements to
Chapter 7 Buildings
7.2 Greening Facilities: Hermes Microtech Inc. 474

control costs. Sure, there are some opportunities for improvement, butthis green design stuff gets too much attention, costs too much, andslows me down. What a pain in the neck.”
• Steve Sparks, headquarters facilities director, environmentdepartment, facilities division. “I will be responsible for the newbuilding’s operations and maintenance once it is completed. I amexcited to work in a green building. I’ve seen some of those techniqueswork in practice and I believe there is great potential for facilitiesimprovements. I’m surprised I was asked to participate in this designmeeting. Usually the production department calls us when a facility isbuilt, hands us the keys at the ribbon-cutting, and says ‘keep it cleanand running.’ Or they tell us ‘new fab tools are going online in twoweeks, make sure they have power and water.’ I look forward to havinga say in decisions that affect my job.”
• Susan Legume, comptroller, production department. “My priorityis cost control. I’ve got my eye on the bottom line and my mind onshareholder value. Capital spending is one area where costs can spiral,especially construction projects with multiple contractors. My job is toride the project manager hard and squeeze the vendors harder. Theycan really nickel-and-dime the budget away if we don’t watch out. Thevalue engineering process gives us a chance to rein in runawayspending by cutting unnecessary purchases from the design orconstruction.”
Design-Build Contractors
• Art Schema, project manager for Expedia Design Company. “Wedeliver reliability and security. Our architects and engineers have builtthis business by delivering economical designs that work, as proven inprevious projects. We leverage our skills and experience toconsistently deliver low bids and rapid turnaround times, which helpsus win projects. Doing anything differently increases our costs;unfamiliar design techniques increase our risk exposure and projectexpense. As designer of record for this project, we would have tocarefully consider whether we could sign off on any exotic features orplans. Of course, customer service is our number one priority andHermes is a valued client, so we are open to whatever we are asked todo, as long as it is clearly defined and we are compensated for ourefforts.”
• William Ditt, construction manager for Advanced BuildingServices. “I cut this bid to the bone to get this contract. We’ll make upfor it by cutting a few corners, based on my experience where it will dothe job. I’ve got to maintain cash flow by getting this done as fast aspossible so I can move on to another project. I rely on my supplier
Chapter 7 Buildings
7.2 Greening Facilities: Hermes Microtech Inc. 475
network to get me the parts I need, quickly and at low cost. Any delaysrisk cutting into my thin profit margin and my tight schedule.”
Green Design Consultants
• Bill Greenman, consultant, Rocky Mountain Institute. “Nonprofitorganizations such as RMI can collaborate fruitfully with businesses tomake money while protecting the environment. We are designconsultants and process facilitators. Although we do not ourselvesprovide architectural plans or engineering designs, our partnerRumsey Engineers can do that. We can help with LEED certification andsuggest ideas and best practices that we’ve seen used successfullyelsewhere. Standard design-build practices do not produce greenbuildings. Green building is new to the industry as a whole, and wehave experience with these innovative techniques. Green building canbe profitable, but each case is unique and requires increased designeffort and careful project management.”
• Peter Rumsey, consultant, Rumsey Engineers. “We specialize inwhole-systems energy-efficient design. We can deliver equivalent orsuperior HVAC performance at lower energy use and reduced cost ofownership (although our systems might cost more up front to build). Itis always best to incorporate green techniques early in the projecttimeline, starting with the initial phases of design. All too often we’recalled in at the last minute when the plans have been completed and itis very difficult to make changes, at least at low cost and minimalhassle.”
Environment, Entrepreneurship, and Innovation: SystemsEfficiency Strategies for Industrial and Commercial Facilities
Many managers are unaware of the strategic advantages and cost savings possiblethrough systems analysis applied to material, energy, and water use in buildingdesign and operation. This section provides whole-systems strategies for improvingresource efficiency in industrial and commercial buildings.This background notewas prepared by Batten fellow Chris Lotspeich in collaboration with author AndreaLarson. Andrea Larson and Chris Lotspeich, Environment, Entrepreneurship, andInnovation: Systems Efficiency Strategies for Industrial and Commercial Facilities, UVA-ENT-0052 (Charlottesville: Darden Business Publishing, University of Virginia, 2008).Note can be accessed through the Darden Case Collection athttps://store.darden.virginia.edu. Systems thinking and integrated,multidisciplinary methods are explained that can stimulate innovation in both theequipment (technical) systems that make up facilities as well as the human(organizational) systems involved in the design-build-operate process. Identifying
Chapter 7 Buildings
7.2 Greening Facilities: Hermes Microtech Inc. 476
and using key leverage points and systemic synergies can dramatically increase theperformance of buildings and the groups of people who make and run them. Inpractice those approaches have saved money, reduced environmental impacts,improved worker health and productivity, attracted new employees, greatlydecreased operating costs while adding little or nothing to initial costs, and in somecases even decreased capital costs.
Resource Efficiency: Doing More with Less
Resource efficiency (also called “resource productivity” and “eco-efficiency”)provides cost-saving methods for reducing a company’s environmental and healthimpacts. Businesses consume resources to deliver goods and services and to createsocioeconomic benefits. Primary resource inputs are materials, water, and energy.Their use directly links industrial activity to the earth through extraction,pollution, and waste generation. (Labor, money, and time are also economic inputs,although environmental and health impacts associated with their use are generallymore indirect; we will focus on physical and energy resource use.) In any firm thatmanages for maximum efficiency, the life-cycle resource intensity andenvironmental “footprint” of a given product or company is evaluated across thesupply chain, from the natural resource base through manufacturing and use toultimate disposal or recycling.
Ideally resource efficiency enables the delivery of goods and services of equal orbetter quality while reducing both the costs and impacts of each unit of output.Systems efficiency strategies go beyond conservation by boosting productivity anddifferentiating the firm. When efficiency measurement stimulates innovation,doing more and better with less fosters revenue growth. Innovation and theentrepreneurial initiative that drives it result in the delivery to market of newgoods and services with superior performance or other attributes that out-competeexisting products and industries.
This Schumpeterian “creative destruction” (the creation of new products,processes, technologies, markets, and organizational forms) is fundamental tocapitalism. A capitalist economizes on scarce capital resources by investing toimprove productivity. The resource intensity of each unit of production tends to fallover time as knowledge and technology improve. Those dynamics have alreadyincreased resource productivity. For example, in the United States the amount ofenergy consumed per dollar of GDP has decreased in all but five of the years since1976—for a total drop of more than 35 percent between 1973 and 2000. Thatimprovement is good, but the reality is that standard practices have tended toprompt relatively incremental improvements. The potential for much greaterproductivity increases remains untapped, awaiting the systematic and synergisticapplication of best practices and better technologies. Unfortunately, market
Chapter 7 Buildings
7.2 Greening Facilities: Hermes Microtech Inc. 477
barriers and organizational behaviors maintain standard practices, thus hinderingprogress.
Overcoming those obstacles requires leadership, comprehensive strategies, andorganizational change, but radical resource efficiency can be achieved. Radicalresource efficiency results from effective management combined with innovativepractices. Systems thinking and end-use, least-cost analysis (discussed later in thissection) are essential conceptual frameworks for rapid improvement. Doing morewith less is a basic and accepted business objective and a central concept ofpractices such as total quality management. Thus resource efficiency measuresprovide a familiar, practicable, and visibly beneficial first step.
“Greening” Facilities: A Good Place to Start
Buildings are one of an organization’s primary interfaces with natural systems viathe impacts of materials, energy, water, and land use. Consequently, they deserveattention from both systems dynamics and corporate strategy perspectives.Buildings and facilities are ideal sites for initial resource efficiency efforts in mostcompanies. Every business uses buildings and pays literal overhead costs to keepthe roof up. Yet often overlooked are the simultaneous financial, environmental,and health leverage that buildings offer.
Most buildings are relatively wasteful of money and resources, compared withstate-of-the-art green building examples. Best practices can yield largeimprovements in building performance, occupant health and productivity, andenvironmental impacts. These benefits come with 30–50 percent lower operatingcosts and on average only 2–7 percent higher initial costs (and, in some cases,decreased capital costs). Those benefits have been widely demonstrated inenvironmentally preferable or “green” buildings certified by USGBC’s Leadershipin Energy and Environmental Design (LEED)2 rating system, and the USDepartment of Energy’s Energy Star label.
There are many areas for performance improvement. The opportunities discussedhere are primarily but not exclusively in energy use. Typically, those are the easiestopportunities to identify and offer the quickest benefits at the least risk to mostbusinesses. The major categories of energy savings opportunities include lighting;motors; pumps and fans; heating, ventilation, and air-conditioning (HVAC) systems;building envelope; thermal integration of temperature differences and heat flows;load management; measurement and controls; and operational techniques. Keep inmind that the same systems thinking can be applied to other dimensions of acompany’s operations, including its supply chain.
2. A rating system developed bythe US Green Building Councilto define the performance ofgreen buildings; buildings canbe LEED-certified Basic, Silver,Gold, or Platinum dependingon their performance against aset of criteria.
Chapter 7 Buildings
7.2 Greening Facilities: Hermes Microtech Inc. 478

Common resource efficiency opportunities in most building systems arequantifiable, proven, and relatively easy to understand and implement. Suchopportunities are widespread due to technological improvements and because thedesign-build process consistently produces structural and mechanical systems thatare relatively inefficient and overbuilt. Factories are particularly attractive subjectsbecause manufacturing is a resource-intensive enterprise. Offices and othercommercial buildings also offer potential. The economic and environmental gainsare greatest in new design and construction, but retrofit opportunities abound.
Implementing a suite of proven best practices and technologies carries a highprobability of yielding short-term cost-effective improvements. These measuresincrease profits directly, as each dollar of saved overhead goes straight to thebottom line. Although these savings convey more limited profit-growth potentialthan do sales, this oft-neglected frontier of cost reduction can add value at lowerrisk than launching new products and services, which only add to profits on themargin. In some cases, significant savings through more efficient resource use canmake additional, relatively inexpensive capital available for higher priorityinvestments.
Systems Thinking
Strategies discussed here are informed by systems thinking and the principles ofsystem dynamics. These representative approaches to technology, design, andmanagement have been successfully applied in a broad spectrum of facilities andcontexts. As we have discussed, systems can be technical or organizational.Buildings are “technical” systems comprising subsystems such as climate control,water and plumbing, lighting, and others. Buildings are designed, built, andoperated by “organizational” systems that include owners, architects, engineers,builders, tenants, and others. As with other manufacturing activities, thisorganizational system comprises different individuals, and teams execute aniterative process that results in a product (the building). Well-established systemsanalysis tells us that small changes at key nodes or input variables of complexsystems can result in large changes in system outcomes. Thus identifying and usinginsights about key leverage points can significantly increase the performance ofbuildings as well as the groups that make and run them.
Implementation strategies typically are directed at creating change by making thebusiness case for efficiency improvements and providing incentives for desiredpresent and future behavior. As the reader knows, not all approaches will yieldeconomic results in every context because conditions vary widely at differentfacilities and companies. There is no magic formula for success, nor can we providean exhaustive list of opportunities. Rather, this discussion is intended as an
Chapter 7 Buildings
7.2 Greening Facilities: Hermes Microtech Inc. 479
introduction to representative opportunities and to methods for realizing theirgreatest value.
Leadership, Management, Innovation, and Entrepreneurship
Realizing those potential benefits requires that standard practices be changed. It isa leadership and management challenge that involves entrepreneurial innovation.Building design, construction, and operation is a complex process involving manyparticipants, including developers, architects, contractors and subcontractors,clients, and end users. Greening that process encompasses design, engineering, andtechnology, and the management of information, money, and organizationalbehavior. The organizational learning value is high and spans a range of disciplinesand enterprise functions. The successful integration of the varied participantsinvolved in a building’s life cycle is a primary challenge to green buildingchampions and is perhaps the most influential factor in achieving radicalimprovements in building performance.
When it comes to adopting a green building design, differences between managersand leaders are also a consideration. Management strategies are arguably moreconservative than leadership initiatives. Managers typically seek stability and riskreduction as they help steer an organization toward defined goals. Managers tendto favor slower, more incremental change. In contrast, the more entrepreneurialleaders are innovation oriented and take greater risks to move an organizationfarther and faster toward end states that radically differ from the existing patterns.These leaders often are not formal, official leaders. They may emerge as leaders ofchange. Acting as a change agent is essentially entrepreneurial becauseimplementing significant organizational change requires vision and initiative, not arisk-reduction mind-set. Entrepreneurs have a vision of a new future reality andharness resources to realize that vision. Entrepreneurial leadership seeks to createinnovative change in a company’s products and services. Acting entrepreneuriallywithin one’s own organization is what consultant Gifford Pinchot III terms“intrapreneuring.”Gifford Pinchot, Intrapreneuring: Why You Don’t Have to Leave theCorporation to Become an Entrepreneur (New York: Harper & Row, 1985). See alsoElizabeth Pinchot and Gifford Pinchot, The Intelligent Organization (San Francisco:Berrett-Koehler Publications, 1996); and Gifford Pinchot and Ron Pellman,Intrapreneuring in Action: A Handbook for Business Innovation (San Francisco: Berrett-Koehler Publications, 1999). Sustaining innovation often requires organizationalchange, also potentially an innovative act.
A would-be change agent usually has limited resources with which to attain his orher objectives. He or she typically lacks formal authority over all the processparticipants whose cooperation is needed to reach a goal. Consequently, a systemsperspective is valuable. An intrapreneur can identify and focus on leverage points
Chapter 7 Buildings
7.2 Greening Facilities: Hermes Microtech Inc. 480

in the system to effect the most change with limited resources. Identifyingtechnical synergies can yield cost-effective performance improvements. (Examplesare discussed later in this section.) Influencing the decision rules of participants canshift organizational process outcomes. Persuasion can substitute for compulsion.Identifying benefits and incentives for the participant decision maker can helpbuild buy-in to the change agent’s approach.
Green buildings are innovative products with dramatically improved performancerelative to standard buildings. Those improvements are heavily dependent onimprovements in technical subsystems, such as energy and water use. They aredetermined by the actions and outcome of the organizational design-build-operatesystem, which is in effect the manufacturing process.
The economic benefits of greening facilities provide the strongest motivating factorand a common denominator for undertaking new practices involving disparateparties, unfamiliar methods, and the challenges of change. The dollar is theuniversal solvent, the value-neutral language of business. All participants can agreeto the goal of cost cutting, regardless of their beliefs or perspectives on theenvironmental and social aspects.
Initial successes in green building can free up resources and build stakeholderknowledge, buy-in, and confidence. These traits are useful for further, morechallenging steps toward sustainability, such as product and business modelredesign.
This is not to say that efficiency measures are easy—they are not. The processrequires unlearning old techniques and reforming the traditional process. Evenmodest changes can meet with significant resistance. But greening strategies useproven tools and techniques that can be discussed in quantifiable terms ofengineering and financial analysis, simplifying the challenge of implementing newways of doing things. Expert assistance is readily available, and successful systemsand buildings provide literal examples. Skeptical participants might believe thatcertain measures “can’t work here,” but they can be shown buildings where suchtechniques have worked in a wide range of climates and structures. The merits canbe presented with numbers rather than assertions.
Systematic Resistance
Green building is growing rapidly and moving into the mainstream of theconstruction industry. Nevertheless, many people continue to view it as a leading-edge activity and lacking standard practice, despite demonstrated benefits. Thediffusion of this innovation is still in its early stages. As with many innovations,
Chapter 7 Buildings
7.2 Greening Facilities: Hermes Microtech Inc. 481

organizational behavior is the crux of the issue and has a larger impact thantechnology. It determines whether or not resource-efficient decisions areundertaken and implemented. That should not be surprising. After all, the usualways of doing things seem to work. Buildings get built, their systems function,people occupy them and go about their business, and complaints are relatively few.Architects and engineers get paid and move on to the next project. Most of theparties involved are satisfied. If the system is not broken, why fix it?
Follow the Money to Find the Motives
Some might ask, if green building is so cost-effective, why isn’t more of ithappening in the free market? Surely if it were profitable, people would do it. But inthe workaday world, green building experience is lacking and schedule and budgetpressures limit the amount of effort that can be put into design and construction. Ifthe owner doesn’t ask for green features, it is up to another project participant topromote them. Champions of sustainable design face many obstacles toimplementing their ideas, both in the marketplace and even within their ownorganizations. Selling environmentally friendly approaches and equipment toclients, managers, and colleagues often remains challenging, especially if takingthose approaches or using that equipment asks them to do anything differently orspend more time and money. In addition, most design and constructionprofessionals have little or no training or direct experience in sustainable buildingtechniques. They don’t see much incentive to try something new if they think itmight increase the risk of a lost bid or an unhappy client. If common practices,habits, and perspectives don’t prioritize green techniques then, as the saying goes,it can be hard to teach old dogs new tricks.
The picture is changing rapidly. Public agencies, architects, interior designers,construction companies, and other professionals are increasingly realizing thebenefits of green buildings and are asking for—and getting—better results. Has itswept the country? No, but people are doing it and making money. There are manydemonstrated economic benefits to more sustainable real estate development, butthe problem is they don’t all accrue to the same parties. Some benefits aren’tcounted directly in our economic system, such as reduced environmental impacts.But most important, we don’t live in a free market; we live in the real world. Freemarkets exist only in theories and textbooks. Actual markets function under theinfluence of human and organizational behaviors and dynamics that prevent moreoptimal results.
In politics, it is said that if you want to know why something happens (or doesn’t),follow the money. The same is true in building design and construction. We mustlook more closely at the economic incentives (and disincentives) facing the various
Chapter 7 Buildings
7.2 Greening Facilities: Hermes Microtech Inc. 482

parties to the design-build process to understand why more buildings aren’t moresustainable.
Usually, several different companies and individuals are involved in a constructionproject. Sometimes one party profits at the expense of another party in the sameproject (even in the same firm). For example, a contractor or project managermight buy cheaper, less efficient mechanical equipment to save money or speeddelivery. As a result, the tenant or facilities manager pays higher energy bills. Foreach decision or action, determine who benefits and you will often understand whya better outcome for society and the environment (if not for the owner) didn’toccur.
Market dynamics and business models shape the decision rules of participants inthe process and thus the outcomes. For example, the after-tax return on increasingthe diameter of wire by just one size in a standard US office lighting circuit typicallyapproaches 200 percent per year. The wire-size table in the National Electrical Codeis meant only to help prevent fires, not save money, and hence specifies wire withhalf the diameter—and four times the electrical losses due to greater resistance—aswould be economically desirable. However, an electrician altruistic enough to buythe larger (and more expensive) wire would no longer be the low bidder andwouldn’t get the job. This example embodies two barriers to more efficientbuildings: a life-safety minimum-requirement code misinterpreted as an economicoptimum, and a split incentive between the party who chooses the wire size and theone who later pays the electric bills.
It is worthwhile to examine the incentives and disincentives faced by the variousparties to the design-build process, and explore why standard practices andparadigms often block environmental improvements, to determine effectiveremedies.
The Current Design-Build Process Paradigm
Consider a representative list of the different parties involved in creating typicalcommercial buildings. The owner might be a building developer seeking to sell orlease the property, or it might be a business, public agency, educational institution,or other organization that owns its buildings. The project manager might be anemployee of the owner or a general contractor. The design is created by contractorsand consultants, or sometimes by staff of the business owner, including architects,structural engineers, and mechanical engineers. Construction is typicallycontracted out, or sometimes performed by a unit of the developer or businessowner. Facility managers operate and maintain the buildings.
Chapter 7 Buildings
7.2 Greening Facilities: Hermes Microtech Inc. 483

Now consider some of the common pressures and motivations that each of theseparties faces. Any of them can champion sustainable design but also can undermineit—often unintentionally—by pursuing goals that their position or employer’spolicies dictate. Each project and decision maker is different, and generalizationsare useful to a limited extent. Nevertheless, one can draw insights by consideringtypical incentives and disincentives that come with a given job description and rolein the design-build process, regardless of the opinions and values of the person whois doing that particular job. Scholars of organizational behavior note that “whereyou stand depends on where you sit” applies.
Developers often build on speculation. They will find a buyer eventually. The lowertheir initial costs, the greater their potential profit from sale or lease. Thestructural shell is designed before tenants are found, and performancespecifications are unlikely to exceed minimum building code requirements.Developers can buy low-quality equipment to save themselves money, and theydon’t ultimately pay the resulting higher energy bills. They might be experienced ingreen building techniques but probably are not. Many see little incentive to riskslowing their project turnover rate, increasing costs, or alienating potentialcustomers with unfamiliar green features.
Tenants usually have little control over building design and tend to have a short-term perspective on costs. Even buyers of spec buildings often have no influence onthe design or performance.
Organizations that own their buildings are more likely to take a more integrated,long-term perspective on life-cycle cost and performance (especially for newconstruction). They might be more interested in green building concepts than otherplayers—or at least more likely to push for improvements. Even then, seniormanagers might share and communicate a greener vision but face competingpressures from project managers or department heads within their own firm oramong their contractors.
Project managers are often rewarded for completing work ahead of schedule andunder budget. This can provide incentives to cut corners, reject or redo designfeatures and specifications (such “value engineering” often undermines integrateddesign), squeeze more out of contractors, and proceed with the most readilyavailable options without pausing to make improvements or even to correctnoncritical shortcomings and mistakes. If the manager’s budget is fundingconstruction but not building operation, there might be an incentive to use cheaperbut lower-quality materials and equipment and leave any increased maintenance orcost concerns to somebody else. These factors apply to both owners’ employees andgeneral contractors alike.
Chapter 7 Buildings
7.2 Greening Facilities: Hermes Microtech Inc. 484
Architects are encouraged to innovate and are rewarded for interesting newdesigns with recognition and further work. However, environmental attributes donot often rank high in the review criteria of their clients and peers. Architectsmight have significant training or experience in whole-system, resource-efficientsustainable design but probably do not. If the client hasn’t asked them to create agreen building, they have little incentive to struggle to explain the potentialbenefits to the owner or contractor. When fees are based on a percentage of projectcost, the compensation structure rewards architects for what they spend and notfor what they save the client (or whoever ultimately pays the utility bills) inreduced energy or water use and costs.
Architects and engineers must work together on the same design, but that does notmean that they necessarily coordinate their efforts to produce an optimal building.In many cases, the architects and engineers are from different contractors. Evenwhen they are from two departments within the same firm, all too often there isrelatively little communication and harmonization of design approaches andequipment specifications. The architect completes the design with minimal inputfrom the engineers and in effect rolls up the drawings and pushes them through alittle hole in the wall into the engineering department to execute the next projectphase. The design process is sequential rather than simultaneous.
There are two main types of engineers involved in building. Structural engineersare relatively conservative in their approach because if their design doesn’t work,someone could die. Safety and consistency are prioritized over innovation.Mechanical engineers (MEs) face less pressure in that their worst-case designfailure scenario is that building occupants might have to buy a fan or heater. ButMEs are ultimately responsible for the majority of a building’s energy use. Forexample, HVAC systems comprise almost half of the energy use of a typical SanFrancisco office building, the largest share of the load. (The next-largest energyconsumer is lighting at more than one-fourth, and plug loads account for more than10 percent of the building’s total electricity use.) Yet better mechanical systemsdesigns are typically invisible to users. Even if those paying the utility bills realizelower costs, unless they share the savings with the engineering team, the MEs aretypically not rewarded for innovation or greater effort to green the design.
Both types of engineers face incentives to overdesign structural and mechanicalsystems, as excess capacity provides a margin of security (but often wastesresources). Both types labor under the same tight budgets and short timelines. Theyoften specify average- rather than premium-quality equipment to cut initial costsand use design rules of thumb to save time. Indeed, if a problem arises, theengineer’s best defense is that the design follows standard practice. Techniques thatworked in the past (or at least did not fail) are copied and reused. Measurement andanalysis of previous structures’ actual performance is not commonly incorporated
Chapter 7 Buildings
7.2 Greening Facilities: Hermes Microtech Inc. 485

into improving the next similar design. Unlike architects, engineers are quite happyto make a building look and perform like the one next door. Those habitualapproaches produce functional but overly energy-intensive designs.
Facility managers’ experience and input are rarely solicited and incorporated intothe design process. Typically, the managers are handed the keys after the buildingis complete and tasked with keeping the lights on and the floors clean on a limitedbudget. Increasingly, their function is outsourced. Their staff might not have thetime or training to commission, maintain, and operate systems at peakenvironmental performance. They might not pay the utility bills or have muchfunding for investment in building improvements. Even if they do, they might notbe inclined to increase energy and water efficiency and cut costs if their reward is asmaller budget next year.
Apart from the owner, no single participant in this group decision-making systemhas compelling authority over the others, and none can exert determininginfluence over the process. Even the owner must exert considerable effort to ensurethat her objectives survive every step of the sequence. The typical result of thiscollective process is safe, sometimes interesting-looking structures with poorenergy performance and average (frequently excessive) environmental impacts.
Most of the parties to design-build projects are used to these standard approachesand common dynamics, adhere to them habitually, and expect them intuitively.They see nothing abnormal and perceive little need for improvement, given that forthe most part the end-user clients and occupants are satisfied or at least notcomplaining any more than usual. No market failures are required to explain thisoutcome, although it imposes unnecessary costs on society. All the participants inthis process are acting in their economic rational self-interest, within the bounds oftheir knowledge. If a camel is “a horse designed by a committee,” as the joke goes,then, in effect, all buildings are camels: their design intention has been subvertedby the process.
Strategies for a Greener Facility Design-Build Process
The standard process produces suboptimal buildings because participants pursuetheir own objectives, even to a limited extent, rather than compromising more andcooperating in greater harmony to obtain optimal outcomes for building ownersand users over the long term. Thus green building champions are necessarilychange agents. Their challenge is to influence the organizational system byinfluencing the participants as well as technology and design. This experience canbe as difficult as herding cats.
Chapter 7 Buildings
7.2 Greening Facilities: Hermes Microtech Inc. 486

Only by providing participants with compelling reasons to change their approach,such as financial benefits and strategic advantage, can you foster lasting change.
The following paragraphs give a brief overview of some remedies to the commonbarriers to greener buildings.
Start early. It is very important to incorporate green elements from the verybeginning of a project. An old design axiom says that all the really importantmistakes are made on the first day. Even small decisions early in the process havesignificant influence on future building performance and costs. It is worthwhile to“measure twice and cut once” where building design and performance areconcerned.
Increased awareness of green building techniques and demonstrated successes wouldbenefit all the parties. Formal education plays a crucial role, but the pace of markettransformation can be slow as graduates enter the workplace and make their mark.More and better in-service training and user-friendly resource materials for busyprofessionals can help shift existing practices faster. Positive, hands-on fieldexperience with sustainable building is perhaps the most potent learning tool.
Encourage the use of outside energy-efficiency reviewers. Doing so can help establish acommon baseline for design objectives and performance benchmarks. Authoritativethird-party project assessments reinforce the importance of ensuring that specifiedand installed equipment and systems operate efficiently. For example, many energycompanies provide energy-efficiency design assistance, useful resources andsupport, and sometimes economic incentives.
Building codes (such as California’s stringent Title 24) and voluntary guidelines (suchas LEED) can improve building design and performance as well as help educatepractitioners. The LEED rating system provides a framework for setting sharedgoals, a template for project execution, and neutral evaluation criteria based onconsensus best practices and measurable criteria (for more information on the LEEDrating system, see Chapter 7 "Buildings", Section 7.1 "Project Frog: Sustainabilityand Innovation in Building Design".)
Set targets and rewards for performance. Use specific metrics and performance criteria.Provide clear financial incentives for high-quality work. For example, provide abonus payment if the building’s performance exceeds California’s Title 24 EnergyCode by more than 40 percent or if LEED rating points are earned. Performance-based fees compensate architects and engineers in part based on measured savings
Chapter 7 Buildings
7.2 Greening Facilities: Hermes Microtech Inc. 487
in energy and water efficiency relative to preagreed building performancestandards, an incentive for more efficient design.
The most effective approach is neither a technology nor a set of guidelines andbenchmarks but rather to redesign the process itself. An integrated design processbrings together project participants, stakeholders, and outside expertise at theearliest practical point in the project to collaborate, cocreate, and execute a sharedvision. Often called a charrette, such an intensive, multidisciplinary-facilitatedmeeting can help identify and overcome many of the barriers to optimal greendesign.
This integrative process assists participants in articulating their differingperceptions and incentives and allows them to exchange ideas, work out problems,and establish common terminology and objectives. It creates a communicationspace in which to build mutual understanding and trust, clarifies owners’ goals andoptions, and helps participants agree on any mutual trade-offs and concessions thatmight be required to achieve an optimal result. Those exercises can significantlyimprove plans and specifications, streamline construction, reduce total costs, andincrease building performance—increasing the chances that systems will work asthey are intended to, rather than just as they are designed to.
Design and TechnologyEnd-Use, Least-Cost Analysis
End-use, least-cost analysis is a core concept of whole-systems, resource-efficientdesign. Historically, energy resource discussions have focused on supply: where dowe get more, and how much does it cost? But people don’t want barrels of oil orkilowatt-hours of electricity per se; they want the services that energy ultimatelyprovides, such as hot showers, cold beer, comfortable buildings, light, torque, andmobility. Considered from the demand as well as the supply side of the equation,least-cost analysis identifies the cheapest, cleanest way to deliver each of theseservices. Often the better, more cost-effective way is using less energy moreproductively, with smarter technologies. Efficient end use can thus compete withnew supply as an energy resource and leverage bigger savings in resources, cost,and upstream pollution across the whole system.
Saving energy (especially electricity) is cheaper than consuming fuel to generate it.Surveys of utility-directed “demand-side management” efforts to save electricityshow saved watts—or what Amory Lovins calls “negawatts”—typically cost from$0.025 to $0.02 per saved kilowatt-hour or less. That is less expensive than themarginal cost of electricity from all other sources of supply and unlike most types
Chapter 7 Buildings
7.2 Greening Facilities: Hermes Microtech Inc. 488

of generation does not emit any pollution. Although the potential savings are finite,they are significant.
Consider a pumping example (Figure 7.13 "Energy Efficiency Downstream PreventsMore Wasted Energy Upstream "). The end use is to move a unit of fluid through anindustrial pipe. The pump runs on electricity. Thermal losses occur when coal isburned at a power plant to produce steam that a generator converts to electricity.Energy losses compound in transmission and distribution, in the motor and pump,the throttling balance valve, and pipe friction, until ultimately only 10 percent ofthe coal’s embodied energy does the desired work.
Figure 7.13 Energy Efficiency Downstream Prevents More Wasted Energy Upstream
Source: Andrea Larson and Chris Lotspeich, “Greening” Facilities: Hermes Microtech, Inc., UVA-ENT-0054(Charlottesville: Darden Business Publishing, University of Virginia, 2004).
Where is the biggest leverage point for resource efficiency? Conversion efficiencycan be improved at the power plant (e.g., with heat recapture and cogeneration)and at other points along the delivery chain. Yet the biggest “bang for the buck”lies closest to the end-use application. For example, bigger pipes have less friction,reducing pumping requirements. That leverages upstream savings, turning lossesinto compounding savings. Each unit of conserved pumping energy in the pipesaves ten units of fuel, cost, and pollution at the power plant.
Generating Returns from Integrated Systems
Integrated design methodology optimizes the relationships among the componentsin technical systems as well as among a facility’s component subsystems. The
Chapter 7 Buildings
7.2 Greening Facilities: Hermes Microtech Inc. 489

performance of many mechanical systems is undermined by design shortcuts,compromised layouts, and penny-wise, pound-foolish capital cost cutting. Anintegrated design approach can recognize and mitigate these effects at the same orreduced construction cost. It is much more cost-effective to integrate theseelements into the initial design than to try to squeeze them into the projectlater—or retrofit them after completion. Maximum savings are achieved by firstminimizing load at the end-use application, before selecting the energy supply orapplying energy-conserving measures “upstream” toward the motor or otherenergy-conversion device.
Consider the pumping example depicted in Figure 7.13 "Energy EfficiencyDownstream Prevents More Wasted Energy Upstream ". Bends in pipes or ductsincrease friction and thus pumping power requirements. Optimal pipe and ductlayouts eliminate bends. Larger-diameter pipe sizing is also very important becausefriction falls as nearly the fifth power of pipe diameter. Smaller pumpingrequirements enable smaller pumps, motors, and electrical systems, reducingcapital costs. Larger pipes also maintain equivalent fluid flow at less velocity,enabling significant pumping energy savings. The “cube law” relationship betweenpump impeller power and fluid flow means that decreasing velocity by half dropspumping power use by almost seven-eighths. (Those same dynamics and potentialsavings also apply to ducts and fans.)
That approach was pioneered by Singaporean engineer Lee Eng Lock. Lee tutoredDutch engineer Jan Schilham at Interface Corporation, who applied thosetechniques to a pumping loop for a new carpet factory. A top European companydesigned the system to use pumps requiring a total of 95 horsepower. But beforeconstruction began, Schilham upsized the pipes and thus downsized the pumps. Theoriginal designer had chosen the smaller pipes because, according to the traditionalcost-benefit analysis method, the extra cost of larger ones wasn’t justified by thepumping energy savings.
Schilham further reduced friction with shorter, straighter pipes by laying out thepipes first, then positioning the equipment that they connected. Designers normallyposition production equipment without concern for efficient power configuration,and then have a pipe fitter connect the components with long runs and numerousbends. Those simple design changes cut the power requirement to only 7horsepower—a 92 percent reduction. The redesigned system cost less to build andto operate, was easier to insulate, involved no new technology, and worked betterin all respects. That small example has important implications: pumping is thelargest application of motors, and motors use three-quarters of all industrialelectricity in the United States, or three-fifths of all electricity.
Chapter 7 Buildings
7.2 Greening Facilities: Hermes Microtech Inc. 490

Inventor Edwin Land said, “People who seem to have had a new idea have oftensimply stopped having an old idea.”Andrea Larson and Mark Meier, Project FROG:Sustainability and Innovation in Building Design, UVA-ENT-0158 (Charlottesville:Darden Business Publishing, University of Virginia, 2010). The old idea is one ofdiminishing returns—that the greater the resource saving, the higher the cost. Butthat old idea is giving way to the new idea that innovative design can make bigenergy savings less expensive to attain than small savings. Such “tunneling throughthe cost barrier” has been proven in many kinds of technical systems. (A few otherexamples are highlighted later in this section.)
Noted green architect William McDonough said, “Our culture designs the samebuilding for Reykjavik and Rangoon; we heat one and cool the other; why do we doit that way? I call this the ‘Black Sun.’”Andrea Larson and Mark Meier, Project FROG:Sustainability and Innovation in Building Design, UVA-ENT-0158 (Charlottesville:Darden Business Publishing, University of Virginia, 2010). Facilities’ energyintensity is chiefly in the HVAC systems that create interior comfort bycompensating for climatic conditions and that provide (or remove) industrialprocess heat and cooling.
Cooling systems are typically designed to serve peak load, regardless of howfrequently that occurs. The chilled water temperature is often determined by themost extreme thermal requirements of a small subset of the total load, such as oneor two machines out of many. That results in excess cooling capacity and inefficientoperation at partial loads. It is much more efficient to segregate the loads withparallel chilled water piping loops at two different temperatures. One higher-temperature loop with dedicated chillers optimized for that temperature can servethe majority of a facility’s load. A second lower-temperature loop with a smallerhigh-efficiency chiller can serve the most demanding subset of the load. This canimprove overall cooling plant efficiency by 25 percent or more. Higher temperaturechillers cost less than lower temperature chillers of equal capacity.
“Thermal integration” leverages temperature differences. Many businessesconsume energy to create heat and then spend even more energy removing wasteheat from their processes and facilities, without matching up the two. Instead, theyshould strive to make full use of available energies before discarding them to theenvironment. Waste heat from an oven or boiler can be used to preheat wash wateror intake air. Winter or night cool air, groundwater, or utility water can providefree cooling. Heat exchangers can allow energy transfer between media that shouldnot mix. Such measures can reduce or eliminate HVAC capacity.
Lighting is generally one of the most cost-effective energy savings opportunities,due to the rapid pace of improvements in lighting technology and design. Retrofits
Chapter 7 Buildings
7.2 Greening Facilities: Hermes Microtech Inc. 491

usually offer attractive paybacks, averaging roughly 30 percent ROI. Yet the impacton building systems extends beyond illumination. Energy-efficient bulbs also emitless heat, thereby reducing facility cooling loads, enabling HVAC capacity costsavings.
Money
Making the business case for efficiency improvements is perhaps the mostimportant yet most challenging task facing a sustainability champion. Mostcompanies spend a small fraction of their costs on energy, and it does not commandmuch executive attention. Facilities maintenance is a far lower priority to mostsenior managers than production, sales, and customer service. Yet saving 1–2percent of total costs matters, even in financial terms alone.
Whole-Systems, Life-Cycle Costing
Green building experience shows that cost-effective energy savings of 30–50percent are achievable in many facilities worldwide. Much of this wasted energyand excess mechanical and electrical systems capacity results from minimizing firstcost instead of cost of ownership, especially in fast-track projects. High-efficiencydesign and equipment can cost more up front. Penny-wise, pound-foolish shortcutsand cost cutting degrade performance and increase energy bills for a facility’slifetime. Smart money looks at the big picture, not just the price tag.
Pervasive overemphasis on short-term first costs results in wasteful decisions. Infacilities design and construction, the “value engineering” process is intended tosave the owners money. Plans are reviewed and components are approved orrejected with a line-item-veto approach. Although that method can squeezeincrements of capital cost out of a design, in actuality it undermines both long-termvalue and engineering integrity. A component-focused approach erodes designintegration (and often function) and negates whole-systems benefits. Paying morefor one component can often downsize or eliminate others, reducing total systemcapital cost as well as operating cost. Optimizing components for single benefits,not whole systems or multiple benefits, “pessimizes” the system. A first-costapproach might benefit one department’s budget one time but imposes increasedoperating costs on the firm for decades to come. Look for the cheapest total cost ofowning and operating the entire system of which the device is a component.
Whole-system, life-cycle costing3 incorporates both capital and operating costs(as well downtime costs, changes in output, the value of reliability, and otherfactors). It allows companies to assess the actual total cost of ownership, a betterreflection of the financial impact of decisions on a company and its shareholders.
3. A financial evaluationtechnique that incorporatesboth capital and operatingcosts (as well as downtimecosts, changes in output, thevalue of reliability, and otherfactors). It allows companies toassess the actual total cost ofownership, a better reflectionof the financial impact ofdecisions on a company and itsshareholders. Those techniquesshould credit savings fromreduced infrastructure (recallthe “big pipes, small pumps”example).
Chapter 7 Buildings
7.2 Greening Facilities: Hermes Microtech Inc. 492

Those techniques should credit savings from reduced infrastructure (recall the “bigpipes, small pumps” example).
Some designers try to save money by using standard rules of thumb and evencopying old designs without improving upon them. That helps them offer low bidsto secure work. Facilities owners might find such practices appealing to reduceshort-run costs or to help reduce construction project timelines. Although facilitiesconstruction timing is critical to some industries’ profit model (e.g., electronics),fast-track design should not become standard procedure because speed comes atthe price of lost efficiency and project value. Evaluate and improve upon pastdesigns using operator feedback and careful measurement. Often the perceivedneed for fast design and construction is caused by lack of planning and preparation.Over time, fast design can inadvertently become a substitute for these vital steps.
Prioritization of Improvements
Whole-systems investment criteria are relevant to how proposed improvements areimplemented. Green design consultants and champions often rank their suggestionsaccording to their cost and return on investment (ROI)4. Managers are tempted togo for the “low-hanging fruit” and select the most financially attractive measuresfirst (or only), to reduce costs. This is also true of energy savings companies(ESCOs), which consult to firms on efficiency opportunities and often helpimplement the measures. Many ESCOs upgrade lighting, share the savings resultingfrom reduced bills with their clients—and stop there. But “cream-skimming” themost attractive savings only can render less financially attractive measuresuneconomical when they are considered individually rather than as part of asystemic set of upgrades. This can make larger potential total savings of the wholeset of opportunities difficult or impossible to attain. Maximize cost-effectiveimprovements by considering all proposed green measures as a package, andreinvest the resources freed up via the larger cost reduction projects into other, lessindividually attractive projects. Only in that way will you be able to attain largesystemic improvements cost effectively.
Investment Criteria: Payback and ROI
Retrofit improvements are often blocked by nonsensical financial hurdles.Upgrades are commonly held to higher ROI standards than are purchases of newequipment. Reexamine investment criteria to avoid distortions and inconsistencies.Most companies seem to apply an eighteen-month to two-year cap on paybackperiods for investments in efficiency, although the rationale for doing so remainsunclear. This provides a much stricter standard than typical investment criteria fornew capacity or supply investments, which is closer to the cost of capital (e.g.,about 11–15 percent ROI). Harmonize payback and ROI requirements so that
4. A way to calculate the valueadded by spending additionalmoney, often on capital costswith the idea of reducingoperating costs.
Chapter 7 Buildings
7.2 Greening Facilities: Hermes Microtech Inc. 493

operating and financial people speak a common language; otherwise they can’tcompare investment opportunities on a level playing field. There are multipleapproaches to calculating payback and ROI. Simplified methods are used here forthe purposes of discussion.
The payback period for implementing an energy-efficiency measure can becalculated as the implementation costs divided by the energy savings in dollars. Theresulting payback number represents the number of years of operation that isrequired to fully recover the capital investment costs. The ROI method used by theDepartment of Energy examines the projected annual cost after (CA) implementinga project, compared to a baseline annual cost before (CB) implementing the project.Expressed as a formula, ROI is the ratio of anticipated cost savings (CB − CA) toprojected implementation cost (CI), expressed as a percentage.
Let us consider a hypothetical example of lighting and HVAC improvements. CA areenergy costs after the energy-efficiency project is implemented, CB are the energycosts before implementing the project, and CI is the cost of the project. Using thiscalculation method, the ROI for the measures are shown in Table 7.4 "Sample ROI".
Table 7.4 Sample ROI
Savings (US$) Costs (US$) ROI (%)
HVAC measures 85,600 262,800 33
Lighting measures 37,200 100,800 37
Average 122,800 363,600 34
The ROI is 33 percent and 37 percent for HVAC and lighting measures, respectively.That means that each year an average of 34 percent of the original investment isrecovered through energy savings—several times higher than the typical ROIrequirement for investments in new productive capacity. If a company’s marginalcost of capital is, for example, 15 percent per year, that implies that the company iswilling to accept a payback in the six- to seven-year range for additional capacity.Insisting that energy efficiency pay as much as $0.04 to $0.08 per kilowatt hourmore for negawatts than for new electricity supply deprives shareholders of profits.
Figure 7.14 "Payback Ranking" is the US Environmental Protection Agency’ssuggested ranking system for prioritizing efficiency investments. Each boxrepresents a category of equivalent payback and qualitative ROI criteria.Investments for both new equipment and upgrade improvements can be assessedon this equivalent basis with an eye toward added value to the firm.
Chapter 7 Buildings
7.2 Greening Facilities: Hermes Microtech Inc. 494

Figure 7.14 Payback Ranking
Source: US Environmental Protection Agency.
While building green may require collaboration among many different people atmultiple points in the process, the effort can be well worth it. For little to noadditional upfront costs, green buildings save operating costs and improveoccupant productivity. The key, however, is to optimize the entire system ratherthan to view the design, construction, and operation of a building as unrelatedparts.
KEY TAKEAWAYS
• A systems approach can significantly improve building designs andongoing operating costs by optimizing performance across all aspects ofthe building system.
• Some barriers remain to green building, such as inadequate fundingmodels and lack of knowledge, but those barriers are decreasingsteadily.
Chapter 7 Buildings
7.2 Greening Facilities: Hermes Microtech Inc. 495

EXERCISES
1. What are the major challenges facing Heather Glen?2. What obstacles did she confront in the past, and how did those help
prepare her for her current task?3. What can she do to successfully implement this new project?
Chapter 7 Buildings
7.2 Greening Facilities: Hermes Microtech Inc. 496
7.3 Shaw Industries: Sustainable Business, Entrepreneurial Innovation,and Green Chemistry
LEARNING OBJECTIVES
1. Analyze strategies to spur and sustain innovation within a matureindustry.
2. Understand how a variety of innovations can accumulate to a significantbreakthrough.
3. Examine how cradle-to-cradle design is implemented.
The carpet industry is the battlefield where the war for sustainability is beingwaged.
- Architect William McDonough
The Shaw Industries case examines the production of a cradle-to-cradle carpetproduct in which a waste stream becomes a material input stream.This case waswritten by Alia Anderson and Karen O’Brien under the supervision of authorAndrea Larson and developed under a cooperative effort by the Batten Institute, theAmerican Chemical Society, and the Environmental Protection Agency’s Office ofPollution Prevention. Alia Anderson, Andrea Larson, and Karen O’Brien, ShawIndustries: Sustainable Business, Entrepreneurial Innovation, and Green Chemistry, UVA-ENT-0087 (Charlottesville: Darden Business Publishing, University of Virginia, 2006).Note can be accessed through the Darden Case Collection athttps://store.darden.virginia.edu. Unless otherwise noted, quotations in thissection refer to this case. In this situation we look at innovation challenges faced bya large global competitor.
In 2003 Shaw’s EcoWorx carpet tiles won a US Green Chemistry Institute’sPresidential Green Chemistry Challenge Award. The company had earned the awardby combining the application of green chemistry and engineering principles (Table7.5 "The Twelve Principles of Green Chemistry and Green Engineering") with acradle-to-cradle designSee William McDonough and Michael Braungart, Cradle toCradle: Remaking the Way We Make Things (New York: North Point Press, 2002) forextensive discussion of the C2C frame of reference. The field of industrial ecologyprovides a conceptual basis for this discussion; see Thomas E. Graedel and Braden R.Allenby, Industrial Ecology (Englewood Cliffs, NJ: Prentice Hall, 1995). (often called
Chapter 7 Buildings
497
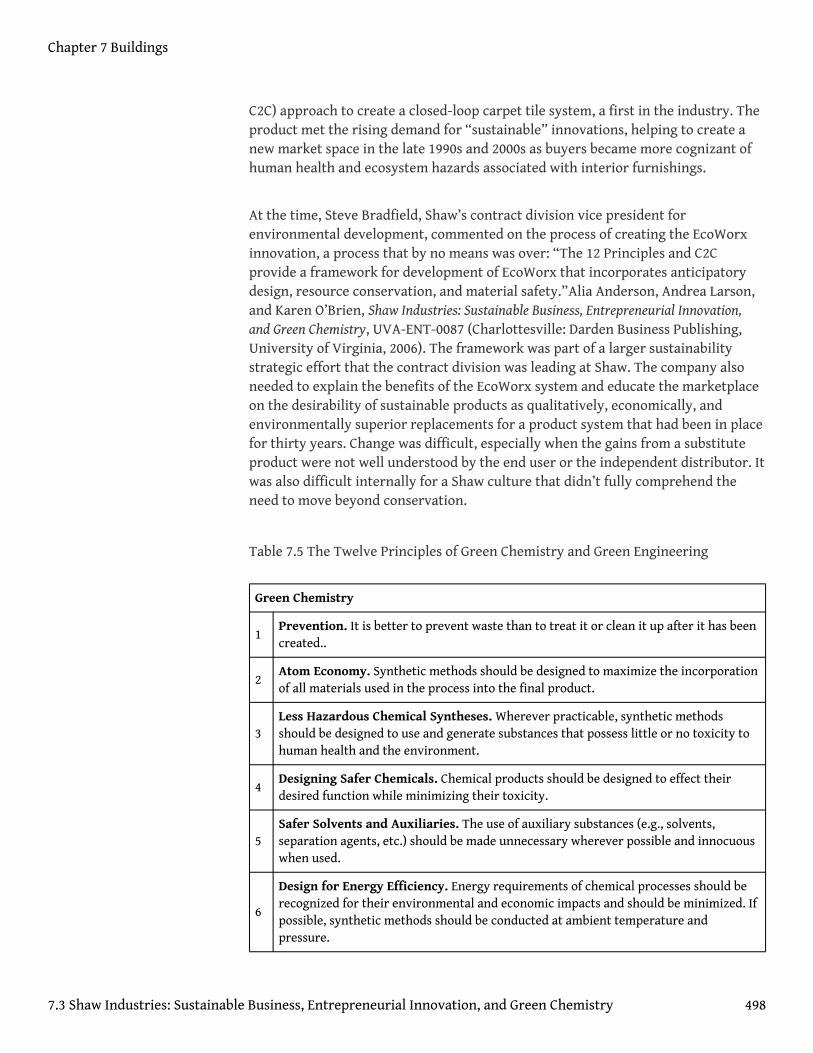
C2C) approach to create a closed-loop carpet tile system, a first in the industry. Theproduct met the rising demand for “sustainable” innovations, helping to create anew market space in the late 1990s and 2000s as buyers became more cognizant ofhuman health and ecosystem hazards associated with interior furnishings.
At the time, Steve Bradfield, Shaw’s contract division vice president forenvironmental development, commented on the process of creating the EcoWorxinnovation, a process that by no means was over: “The 12 Principles and C2Cprovide a framework for development of EcoWorx that incorporates anticipatorydesign, resource conservation, and material safety.”Alia Anderson, Andrea Larson,and Karen O’Brien, Shaw Industries: Sustainable Business, Entrepreneurial Innovation,and Green Chemistry, UVA-ENT-0087 (Charlottesville: Darden Business Publishing,University of Virginia, 2006). The framework was part of a larger sustainabilitystrategic effort that the contract division was leading at Shaw. The company alsoneeded to explain the benefits of the EcoWorx system and educate the marketplaceon the desirability of sustainable products as qualitatively, economically, andenvironmentally superior replacements for a product system that had been in placefor thirty years. Change was difficult, especially when the gains from a substituteproduct were not well understood by the end user or the independent distributor. Itwas also difficult internally for a Shaw culture that didn’t fully comprehend theneed to move beyond conservation.
Table 7.5 The Twelve Principles of Green Chemistry and Green Engineering
Green Chemistry
1Prevention. It is better to prevent waste than to treat it or clean it up after it has beencreated..
2Atom Economy. Synthetic methods should be designed to maximize the incorporationof all materials used in the process into the final product.
3Less Hazardous Chemical Syntheses. Wherever practicable, synthetic methodsshould be designed to use and generate substances that possess little or no toxicity tohuman health and the environment.
4Designing Safer Chemicals. Chemical products should be designed to effect theirdesired function while minimizing their toxicity.
5Safer Solvents and Auxiliaries. The use of auxiliary substances (e.g., solvents,separation agents, etc.) should be made unnecessary wherever possible and innocuouswhen used.
6
Design for Energy Efficiency. Energy requirements of chemical processes should berecognized for their environmental and economic impacts and should be minimized. Ifpossible, synthetic methods should be conducted at ambient temperature andpressure.
Chapter 7 Buildings
7.3 Shaw Industries: Sustainable Business, Entrepreneurial Innovation, and Green Chemistry 498

7Use of Renewable Feedstocks. A raw material or feedstock should be renewablerather than depleting whenever technically and economically practicable.
8
Reduce Derivatives. Unnecessary derivatization (use of blocking groups, protection/deprotection, temporary modification of physical/chemical processes) should beminimized or avoided, if possible, because such steps require additional reagents andcan generate waste.
9Catalysis. Catalytic reagents (as selective as possible) are superior to stoichiometricreagents.
10Design for Degradation. Chemical products should be designed so that at the end oftheir function they break down into innocuous degradation products and do notpersist in the environment.
11Real-Time Analysis for Pollution Prevention. Analytical methodologies need to befurther developed to allow for real-time, in-process monitoring and control prior tothe formation of hazardous substances.
12Inherently Safer Chemistry for Accident Prevention. Substances and the form of asubstance used in a chemical process should be chosen to minimize the potential forchemical accidents, including releases, explosions, and fires.
Green Engineering
1Inherent Rather Than Circumstantial. Designers need to strive to ensure that allmaterials and energy inputs and outputs are as inherently nonhazardous as possible.
2Prevention Instead of Treatment. It is better to prevent waste than to treat or cleanup waste after it is formed.
3Design for Separation. Separation and purification operations should be designed tominimize energy consumption and materials use.
4Maximize Efficiency. Products, processes, and systems should be designed tomaximize mass, energy, space, and time efficiency.
5Output Pulled versus Input Pushed. Products, processes, and systems should be“output pulled” rather than “input pushed” through the use of energy and materials.
6Conserve Complexity. Embedded entropy and complexity must be viewed as aninvestment when making design choices on recycling, reuse, or beneficial disposition.
7Durability Rather Than Immortality. Targeted durability, not immortality, should bea design goal.
8Meet Need, Minimize Excess. Design for unnecessary capacity or capability (e.g., “onesize fits all”) solutions should be considered a design flaw.
9Minimize Material Diversity. Material diversity in multicomponent products shouldbe minimized to promote disassembly and value retention.
10Integrate Material and Energy Flows. Design of products, processes, and systemsmust include integration and interconnectivity with available energy and materialsflows.
Chapter 7 Buildings
7.3 Shaw Industries: Sustainable Business, Entrepreneurial Innovation, and Green Chemistry 499

11Design for Commercial “Afterlife.” Products, processes, and systems should bedesigned for performance in a commercial “afterlife.”
12Renewable Inputs. Material and energy inputs should be renewable rather thandepleting.
Source: P. T. Anastas and J. C. Warner, Green Chemistry: Theory and Practice (NewYork: Oxford University Press, 1998), 30; and P. T. Anastas and J. B. Zimmerman,“Design through the 12 Principles of Green Engineering,” Environmental Science andTechnology 37, no. 5 (2003): 95–101. Used by permission.
The US Carpet Industry
World War II demanded wool, then the dominant carpet material, for militaryuniforms and blankets, providing an incentive for companies to research and createalternative fibers. This move toward alternatives was part of the general wartimedrive that culminated in the introduction of synthetic materials (man-made) formany uses. After the war, manufacturers continued to develop various new naturaland synthetic materials. By the 1960s, DuPont and Chemstrand’s man-made nylonand acrylic materials supplied most of the growing carpet industry’s textile fiberneeds. An average American household could now afford machine-tufted syntheticcarpets that replaced the expensive woven wool carpets of the past. By 2004 nylonaccounted for 68 percent of the fibers used in carpet manufacturing, followed by 22percent polypropylene and 9 percent polyester, with wool constituting less than 0.7percent of the total.
By the 1970s, carpet flooring was the dominant aesthetic standard in a highproportion of industrialized countries for residential and commercial flooringmarkets. Historically, woven wool carpets (in which the carpet surface and backingwere essentially one layer) gave way to tufted (fibers pulled through a matrix web)and needle-punched carpets bonded by a latex backing layer using an array ofsynthetic face fibers and backing materials. Carpet tiles, the fastest growingsegment of the commercial carpeting industry, were expected to steadily replacemuch of the rolled broadloom carpet used historically in offices and othercommercial locations. Regardless of design, all carpeting had traditionally been acomplex matrix of dissimilar materials constructed without any thought ofdisassembly for recycling.It was not until 1994 that the industry began to take amore serious look at sustainability. One early adopter was the carpet tile innovatorInterface Inc., which took steps to integrate sustainability throughout the companyfrom top to bottom, reducing scrap waste, identifying operational inefficiencies,lowering energy use through solar and other innovations, and introducing a carpetleasing program through which it collected and recycled end-of-use carpet.Independently, however, other carpet producers began developing their own
Chapter 7 Buildings
7.3 Shaw Industries: Sustainable Business, Entrepreneurial Innovation, and Green Chemistry 500

programs and initiatives, programs that some would contend exceeded thesolutions Interface devised.
Shaw Industries, Mohawk Industries, and Beaulieu of America were the threelargest carpet producers in 2004. Interface was the largest carpet tile manufacturer.Invista, a fiber spin-off of DuPont, and Solutia were the sole US producers of Nylon6.6, a type suitable for carpet. Honeywell and vertically integrated carpet giantShaw Industries were the major producers of Nylon 6 for carpet use. Pricecompetition, economic downturn, and overcapacity had taken a heavy toll onAmerican fiber and carpet companies. Unlike the broader textile industry, thenylon fiber and carpet producers did not see an influx of low-cost imports due tohigh transportation costs, relatively low labor costs associated with US fiber andcarpet production, and the difficulties in finding viable US distribution channels forimports. The industry was consolidating and companies vertically integrated,formed alliances, or organized around market niches as lower carpet and floorcovering sales tracked personal income insecurity and general economicturbulence. The first few years of the twenty-first century witnessed the loss ofmore than 90,000 US textile jobs and 150 plant closings. The carpets and rugs sectorexperienced sluggish growth. Growth rebounded by 2005, but competition wasfierce and buyers would not tolerate higher prices or lower product performance.
Shaw Industries
In 2006, Shaw Industries of Dalton, Georgia, was the world’s largest carpetmanufacturer, selling in Canada, Mexico, and the United States and exportingworldwide. The company’s historic carpet brand names, including Cabin Crafts,Queen Carpet, Salem, Philadelphia Carpets, and ShawMark, were de-emphasizedrelative to the consolidated Shaw brand. Shaw sold residential products to large andsmall retailers and to the much smaller distributor channel. Shaw offeredcommercial products primarily to commercial dealers and contractors, including itsown Spectra commercial contracting locations, through Shaw Contract, Patcraft,and Designweave. The company also sold laminate, ceramic tile, and hardwoodflooring through its Shaw Hard Surfaces division, and rugs through the Shaw Livingdivision. Shaw Industries was publicly traded on the New York Stock Exchange(NYSE) until 2000, when it was purchased by Warren Buffet’s Berkshire HathawayInc. Shaw’s stock had been one of the best-performing stocks on the NYSE in the1980s, but Wall Street’s dot-com focus of the 1990s depressed the stock price ofShaw and other manufacturers. The Berkshire buyout took the Wall Street factorout of Shaw’s management strategy, and 2001 through 2006 were record earningsyears for the company.
Between 1985 and 2006, Shaw Industries made a string of acquisitions, includingother large carpet makers, fiber-dyeing facilities, and fiber extrusion and yarn
Chapter 7 Buildings
7.3 Shaw Industries: Sustainable Business, Entrepreneurial Innovation, and Green Chemistry 501
mills, moving steadily toward broad vertical integration of inputs and processes.The firm’s expensive forays into retail stores ended, and Shaw concentrated onshifting its outside purchases of fiber to internal fiber production. Shawpolymerized, extruded, spun, twisted, and heat-set its own yarn and tufted, dyed,and finished the carpet. Several key acquisitions included the following:
• Amoco’s polypropylene operations, 1992. Polypropylene fiber, usedmainly in berber-style residential products, reached a high-water markof approximately 30 percent of the fiber usage in the carpet industry.By purchasing the Amoco plants in Andalusia, Alabama, andBainbridge, Georgia, in 1992, Shaw became the world’s largestpolypropylene carpet fiber producer, extruding all the fiber for itspolypropylene carpets.
• Queen Carpet, 1998. Shaw purchased the fourth-largest manufacturerof carpets, Queen Carpet, which had $800 million in sales the previousyear.
• The Dixie Group, 2003. The Dixie Group, one of the nation’s biggestmanufacturers of carpets for the mobile home and manufacturedhousing industry, sold six yarn-tufting, dyeing, finishing, andneedlebond mills and distribution factories to Shaw for $180 million inOctober 2003. Included in the sale was a carpet recycling facility.
• Honeywell Nylon 6 operations, 2005. Shortly after its acquisition ofthe BASF carpet nylon business, Honeywell decided to exit the Nylon 6carpet fiber business by selling to Shaw its South Carolina fiber mills atAnderson, Columbia, and Clemson. This made Shaw the world’s largestproducer of Nylon 6 carpet fiber. Honeywell’s 50 percent interest in theEvergreen postconsumer Nylon 6 depolymerization facility wasincluded in the deal.
• Evergreen Nylon Recycling Facility, 2006. Within two months ofclosing the Honeywell acquisition, Shaw purchased the remaining 50percent interest in the Augusta, Georgia, Evergreen caprolactammonomer recovery facility from Dutch State Mines (DSM).(Caprolactam was the monomer building block of Nylon 6.) This gaveShaw 100 percent ownership of the postconsumer Nylon 6depolymerization facility, which had been closed since late 2001 due tolow monomer prices. Shaw moved quickly to refurbish and restart thefacility for production of thirty million pounds of caprolactammonomer by early 2007. This gave Shaw the only source ofpostconsumer Nylon 6 monomer, which could be continuouslyreturned to carpet production.
Chapter 7 Buildings
7.3 Shaw Industries: Sustainable Business, Entrepreneurial Innovation, and Green Chemistry 502

Carpet Tile
For Shaw, the obvious place to start thinking about product redesign was at the topof the carpet hierarchy: carpet tile. Its high price in comparison with broadloomcarpets, its thermoplastic polyvinyl chloride (PVC) plastisol backing, and its relativeease of recovery from commercial buildings where large volumes of product couldbe found made it the best hope for early success. That may have been the first andlast point of agreement among fiber and carpet manufacturers as sustainabilitybegan to take on widely differing meanings. Given that lack of definition andstandard measures of sustainability, marketing literature could be confusing forspecifiers and end users looking to compare the environmental impacts ofcompetitive carpet tiles.
Carpet tile as a product category bridged most commercial market segments (e.g.,offices, hospitals, and universities). On the market for more than thirty years, it wasintroduced originally as a carpet innovation that enabled low-cost replacement ofstained or damaged tiles, rotation of tiles in zones of high wear, and easy access toutility wiring beneath floors. Carpet tile’s higher cost, high mass and embodiedenergy, more stringent backing adhesion performance specifications comparedwith broadloom, and double-digit market growth rate made it a logical focus forexploring alternative tile system designs.
Carpet tile was composed of two main elements, the face fiber and the backing. Theface was made from yarn made of either Nylon 6 or Nylon 6.6 fiber, the only viablenylons in carpet use. US carpet tile was traditionally made with PVC plastisolbacking systems, which provided the tile’s mechanical properties and itsdimensional stability. PVC was under suspicion, however, due to the potential of theplasticizer to migrate from the material, potentially causing health problems andproduct failures. The vinyl chloride monomer in PVC was also a source of healthconcern for many. Most carpet tiles were made with a thin layer of fiberglass in thePVC backing to provide dimensional stability. These tiles ranged from eighteeninches to thirty-six inches square and required high dimensional stability to lay flaton the floor.
Backing provided functions that were subject to engineering specifications, such ascompatibility with floor adhesives, dimensional stability, securing the face fibers inplace, and more. Selecting backing materials and getting the chemistry and physicalattributes right for the system’s performance took time and resources, and addedcost. Since the mid-1980s, the backing problems associated with PVC had led severalcompanies, including Milliken, to seek PVC-alternative backings. In 1997, Shawasked the Dow Chemical Company to provide new metallocene polyolefin polymersto meet Shaw’s performance specifications for a thermoplastic extruded carpet tilebacking. Shaw added a proprietary compounding process to complete the
Chapter 7 Buildings
7.3 Shaw Industries: Sustainable Business, Entrepreneurial Innovation, and Green Chemistry 503

sustainable material design. Seeking every way possible to reduce materials use andremove hazardous inputs, yet maintain or improve product performance, Shawmade the following changes:
• Replacement of PVC and phthalate plasticizer with an inert andnonhazardous mix of polymers, ensuring material safety throughoutthe system (third-party tested for health and safety through theMcDonough Braungart Design Chemistry toxicity protocol, which PVCcannot meet).
• Elimination of antimony trioxide flame retardant associated inresearch with harm to aquatic organisms (and replacement withbenign aluminum trihydrate).
• Dramatic reduction of waste during the processing phases byimmediate recovery and use of the technical nutrients resulting fromon-site postindustrial recycling of backing waste. (The productionwaste goal is zero.)
• A life-cycle inventory and mass flow analysis that captures systemsimpacts and material efficiencies compared with PVC backing. (Carpettile manufacturing energy was slightly lower for polyolefin, butpolyolefin supply chain–embodied energy was more than 60 percentlower than PVC.)
• Efficiencies (energy and material reductions) in production, packaging,and distribution—40 percent lighter weight of EcoWorx tiles over PVC-backed carpet tiles yielded cost savings in transport and handling(installation and removal/demolition cost savings).
• Use of a minimum number of raw materials, none of which lose value,because all can be continuously disassembled and remanufacturedthrough a process of grinding and airflow separation of fiber andbacking, facilitating recycling of both major components.
• Use of a closed-loop, integrated, plantwide cooling water systemproviding chilled water for the extrusion process as well as the heatingand cooling system (HVAC).
• Provision of a toll-free number on every EcoWorx tile for the buyer tocontact Shaw for removal of the material for recycling at no cost to theconsumer (supported by a written Shaw Environmental Guarantee).
Although Shaw had yet not begun to get carpet tiles back for recycling because ofthe minimum ten years of useful life, models assessing comparative costs of theconventional feedstock versus the new system indicated the recycled componentswould be less costly to process than virgin materials.
Chapter 7 Buildings
7.3 Shaw Industries: Sustainable Business, Entrepreneurial Innovation, and Green Chemistry 504

Figure 7.15 EcoWorx Carpet Tile Operations and Flows Diagram
Source: Alia Anderson, Andrea Larson, and Karen O’Brien, Shaw Industries: Sustainable Business, EntrepreneurialInnovation, and Green Chemistry, UVA-ENT-0087 (Charlottesville: Darden Business Publishing, University ofVirginia, 2006).
EcoWorx Innovation
The EcoWorx system developed by Shaw Industries offered a way to analyze andrefine the C2C design of a carpet tile system without regard to technologyconstraints of the past. The Twelve Principles of Green Chemistry and GreenEngineering and C2C provided a detailed framework in which to evaluate a newtechnology for engineering a successful carpet tile production, use, and recoverysystem. The EcoWorx system also utilized Shaw’s EcoSolution Q Nylon 6 premium-branded fiber system, which was designed to use recycled Nylon 6 and in 2006embodied 25 percent postindustrial recycled content in its makeup from blendingand processing Nylon 6 fiber waste.
The EcoSolution Q Nylon 6 branded fiber system could be recycled as a technicalnutrient through a reciprocal recovery agreement with Honeywell’s Arnpriordepolymerization facility in Canada without sacrificing performance or quality orincreasing cost. But Shaw’s original intention to take the Nylon 6 waste streamthrough the Evergreen Nylon Recycling Facility at Augusta, Georgia, was madepossible with Shaw’s purchase of the Honeywell/DSM joint venture. Thedepolymerization process was restarted in February 2007. That allowed Shaw’s
Chapter 7 Buildings
7.3 Shaw Industries: Sustainable Business, Entrepreneurial Innovation, and Green Chemistry 505

carpet tile products to make a cradle-to-cradle return to manufacturing, with nylonfiber from tile made into more nylon fiber and backing returned to backing.
Shaw’s objective was to create technology for an infinitely recyclable carpet tile,one that could be entirely recycled with no loss in quality from one life cycle to thenext. The notion of closed-cycle carpet tiles forced the complex issue ofcompatibility between face fiber (the soft side on which people walk) and thebacking. As for which face fiber to use, current technology allowed only Nylon 6fiber to be reprocessed. The Nylon 6 material retained its flexibility and structurethrough multiple reprocessing cycles by disassembling the Nylon 6 molecules withheat and pressure to yield the monomer building block, caprolactam. This recycledmonomer was identical in chemical makeup to virgin caprolactam. In contrast,Nylon 6.6 could not be economically depolymerized due to its molecular structure.Nylon 6.6 incorporated two monomer building blocks resulting in greaterdisassembly cost and complexity.
In 1997 Bradfield and Shaw chemist Von Moody discussed a particular method ofprocessing polyolefin resins that produced flexible, recyclable polymers. Polyolefinswere an intriguing material for Shaw to explore as carpet backing, given thecompany’s purchase of Amoco polypropylene (a type of polyolefin) extrusionfacilities. After nearly $1 million invested in research and development and a pilotbacking line, the tests suggested that polyolefins could be melted and separatedfrom Nylon 6 and therefore successfully recycled into like-new materials. Shawcreated the pilot backing line with the intention of “fast-prototyping” thepolyolefin backing by modeling the performance attributes of Shaw’s PVC backings.This prototyping risk might easily have failed but was instead the start of EcoWorx.
Shaw first introduced EcoWorx commercially in 1999. As a polyolefin-backed carpettile, EcoWorx offered an alternative to the industry standard PVC backing atcomparable cost, 40 percent less weight, and equal or improved effectiveness acrossall performance categories. EcoWorx earned the 1999 Best of Neocon Gold Award atthe prestigious and largest annual interior furnishings and systems show in theUnited States. In 2002 the company’s EcoWorx tile called “Dressed to Kill” won thecarpet tile Neocon Gold Award for design, effectively mainstreaming the newmaterial. By 2002, Shaw had announced EcoWorx as the standard backing for all itsnew carpet tile introductions. Indeed, customers preferred the new product;consequently, by 2004 EcoWorx accounted for 80 percent of carpet tile sold byShaw—faster growth than anticipated. At the end of 2004, Shaw left PVC in favor ofthe EcoWorx backing, accomplishing a complete change in backing technology in abrief four years.
Chapter 7 Buildings
7.3 Shaw Industries: Sustainable Business, Entrepreneurial Innovation, and Green Chemistry 506

EcoWorx as a system of materials and processes proved significantly more efficient.The backing was dramatically lighter than that of PVC-backed tiles. The EcoWorxprocess, which used electric thermoplastic extrusion rather than a traditional gas-fired or forced-air oven, was more energy-efficient. The process combined anethylene polymer base resin (developed by Dow Chemical) with high-densitypolyethylene (HDPE), fly ash for bulk (instead of the virgin calcium carbonatetraditionally used), oil that improved the product’s compatibility with the floorglue, antimicrobial properties, and black pigment in a proven nontoxicconstruction. This compound was applied to the carpet backs using a low-odoradhesive to maintain high indoor air quality standards. The backing material wascombined with a nonwoven fiberglass mat for stability. Shaw’s agreement withcustomers at the point of sale was that Shaw would pay to have the carpet returnedto it. Back in its plant Shaw would shred the carpet and separate the backing streamfrom the fiber stream. The “infinitely recyclable” duo of Shaw’s Nylon 6 fibers(marketed as EcoSolution Q) and EcoWorx backing received acclaim throughout theindustry. Shaw’s competitive cost and exceptional performance compared withtraditional products allowed it to step beyond the limits of the “green” nichemarket. Especially important, Shaw’s research showed that the cost of collection,transportation, elutriation,Elutriation refers to the process of shredding returnedtiles and their purification by washing, straining, or separating by weight. andreturn to the respective nylon and EcoWorx manufacturing processes was less thanthe cost of using virgin raw materials.Steve Bradshaw (Shaw Industries), indiscussion with author, March 2005. Shaw tripled the production capacity in 2000,and by the end of 2002, shipments of EcoWorx tiles exceeded those of PVC-backedstyles.Steve Bradshaw (Shaw Industries), in discussion with author, March 2005.Shaw continued to expand its collection and recycling capacity in preparation for2009, when the first round of EcoWorx carpet that was released in 1999 would reachthe end of its first life cycle. It appeared that Shaw would be the first to close theindustrial loop in the carpet tile industry.
The Recycling Challenge: Fits and Starts
Recycling carpet was a complex endeavor because carpet was composed of acomplex composite of face fibers, glues, fillers, stabilizers, and backings, each withvarying capacity to be melted and reused. Approximately 70 percent of the facefiber used in carpets was made of either Nylon 6 or Nylon 6.6, with each of thesetwo types comprising an equal share of the nylon carpet fiber market. Neither fiberhad the production capacity to serve the entire carpet industry.
Both nylons made excellent carpet. Although recovered Nylon 6.6 could be recycledinto other materials (not carpeting), such as car parts and highway guard rails, theeconomic incentives for companies were low, and many people argued that
Chapter 7 Buildings
7.3 Shaw Industries: Sustainable Business, Entrepreneurial Innovation, and Green Chemistry 507
“downcycling” in this way only postponed discarding the product in a landfill byone life cycle.
The development of technology for recycling Nylon 6 fibers into new carpet facefiber represented a major shift. Honeywell International Inc., a major supplier ofthe Nylon 6 fiber used by carpet manufacturers, was so confident about the marketpotential for recycled Nylon 6 fiber that it developed the $80 million EvergreenNylon Recycling Facility in Augusta, Georgia, in 1999. Unfortunately, the cost ofrecycled caprolactam was not competitive with virgin caprolactam (used in makingNylon 6) at that point in time, and the plant closed in 2001.Katherine Salant,“Carpet Industry Makes Strides in Reducing Footprint, but Path Includes SeveralObstacles,” Washington Post, January 31, 2004.
The Honeywell Evergreen Nylon 6 depolymerization unit was restarted in early2007, but it was Shaw’s purchase of Honeywell’s carpet fiber facilities in 2006 thatultimately made that happen. After purchasing the Honeywell interest inEvergreen, negotiations for the DSM portion of the joint venture gave Shaw 100percent ownership. In February 2007, Shaw reopened the Evergreen facility toproduce caprolactam for Shaw Nylon 6 polymerization operations. In 2007, Shawowned and operated the only commercially scaled postconsumer Nylon 6 monomerrecycling facility in the world. Invista and Solutia, the only producers of Nylon 6.6,had a long history of technical development and response to competitivechallenges. Promising work was under way in dissolution technologies that wouldallow postconsumer Nylon 6.6 to be recycled in an economical manner, restoringthe uneasy balance between the two nylon types on the environmental front. Nylon6.6 was here to stay, and industry observers said large-scale recycling of Nylon 6.6was a matter of when, not if, the process was perfected. However, in 2007 no hint ofplans for a Nylon 6.6 recycling facility had yet surfaced.
Environmental and Health Concerns Associated with Carpeting
After World War II, the design and manufacture of products from man-made andnaturally occurring chemicals provided a wide range of inexpensive, convenient,and dependable consumer goods on which an increasing number of people reliedworldwide. Behind the valuable medicines, plastics, fuels, fertilizers, and fabrics laynew chemicals and processes that were not time tested but appeared to havesuperior performance relative to prewar materials. Most of the polymer buildingblocks were developed by chemists between 1950 and 2000 as a result of and adriver of the post–World War II economic boom.
By the 1990s the growing rate of carpet usage had led to serious concern over wastedisposal; 95 percent of carpet ended up in landfills. In 2001, this waste stream was
Chapter 7 Buildings
7.3 Shaw Industries: Sustainable Business, Entrepreneurial Innovation, and Green Chemistry 508

reported at 4.6 billion pounds the United States.Carpet America Recovery Effort,“Memorandum of Understanding for Carpet Stewardship (MOU),” accessed January31, 2011, http://www.carpetrecovery.org/mou.php#goals. Growing water quality,cost, and land-use issues related to carpet disposal generated significant pressurefrom government and commercial buyers for the development of carpet recyclingtechnology. In January 2002, carpet and fiber manufacturers signed the NationalCarpet Recycling Agreement together with the Carpet and Rug Institute (theindustry trade association), state governments, nongovernmental organizations(NGOs), and the EPA. This voluntary agreement established a ten-year schedule toincrease the levels of recycling and reuse of postconsumer carpet and reduce theamount of waste carpet going to landfills. The agreement set a national goal ofdiverting 40 percent of end-of-life carpet from landfill disposal by 2012.
One result of the national agreement was the 2002 creation of the Carpet AmericaRecovery Effort, a partnership of industry, government, and NGOs designed toenhance the collection infrastructure for postconsumer carpet and report onprogress in the carpet industry toward meeting the national goals defined in theNational Carpet Recycling Agreement.Carpet America Recovery Effort,“Memorandum of Understanding for Carpet Stewardship (MOU),” accessed January31, 2011, http://www.carpetrecovery.org/mou.php#goals. In the late 1990sPresidential Executive Order 13101, a purchasing guide, was fueling demand for“environmentally preferable products” by government and by purchasers thatreceived federal funds. This program introduced the idea of multiple-environmental-impact purchasing evaluations as a replacement for the outdatedpractice of relying solely on recycled content as the measure of productsustainability.
However, the problems with carpeting would not be addressed so easily. Asmonitoring equipment capabilities advanced between 1990 and 2005, new healthand ecological impact hazards associated with certain widely used chemicals wereidentified. “Environment” was a topic that historically related to on-site toxins andcompliance activity, with “health” referring to effects that surfaced after theproduct left the company; both concerns were relegated to the environment,health, and safety office inside a corporation. But scientists, design engineers, andincreasingly middle and senior management needed to incorporate a broaderunderstanding of such concerns into the ways products were designed and made.This was particularly true in the construction and home furnishing sectors, wheregreater use of chemicals combined with less than adequate ventilation and morearchitecturally tight building designs to create health problems.
As far back as 1987, the US Consumer Product Safety Commission, the federalagency that monitors commercial product safety, received more than 130complaints about flu and allergy symptoms and eye and throat irritations that
Chapter 7 Buildings
7.3 Shaw Industries: Sustainable Business, Entrepreneurial Innovation, and Green Chemistry 509
began directly following the installation of new carpet. Although that was a smallnumber, this data often represented the tip of a health problem iceberg. Over thenext few years, air quality research led to the well-publicized concept of “sickbuilding syndrome”—a condition in which occupants experienced acute illness anddiscomfort linked to poor indoor air quality. Carpets were not the only culprits.Wall materials and wall coverings (paint and wallpaper) as well as varioushardwood floor treatments also were implicated. To the industry’s dismay, the EPAlisted “chemical contaminants from indoor sources, including adhesives [and]carpeting…that may emit volatile organic compounds (VOCs)” as contributors tosick building syndrome.American Lung Association, American Medical Association,US Consumer Product Safety Commission, and US Environmental ProtectionAgency, Indoor Air Pollution: An Introduction for Health Professionals, accessed January26, 2011, http://www.epa.gov/iaq/pdfs/indoor_air_pollution.pdf. It was not thebuilding that was sick. At the time, the US Centers for Disease Control reported“body burdens” of chemicals in people’s bloodstreams from unidentified sources.Under increasing study were babies’ body burdens—the pollutants in infants’ bloodand organ tissues—later known to result from placental cycling of blood, oxygen,and nutrients between mother and child.
Simultaneously, concern was building throughout the 1990s concerning PVC plasticthat contained phthalate plasticizers. Phthalates were added to PVC duringprocessing to make the resulting plastic soft and flexible; however, researchersdiscovered that phthalate molecules did not structurally bind to PVC, whichtherefore leached out of products. Though there was debate about the level of harmthat leaching caused humans, reputable studies linked phthalates to reproductiveand endocrine disorders in animals. Environmental health science reports andconcerns over PVC plasticizers grew steadily between 1995 and 2005. Californiaplanned to add di-2-ethylhexyl phthalate (DEHP) to a list of chemicals known tocause birth defects or reproductive harm. The list, contained in Proposition 65,followed on the heels of warnings from the Food and Drug Administration, NationalToxicology Program, and Health Canada that DEHP may cause birth defects andother reproductive harm. Furthermore, incineration of PVC released highly toxicorganochlorine by-products, including microscopic dioxins, into the atmosphere,where they moved with regional weather patterns, returning to the loweratmosphere and eventually to earth through the hydrologic cycle. Breathing indioxins had been linked to cancer, growth disruptions, and developmentalproblems in humans for many years from laboratory and production worker data.By July 2005, links between commonly used chemicals, even in very low doses, andhuman health deficiencies were being discussed on the front page of the Wall StreetJournal. Despite the evidence against PVC, the California Department of GeneralServices (DGS) approved PVC carpet tile in its 2006 California Gold Carpet Standardand instituted a 10 percent postconsumer recycled content requirement for all statecarpet purchases, which virtually guaranteed increased purchases of PVC carpets.The DGS also refused to allow exemptions for non-PVC materials that had not been
Chapter 7 Buildings
7.3 Shaw Industries: Sustainable Business, Entrepreneurial Innovation, and Green Chemistry 510
on the market long enough to be recovering adequate quantities of postconsumermaterial.
Many carpet manufacturers focused their early environmental efforts on reducingtrim waste from industrial and installation processes (eco-efficiency). Trim wastecost the industry an estimated $25 million per year in unused carpet productionand disposal fees, but this represented only 2 percent of total carpet productionand, though important, made a relatively small impact on the end-of-life wastevolume issue. As efficiency strategies became more systems oriented, a competitivemarket grew for technology to recover and recycle postconsumer carpet.
Indeed, for many years real solutions to the problems of end-of-life recycling ofcarpet were lost in the clutter of the first and easiest step in environmentalstewardship—reduction of materials, water, energy usage, and waste. Capabilitieswere developed—typically under a company’s environment, health, and safetyoffice—that essentially absorbed a quality and cost-cutting issue under thecompliance function. With respect to carpeting materials, efforts wereconcentrated on the 2 percent of all carpet materials that remained as scrap in themanufacturing plants. More than 98 percent of all materials entering the carpetmanufacturing stream were shipped to the customer as finished carpet. Once usedand in need of replacement, this postconsumer carpet traditionally ended its life inlandfills.
Other environmental efforts in the carpet industry focused on converting orrecycling products such as polyethylene terephthalate (PET) plastic bottles (wastestreams from other industries) into carpet fiber, incorporating the recoveredmaterials into new products. This effort was encouraged by the ComprehensiveProcurement Guideline (CPG) program (RCRA 6002, 1998), which required federalagencies to purchase items containing recovered and reused postconsumermaterials. Of the forty-nine items listed in the program, PET carpet face fiber,carpet backing, and carpet cushioning were included.US Environmental ProtectionAgency, “Indoor Air Quality: Indoor Air Facts No. 4 (Revised) Sick BuildingSyndrome,” last updated September 30, 2010, accessed January 26, 2011,http://www.epa.gov/iaq/pubs/sbs.html. EPA provided lists that gave priority toproducts containing a high percentage of postconsumer material. Shaw EcoWorxwas not included on the vendor list because while it was an innovativebreakthrough that would achieve a 100 percent recovery rate, it had yet tocomplete its initial life cycle. The CPG proposed designation of nylon carpets (fiberand backing). However, due to the lack of postconsumer nylon availability in themarket, the CPG designation would boost federal purchases of PVC carpets at a timewhen non-PVC carpets were increasing their market share but had not yet had timeto see postconsumer material returned and to therefore achieve CPG compliance.
Chapter 7 Buildings
7.3 Shaw Industries: Sustainable Business, Entrepreneurial Innovation, and Green Chemistry 511

In 2006, recycled plastic remained more costly than virgin fibers, which limited thecarpet industry’s enthusiasm for this measure. But plastic came from oil, afeedstock source increasingly subject to price volatility and unstable supply. Crudeoil prices rose from about $25 per barrel in the 1990s to more than $60 in 2006. Inthe face of this price uncertainty and consistent high oil prices, Shaw concentratedon and eventually achieved systems economics that resulted in the recoveredEcoWorx materials coming back as feedstock under the price of virgin materials.Standards such as the CPG may have served as a disincentive to material innovationif first-generation products such as EcoWorx had to have significant postconsumerrecycled content to qualify. The irony was that EcoWorx had won an EPA-sponsoredPresidential Green Chemistry Challenge Award in 2003 in the safer chemicalscategory, yet an EPA nylon carpet CPG designation would effectively preventfederal agencies from purchasing it. Shaw and others devoted significant resourcesover a four-year period to persuade EPA to abandon the nylon carpet CPGdesignation in favor of a multiple impact assessment of carpet.
Green Building Council and LEED
Steve Bradfield was an early supporter of the US Green Building Council’s (USGBC)Leadership in Energy and Environmental Design (LEED) program, which establishedstandards for environmentally preferred building materials and construction.Bradfield had participated for several years in the architecture and buildingindustries’ movement to reduce and eliminate problematic materials that wereincreasingly linked with respiratory, allergy, and other human health problems. In2003, Bradfield talked about Shaw’s sustainability policy. (The following year, hewould testify before Congress in support of green legislation.) Shaw’s policy,Bradfield explained, articulated the firm’s corporate strategy to move steadilytoward a cradle-to-cradle and a solar-powered future.
Chapter 7 Buildings
7.3 Shaw Industries: Sustainable Business, Entrepreneurial Innovation, and Green Chemistry 512
The Green Chemistry Research and Development Act of2004
House Committee on Science Hearing, March 17, 2004
Steve Bradfield, Vice President for Environmental Development, ShawIndustries, Representing the Carpet and Rug Institute
(Excerpt)
Imagine a future when no carpet goes to a landfill, but is separated into itsconstituent parts at the end of its useful life to be sustainably recycled over andover again. This is happening today with some carpet types, but not enough asyet to significantly divert the 4.5 billion pounds of carpet that went to ournation’s landfills in 2003. Green chemistry can help to develop beneficial uses for thematerials used to make carpet today and assure that steady progress is made towardsustainable materials that can go directly back into carpet production in the future.
Perhaps the most compelling reason to support green chemistry and thegrowth of sustainable materials and processes in carpet is jobs. Annual carpetproduction and consumption in the U.S. of $12 billion is equal to the rest ofworld carpet production and consumption combined. Carpet jobs will stay inthe U.S. if we can develop ways to keep postconsumer carpet materials insustainable closed-loop recycling systems that reduce the need for virgin rawmaterials and lower the energy embodied in successive generations of carpetproducts. Why would any U.S. company choose to manufacture overseas if theirvaluable raw materials are being collected and recycled at lower cost, with no sacrificeof performance, from American homes and businesses in close proximity to the means ofproduction?
The economic benefits of green chemistry are quantifiable in each of the example givenherein. As an industry, green chemistry has helped to reduce the water requiredfor dyeing a square yard of carpet from 14.9 gallons in 1995 to 8.9 gallons in2002. The energy required from thermal fuels to make a square yard of carpethas fallen from 14.5 million BTUs in 1995 to
Chapter 7 Buildings
7.3 Shaw Industries: Sustainable Business, Entrepreneurial Innovation, and Green Chemistry 513

10.3 million BTUs in 2002. Today the carpet industry has the same level of CO2
emissions it reported in 1990 yet it produces 40% more carpet.
Shaw’s experience with green chemistry is representative of the developments that areongoing in the industry. By way of illustration, Shaw’s polyolefin carpet tilebacking has fueled an average annual growth rate in carpet tile of almost 15%per year over the last four years. This growth provides 440 jobs in ourCartersville, Georgia, carpet tile facility and generates more than $100 millionin revenue. It has reduced packaging costs by 70%, shipping costs by 20% andresulted in more than $100,000 in annual postindustrial scrap recovery. Therecovery of the postconsumer carpet tile will result in even more second-generation savings. Other manufacturers can share economic success stories that arejust as compelling.
In 1950 the carpet industry shipped 97 million square yards of carpet. In 2001we shipped 1.879 billion square yards. Between 1965 and 2001 carpet increasedin price by 90.4% while the same time period saw an automobile increase180.4% and a combined total of all commodities increased 315.4%. More than80% of the U.S. carpet market is supplied by mills located within a 65-mileradius of Dalton, Georgia. Carpet is important to the economy of Georgia and theUnited States. Green chemistry is an important tool to facilitate its continued growth.
In conclusion, we support the adoption of the Green Chemistry Research andDevelopment Act of 2004 with the suggestions that Congress encourage acooperative effort among government, academia, and business; that Congressseek additional incentives to reward those companies that commercialize greenchemistry developments; that obstacles to the green chemistry discoveryprocess be removed from current federal environmental programs; and thatadoption of green chemistry in the broader context of sustainable productdevelopment should become a primary instrument of pollution preventionpolicy in the United States with the additional goals of job creation andeconomic improvement.Testimony accessed March 7, 2011,http://www.gpo.gov/fdsys/pkg/CHRG-108hhrg92512/html/CHRG-108hhrg92512.htm.
In 2006 LEED requirements did not factor in EcoWorx’s recovery and reuse benefitsin awarding points to companies looking to achieve higher LEED rankings. But theUSGBC had begun a dialogue on how to incorporate multiple metrics, includingcradle-to-cradle design points, into the 2007 version of LEED. At the same time,
Chapter 7 Buildings
7.3 Shaw Industries: Sustainable Business, Entrepreneurial Innovation, and Green Chemistry 514

many corporations that were committed to sustainability practices, or at leastwanted to gain positive publicity for their efforts, were setting LEED certificationlevels among their goals for their headquarters buildings.
Environmental pressure had been mounting for several years in the carpetindustry. Said William McDonough, architect, environmentalist, and promoter ofthe cradle-to-cradle design approach with Michael Braungart, “The carpet industryis the battlefield where the war for sustainability is being waged.”Alia Anderson,Andrea Larson, and Karen O’Brien, Shaw Industries: Sustainable Business,Entrepreneurial Innovation, and Green Chemistry, UVA-ENT-0087 (Charlottesville:Darden Business Publishing, University of Virginia, 2006). Indeed, so many carpetcompanies seemed to be actively marketing carpet sustainability in comparisonwith other industries that the question of “Why carpet?” is often asked. WithPresidential Executive Order 13101, the purchasing mandate, and others fueling thedemand for “environmentally preferable products” in government, a new breed ofenvironmentalist had appeared by the late 1990s, ready to constructively engagewith industry but still offering conflicting views of what constituted sustainabledesign in the absence of consensus on a national standard.
The first LEED Green Building Rating System was completed in 2000 and grewquickly into an internationally recognized certification program forenvironmentally sensitive design. Recognizing that buildings account for 30 percentof raw materials use and 30 percent of waste output (136 million tons annually) inthe United States,US Green Building Council, An Introduction to the US Green BuildingCouncil, accessed January 31, 2011, http://www.usgbc.org/Docs/About/usgbc_intro.ppt. the USGBC, an organization affiliated with the AmericanAssociation of Architects, gathered representatives from all sectors of the buildingindustry to develop this voluntary and consensus-based rating system. By adheringto an extensive point system with categories such as Indoor Environmental Quality,Materials and Resources, and Water Efficiency, both new buildings and interiorrenovations could become LEED certified at different levels of excellence (Basic,Silver, Gold, and Platinum). Carpet selection became an integral element of LEEDcertification through materials requirements such as “Recycled Content,” “Low-Emitting Materials–Flooring Systems,” and Low-Emitting Materials–Adhesives andSealants.”See, for instance, US Green Building Council, “LEED 2009,” accessedJanuary 31, 2011, http://www.usgbc.org//ShowFile.aspx?DocumentID=5719. ButLEED offered few incentives for other important environmental impact reductions.
Between 2000 and 2004, the LEED Green Building Rating System gathered more than3,500 member organizations and certified projects in 49 states and 11 countries.USGreen Building Council, An Introduction to the US Green Building Council, accessedJanuary 31, 2011, http://www.usgbc.org/Docs/About/usgbc_intro.ppt. LEED’scontinued influence in the building industry was secured by policies in the US
Chapter 7 Buildings
7.3 Shaw Industries: Sustainable Business, Entrepreneurial Innovation, and Green Chemistry 515

Department of the Interior, EPA, General Services Administration, Department ofState, Air Force, Army, and Navy, mandating differing levels of LEED standards forfuture buildings. By 2005 California, Maine, Maryland, New Jersey, New York,Oregon, and many cities across the United States also had legislated LEED standardsfor construction and procurement at various levels, either through mandates oncapital developments or tax credits to developers who met the requirements.USGreen Building Council, LEED Initiatives in Government by Type, May 2007, accessedJanuary 31, 2011, https://www.usgbc.org/ShowFile.aspx?DocumentID=1741.
Certifiers
Third-party organizations, both for profit and not for profit, were proliferating in2005–6 in a bid to gather the critical mass necessary to be recognized as the certifierof choice for many different aspects of the environmental patchwork of metricsdefining that elusive goal called sustainability. Even self-certification programsfrom various industry associations have attempted to build consensus. Recycledcontent seemed to be the path of least resistance, but life-cycle analysis, embodiedenergy studies, and variations on the complex theme of “closing the loop”proliferated and jockeyed for position in the new “industry” of environmental andhealth performance. Unfortunately, an inevitable “unintended consequence” ofthese efforts was confusion and controversy among stakeholders.
What Next?
As Steve Bradfield reflected on challenges in the near future, he said he hoped theinnovations required to implement the EcoWorx strategy would continue to drawon the extensive capabilities of Shaw and its partner firms. Certainly whatevertranspired had to be consistent with Shaw’s Environmental Vision Statement.Questions went through his mind. Did the company fully anticipate therequirements of reverse logistics systems design? Had they identified the probablechallenges and bottlenecks? Was the Shaw culture changing quickly enough toexecute the strategy successfully? Would the company have sufficient capacity forthe disassembly stage? The capacity of the elutriation system initially would allowShaw to recycle 1.8 million square yards of carpet per year. This equipment enabledseparation of the backing and fiber in a single pass and was expected to meet theanticipated future growth capacity requirement of the returned postconsumermaterial over the next five to ten years. But would the economics of the systemmeet the organization’s expectations?
Chapter 7 Buildings
7.3 Shaw Industries: Sustainable Business, Entrepreneurial Innovation, and Green Chemistry 516

Shaw’s Environmental Vision Statement
Environmental sustainability is our destination and cradle-to-cradle is ourpath. Our entire corporation and all stakeholders will value and share thisvision.
Through eco-effective technology we will continuously redesign our products,our processes, and our corporation.
We will take responsibility for all that we do and strive to return our productsto technical nutrient cycles that virtually eliminate the concept of waste.
We will plan for generations, while accepting the urgency of the present. Weare committed to the communities where we live and work. Our resources,health, and diversity will not be compromised.
We look forward to a solar-powered future utilizing the current solar income ofthe earth, anticipating declining solar costs and rising fossil fuel costs astechnology and resource depletion accelerate.
We will lead our industry in developing and delivering profitable cradle-to-cradle solutions to our free-market economy. Economy, equity, and ecology willbe continually optimized.
Honesty, integrity, and hard work remain our core values. We will continue todeliver unsurpassed safety, quality, design, performance, and value to ourcustomers.Shaw Industries, “Shaw Industries Announces New EnvironmentalPolicy to Drive Manufacturing Processes,” press release, December 4, 2003,accessed March 7, 2011, http://www.shawcontractgroup.com/Contentpress_releases./pr_031204_Environmental.pdf.
In 2007, Bradfield knew that EcoWorx had become a major driver in thephenomenal growth of Shaw’s carpet tile business. In late 2006, the company hadintroduced EcoWorx broadloom, a twelve-foot roll version of the EcoWorxtechnology that brought cradle-to-cradle design to the staid broadloom business.
Chapter 7 Buildings
7.3 Shaw Industries: Sustainable Business, Entrepreneurial Innovation, and Green Chemistry 517

Bradfield’s recent promotion to corporate director of environmental affairs for the$5.8 billion Shaw organization signaled the adoption of cradle-to-cradle goals acrossevery division and functional area—a major achievement given the humblebeginnings of what had started out as a commercial carpet initiative. A new Shawenvironmental website, http://www.shawgreenedge.com, offered a singledestination for anyone interested in the initiatives driving Shaw’s sustainabilityefforts.
KEY TAKEAWAYS
• There are many drivers behind sustainability innovation changes in alarge flooring firm.
• Cradle-to-cradle thinking can inform redesign and manufacturing ofnew flooring.
• Sustainability practices provide financial and strategic advantages.
EXERCISES
1. Create a graphic representation of the reverse supply chain. Whatchallenges do you think Shaw will have going forward?
2. Describe what you see as innovative in the case and list the factors youbelieve were drivers of that innovation.
3. Analyze and assess Shaw’s EcoWorx story as a strategy. What are thearguments in favor of it? Against it?
4. Explain the benefits to the firm of sustainable design using greenchemistry principles and cradle-to-cradle thinking.
5. What, if any, accounting consideration must be given a product that isexpected to return perpetually as a new raw material?
6. What use might the EcoWorx product, cradle-to-cradle, and greenchemistry principles have to inform product and process design in otherproduct markets? Bring an illustration to class to discuss.
Chapter 7 Buildings
7.3 Shaw Industries: Sustainable Business, Entrepreneurial Innovation, and Green Chemistry 518