This is an Open Access document downloaded from ORCA,...
16
This is an Open Access document downloaded from ORCA, Cardiff University's institutional repository: http://orca.cf.ac.uk/118412/ This is the author’s version of a work that was submitted to / accepted for publication. Citation for final published version: Davis, Timothy. A, van de Voort, Freeke, Rowlands, Kate, McAlpine, Stuart, Wild, Vivienne and Crain, Robert A. 2019. Evolution of the cold gas properties of simulated post-starburst galaxies. Monthly Notices of the Royal Astronomical Society 484 (2) , pp. 2447-2461. 10.1093/mnras/stz180 file Publishers page: https://doi.org/10.1093/mnras/stz180 <https://doi.org/10.1093/mnras/stz180> Please note: Changes made as a result of publishing processes such as copy-editing, formatting and page numbers may not be reflected in this version. For the definitive version of this publication, please refer to the published source. You are advised to consult the publisher’s version if you wish to cite this paper. This version is being made available in accordance with publisher policies. See http://orca.cf.ac.uk/policies.html for usage policies. Copyright and moral rights for publications made available in ORCA are retained by the copyright holders.
Transcript of This is an Open Access document downloaded from ORCA,...

This is an Open Access document downloaded from ORCA, Cardiff University's institutional
repository: http://orca.cf.ac.uk/118412/
This is the author’s version of a work that was submitted to / accepted for publication.
Citation for final published version:
Davis, Timothy. A, van de Voort, Freeke, Rowlands, Kate, McAlpine, Stuart, Wild, Vivienne and
Crain, Robert A. 2019. Evolution of the cold gas properties of simulated post-starburst galaxies.
Monthly Notices of the Royal Astronomical Society 484 (2) , pp. 2447-2461. 10.1093/mnras/stz180
file
Publishers page: https://doi.org/10.1093/mnras/stz180 <https://doi.org/10.1093/mnras/stz180>
Please note:
Changes made as a result of publishing processes such as copy-editing, formatting and page
numbers may not be reflected in this version. For the definitive version of this publication, please
refer to the published source. You are advised to consult the publisher’s version if you wish to cite
this paper.
This version is being made available in accordance with publisher policies. See
http://orca.cf.ac.uk/policies.html for usage policies. Copyright and moral rights for publications
made available in ORCA are retained by the copyright holders.

MNRAS 000, 1–15 (2018) Preprint 14 January 2019 Compiled using MNRAS LATEX style file v3.0
Evolution of the cold gas properties of simulated post-starburst
galaxies
Timothy A. Davis,1⋆ Freeke van de Voort,2,3 Kate Rowlands,4 Stuart McAlpine,5,6
Vivienne Wild7 and Robert A. Crain81School of Physics & Astronomy, Cardiff University, Queens Buildings, The Parade, Cardiff, CF24 3AA, UK2Heidelberg Institute for Theoretical Studies, Schloss-Wolfsbrunnenweg 35, D-69118 Heidelberg, Germany3Astronomy Department, Yale University, PO Box 208101, New Haven, CT 06520-8101, USA4Department of Physics & Astronomy, Johns Hopkins University, Bloomberg Centre, 3400 N. Charles St., Baltimore, MD 21218, USA5Institute for Computational Cosmology, Department of Physics, Durham University, South Road, Durham DH1 3LE, UK6Department of Physics, University of Helsinki, Gustaf Hällströmin katu 2a, 00560 Helsinki, Finland7School of Physics & Astronomy, University of St Andrews, North Haugh, St Andrews, Fife, KY16 9SS, UK8Astrophysics Research Institute, Liverpool John Moores University, 146 Brownlow Hill, Liverpool L3 5RF, UK
Received 14 January 2019; in original form 14 January 2019
ABSTRACT
Post-starburst galaxies are typically considered to be a transition population, en route to thered sequence after a recent quenching event. Despite this, recent observations have shownthat these objects typically have large reservoirs of cold molecular gas. In this paper we studythe star-forming gas properties of a large sample of post-starburst galaxies selected fromthe cosmological, hydrodynamical EAGLE simulations. These objects resemble observedhigh-mass post-starburst galaxies both spectroscopically and in terms of their space density,stellar mass distribution and sizes. We find that the vast majority of simulated post-starburstgalaxies have significant gas reservoirs, with star-forming gas masses ≈ 109 M⊙, in goodagreement with those seen in observational samples. The simulation reproduces the observedtime evolution of the gas fraction of the post-starburst galaxy population, with the averagegalaxy losing ≈90 per cent of its star-forming interstellar medium in only ≈600 Myr. A varietyof gas consumption/loss processes are responsible for this rapid evolution, including mergersand environmental effects, while active galactic nuclei play only a secondary role. The fastevolution in the gas fraction of post-starburst galaxies is accompanied by a clear decrease inthe efficiency of star formation, due to a decrease in the dense gas fraction. We predict thatforthcoming ALMA observations of the gas reservoirs of low-redshift post-starburst galaxieswill show that the molecular gas is typically compact and has disturbed kinematics, reflectingthe disruptive nature of many of the evolutionary pathways that build up the post-starburstgalaxy population.
Key words: galaxies: ISM – galaxies: evolution – galaxies: starburst – galaxies: star formation– galaxies: interactions – galaxies: kinematics and dynamics
1 INTRODUCTION
Ever since the first large-scale surveys revealed the diversity presentin the galaxy population, understanding morphology has formed akey part of the study of galaxy evolution. Blue, star-forming galax-ies appear very common in the early universe, while more quiescentearly-type galaxies (with a lenticular or elliptical morphology) be-gin to dominate at more recent times (e.g. Faber et al. 2007). Byredshift zero early-type galaxies contain ≈70 per cent of the stellarmass (Kelvin et al. 2014), and dominate the galaxy population indense environments (e.g. Oemler 1974; Dressler 1980). Given the
⋆ E-mail: [email protected]
strong time evolution of these two populations a key aspect of mod-ern astrophysics involves identifying and quantifying the differentmechanisms that quench and morphologically transform galaxies.
As with many questions of this type, identifying the populationof objects in transition from one type to another is crucial. Onesuch candidate transition population are the post-starburst (PSB)galaxies, which are thought to have been caught in the midst ofa rapid transition from star-forming to quiescent. These objectshave very low star formation rates (as indicated by their lack ofsignificant nebular emission lines), but strong Balmer absorptionlines (indicative of a large population of A- and F-type stars). Thissuggests that these galaxies have only ceased forming stars in thepast billion years, potentially after a large burst of star formation
© 2018 The Authors

2 Timothy A. Davis et al.
(Dressler & Gunn 1983; Couch & Sharples 1987). PSBs are thusamong the best candidates for objects that have been quenchedrapidly in their recent past. Some studies suggest around half of allgalaxies have experienced quenching in this manner on their way tothe red sequence (Martin et al. 2007; Wild et al. 2009; Smethurstet al. 2015; Wild et al. 2016). Understanding which processes act tocreate such objects is thus clearly vital.
In order to quench a star-forming galaxy, and turn it into aquiescent system, a large part of the cold atomic and molecular gasreservoir needs to be rendered inhospitable to star formation, eitherthrough gas heating or removal. Until recently, however, the coldgas reservoirs of PSBs had not been systematically surveyed. Thestudies of French et al. (2015) and Rowlands et al. (2015) wereamong the first to show that significant reservoirs of moleculargas remain in PSBs. Further studies followed, shedding light onthe molecular (e.g. Alatalo et al. 2016b; Yesuf et al. 2017; Suesset al. 2017), atomic (Chang et al. 2001; Zwaan et al. 2013; Klitschet al. 2017; Ellison et al. 2018), and dust (Smercina et al. 2018)properties of such systems. Taken together, these studies show thatlarge interstellar medium (ISM) masses are very common in thePSB galaxy population.
While studies of molecular gas reservoirs in early-type galaxies(e.g. Combes et al. 2007; Young et al. 2011; Davis et al. 2016) haveshown that there is no need to remove the entire molecular reservoirof a galaxy during quenching, the large molecular gas reservoirspresent in PSB galaxies (109–1010 M⊙) came as a surprise. Overall,it seems that star formation quenching in PSBs is not a result of gasexhaustion; there is no need to remove the molecular reservoir of agalaxy to trigger a PSB episode that could lead to quenching andgalaxy transition.
How a galaxy, which still has a significant cold gas reservoir,can become quiescent is an open question, which we aim to ad-dress here by studying the star-forming gas of PSB galaxies withinthe cosmological, hydrodynamic EAGLE simulation (Schaye et al.2015; Crain et al. 2015). Pawlik et al. submitted recently studied asmall sample of PSBs selected from EAGLE, and showed clearlythat these objects follow a diverse set of evolutionary pathways.They did not, however, consider the gas properties of these systemsin detail. Here we concentrate on understanding the cold gas inPSBs within EAGLE, selecting a large sample of objects at a rangeof redshifts. By comparing the observed PSB galaxies with thoseselected in the simulation we aim to shed light on their propertiesin the full cosmological context, and make predictions for resolvedobservations of the PSB galaxy population with e.g. the AtacamaLarge Millimeter/submillimeter Array (ALMA) and optical integralfield studies such as MaNGA (Bundy et al. 2015).
In Section 2 we describe the pertinent details of the EAGLEsimulation we use, the selection of PSBs, and the observed com-parison datasets. In Section 3 we describe the main results, beforediscussing and concluding in Section 4. Throughout the paper weuse a ΛCDM cosmology with parameters Ωm = 1 − ΩΛ = 0.307,Ωb = 0.04825, h = 0.6777, σ8 = 0.8288, n = 0.9611 (PlanckCollaboration et al. 2014).
2 METHOD
2.1 The EAGLE simulation suite
In this work we compare the observational properties of PSBs withsimulated galaxies from the ‘Evolution and Assembly of GaLaxiesand their Environments’ (EAGLE) project (Schaye et al. 2015; Crainet al. 2015; McAlpine et al. 2017). This project consists of a largenumber of cosmological hydrodynamical simulations with different
subgrid physics, simulation volumes, and resolution, which wererun using a modified version of the smoothed particle hydrodynam-ics (SPH) code gadget-3 (last described in Springel 2005). Herewe make use of the high time resolution outputs (referred to as‘snipshots’) produced from the largest (100 co-moving Mpc on aside) cubic periodic volume simulation (“Ref-L100N1504”), whichincludes both stellar and active galactic nucleus (AGN) feedback. Acomprehensive description of this simulation, and of the databaseof galaxy properties extracted from it, can be found in Schaye et al.(2015); Crain et al. (2015); McAlpine et al. (2017).
Due to numerical constraints the multi-phase structure of theISM in EAGLE is not resolved. In this work, where we wish to com-pare the simulated galaxies’ molecular ISM to observed samples,we assume that all of the star-forming gas particles are moleculargas dominated. This has been shown to provide a reasonable esti-mate of the molecular gas mass (Lagos et al. 2015). In EAGLE starformation proceeds in ‘dense’ gas (≥ 0.1 cm−3 at solar metallic-ity), and is modelled as in Schaye & Dalla Vecchia (2008). The starformation rate (SFR) per unit mass depends on the gas pressure,and is calibrated to reproduce the observed Kennicutt-Schmidt law(Kennicutt 1998).
Galaxies were found within the simulation using a Friends-of-Friends (FoF) algorithm to identify dark matter haloes, and thesubfind (Springel et al. 2001; Dolag et al. 2009) algorithm to findthe gravitationally bound particles and to identify sub-haloes. Thesub-halo containing the minimum of the gravitational potential isreferred to as the central, with the remainder referred to as satellites.Note that when the central and satellite are of a very similar massthere is ambiguity in the interpretation of this label. The centre ofeach sub-halo is defined by the position of its most bound particle.Stellar mass (M∗) is measured using the star particles associatedwith the galaxy’s sub-halo, but only including those within 30 properkpc of the galaxy’s centre in order to exclude intra-halo stars. Foreach galaxy the star-forming gas mass is calculated by summing themasses of all star-forming gas particles, again within 30 kpc of thecentre of each sub-halo.
The sub-grid model parameters within these simulations werecalibrated such that the output reproduces several key stellar prop-erties of observed galaxies (e.g. the stellar mass function, and thedistribution of stellar sizes at z = 0.1; Furlong et al. 2015, 2017).However, they were not tuned to reproduce any observable gas
properties of these systems. Nevertheless the reference simulationsreproduce, for instance, the H i and H2 masses and mass-fractionsin high mass (> 1010 M⊙) galaxies (Lagos et al. 2015; Bahé et al.2016; Crain et al. 2017), and the distribution of H i masses with en-vironment (Marasco et al. 2016). We note, however, that there maynot be sufficient cool gas in low-mass galaxies (Crain et al. 2017).Due to this issue we concentrate on the properties of reasonablymassive (M∗ > 109.5 M⊙) PSBs in this work.
2.2 Selecting PSBs
Post-starburst galaxies have, by definition, undergone a strong recenttruncation in their star formation history. Such truncations must berapid in order to produce the observed spectral signatures, which(dependent on the observational method) can remain observable for≈0.6 – 1 Gyr (e.g. Wild et al. 2010; French et al. 2018b).
In this work we select our PSB candidates by examining thestar formation histories (derived from the formation times and initialmasses of the stars present in each galaxy) for all massive (M∗ >
109.5 M⊙) galaxies in the “Ref-L100N1504” simulation. In orderto be selected as a PSB candidate, a galaxy must initially be star-forming, with a specific star formation rate (defined as the SFR
MNRAS 000, 1–15 (2018)

Gas properties of simulated PSBs 3
Figure 1. Specific star formation history (black line) for an example post-starburst galaxy. The red vertical line indicates tPSB, determined as described inSection 2.2, while the grey shaded area indicates the PSB period (tPSB to tPSB − 600 Myr). tburst is indicated by the orange line. Green vertical dashed linesshow the coalescence time for each of the > 1 per cent stellar mass fraction mergers this object experiences. Also shown as a blue curve is the instantaneousAGN accretion rate in this object. Our selection method cleanly identifies the large sSFR drop in this object, flagging it as a PSB candidate.
(a) Mock optical spectrum of PSB718 (b) PC space for PSB and control galaxies at tlook−back=3 - 4 Gyr.
Figure 2. Left: Mock spectrum of the example candidate galaxy from Figure 1, produced 200 Myr after the onset of its star formation burst, clearly showingthe strong Balmer absorption features typical of PSBs. Right: Principle components for all of the simulated PSBs at tlook−back=3 - 4 Gyr (red points; includingPSB718) and the rest of the galaxy population in the simulation at that z, showing that the simulated PSB’s clearly stand out in this space, and the vast majoritywould be selected by spectroscopic selection criteria.
per unit stellar mass; SFR/M∗) of a least 5 × 10⁻¹¹ yr−1, and thenexperience a sSFR drop of a least a factor of 5 within a period of600 Myr. We chose this timescale as it is well resolved by the eaglesnipshots (which have a mean spacing of ≈60 Myr), and similarto the observability timescale for PSB features in optical spectra.In order to check that our results remain robust to this choice, wevaried both the sSFR drop (>5, 10 or 20) and period considered(400, 600 or 1000 Myr). Although the number of objects selectedchanges in each case, the conclusions derived in this work remainrobust. Figure 1 shows an example star formation history for onesimulated galaxy selected as a PSB by our method.
We repeat this selection every 0.5 Gyr between z = 0 and z = 2,adding objects that meet our selection criteria (but were not selectedin previous time steps) to our sample. This procedure cruciallyallows us to select high redshift objects that undergo mergers withlarger objects at low redshifts, obscuring the drops in their combinedz = 0 star formation histories. We do not attempt to select objects
beyond z = 2.5 in this study. This selection results in a sampleof 1244 post-starburst candidates. A small fraction of these objects(≈2.7 per cent) have multiple PSB episodes (separated by more than600 Myr) during their evolution.
For each object, we define tPSB as the look-back time at thestart of the 600 Myr window which contains the largest sSFR drop.We note, however, that this time is not defined in the same way asone might do observationally, based on age dating of starburst sig-natures. By inspection of the star formation histories of our objects,we find a typical (population average) delay of 200 Myr betweenthe peak of a star formation burst and the start of the period of max-imum sSFR suppression (see Section 3.4). Thus in order to providea better observational comparison we define the look-back time tothe starburst as tburst = tPSB + 200 Myr.
2.2.1 Defining a control sample
As we are able to select a large sample of PSB candidates overa wide range of redshifts, it is important to construct a dedicated
MNRAS 000, 1–15 (2018)

4 Timothy A. Davis et al.
control sample with which to compare their properties. We thereforerandomly selected 10 comparison objects per PSB, which have thesame stellar and star-forming gas mass (within a tolerance of 0.1dex) as the PSB candidate in the snipshot closest to tPSB.
2.3 Observational comparisons
Many studies of PSBs have been conducted, using different selec-tion methods, and targeting galaxies at a large range of redshifts.In this work we are primarily interested in understanding the evo-lution of the cold ISM in PSBs, however, and so the majority ofour comparisons will be to the observational samples who haveobtained molecular gas observations and where burst age estimatesare available in the literature.
The first sample we consider, from French et al. (2015), usesa spectroscopic selection method, requiring objects to have strongstellar Balmer absorption lines (characteristic of a recent starburst),and little nebular emission (Hα equivalent widths < 3 Å in the restframe). The second sample, by Rowlands et al. (2015), uses theprinciple component analysis (PCA) based spectroscopic selectionmethod introduced by Wild et al. (2007), which selects high burstmass fraction, long duration starbursts/post-starbursts (French et al.2018b). The third sample is the shocked post-starburst galaxy sam-ple of Alatalo et al. (2016a) (with molecular gas measurementspresented in Alatalo et al. 2016b), who select galaxies with deepBalmer absorption lines and emission line ratios which are inconsis-tent with star formation (and which could be from shocks). We notethat we do not compare to the sample of green-valley PSB galax-ies which also host Seyfert-type AGN activity from Yesuf et al.(2017), because although molecular gas observations are available,age estimates for the PSB activity are not.
These data form the bulk of our comparison set, together com-prising 74 galaxies between z = 0 and z = 0.2 with moleculargas observations, spanning two orders of magnitude in stellar mass(109.5 – 1011.5 M⊙). Where we compare with other surveys beyondthese (for instance in order to extend to higher redshifts) this isdiscussed explicitly in the text.
3 RESULTS
3.1 Do EAGLE PSBs resemble those observed?
We identified a large population of galaxies that recently had a largedrop in sSFR within the simulation. However, observational studiesof PSBs are not able to select their candidates using the star for-mation histories (SFHs) directly, and instead rely on observationalproxies. Typically these selection methods revolve around obtain-ing galaxy spectra, and searching for strong A-type star signatures,such as a strong 4000 Å break, and strong Balmer absorption lines(Dressler & Gunn 1983).
In order to determine if our objects would be selected by suchmethods we created mock spectra of our simulated PSBs. Eachstellar particle in our simulated galaxies has an associated age andmetallicity. We used these parameters along with the (e-)MILES(Vazdekis et al. 2010, 2016) single-stellar population (SSP) library(with a Chabrier IMF and stellar isochrones from Pietrinferni et al.2004) to generate a stellar emission spectrum for each particle,which we then blue/red-shifted to take into account the mean motionof the star particle around the galaxy centre of mass. We neglectedthe effects of α-enhancement and dust extinction here, but do notexpect this to substantially alter our results. The final spectrum ofeach galaxy was then derived as the mass-weighted sum of theindividual particle spectra. A representative example is shown inthe left panel of Figure 2. This object underwent a 0.82 dex drop inits sSFR at z ≈ 0.28, and this spectrum (produced 200 Myr after the
Figure 3. Stellar mass distribution of the low redshift simulated PSBs (red,assuming a Chabrier 2003 IMF) our observational comparison set (blue),and a complete sample of PSBs from Pawlik et al. (2018) (green dashedhistogram) . PSBs selected in EAGLE reproduce the observed mass dis-tribution of the gas rich sample well, with a typical PSB mass of ≈1010.5
M⊙ .
onset of this drop) shows clear PSB signatures (i.e. a very strongBalmer break, and excess strong Balmer absorption).
In order to quantify this further we calculated the spectral in-dices of Wild et al. (2007) for our mock spectra. These indicesare defined from a PCA performed on a set of Bruzual & Charlot(2003) model spectra with exponentially declining SFHs and ad-ditional superimposed random bursts. The PCA results in a set ofeigenvectors ordered by the amount of variance that they accountfor in the library of spectra. The projection of any spectrum ontothe eigenvectors results in a set of principal component amplitudes,which describe the strength of the features in the spectrum. The firstprincipal component amplitude (PC1) is related to the strength ofthe 4000 Å break (equivalent to the Dn4000 index), and PC2 is theexcess Balmer absorption (of all Balmer lines simultaneously) overthat expected based on the 4000 Å break strength. The advantage ofthis method is the significant improvement in signal-to-noise ratioover the traditional method of measuring the Hδ absorption linealone. See Wild et al. (2007) for full details.
The strength of the different principle components allows fora clean selection of PSB candidates. In the right panel of Figure 2we show as an example PC1 against PC2 for all simulated galaxiesbetween look-back times of 3 and 4 Gyr (z ≈ 0.3), with our sim-ulated PSBs highlighted in red. The PSB spectra are calculated attPSB. While a host of model uncertainties (e.g. with stellar popula-tion models, dust corrections etc.) are present, the simulated PSBsare clearly distinct from the rest of the population, and the majoritywould be cleanly selected as a PSB by the PCA method if observedaround tPSB.
Other methods of selecting PSBs also exist, and each has a dif-ferent set of strengths, limitations, and biases (Goto 2005; Goto et al.2008; Yan et al. 2009; Alatalo et al. 2016a). This test demonstrates,however, that the simulated PSBs, selected as described in Section2.2, have the correct features required to be selected observation-ally and thus it is reasonable to use these systems to understand theevolutionary processes shaping the observed PSBs.
3.1.1 Stellar masses
Figure 3 shows a comparison of the stellar masses of the simulatedPSBs (at tPSB; shown in red) to the stellar masses of the low red-
MNRAS 000, 1–15 (2018)

Gas properties of simulated PSBs 5
Figure 4. Median half-mass size of the stellar component of the simulatedPSBs (red curve) and the control sample (blue curve) as a function oflook-back time. The shaded regions around the median show the 16th and84th percentiles. The dotted line shows three times the maximum baryonicsmoothing length (ǫbaryon) in the EAGLE simulation, below which galaxysizes are not well converged. PSBs are smaller than the control galaxies atall redshifts.
shift molecular gas rich PSB galaxies from our comparison sample(shown in blue) and to the stellar masses of the complete sampleof low redshift PSB galaxies from Pawlik et al. (2018) (shown as adashed green histogram) . The masses calculated from the simula-tion take into account stellar evolutionary processes such as massreturn to the ISM, and include stellar remnants.
The simulated PSB galaxies are higher mass, on average, thanthose found observationally in complete surveys. This suggests EA-GLE may struggle to reproduce these lowest mass PSB galaxies(perhaps due to its limited mass resolution, and the known deficit ofcold gas in EAGLEs low mass systems; Crain et al. 2017). Despitethis, the simulated PSBs do reproduce the stellar mass distribution ofthe objects observed in molecular gas well. A Kolmogorov-Smirnovtest conducted on the mass distribution of the simulated PSBs andthe CO observed galaxies returns as probability of 0.27, thus weare unable to reject the hypothesis that the stellar masses of theobserved and simulated galaxies are drawn from the same distribu-tion. The EAGLE galaxies thus seem to have a mass distributionsimilar to our gas rich comparison objects, and thus can act as a faircomparison sample.
Breaking down the stellar mass distribution as a function oftime, we find that the stellar masses of the selected PSBs in EAGLEshow essentially no redshift dependence. At low redshifts the me-dian stellar mass of the simulated PSBs is 1010.3 M⊙ . It increasesmarginally to 1010.5 M⊙ at z = 0.7, and then declines slightly to1010.4 M⊙ at z = 1.5. This is somewhat at odds with the resultsof several observational studies (e.g. Wild et al. 2016; Rowlandset al. 2018a), which do find significant evolution in the PSB massfunction. This discrepancy is likely due to the anomalously smallnumber of PSBs at low masses within EAGLE.
3.1.2 PSB sizes
Figure 4 shows the median half-mass radius of the stellar componentof the simulated PSBs (red line) as a function of time. The shadedregion around the median denotes the 16th and 84th percentiles
(i.e. the 1σ scatter). We also plot the size evolution of the controlpopulation (blue dashed curve). One can immediately see that themedian sizes of the simulated PSBs are always smaller than those ofthe control galaxies. This size discrepancy increases with redshift,from a factor of 0.1 dex at z = 0, up to 0.3 dex at z = 2. Wedo, however, note that size of objects in the simulations becomeuncertain as they approach ∼3 times the gravitational softeninglength (ǫbaryon, shown as a dotted black line in Figure 4). As thesizes of the simulated PSBs at high redshift decrease below thislimit they should be treated as upper limits.
The strong radius evolution of the PSB population agrees withthat found in several recent studies (e.g. Almaini et al. 2017; Maltbyet al. 2018; Wu et al. 2018). Maltby et al. (2018) in particularstudied the size evolution of observed high redshift PSBs and theirparent population in two redshift slices. Although their lower red-shift sample is not comparable to our simulated galaxies due to adifferent stellar mass distribution, the higher redshift galaxies can bedirectly compared, and are shown as red and blue datapoints (withassociated errors) in Figure 4. These observational size estimatesappear consistent with those from the simulation, especially giventhe different measurement techniques (half mass radii are defined in3 dimensions in this work, while half light radii were measured asprojected on the sky in Maltby et al. 2018) and the resolution limitof our simulations.
3.1.3 PSB number densities
Given that we have been able to track the PSB population in thesimulation across cosmic time, it is interesting to consider whetherthe number density of sources we find matches that found in ob-servations. Figure 5 shows the number density of simulated PSBswith M∗ > 1010.6 M⊙ (where this mass cut was adopted in orderto match the selection cuts within the observations, and ensure weare not affected by the lack of low-mass PSBs in EAGLE) plottedas a function of look-back time in 600 Myr bins. We find an in-creasing trend in the PSB number density out to a look-back timeof ≈8 Gyr (z≈1), after which it begins to decline. Also shown ascoloured data-points with error bars are the measurements of PSBnumber densities from the studies of Wild et al. (2016); Rowlandset al. (2018b) and Forrest et al. (2018), which (given their differingmethods and selection criteria) agree reasonably well with those ex-tracted from the simulations. This suggests that the observed declinein the number density of high-redshift PSBs may be physical, andnot a consequence of high-redshift PSBs being heavily obscured.
In conclusion, the simulated PSBs selected as described inSection 2.2 have similar stellar masses, stellar sizes and numberdensities to observed PSBs, giving us confidence that we are select-ing comparable objects. Below we compare the gas properties ofthese objects, and make predictions for future observations.
3.2 Cold gas content
In the preceding sections we have shown that we are able to selectPSB galaxies from the EAGLE simulations that resemble observedPSB galaxies. We here go on to study the star-forming gas propertiesof the simulated PSBs, how these match those of observed PSBs, andwhat these diagnostics tell us about the evolution of these objects.
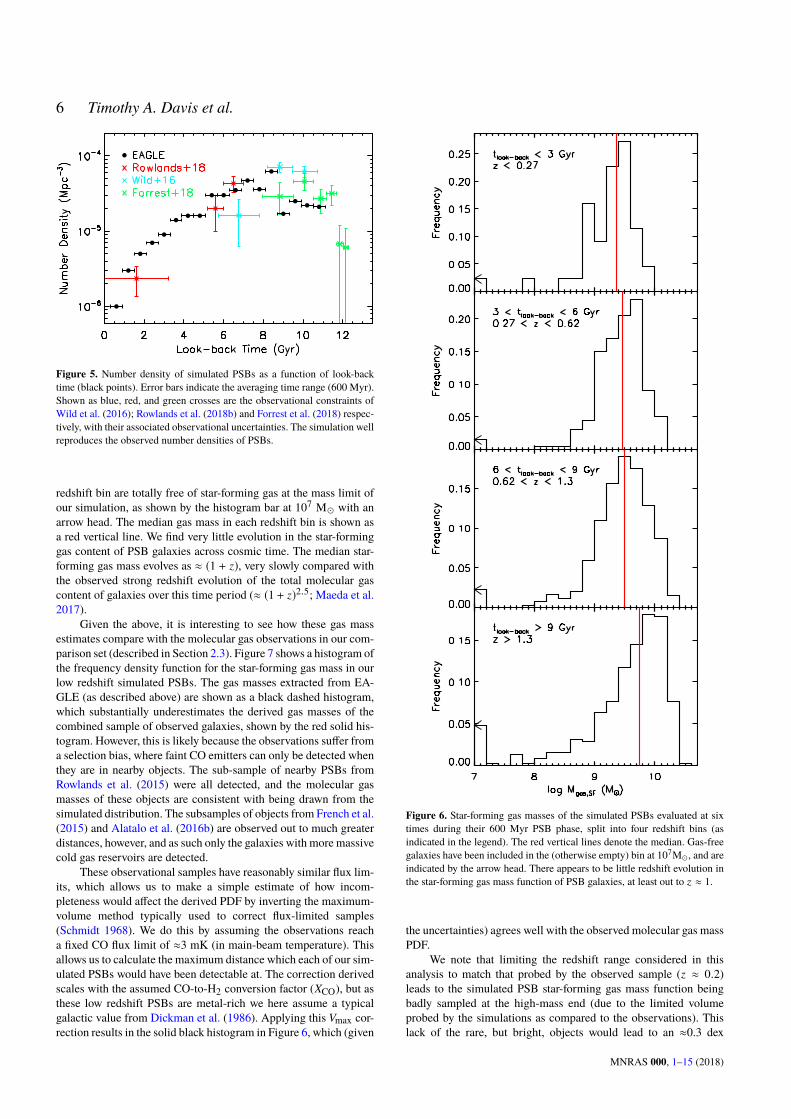
Figure 6 shows the star-forming gas mass of the simulatedPSBs, split into four redshift bins. As observed PSBs are captured atdifferent times during their PSB phase, we here sample the gas massof each simulated object six times after tburst, at 100 Myr intervals(the results are not sensitive to this choice of time sampling). Oursimulated PSBs have star-forming gas masses between 107 and1010.6 M⊙ . A small fraction (<5 per cent) of the PSBs in each
MNRAS 000, 1–15 (2018)
6 Timothy A. Davis et al.
Figure 5. Number density of simulated PSBs as a function of look-backtime (black points). Error bars indicate the averaging time range (600 Myr).Shown as blue, red, and green crosses are the observational constraints ofWild et al. (2016); Rowlands et al. (2018b) and Forrest et al. (2018) respec-tively, with their associated observational uncertainties. The simulation wellreproduces the observed number densities of PSBs.
redshift bin are totally free of star-forming gas at the mass limit ofour simulation, as shown by the histogram bar at 107 M⊙ with anarrow head. The median gas mass in each redshift bin is shown asa red vertical line. We find very little evolution in the star-forminggas content of PSB galaxies across cosmic time. The median star-forming gas mass evolves as ≈ (1 + z), very slowly compared withthe observed strong redshift evolution of the total molecular gascontent of galaxies over this time period (≈ (1 + z)2.5; Maeda et al.2017).
Given the above, it is interesting to see how these gas massestimates compare with the molecular gas observations in our com-parison set (described in Section 2.3). Figure 7 shows a histogram ofthe frequency density function for the star-forming gas mass in ourlow redshift simulated PSBs. The gas masses extracted from EA-GLE (as described above) are shown as a black dashed histogram,which substantially underestimates the derived gas masses of thecombined sample of observed galaxies, shown by the red solid his-togram. However, this is likely because the observations suffer froma selection bias, where faint CO emitters can only be detected whenthey are in nearby objects. The sub-sample of nearby PSBs fromRowlands et al. (2015) were all detected, and the molecular gasmasses of these objects are consistent with being drawn from thesimulated distribution. The subsamples of objects from French et al.(2015) and Alatalo et al. (2016b) are observed out to much greaterdistances, however, and as such only the galaxies with more massivecold gas reservoirs are detected.
These observational samples have reasonably similar flux lim-its, which allows us to make a simple estimate of how incom-pleteness would affect the derived PDF by inverting the maximum-volume method typically used to correct flux-limited samples(Schmidt 1968). We do this by assuming the observations reacha fixed CO flux limit of ≈3 mK (in main-beam temperature). Thisallows us to calculate the maximum distance which each of our sim-ulated PSBs would have been detectable at. The correction derivedscales with the assumed CO-to-H2 conversion factor (XCO), but asthese low redshift PSBs are metal-rich we here assume a typicalgalactic value from Dickman et al. (1986). Applying this Vmax cor-rection results in the solid black histogram in Figure 6, which (given
Figure 6. Star-forming gas masses of the simulated PSBs evaluated at sixtimes during their 600 Myr PSB phase, split into four redshift bins (asindicated in the legend). The red vertical lines denote the median. Gas-freegalaxies have been included in the (otherwise empty) bin at 107M⊙ , and areindicated by the arrow head. There appears to be little redshift evolution inthe star-forming gas mass function of PSB galaxies, at least out to z ≈ 1.
the uncertainties) agrees well with the observed molecular gas massPDF.
We note that limiting the redshift range considered in thisanalysis to match that probed by the observed sample (z ≈ 0.2)leads to the simulated PSB star-forming gas mass function beingbadly sampled at the high-mass end (due to the limited volumeprobed by the simulations as compared to the observations). Thislack of the rare, but bright, objects would lead to an ≈0.3 dex
MNRAS 000, 1–15 (2018)

Gas properties of simulated PSBs 7
Figure 7. Probability density distribution for the star-forming gas mass inour simulated PSBs at z < 0.8. This is shown directly as found withinthe simulation (dashed black histogram), and with a simple correction forselection bias as described in the text (solid black histogram). Our simulatedgalaxies match well the observed star-forming gas mass distribution (redsolid histogram).
underestimate of the PSB star-forming gas mass function. Giventhe negligible star-forming gas mass function evolution found outto z ≈ 1 (see Figure 6) we overcome this by extending the redshiftrange considered out to z ≈ 0.8, providing a better sampling of thePDF, and obtaining good agreement with the observations.
From our selection-bias corrected PDF (in Figure 7) we can es-timate the detection rate we would expect the observational surveysto reach if their objects were randomly drawn from our simulatedPSB population. At the flux completeness limit listed above wewould predict a detection rate of ≈45 per cent, which (given thesimplicity of our approach) matches well with the detection frac-tion of 53 per cent found in French et al. (2015). This shows thatthe detection of large gas reservoirs in PSBs, as recently found bya series of authors, is to be expected, and is a natural consequenceof the mechanisms causing the PSB episode, which we considerfurther in Section 3.5.
3.3 Cold gas evolution
Recent work by French et al. (2018b) used a spectral synthesismethod to determine the time since the PSB episode began for ourobservational comparison sample galaxies (those from French et al.2015; Rowlands et al. 2015; Alatalo et al. 2016b). They use thesetimes to consider the evolution of the cold gas mass in PSB objects,and determine that a relatively quick evolution is ongoing, withan exponential decay timescale of ≈117-230 Myr. They use thisas evidence to support a role for active galactic nuceli (AGN) inquenching PSBs. The amount of emission from polycyclic aromatichydrocarbons in PSBs also seems to be decreasing quickly withpost-burst age, supporting a rapid evolution of the ISM during thisphase (Smercina et al. 2018). Both of theses studies were, however,hampered by lack of knowledge on the initial gas/dust fractionsof their objects. We thus here check whether the simulated PSBsreproduce the trend seen in French et al. (2018b), and if a consistentpicture emerges for the evolution of the cold gas mass content ofgalaxies after their PSB episode.
In Figure 8 we show (as coloured pixels) the ratio of star-forming gas mass to stellar mass in each of our simulated PSBs at100 randomly selected times (in the range −1 to +1.2 Gyr) aroundtburst. Also plotted as black points (with their respective error bars)
Figure 8. Ratio of the star-forming gas mass to stellar mass in the simulatedPSBs in the period around their PSB episode (where pixels show the loga-rithm of the number of points in that bin as colour). Shown as black pointswith errors are the observational estimates of gas fractions and post starburstevent times from French et al. (2018b). The simulations match the observeddecline in the gas-to-stellar mass fraction as a function of time.
are the starburst age measurements for our observational compar-ison sample (French et al. 2018b). The vast majority of the mea-surements fall within regions well sampled by our simulated PSBs,suggesting the simulations can well reproduce the observed timeevolution of the star-forming gas mass fraction.
We note that several of the different evolutionary pathways forPSBs highlighted in Pawlik et al. submitted are also visible in the latetime evolution of PSBs in Figure 8, with some galaxies continuingto lose gas mass (consistent with a blue-to-red evolution) whileothers begin to rebuild their star-forming gas reservoir (a blue-to-blue evolutionary pathway).
Given the reasonable agreement between the observations andsimulations on the post-burst evolution of the gas-to-stellar massfraction in PSB population, it is interesting to determine if there isan underlying relation, and how individual objects evolve.
In Figure 9 we show the evolution of the gas-to-stellar massfraction as a function of time after the onset of the PSB episode,normalised by the initial gas fraction of each galaxy at tburst =
0. Normalising the gas-to-stellar mass fraction removes much ofthe scatter seen in Figure 8, revealing a reasonably tight relationbetween post-burst age and (normalized) gas-to-stellar mass ratio.The median relation is shown as a black dashed line, which declinesfor ≈0.6 Gyr, before flattening. In order to compare the relativetimescales for these processes we fit the distribution with a doubleexponential function (Equation 30 in Erwin 2015) using the IDLimplementation of the mpfit algorithm (Markwardt 2009). Thebest-fit is shown as red line in Figure 9. We find that the initialdecline of the star-forming gas-to-stellar mass fraction is consistentwith a fast exponential decay with a characteristic timescale of≈ 300 ± 10 Myr. This is similar to the decline time found in bothWild et al. (2010) and Rowlands et al. (2015), and a little longer thanthe gas fraction depletion timescale in French et al. (2018b). Aftera period of ≈620±50 Myr this decay transitions to a slow declinewith a typical timescale of 3±0.5 Gyr, reasonably consistent withthe usual molecular gas depletion timescale of spiral galaxies (≈2Gyr, e.g. Bigiel et al. 2008), suggesting whichever violent event isdepleting gas early on after the PSB event is typically no longerdominant after this time. We note that this change in behaviour isrobust to variation in the criteria used to select our simulated PSBs.
MNRAS 000, 1–15 (2018)

8 Timothy A. Davis et al.
Figure 9. As Figure 8, but showing the ratio of the star-forming gas massto stellar mass, normalised by the initial gas fraction in our low redshiftsimulated PSBs (z < 1) at tburst. Also shown as a black dashed line is themedian trend, while the solid red line is the best fit broken exponential witha decay timescale of ≈350 Myr and break time of ≈600 Myr.
For instance the same transition at around 600 Myr after tburst isobserved if one selects objects with sSFR drops within periods of400, 600 or 1000 Myr.
In order to determine what fraction of our galaxies follow therelation shown in Figure 9 we fitted an exponential function to thefirst 600 Myr of evolution of each galaxy after their PSB event. Agalaxy was considered to be following the median trend if the gradi-ent of their gas fraction evolution with time is the same (within thefitted error) as that for the whole population. Interestingly, around70 per cent of PSBs follow the median trend, suggesting that Figure9 does trace an evolutionary pathway which is followed by manyPSBs, despite the many possible mechanisms depleting their gas(see Section 3.5).
3.4 Star formation efficiency evolution
Many PSBs are thought to have undergone a recent burst of starformation, perhaps thanks to a recent merger or accretion episode.Such bursts seem to increase the efficiency of star formation, as ob-served in some luminous and ultra-luminous infrared galaxies (e.g.Daddi et al. 2010; Genzel et al. 2010). Observationally, galaxies ina PSB phase have a longer gas consumption timescale (defined asTdep ≡ Mgas,sf /SFR) than is typical in normal spiral galaxies, pos-sibly due to these systems having a low dense gas-fraction (Frenchet al. 2018a). In this way PSBs are similar to early-type galaxies,which also host residual low-efficiency star formation (e.g. Sain-tonge et al. 2011; Davis et al. 2014). Indeed, the longest gas de-pletion times are found in early-type galaxies which have recentlyundergone a gas-rich minor merger (Davis et al. 2015; van de Voortet al. 2018).
Due to the finite mass limit and the way star formation is pa-rameterised in the EAGLE simulations there is only a limited rangeof depletion times which are allowed by the sub-grid model, de-pending on the gas pressure (or equivalently its density; see Section2). Despite this, it is interesting to see whether any of the observedtrends in depletion time are reproduced in our simulated objects. InFigure 10 we show the depletion time as a function of time relativeto tburst for each of our simulated PSBs. The interpolated evolu-tion of the depletion time in each object is sampled every 0.1 Myr,creating a 2D histogram. The median trend, and 16th, and 84th per-centile of the distribution are indicated with red/orange solid and
dot-dashed curves for PSBs at z > 0.5 and z < 0.5, respectively.Where available, we also show the depletion time of the comparisonsample objects from French et al. (2015) and Rowlands et al. (2015),shown as black points (or black triangles for those with measureddepletion times > 10 Gyr).
The majority of simulated PSBs form a sequence with fairlyconstant depletion times (of≈1 - 1.5 Gyr, dependent on redshift) be-fore their PSB incident. A small number of (primarily high redshift)PSBs have efficient starbursts during this time (with depletion timesbelow ∼300 Myr), typically caused by ongoing mergers. Aroundtburst there is a significant increase in the fraction of galaxies under-going efficient starbursts, with ≈16 per cent of objects in the timeperiod tburst ± 0.2 Gyr having depletion times below ∼300 Myr. Wenote that this fraction is redshift dependent, with only 6 per centof PSB objects at z < 1 undergoing such a clear burst of high effi-ciency star formation. This does not mean that other objects at lowredshift did not experience a burst of star formation, but rather thatany burst that may be present had a normal SFE.
After the PSB phase starts, we see a clear shift towards longerdepletion times, with the median object doubling its depletion time(from ≈1 to ≈2 Gyr), and many objects reaching the longest deple-tion times allowed by the EAGLE subgrid model (≈3.5 Gyr for highmetallicity gas at the lowest ISM densities). While this evolutionis small compared to that present in the observed PSBs, given theparameterised star formation model of EAGLE this difference issignificant, and below we attempt to understand its origin.
Figure 11 shows the half-mass size of the star-forming gasin the high redshift simulated PSBs, plotted as a function of timearound tburst. The median trend, and 16th and 84th percentile ofthe 2.5 > z > 0.5 distribution are indicated with red solid and dot-dashed lines respectively, while these quantities for low-redshift(z < 0.5) galaxies are shown as orange curves.
The median half-mass size of the gas reservoir in the simulatedPSBs decreases from ≈10 (proper) kpc to ≈3 kpc just before thePSB event. This compaction is likely caused by the inflow of gas(e.g. Zolotov et al. 2015). This inflow is due to dissipation during amerger in many cases, but can also be due to environmental effects(e.g. ram pressure stripping unbinding and heating gas from theouter parts of galaxies).
After tburst the median size of the gas reservoir remains com-pact for at least a Gyr, at least at low redshifts. However in z > 0.5PSBs the median size of the gas reservoir appears to increase, andafter≈0.3 Gyr returns to approximately the same size as before. Thisis despite an ≈5 fold decrease in the gas mass present (see Figure9), implying that the mean gas density is significantly lower. Thistrend of increasing post-burst half-mass gas size at higher redshiftis driven by the higher fraction of increasingly gas rich mergers,which result in disturbed, non-equilibrium gas structures (such astidal tails). Thus the median size reported in Figure 9 should not beinterpreted as the size of the remaining equilibrium gas structuresin these galaxies - which can be significantly more compact.
While the ISM model in EAGLE is simplified (putting star-forming gas on an effective equation of state) it is possible to con-sider how the relative density of the ISM changes over the PSBepisode. Figure 12 shows the “dense gas fraction” - here defined asthe mass fraction of star-forming gas above a hydrogen number den-sity of 1 cm−3 (a factor of 10 above the star-formation threshold),as a function of time around tburst. The median trend, and 16th and84th percentiles of the distribution are indicated with red solid anddot-dashed curves respectively for high redshift PSBs, while thesequantities for low-redshift (z < 0.5) galaxies are shown as orangecurves. We caution that these values cannot be directly compared
MNRAS 000, 1–15 (2018)

Gas properties of simulated PSBs 9
Figure 10. Evolution of the gas depletion time during the period aroundthe PSB phase of each of our simulated galaxies. Shown in red and orangecurves are the median (solid curve) and 1σ scatter (dot-dashed curve) for thehigh redshift (z > 0.5) and low redshift (z < 0.5) PSBs, respectively. Alsoshown as black datapoints are the observations of French et al. (2015) andRowlands et al. (2015). The longest depletion times allowed by the EAGLEsubgrid star formation model is ≈ 10
9.55 Gyr for a high metallicity gas atthe lowest ISM densities. A clear evolution to longer depletion times is seenafter the PSB event (black dashed line).
to those computed from e.g. observed HCN emission (French et al.2018a). Instead this is simply a summary statistic that can revealwhy the SFE in the simulation changes - which may plausibly be thesame mechanism (on different scales) as probed by the observations.
The median dense gas fraction is high in the simulated PSBsbefore their PSB episode, with >50 per cent of the gas mass residingin particles with densities >1 cm−3 when one averages over allredshifts. At low redshift the median dense gas fraction is somewhatlower, with around 30 of the mass above this density threshold. Thedense gas fraction increases slightly at the time each object becomesa PSB, before decreasing markedly, at a similar rate to which theSFE itself declines.
Figures 11 and 12 paint a consistent picture, where PSB galax-ies evolve to have long depletion times due to a lower dense gasfraction (as suggested by French et al. 2018a). We predict that futureresolved molecular gas observations would find compact molecularreservoirs in low-redshift PSBs, and possibly larger sizes in theirhigher redshift analogues. Size measurements made using integral-field spectroscopy, or photometry in the rest-frame blue/ultravioletmay also be able to observe the same trend.
3.5 Quenching mechanisms
As discussed in Section 3.3, the initial evolution of the star-forminggas-to-stellar mass ratio in the simulated PSBs is fairly rapid (seeFigure 9), with an exponential decay timescale of ≈ 300 Myr. Whilethis is somewhat slower than the ≈117-230 Myr found by Frenchet al. (2018b), it is fast compared to gas depletion times typicallyobserved for unperturbed galaxies. Star formation driven winds donot seem to be dominant cause of gas removal in these systems,because the majority of the gas removal seems to be happeninghundreds of millions of years after the star formation rate has alreadydropped. Observational evidence suggests that a variety of processescan be important in producing PSB galaxies (e.g. Wu et al. 2018).Within the simulation it is possible to narrow the potential causesof this rapid evolution, and reveal the processes quenching PSBs.
Figure 11. As Figure 10, but showing the half-mass size of the star-forminggas in the simulated PSBs, as a function of time around the start of their PSBepisode. The median trend is for compaction of the gas reservoir to occurduring the 2 Gyr before the PSB episode. After the PSB phase begins thereservoir expands at high redshift, but stays compact at low redshift.
Figure 12. As Figure 10, but showing the dense gas fraction (here defined asthe fraction of the star-forming gas mass above hydrogen number densitiesof 1 cm−3), as a function of time around the start of the PSB episode of eachgalaxy. The dense gas fraction increases up until the PSB episode, and thendecreases, lowering the SFE.
3.5.1 AGN activity
AGN have been implicated in the removal of gas from PSBs, sowe here consider their prevalence and importance in quenching oursimulated PSBs.
Non-zero black hole accretion rates are ubiquitous in EAGLE,and hence it is vital to compare the accretion rates of our PSBsubsample with the equivalent activity in each individual objectsmass-matched control sample. Although ≈1/3 of our PSBs havedetectable (here defined as Lbol > 1043 erg/s) bursts of AGN activityduring the 600 Myr period of their PSB episode, we find that onlya small fraction (≈9 per cent) show any signature of enhancedAGN accretion (here defined as a peak accretion rate > 3σ abovethe median level in the control population) during this period. Asimilar fraction of PSBs have enhanced mean accretion rates (whenaveraging over the whole 600 Myr PSB period) than the controlsample objects. The fraction of objects with enhanced AGN activityincreases only slightly (to ≈10 per cent) if one also considers the
MNRAS 000, 1–15 (2018)

10 Timothy A. Davis et al.
Figure 13. As Figure 10, but showing the instantaneous AGN accretionrate of the simulated PSBs, divided by the median accretion rate in everyindividual objects control galaxies. This is plotted as a function of timearound the PSB episode of each galaxy. Low and high redshifts show thesame dependance. Only around the beginning of the PSB episode do ourPSB canadidates have slightly higher than average accretion rates.
period up to 300 Myr before the PSB phase begins, where starburstsare important.
This is shown in more detail in Figure 13, which shows theblack hole accretion rate (computed using Equation 1 in McAlpineet al. 2017 and evaluated instantaneously at the time of each outputsnipshot) of the simulated PSBs divided by the median accretion ratein that objects control sample, as a function of time for the periodaround tburst. The median trend, and the 16th, and 84th percentile ofthe distribution are indicated with red solid and dot-dashed curvesrespectively. The PSBs span over 7 orders of magnitude in thisspace, reflecting the strong temporal variability in AGN accretion(see Fig 1 in McAlpine et al. 2017). As a population the PSBshave somewhat lower accretion rates on average than the controlgalaxies at almost all times, apart from at tburst, when starbursts areoccurring. This may be because the black-holes in these systemshave yet to enter a rapid growth phase (see McAlpine et al. 2018;McAlpine et al. in prep).
Overall this suggests the AGN are important in removing thegas from some objects, but cannot be the sole cause, as accretionrates are very low for some objects going through a PSB episode.
This statistical view of the population is confirmed when oneconsiders the individual histories, such as the one shown in Figure 1,where there is little to no correlation between the AGN activity andthe PSB episode itself. This object does undergo a significant AGNoutburst at the end of its post-starburst phase, once the galaxy isalready quiescent. This is not a general feature of the population,however, as we find no significant increase of AGN activity in oursimulated PSBs for at least 2 Gyrs post-burst when compared withtheir controls. Although EAGLE tracks the accretion rate onto theSMBH sink particles within the simulation, the time resolution withwhich these are output is much lower than the variability timescaleof AGN, and thus it is possible we are missing important energyinjection episodes. In addition, it is somewhat tricky to determine ifany AGN activity present is actually the true cause of gas removal,as it often coincides (and is likely triggered by) the presence ofother mechanisms (for instance mergers) which funnel gas towardsthe SMBH and may also remove it from the system. Given thesecaveats, the above values should be treated with caution, but still
suggest that AGN are not the dominant cause of gas removal in PSBsystems in EAGLE.
3.5.2 Environmental Quenching
The higher incidence of PSB galaxies observed in the densest en-vironments (Paccagnella et al. 2019) suggests that the processesoperating in the most massive haloes, such as ram pressure strip-ping (Gunn & Gott 1972) may play a role in these objects. Ofour simulated galaxies 240/1244 (19 per cent) become a satellitewithin ±0.5 Gyr of tburst. This percentage is consistent with obser-vational estimates of the fraction of PSBs in denser environments(e.g. Zabludoff et al. 1996; Paccagnella et al. 2019), and suggeststhat environment may well be important in triggering PSB episodesin some objects.
In order to quantify the importance of ram-pressure strippingwithin our simulated PSBs we track the kinematics of the gas par-ticles in our sample objects, and compare these with the motion ofthe host galaxy during the PSB period. We take advantage of thefact that ram-pressure stripping is a directional processes, whichpreferentially forces gas in the opposite direction to the motion ofthe galaxy through its host halo. Within the EAGLE snipshots whichcover the PSB episode of each of our objects, we track the particleswhich were star-forming in one snipshot, and not in the next. As longas more than 10 particles meet this criteria we find the direction ofthe mean vector which describes their displacement, and comparethis to the mean velocity vector of the galaxies’ centre-of-potential.Objects where the expelled gas preferentially streams away behindthe galaxy are good candidates for ram pressure stripping.
Of our 1244 simulated PSBs 122 (9.8 per cent) have outflowsprimarily in the direction opposite to which the galaxy is moving(within ±25). This fraction is enhanced compared to our controlsample galaxies (where ≈ 5% of objects show these signatures).Visual inspection of these candidates shows that a small number offalse positives are included, typically from major galaxy mergersin their early phases where both galaxies orbit one another andthrow out tidal tails of gas behind them. The vast majority, however,have morphologies consistent with ram pressure being the dominantenvironmental effect.
As mentioned above, environmental effects, star formation andAGN winds are hard to disentangle fully, and may interact with oneanother to hasten gas removal (see e.g. Bahé & McCarthy 2015).Despite this, 51 per cent of the newly accreted satellite populationthat become PSBs show ram-pressure signatures. This suggests thatram-pressure could well be an important mechanism in both trig-gering PSB episodes, and removing the star-forming gas in PSBsrapidly, at least in dense environments.
3.5.3 Mergers
Mergers are common occurrences for field galaxies, and are thoughtto play a role in triggering the starbursts that initiate the formationof PSBs (e.g. Zabludoff et al. 1996; Blake et al. 2004; Goto 2005;Yang et al. 2008; Pracy et al. 2009; Pawlik et al. 2016, 2018; Maltbyet al. 2018). For our simulated PSBs 358/1244 (29 per cent) haveundergone a merger (with stellar mass ratio >0.01) within 0.5 Gyrof the onset of their PSB episode. Around 40 per cent of thesemergers had a stellar mass ratio >0.1, while 10 per cent were 2:1mergers or higher. The PSB features in these mergers can be causedby the consumption of gas in an extreme starburst, but also by theloss of gas in other ways, for instances in triggered AGN outbursts,or as gas is flung out in tidal tails. Up to ≈50% of the galaxies’gas can be expelled in tails (e.g. Barnes 2002), which either escape,or eventually fall back onto the remnant galaxy. The infall of these
MNRAS 000, 1–15 (2018)

Gas properties of simulated PSBs 11
Figure 14. Median merger rate in the gigayear surrounding the start of the PSB episode of each of the simulated PSBs, divided by the merger rate of the controlgalaxies in the same period. This is shown as a function of the minimum merger mass ratio. The relation for the PSB population is shown as coloured curves,split into gigayear intervals. Also shown are summary curves for low (tlook−back < 6 Gyr) and high (tlook−back > 6 Gyr) redshifts. PSB have enhanced mergerrates at all times, but major mergers are substantially enhanced (by up to an order of magnitude) at low redshifts.
tidal tails returns gas on long timescales, and is likely important inthe blue-to-blue pathway some PSBs appear to follow (e.g. Pawliket al. 2018, Pawlik et al. submitted).
In Figure 14 we plot the merger rate (within ±0.5 Gyr of tPSB)for our simulated PSBs, divided by the merger rate in the controlgalaxies as a function of the minimum merger ratio. We split thePSB population by look-back time in 1 Gyr intervals (shown ascoloured dashed lines), and also show summary curves for low-and high-redshift (solid black and grey lines). At all redshifts themerger rate in the PSB population is enhanced relative to the controlsample. At low redshift z <∼ 0.6 the largest mergers are an order ofmagnitude more common in the PSB population than the controls.At higher redshift, where mergers of all types are more common,the PSB population shows an almost uniform enhancement in thederived merger rate.
Overall we thus conclude that, within EAGLE, major mergersare more important in creating PSBs at low redshift while more nu-merous minor mergers dominate at high redshift. This is in contrastto the results of Maltby et al. (2018), who conclude that major merg-ers are most important at high redshifts. The difference between thatstudy and this one is likely partly due to selection, as their lowerredshift (0.5 < z < 1) sample is of significantly lower mass than weare able to probe here.
3.5.4 Summary
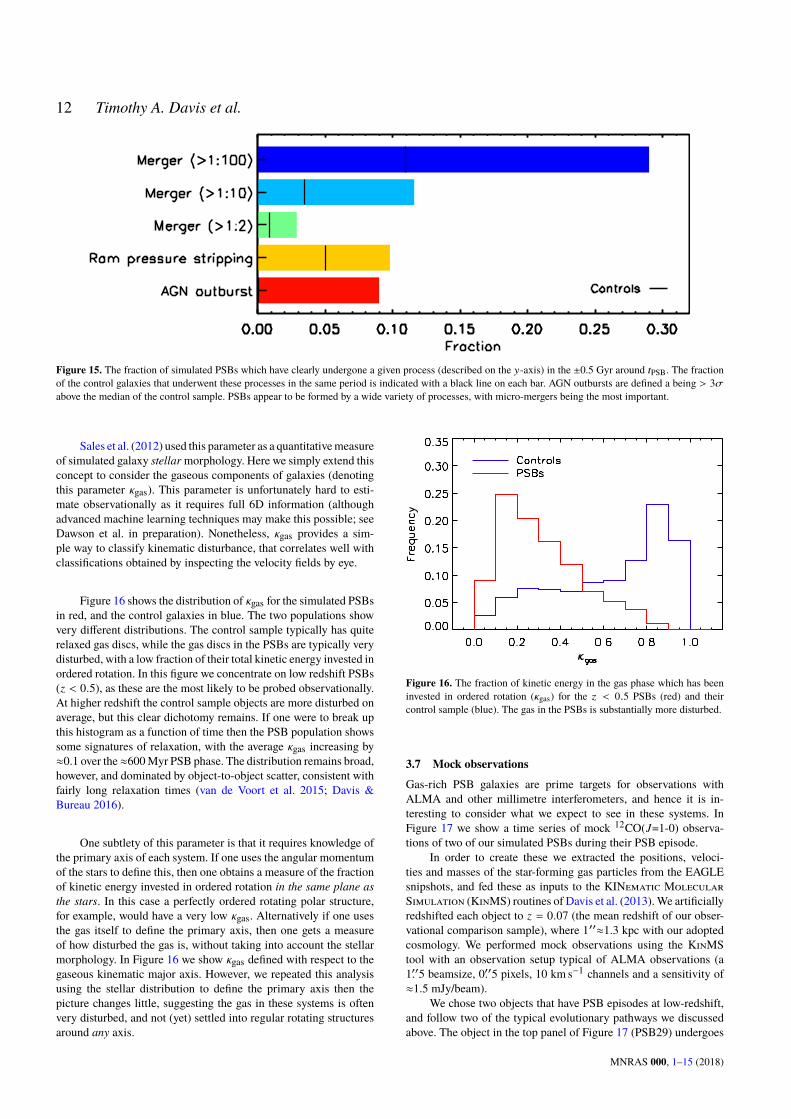
In summary, we find that a wide variety of mechanisms are involvedin causing galaxies to enter a PSB phase, and for removing gas andsuppressing star formation during that phase. The histogram pre-sented in Figure 15 summarises the different mechanisms, showingthe fraction of all our PSBs that are likely being affected by eachprocess as a histogram bar. The fraction of the control galaxies un-dergoing this process is indicated with a black line on each bar. Thecategories are not exclusive, and do not sum to 100 per cent, but
give an idea of the variety of processes affecting PSBs, and theirrelative importance.
3.6 Gas Kinematics
Observationally, many studies of the cold ISM use signs of dis-turbance to disentangle objects undergoing secular evolutionaryprocesses from those experiencing more disruptive events. Onlya limited number of resolved kinematic measurements have beenmade on gas-rich PSB galaxies (see e.g. Pracy et al. 2009; Swin-bank et al. 2012; Klitsch et al. 2017), however, with ALMA andthe new generation of large optical integral field unit surveys it willbe possible to expand the number of observed objects greatly. Wehere aim to predict the degree of disturbance one will find in theseobjects, and include mock observations for comparison to futureobservations.
One way of classifying the degree of kinematic disturbance ina simulated gas disc is with κ, the fraction of kinetic energy investedin ordered rotation (e.g. Sales et al. 2012). This is defined as
κ = Krot/Ktot, (1)
where Krot is the kinetic energy in ordered rotation, defined as
Krot =
N∑
i=1
12
mi
(
jz,i
Ri
)2
, (2)
and Ktot is the total kinetic energy
Ktot =
N∑
i=1
12
miv2i , (3)
where N is the total number of star-forming gas particles within agiven aperture, mi , vi and Ri are the mass, total velocity and radius(from the centre of potential) of the ith particle and jz,i is its angularmomentum in the direction of the angular momentum vector.
MNRAS 000, 1–15 (2018)
12 Timothy A. Davis et al.
Figure 15. The fraction of simulated PSBs which have clearly undergone a given process (described on the y-axis) in the ±0.5 Gyr around tPSB. The fractionof the control galaxies that underwent these processes in the same period is indicated with a black line on each bar. AGN outbursts are defined a being > 3σ
above the median of the control sample. PSBs appear to be formed by a wide variety of processes, with micro-mergers being the most important.
Sales et al. (2012) used this parameter as a quantitative measureof simulated galaxy stellar morphology. Here we simply extend thisconcept to consider the gaseous components of galaxies (denotingthis parameter κgas). This parameter is unfortunately hard to esti-mate observationally as it requires full 6D information (althoughadvanced machine learning techniques may make this possible; seeDawson et al. in preparation). Nonetheless, κgas provides a sim-ple way to classify kinematic disturbance, that correlates well withclassifications obtained by inspecting the velocity fields by eye.
Figure 16 shows the distribution of κgas for the simulated PSBsin red, and the control galaxies in blue. The two populations showvery different distributions. The control sample typically has quiterelaxed gas discs, while the gas discs in the PSBs are typically verydisturbed, with a low fraction of their total kinetic energy invested inordered rotation. In this figure we concentrate on low redshift PSBs(z < 0.5), as these are the most likely to be probed observationally.At higher redshift the control sample objects are more disturbed onaverage, but this clear dichotomy remains. If one were to break upthis histogram as a function of time then the PSB population showssome signatures of relaxation, with the average κgas increasing by≈0.1 over the≈600 Myr PSB phase. The distribution remains broad,however, and dominated by object-to-object scatter, consistent withfairly long relaxation times (van de Voort et al. 2015; Davis &Bureau 2016).
One subtlety of this parameter is that it requires knowledge ofthe primary axis of each system. If one uses the angular momentumof the stars to define this, then one obtains a measure of the fractionof kinetic energy invested in ordered rotation in the same plane as
the stars. In this case a perfectly ordered rotating polar structure,for example, would have a very low κgas. Alternatively if one usesthe gas itself to define the primary axis, then one gets a measureof how disturbed the gas is, without taking into account the stellarmorphology. In Figure 16 we show κgas defined with respect to thegaseous kinematic major axis. However, we repeated this analysisusing the stellar distribution to define the primary axis then thepicture changes little, suggesting the gas in these systems is oftenvery disturbed, and not (yet) settled into regular rotating structuresaround any axis.
Figure 16. The fraction of kinetic energy in the gas phase which has beeninvested in ordered rotation (κgas) for the z < 0.5 PSBs (red) and theircontrol sample (blue). The gas in the PSBs is substantially more disturbed.
3.7 Mock observations
Gas-rich PSB galaxies are prime targets for observations withALMA and other millimetre interferometers, and hence it is in-teresting to consider what we expect to see in these systems. InFigure 17 we show a time series of mock 12CO(J=1-0) observa-tions of two of our simulated PSBs during their PSB episode.
In order to create these we extracted the positions, veloci-ties and masses of the star-forming gas particles from the EAGLEsnipshots, and fed these as inputs to the KINematic Molecular
Simulation (KinMS) routines of Davis et al. (2013). We artificiallyredshifted each object to z = 0.07 (the mean redshift of our obser-vational comparison sample), where 1′′≈1.3 kpc with our adoptedcosmology. We performed mock observations using the KinMS
tool with an observation setup typical of ALMA observations (a1.′′5 beamsize, 0.′′5 pixels, 10 km s−1 channels and a sensitivity of≈1.5 mJy/beam).
We chose two objects that have PSB episodes at low-redshift,and follow two of the typical evolutionary pathways we discussedabove. The object in the top panel of Figure 17 (PSB29) undergoes
MNRAS 000, 1–15 (2018)

Gas properties of simulated PSBs 13
(a) Mock observations of PSB29; post-starburst episode induced by ram-pressure stripping.
(b) Mock observations of PSB385; post-starburst episode induced by a merger.
Figure 17. Mock 12CO(J=1-0) observations of two simulated PSBs (blue contours), overlaid on the stellar distribution of the object (orange, black contours) atseveral epochs during their PSB episode (indicated in the legend of each panel, with times relative to tPSB). Each galaxy was artificially redshifted to z = 0.07
(the mean redshift of our observational comparison sample) and mock observed at 2 kpc (1.′′5) resolution with parameters matching typical ALMA observingsetups. The top object (PSB29) undergoes ram pressure stripping of its ISM as it enters a larger halo. The bottom object (PSB385) undergoes a mergerwhich triggers a starburst. PSBs are typically disturbed in the buildup to the PSB epsiode, and have compact (but still kinematically disturbed) morphologiesafterwards.
ram pressure stripping of its ISM as it enters a larger halo. The objectin the bottom panel (PSB385) undergoes a merger which triggersa starburst. This figure reflects the results discussed above: the gasin PSB is are typically disturbed in the buildup to the PSB episode,and has a compact (but still kinematically disturbed) morphologyshortly thereafter.
Given the size evolution of PSBs (shown in Figure 11) it wouldseem that ≈one kiloparsec or better resolution is likely required totruly resolve the molecular gas reservoirs of typical PSB galaxies atlow redshifts. We would predict that the majority of PSB galaxieswill have disturbed gas, which is slowly beginning to settle backinto the potential of the host galaxy (see Section 3.6).
4 DISCUSSION AND CONCLUSIONS
In this paper we have selected PSB galaxies from the EAGLE (100Mpc)3 reference simulation, by searching for objects with a strongdrop in their sSFR over a period of 600 Myr. These objects match thespace density and stellar mass distribution of observed high-massPSB galaxies, and have realistic sizes. After post-processing thesimulation to create mock spectra we find that these objects wouldmake it into spectroscopic PSB galaxy samples, if observed at thecorrect phase in their evolution. These successes give us confidencethat we can use this sample of simulated galaxies to study the coldgas properties of PSB galaxies.
The vast majority of our simulated PSBs have significant gasreservoirs, with median star-forming gas masses of ≈ 2 × 10
9 M⊙
at low redshift. At all redshifts <5 per cent of PSBs are completelydevoid of star-forming gas (at the mass resolution of our simula-tion). We find only a small amount of evolution in the median gascontent of PSB galaxies with cosmic time, evolving as ∼ (1 + z)
rather than ≈ (1 + z)2.5 for the evolution of the total molecular gascontent of galaxies in this redshift range (e.g. Maeda et al. 2017).Once one includes selection and volume effects we find good agree-ment between the observed and simulated gas masses of the PSBpopulation.
The power of studying simulated PSB galaxies is that one canexamine the time evolution of their properties, and compare thisto observations (which necessarily reveal the properties of any oneobject only at a single time). This allows us to validate and interpretthe observations, and guide future studies. We showed here that EA-GLE well reproduces the observed time evolution of the gas fractionof the PSB galaxy population – with the average galaxy losing ≈90per cent of its star-forming gas in only ≈600 Myr. The excellentreproduction of this observed trend in the simulations strengthensour confidence in this result, as well as lending additional credenceto observational timescale determinations.
This fast evolution in the gas fraction of PSB galaxies is ac-companied by a clear decrease in the efficiency of star formation.
MNRAS 000, 1–15 (2018)

14 Timothy A. Davis et al.
While not as dramatic as the observed star formation suppressionseen in some PSBs (due to the mass limit and simple ISM model inEAGLE), the ubiquity of this lower SFE is striking. The processeswhich cause the PSB episode initially lead to a compaction of the gasdisc, as a starburst occurs (or sometimes, at low redshift, as environ-mental effects remove the outer gas reservoir). As the PSB galaxyevolves the reservoir expands somewhat, leading to a lower densegas fraction. Although a direct comparison is difficult, the sense ofthis correlation matches the observations of low HCN-to-CO ratiosin PSB galaxies French et al. (2018a).
We showed that the mechanisms causing galaxies to becomePSBs are quite diverse, as are the mechanisms which quickly depletethe gas reservoirs of these systems.
• Both major (1:1 to 1:3) and minor mergers (<1:3) are impor-tant in creating PSBs. Major mergers are implicated most oftenat low redshift, while the more common minor mergers dominateat higher redshift. These mergers can create starbursts, and triggerAGN activity, both of which deplete the gas reservoir very quickly.Mergers can also throw tidal tails of gas to large radii, which at alater time can fall back and refuel the resultant galaxy.
• Environmental effects are also important, with ≈20 per cent ofPSBs becoming a satellite around the time they exhibit PSB features,and with at least 50 per cent of these systems clearly suffering theeffects of ram-pressure stripping.
• Some AGN activity is present in almost all of the simulatedPSB galaxies. However, we showed that this activity is somewhatsub-dominant, with less than 10 per cent of simulated PSBs havinga strong AGN outburst during the PSB period. These outbursts arelikely triggered by other mechanism(s) which have already createdthe PSB. Thus although it can help with the removal of gas, AGNactivity does not seem to be an important way to create PSB galaxiesin EAGLE. AGN also cannot be dominantly responsible for thedepletion of the gas reservoirs in PSB galaxies, as high accretionrates are not present in the majority of PSB galaxies.
Finally we predict that, once high-resolution resolved imagesof the molecular gas in PSBs are available, they will show that thevast majority of PSB systems have disturbed gas kinematics. Withinthe simulation the fraction of PSBs that show dominant disc rotation(κgas > 0.8) is very low (< 5 per cent). We also showed that fairlycompact gas reservoirs should be expected, especially in recentlyquenched PSB galaxies. These small sizes persist for a long periodof time at low redshifts, consistent with the small (physical) sizesof the residual cold gas reservoirs in quenched galaxies (e.g. Daviset al. 2013).
We conclude that the evolution of PSB galaxies within theEAGLE (100 Mpc)3 reference simulation is fully consistent withrecent observations of molecular gas rich PSB galaxies. The mech-anisms causing galaxies to become PSBs are diverse, but lead to astrikingly similar post-burst evolution, with a fast loss of gas and alow star formation efficiency that lasts for at least a gigayear. Fur-ther observational and theoretical work on such systems is crucial inorder to reveal in detail the balance between different gas depletionmechanisms, and the physical processes suppressing the efficiencyof star formation in such systems as they evolve towards the redsequence.
Acknowledgments
We would like to thank Decker French, Ben Forrest, ThomasGuillet and Rüdiger Pakmor for helpful discussions and/or for shar-ing their data. We also thank all involved with the conference en-
titled “The Physics of Quenching Massive Galaxies at High Red-shift”, held 6 Nov 2017 through 10 Nov 2017 at the Lorentz Cen-tre, Leiden, which inspired this study. TAD acknowledges supportfrom a Science and Technology Facilities Council Ernest RutherfordFellowship. Support for FvdV was provided by the Klaus TschiraFoundation. The work of SM was supported by the Science andTechnology Facilities Council (grant number ST/P000541/1) andthe Academy of Finland, grant number: 314238. RAC is a RoyalSociety University Research Fellow.
This work used the DiRAC Data Centric system at DurhamUniversity, operated by the Institute for Computational Cosmol-ogy on behalf of the STFC DiRAC HPC Facility. This equip-ment was funded by BIS National E-infrastructure capital grantST/K00042X/1, STFC capital grant ST/H008519/1, and STFCDiRAC Operations grant ST/K003267/1 and Durham University.DiRAC is part of the National E-Infrastructure (www.dirac.ac.uk).
This paper has been typeset from a TEX/LATEX file prepared by the author.
REFERENCES
Alatalo K., et al., 2016a, ApJS, 224, 38Alatalo K., et al., 2016b, ApJ, 827, 106Almaini O., et al., 2017, MNRAS, 472, 1401Bahé Y. M., McCarthy I. G., 2015, MNRAS, 447, 969Bahé Y. M., Crain R. A., Kauffmann G., et al. 2016, MNRAS, 456, 1115Barnes J. E., 2002, MNRAS, 333, 481Bigiel F., Leroy A., Walter F., Brinks E., de Blok W. J. G., Madore B.,
Thornley M. D., 2008, AJ, 136, 2846Blake C., et al., 2004, MNRAS, 355, 713Bruzual G., Charlot S., 2003, MNRAS, 344, 1000Bundy K., et al., 2015, ApJ, 798, 7Chabrier G., 2003, PASP, 115, 763Chang T.-C., van Gorkom J. H., Zabludoff A. I., Zaritsky D., Mihos J. C.,
2001, AJ, 121, 1965Combes F., Young L. M., Bureau M., 2007, MNRAS, 377, 1795Couch W. J., Sharples R. M., 1987, MNRAS, 229, 423Crain R. A., Schaye J., Bower R. G., et al. 2015, MNRAS, 450, 1937Crain R. A., Bahé Y. M., Lagos C. d. P., et al. 2017, MNRAS, 464, 4204Daddi E., et al., 2010, ApJ, 714, L118Davis T. A., Bureau M., 2016, MNRAS, 457, 272Davis T. A., et al., 2013, MNRAS, 429, 534Davis T. A., et al., 2014, MNRAS, 444, 3427Davis T. A., et al., 2015, MNRAS, 449, 3503Davis T. A., Greene J., Ma C.-P., Pandya V., Blakeslee J. P., McConnell N.,
Thomas J., 2016, MNRAS, 455, 214Dickman R. L., Snell R. L., Schloerb F. P., 1986, ApJ, 309, 326Dolag K., Borgani S., Murante G., Springel V., 2009, MNRAS, 399, 497Dressler A., 1980, ApJ, 236, 351Dressler A., Gunn J. E., 1983, ApJ, 270, 7Ellison S. L., Catinella B., Cortese L., 2018, MNRAS, 478, 3447Erwin P., 2015, ApJ, 799, 226Faber S. M., et al., 2007, ApJ, 665, 265Forrest B., et al., 2018, ApJ, 863, 131French K. D., Yang Y., Zabludoff A., Narayanan D., Shirley Y., Walter F.,
Smith J.-D., Tremonti C. A., 2015, ApJ, 801, 1French K. D., Zabludoff A. I., Yoon I., Shirley Y., Yang Y., Smercina A.,
Smith J. D., Narayanan D., 2018a, ApJ, 861, 123French K. D., Yang Y., Zabludoff A. I., Tremonti C. A., 2018b, ApJ, 862, 2Furlong M., Bower R. G., Theuns T., et al. 2015, MNRAS, 450, 4486Furlong M., Bower R. G., Crain R. A., et al. 2017, MNRAS, 465, 722Genzel R., et al., 2010, MNRAS, 407, 2091Goto T., 2005, MNRAS, 357, 937Goto T., Yagi M., Yamauchi C., 2008, MNRAS, 391, 700Gunn J. E., Gott III J. R., 1972, ApJ, 176, 1Kelvin L. S., et al., 2014, MNRAS, 444, 1647
MNRAS 000, 1–15 (2018)

Gas properties of simulated PSBs 15
Kennicutt Jr. R. C., 1998, ApJ, 498, 541Klitsch A., Zwaan M. A., Kuntschner H., Couch W. J., Pracy M. B., Owers
M., 2017, A&A, 600, A80Lagos C. d. P., Crain R. A., Schaye J., et al. 2015, MNRAS, 452, 3815Maeda F., Ohta K., Seko A., 2017, ApJ, 835, 120Maltby D. T., Almaini O., Wild V., Hatch N. A., Hartley W. G., Simpson C.,
Rowlands K., Socolovsky M., 2018, MNRAS, 480, 381Marasco A., Crain R. A., Schaye J., Bahé Y. M., van der Hulst T., Theuns
T., Bower R. G., 2016, MNRAS, 461, 2630Markwardt C. B., 2009, in Bohlender D. A., Durand D., Dowler P.,
eds, Astronomical Society of the Pacific Conference Series Vol. 411,Astronomical Data Analysis Software and Systems XVIII. p. 251(arXiv:0902.2850)
Martin D. C., et al., 2007, ApJS, 173, 342McAlpine S., Bower R. G., Harrison C. M., Crain R. A., Schaller M., Schaye
J., Theuns T., 2017, MNRAS, 468, 3395McAlpine S., Bower R. G., Rosario D. J., Crain R. A., Schaye J., Theuns T.,
2018, MNRAS,Oemler Jr. A., 1974, ApJ, 194, 1Paccagnella A., Vulcani B., Poggianti B. M., Moretti A., Fritz J., Gullieuszik
M., Fasano G., 2019, MNRAS, 482, 881Pawlik M. M., Wild V., Walcher C. J., Johansson P. H., Villforth C., Rowlands
K., Mendez-Abreu J., Hewlett T., 2016, MNRAS, 456, 3032Pawlik M. M., et al., 2018, MNRAS, 477, 1708Pietrinferni A., Cassisi S., Salaris M., Castelli F., 2004, ApJ, 612, 168Planck Collaboration Ade P. A. R., Aghanim N., Alves M. I. R., Armitage-
Caplan C., et al. 2014, A&A, 571, A1Pracy M. B., Kuntschner H., Couch W. J., Blake C., Bekki K., Briggs F.,
2009, MNRAS, 396, 1349Rowlands K., Wild V., Nesvadba N., Sibthorpe B., Mortier A., Lehnert M.,
da Cunha E., 2015, MNRAS, 448, 258Rowlands K., et al., 2018a, MNRAS,Rowlands K., et al., 2018b, MNRAS, 473, 1168Saintonge A., et al., 2011, MNRAS, 415, 61Sales L. V., Navarro J. F., Theuns T., Schaye J., White S. D. M., Frenk C. S.,
Crain R. A., Dalla Vecchia C., 2012, MNRAS, 423, 1544Schaye J., Dalla Vecchia C., 2008, MNRAS, 383, 1210Schaye J., Crain R. A., Bower R. G., et al. 2015, MNRAS, 446, 521Schmidt M., 1968, ApJ, 151, 393Smercina A., et al., 2018, ApJ, 855, 51Smethurst R. J., et al., 2015, MNRAS, 450, 435Springel V., 2005, MNRAS, 364, 1105Springel V., White S. D. M., Tormen G., Kauffmann G., 2001, MNRAS,
328, 726Suess K. A., Bezanson R., Spilker J. S., Kriek M., Greene J. E., Feldmann
R., Hunt Q., Narayanan D., 2017, ApJ, 846, L14Swinbank A. M., Balogh M. L., Bower R. G., Zabludoff A. I., Lucey J. R.,
McGee S. L., Miller C. J., Nichol R. C., 2012, MNRAS, 420, 672Vazdekis A., Sánchez-Blázquez P., Falcón-Barroso J., Cenarro A. J., Beasley
M. A., Cardiel N., Gorgas J., Peletier R. F., 2010, MNRAS, 404, 1639Vazdekis A., Koleva M., Ricciardelli E., Röck B., Falcón-Barroso J., 2016,
MNRAS, 463, 3409Wild V., Kauffmann G., Heckman T., Charlot S., Lemson G., Brinchmann
J., Reichard T., Pasquali A., 2007, MNRAS, 381, 543Wild V., Walcher C. J., Johansson P. H., Tresse L., Charlot S., Pollo A., Le
Fèvre O., de Ravel L., 2009, MNRAS, 395, 144Wild V., Heckman T., Charlot S., 2010, MNRAS, 405, 933Wild V., Almaini O., Dunlop J., Simpson C., Rowlands K., Bowler R.,
Maltby D., McLure R., 2016, MNRAS, 463, 832Wu P.-F., et al., 2018, ApJ, 868, 37Yan R., et al., 2009, MNRAS, 398, 735Yang Y., Zabludoff A. I., Zaritsky D., Mihos J. C., 2008, ApJ, 688, 945Yesuf H. M., French K. D., Faber S. M., Koo D. C., 2017, MNRAS, 469,
3015Young L. M., et al., 2011, MNRAS, 414, 940Zabludoff A. I., Zaritsky D., Lin H., Tucker D., Hashimoto Y., Shectman
S. A., Oemler A., Kirshner R. P., 1996, ApJ, 466, 104Zolotov A., et al., 2015, MNRAS, 450, 2327
Zwaan M. A., Kuntschner H., Pracy M. B., Couch W. J., 2013, MNRAS,432, 492
van de Voort F., Davis T. A., Kereš D., Quataert E., Faucher-Giguère C.-A.,Hopkins P. F., 2015, MNRAS, 451, 3269
van de Voort F., et al., 2018, MNRAS, 476, 122
MNRAS 000, 1–15 (2018)


![MNRAS ATEX style file v32013/09/05 · arXiv:2005.07775v1 [astro-ph.SR] 15 May 2020 MNRAS 000, 1–21 (2020) Preprint 19 May 2020 Compiled using MNRAS LATEX style file v3.0 Diffusion](https://static.fdocuments.us/doc/165x107/60811af71455193c430e0489/mnras-atex-style-ile-v3-20130905-arxiv200507775v1-astro-phsr-15-may.jpg)


![WASP-Southtransitingexoplanets:WASP-130b, WASP-131b,WASP ... · arXiv:1604.04195v2 [astro-ph.EP] 17 Nov 2016 MNRAS 000, range (0000) Preprint 18 November 2016 Compiled using MNRAS](https://static.fdocuments.us/doc/165x107/5dd0c949d6be591ccb62b0c3/wasp-southtransitingexoplanetswasp-130b-wasp-131bwasp-arxiv160404195v2.jpg)