
This is a publisher-deposited version published in: http...
23
To cite this document: JALABERT Eva, FABACHER Emilien, GUY Nicolas, LIZY- DESTREZ Stéphanie, RAPPIN William, RIVIER Guillaume. Optimization of star research algorithm for esmo star tracker. In: 8th International ESA Conference on Guidance, Navigation and Control Systems - GNC 2011, 05 - 10 June 2011, Karlovy Vary, Czech Republic. This is a publisher-deposited version published in: http://oatao.univ-toulouse.fr/ Eprints ID: 5038 Any correspondence concerning this service should be sent to the repository administrator: [email protected]
Transcript of This is a publisher-deposited version published in: http...

To cite this document: JALABERT Eva, FABACHER Emilien, GUY Nicolas, LIZY-DESTREZ Stéphanie, RAPPIN William, RIVIER Guillaume. Optimization of star research algorithm for esmo star tracker. In: 8th International ESA Conference on Guidance, Navigation and Control Systems - GNC 2011, 05 - 10 June 2011, Karlovy Vary, Czech Republic.
This is a publisher-deposited version published in: http://oatao.univ-toulouse.fr/ Eprints ID: 5038
Any correspondence concerning this service should be sent to the repository administrator: [email protected]

OPTIMIZATION OF STAR RESEARCH ALGORITHM FOR ESMO STAR TRACKERE. Jalabert1 E. Fabacher1 N. Guy2 S. Lizy-Destrez1 W. Rappin1 G. Rivier1
1 ISAE/SUPAERO, 10 av. Edouard Belin, 31055 Toulouse, France.2 ONERA, 2 av. Edouard Belin, 31055 Toulouse, France.
{eva.jalabert, emilien.fabacher, nicolas.guy, stephanie.lizy-destrez, william.rapin, guillaume.rivier}@isae.fr
ABSTRACTThis paper explains in detail the design and the development of a software research star algorithm, embedded ona star tracker, by the ISAE/SUPAERO team. This research algorithm is inspired by musical techniques. This workwill be carried out as part of the ESMO (European Student Moon Orbiter) project by different teams of studentsand professors from ISAE/SUPAERO (Institut Superieur de l’Aeronautique et de l’Espace). Till today, the systemengineering studies have been completed and the work that will be presented will concern the algorithmic andthe embedded software development. The physical architecture of the sensor relies on APS 750 developed by theCIMI laboratory of ISAE/SUPAERO.
First, a star research algorithm based on the image acquired in lost-in-space mode (one of the star tracker opera-tional modes) will be presented; it is inspired by techniques of musical recognition with the help of the correlationof digital signature (hash) with those stored in databases. The musical recognition principle is based on finger-printing, i.e. the extraction of points of interest in the studied signal. In the musical context, the signal spectrogramis used to identify these points. Applying this technique in image processing domain requires an equivalent toolto spectrogram. Those points of interest create a hash and are used to efficiently search within the database pre-viously sorted in order to be compared. The main goals of this research algorithm are to minimise the number ofsteps in the computations in order to deliver information at a higher frequency and to increase the computationrobustness against the different possible disturbances.
ACRONYMS
PIR : Projet d’Initiation a la Recherche in French, i.e. Initiation to Research ProjectOBDH : On-Board Data HandlingAPS : Active Pixel SensorESMO : European Student Moon OrbiterESEO : European Student Earth OrbiterESA : European Space AgencyISAE : Institut National de l’Aeronautique et de l’EspaceCIMI : Conception d’Imageurs Matriciels Integres in French, i.e. Integrated 2D Imager DesignSSTL : Surrey Satellite Technology LimitedFPGA : Field-Programmable Gate ArrayCMOS : Complementary Metal Oxide Semi-conductorLIS : Lost-In-SpaceFDIR : Fault Detection Isolation and RecoveryTM : TeleCommandeTC : TeleMesureQUEST : QUaternion ESTimationESOQ : EStimator of the Optimal QuaternionFOV : Field Of View
1. INTRODUCTION
The first star tracker generation was developed to acquire a few bright stars and to output their focal plane coor-dinates to the satellite on-board flight software. Nowadays, the computation power growth permits to computedirectly the spacecraft attitude from an inertial reference frame. This attitude vector is computed through thecomparison of the sky picture acquired by the star tracker with the database, previously stored.
The design and the development of the software is divided into two main sub-parts. The first part is the mission
1

ESEO/ESMO missions
Universities/Companies
ISAE
Star tracker team
Fig. 1: Project organisation diagram
support which is the management part of the software. The second part is the algorithms which enable the compu-tation of the attitude. Nowadays, there are a lot of developments of new algorithms for database search and patternrecognition. That is why we decided to study how to use these new algorithms for the star tracker application.
This paper is organized as follows. Section 1 describes the context of the study inside ESMO. Section 2 details theidea to use audio recognition algorithm by a star tracker. After a state of the art presentation, section 3 expands astate of work, explaining the solution selected for each software function. Then section 4 presents a study aboutthe optimization of the on-board database. Finally section 5 concludes on the work and on potential improvements.
2. ESEO AND ESMO MISSIONS GENERAL CONTEXT
The ESA Education Office has set up several projects among which ESEO and ESMO, two orbiters. The purposeof these projects is to let students take an interest in space engineering and get involved in such a thrilling goal.These projects are strongly tied to the space industry. Indeed the prime contractor manages the project and providesconsiderable system-level and specialist technical support to the university student teams during the implementa-tion of the project.The main entities that are involved in these projects are:
• ESA;• Carlo Gavazzi Space;• Surrey Satellite Technology Limited;• Many universities (14 for ESEO, around 20 for ESMO), among which ISAE/SUPAERO.
The student teams are expected to provide most of the spacecraft sub-systems and ground support equipment.
A. ESEO
Carlo Gavazzi Space, ESEO prime contractor, helps the students to reach ESEO objectives:
• to take pictures of the Earth and/or other celestial bodies for educational outreach purposes;• to provide measurements of radiation levels in Low Earth Orbit;• to gain experience with technologies for possible future ESA education missions;• to test and to qualify the star tracker and a reaction wheel; they will be used on ESMO.
ESEO PDR (Preliminary Design Review) took place in fall 2010. Launch into LEO (Low Earth Orbit) isforeseen in 2013.
B. ESMO
Surrey Satellite Technology Limited is ESMO prime contractor. ESMO aims at being the first lunar spacecraftto be designed, built and operated by students across ESA Member States and ESA Cooperating States. It
2
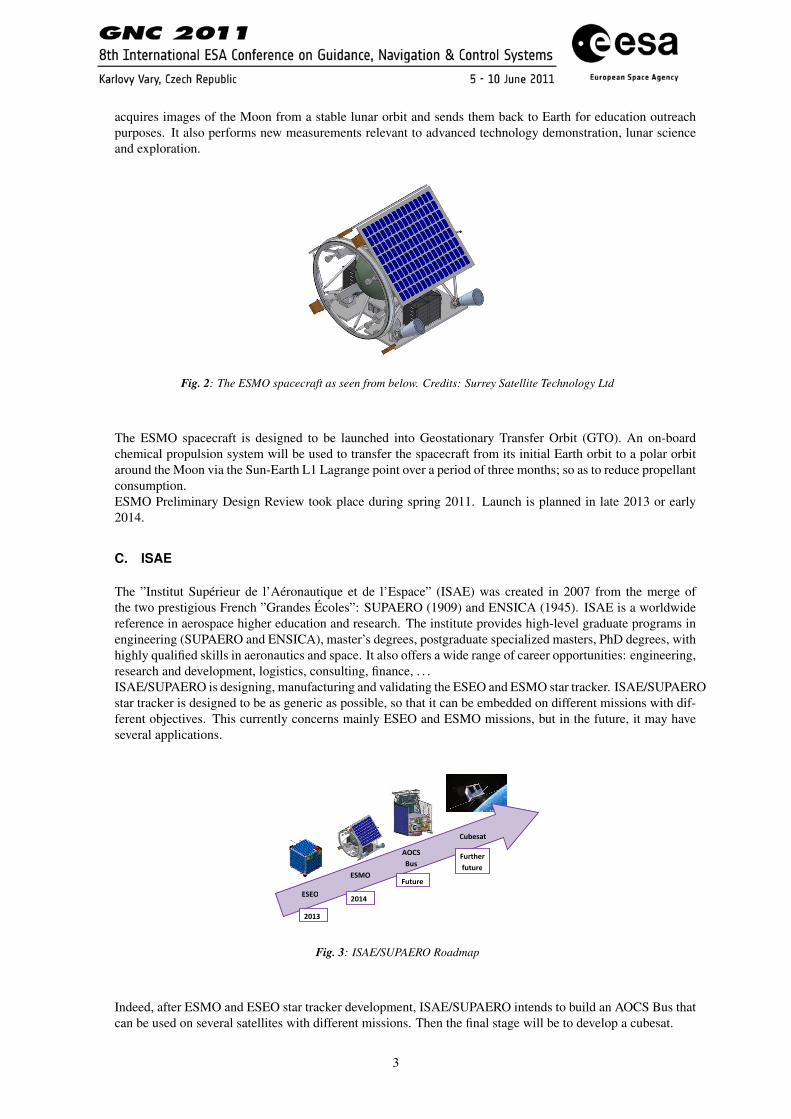
acquires images of the Moon from a stable lunar orbit and sends them back to Earth for education outreachpurposes. It also performs new measurements relevant to advanced technology demonstration, lunar scienceand exploration.
Fig. 2: The ESMO spacecraft as seen from below. Credits: Surrey Satellite Technology Ltd
The ESMO spacecraft is designed to be launched into Geostationary Transfer Orbit (GTO). An on-boardchemical propulsion system will be used to transfer the spacecraft from its initial Earth orbit to a polar orbitaround the Moon via the Sun-Earth L1 Lagrange point over a period of three months; so as to reduce propellantconsumption.ESMO Preliminary Design Review took place during spring 2011. Launch is planned in late 2013 or early2014.
C. ISAE
The ”Institut Superieur de l’Aeronautique et de l’Espace” (ISAE) was created in 2007 from the merge ofthe two prestigious French ”Grandes Ecoles”: SUPAERO (1909) and ENSICA (1945). ISAE is a worldwidereference in aerospace higher education and research. The institute provides high-level graduate programs inengineering (SUPAERO and ENSICA), master’s degrees, postgraduate specialized masters, PhD degrees, withhighly qualified skills in aeronautics and space. It also offers a wide range of career opportunities: engineering,research and development, logistics, consulting, finance, . . .ISAE/SUPAERO is designing, manufacturing and validating the ESEO and ESMO star tracker. ISAE/SUPAEROstar tracker is designed to be as generic as possible, so that it can be embedded on different missions with dif-ferent objectives. This currently concerns mainly ESEO and ESMO missions, but in the future, it may haveseveral applications.
!
!
!"#$%
!"#&%
'()*+,)%-(*(),%
'(*(),%
./.0%
./10%
203/%4(5%
3(6,57*%
Fig. 3: ISAE/SUPAERO Roadmap
Indeed, after ESMO and ESEO star tracker development, ISAE/SUPAERO intends to build an AOCS Bus thatcan be used on several satellites with different missions. Then the final stage will be to develop a cubesat.
3

3. CONTEXT OF THE STAR TRACKER
A. ISAE/SUPAERO STAR TRACKER CONTEXT ANALYSIS
During his ISAE/SUPAERO curriculum, each student chooses a scientific project (named PIR) that containsresearch and/or development parts to practice research. This project aims at applying knowledge learnt duringthe year. The students will spend about two months on this project. Last year the former star tracker teampublished an article on functional analysis [11].This academic year (September 2010 - June 2011) eight SUPAERO students are working together on the startracker PIR.
B. STAR TRACKER SYSTEM
Fig. 4: Last structural design of ISAE/SUPAERO star tracker
A star tracker is an electronic device composed by a camera and a microcomputer. The system can be depictedas in the Fig. 5. This sketch shows how the system is built and which components constitute the star tracker:the light baffle, the optic lenses, the sensor, the microcomputer with a frame digitizer (a FPGA or micro-controller), and the software with algorithms and stored database.
!"#$ %$ &'()*+ ,- ./ .0),/,1,02 2).3 )3.*'(3$
./4 )+( *.5"63.)",/$ 7+(2( ),8"*2 .3( 4"2*022(4 "/4()."5$ 7+( .**03.*9 ,- )+( 2).3 )3.*'(3 "2 )98"*.5594":"4(4 "/), 4"--(3(/) *,18,/(/)2 20*+ .2 5"/( ,-2"#+) 2).6"5")9; 3(5.)":( .**03.*9; *.5"63.)",/ (33,32;/,"2( (<0":.5(/) ./#5( =>?@A; &B*03:( (33,32 ./4.5#,3")+1"* (33,32$ 7+(2( *.)(#,3"(2 ./4 1(.203(1(/)2,- )+( >?@ ./4 )+( 3(5.)":( .**03.*9 0)"5"C"/# .)(5(2*,8( 43":( .3( 4"2*022(4$
!!" #$%& $&%'()& *+)&%$!*,
@/ .0),/,1,02 2).3 )3.*'(3 )98"*.559 ,8(3.)(2"/ )D, 1,4(2E %A "/")".5 .))")04( .*<0"2")",/ ./4 FA)3.*'"/# 1,4($ 7+( 4"--(3(/*( 6()D((/ )+( 1,4(2 "2D+()+(3 .883,G"1.)( .))")04( '/,D5(4#( "2 .:."5.65($H/ "/")".5 .))")04( .*<0"2")",/; )+( ).2' "2 ), 8(3-,318.))(3/ 3(*,#/")",/ ,- )+( 2).3 8.))(3/ "/ )+( !IJ$K./9 .5#,3")+12 +.:( 6((/ 4(:(5,8(4 ), 8(3-,31 )+"2-0/*)",/ LFMNO%P$ 798"*.559; )+( "4(/)"-"*.)",/ *./ 6(.**,185"2+(4 "/ . -(D 2(*,/42$ >,31.5 ,8(3.)"/#1,4( =)3.*'"/# 1,4(A .2201(2 )+.) )+( 83(2(/).))")04( "2 *5,2( ), )+( 5.2) .))")04( 084.)( =! 5(22 )+./% 2 .#,A$ 7+( ).2' "2 10*+ (.2"(3 2"/*( )+( 2).3 )3.*'(3,/59 +.2 ), )3.*' 83(:",0259 "4(/)"-"(4 2).32 .) '/,D/8,2")",/2$@ )98"*.5 2).3 )3.*'(3 "1.#( "2 2+,D/ "/ !"#$ F$F H)
"2 ,62(3:(4 )+.) )+( "1.#( "2 25"#+)59 4(-,*02(4$ 7+"2"2 ), ,:(3*,1( )+( 2.185"/# )+(,3(1; D+"*+ ,)+(3D"2(5"1")2 )+( .**03.*9 ), Q$OR 8"G(5$O S"--(3(/) .5#,3")+12-,3 *.5*05.)"/# 2).3 *(/)3,"42 (G"2) LFO; OF; OOP$ 7+(*.5*05.)(4 2).3 *(/)3,"42 -,3 )+"2 "1.#( "2 2+,D/ "/!"#$ O$ T(/)3,"4"/# "2 4"2*022(4 -03)+(3 "/ &(*)",/ HJ$@))")04( ./4 3.)( "/-,31.)",/ -3,1 83(:",02
(G8,203(2 "2 02(4 "/ )+( )3.*'"/# 1,4( ), 83(4"*)2).3 8,2")",/2 "/ )+( /(G) (G8,203($ 7+(3(-,3(; ") "2/,) /(*(22.39 ), 4"#")"C( )+( (/)"3( "1.#($ &,1( 2).3)3.*'(32 0)"5"C( 28(*".5 +.34D.3( )+.) ,/59 4"#")"C(228(*"-"* 21.55 D"/4,D2 "/ )+( "1.#( .) 83(4"*)(42).3 8,2")",/2$ @/ (G.185( "2 2+,D/ "/ !"#$ U$ 7+"2)(*+/"<0( 3(40*(2 )+( 83,*(22,3 5,.4 2"#/"-"*./)59$7+( 8,2")",/2 ,- )+( 2).3 *(/)3,"42 ,/ )+( -,*.5
85./( *./ 6( )3./2-,31(4 "/), 0/") :(*),32 "/ . 2).3
F7+( "1.#( +.2 6((/ .*<0"3(4 69 . VWX 4(:(5,81(/).5 @W& 6.2(42).3 )3.*'(3 L%YP$O! Q!M"Q!M
! Q!M"Q!M
""F Z #F$"$# [ Q!OR!
!"#$ F$ &).3 )3.*'(3 "1.#($
!"#$ O$ 7+( 63"#+)(2) *(/)3,"42$
!"#$ U$ 7+( 2).3 "1.#( -3,1 !"#$ F$ 7+"2 H1.#( "2 ,/59 4"#")"C(4.3,0/4 83(4"*)(4 2).3 8,2")",/2$
MRR H??? 7\@>&@T7HI>& I> @?\I&W@T? @>S ?X?T7\I>HT &]&7?K& JIX$ OR; >I$ F @W\HX FQQF
Fig. 5: Sketch of the star tracker system[10]
The physical architecture of ISAE/SUPAERO star tracker is coherent with this classical decomposition. Thestar tracker software is characterized by the six following modes: the off mode, the standby mode, the initmode, the safe mode, the lost-in-space mode and the tracking mode. In this paper the two last modes arestudied.
4
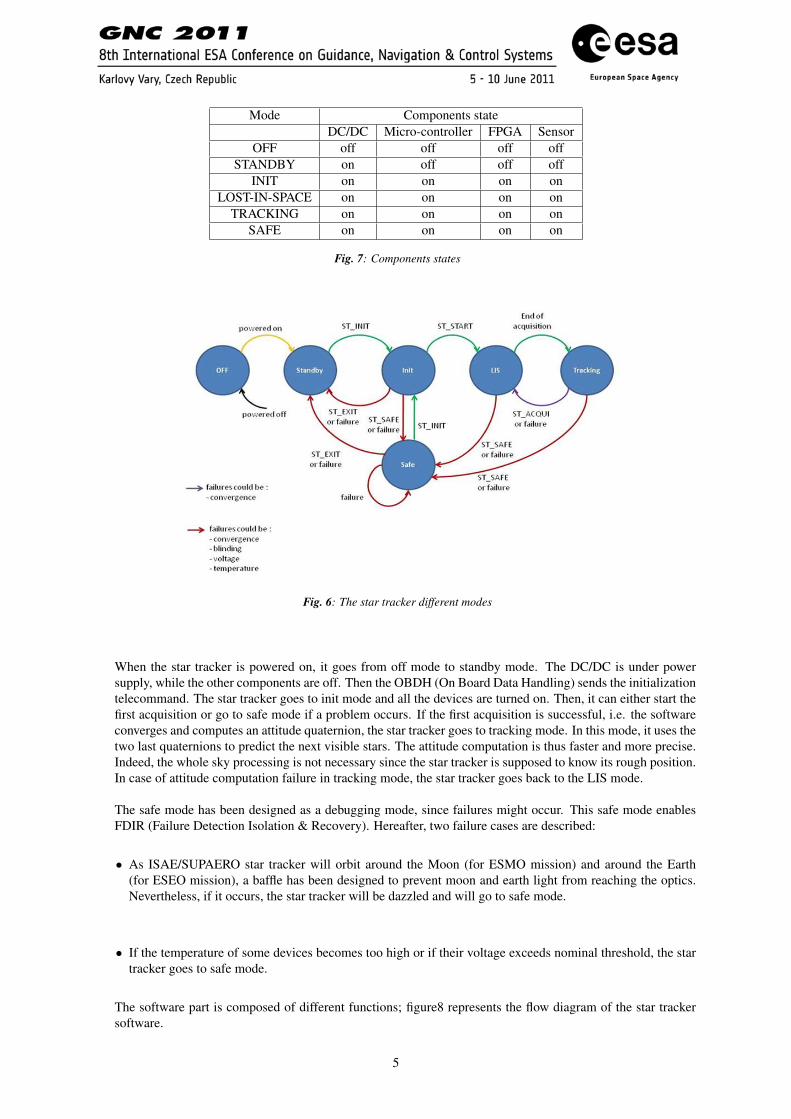
Mode Components stateDC/DC Micro-controller FPGA Sensor
OFF off off off offSTANDBY on off off off
INIT on on on onLOST-IN-SPACE on on on on
TRACKING on on on onSAFE on on on on
Fig. 7: Components states
Fig. 6: The star tracker different modes
When the star tracker is powered on, it goes from off mode to standby mode. The DC/DC is under powersupply, while the other components are off. Then the OBDH (On Board Data Handling) sends the initializationtelecommand. The star tracker goes to init mode and all the devices are turned on. Then, it can either start thefirst acquisition or go to safe mode if a problem occurs. If the first acquisition is successful, i.e. the softwareconverges and computes an attitude quaternion, the star tracker goes to tracking mode. In this mode, it uses thetwo last quaternions to predict the next visible stars. The attitude computation is thus faster and more precise.Indeed, the whole sky processing is not necessary since the star tracker is supposed to know its rough position.In case of attitude computation failure in tracking mode, the star tracker goes back to the LIS mode.
The safe mode has been designed as a debugging mode, since failures might occur. This safe mode enablesFDIR (Failure Detection Isolation & Recovery). Hereafter, two failure cases are described:
• As ISAE/SUPAERO star tracker will orbit around the Moon (for ESMO mission) and around the Earth(for ESEO mission), a baffle has been designed to prevent moon and earth light from reaching the optics.Nevertheless, if it occurs, the star tracker will be dazzled and will go to safe mode.
• If the temperature of some devices becomes too high or if their voltage exceeds nominal threshold, the startracker goes to safe mode.
The software part is composed of different functions; figure8 represents the flow diagram of the star trackersoftware.
5
Stars
to acquireimage
to filterimage
AND
to identifystars
to estimateattitude
to filterattitude
filteredattitude
inertialvectors
bodyvectors
image
AND
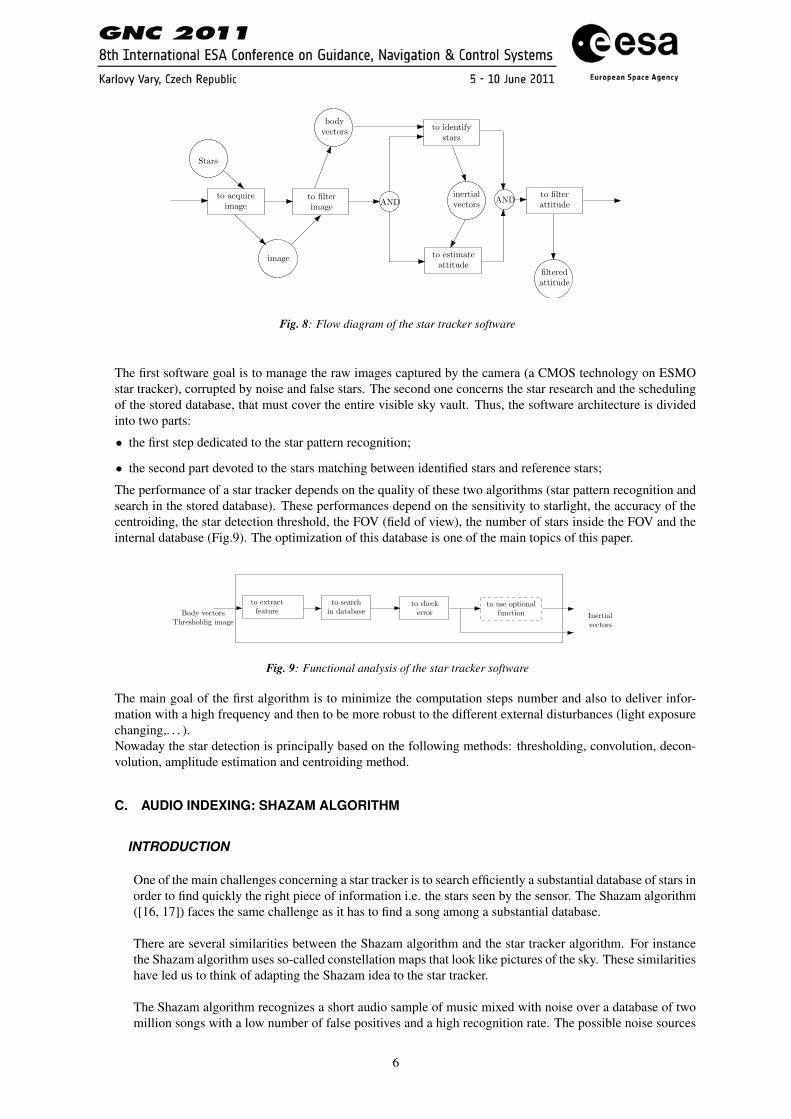
Fig. 8: Flow diagram of the star tracker software
The first software goal is to manage the raw images captured by the camera (a CMOS technology on ESMOstar tracker), corrupted by noise and false stars. The second one concerns the star research and the schedulingof the stored database, that must cover the entire visible sky vault. Thus, the software architecture is dividedinto two parts:
• the first step dedicated to the star pattern recognition;
• the second part devoted to the stars matching between identified stars and reference stars;
The performance of a star tracker depends on the quality of these two algorithms (star pattern recognition andsearch in the stored database). These performances depend on the sensitivity to starlight, the accuracy of thecentroiding, the star detection threshold, the FOV (field of view), the number of stars inside the FOV and theinternal database (Fig.9). The optimization of this database is one of the main topics of this paper.
to extractfeature
to searchin database
to checkerror
to use optionalfunction Inertial
vectors
Body vectorsThresholdig image
Fig. 9: Functional analysis of the star tracker software
The main goal of the first algorithm is to minimize the computation steps number and also to deliver infor-mation with a high frequency and then to be more robust to the different external disturbances (light exposurechanging,. . . ).Nowaday the star detection is principally based on the following methods: thresholding, convolution, decon-volution, amplitude estimation and centroiding method.
C. AUDIO INDEXING: SHAZAM ALGORITHM
INTRODUCTION
One of the main challenges concerning a star tracker is to search efficiently a substantial database of stars inorder to find quickly the right piece of information i.e. the stars seen by the sensor. The Shazam algorithm([16, 17]) faces the same challenge as it has to find a song among a substantial database.
There are several similarities between the Shazam algorithm and the star tracker algorithm. For instancethe Shazam algorithm uses so-called constellation maps that look like pictures of the sky. These similaritieshave led us to think of adapting the Shazam idea to the star tracker.
The Shazam algorithm recognizes a short audio sample of music mixed with noise over a database of twomillion songs with a low number of false positives and a high recognition rate. The possible noise sources
6
that can be found in the external environment are ambient noises, reverb and other processing, voice codeccompression, etc. . . Some similar services have been developed in Spain by Amena using Philips hashingalgorithm. [2, 13, 7, 8, 4].
SHAZAM ALGORITHM
The Shazam algorithm main idea is that each file has a fingerprint. A fingerprint is a content-based compactsignature that summarizes a piece of audio content. Just as each human being is characterized by itsfingerprint, each song has its own fingerprint.
The fingerprints from the unknown sample are matched against a large set of fingerprints derived from themusic database. Then the candidate matches are subsequently evaluated for matching correctness.A fingerprint has several states, that can be:
• temporally localized: each fingerprint hash is computed using audio samples near a corresponding point intime, so that distant events do not affect the hash;
• translation-invariant robust: the sample can be taken from any part of the song (fingerprint hashes derivedfrom corresponding matching content are reproducible independent of position within the audio file);
• sufficiently entropic: hashes from the original cleaned database can be reproducible from a degraded copyof the audio.
!"#$%&#'%( )"!!%)*)( *+,*( %,-+( .#'!%/0/#'*( +,)+( #)( -,&-"&,*%$(")#'!(,"$#1(),20&%)('%,/(,(-1//%)01'$#'!(01#'*(#'(*#2%3()1(*+,*($#)*,'*(%4%'*)($1('1*(,..%-*(*+%(+,)+5( (6+%(*/,')&,*#1'7#'4,/#,'*(,)0%-*(2%,')(*+,*(.#'!%/0/#'*(+,)+%)($%/#4%$(./12(-1//%)01'$#'!( 2,*-+#'!( -1'*%'*( ,/%( /%0/1$"-#8&%(#'$%0%'$%'*(1.(01)#*#1'(9#*+#'(,'(,"$#1(.#&%3(,)(&1'!(,)(*+%(*%201/,&( &1-,&#*:(-1'*,#'#'!( *+%($,*,( ./12(9+#-+( *+%(+,)+(#)(-120"*%$(#)(-1'*,#'%$(9#*+#'(*+%(.#&%5((6+#)(2,;%)()%')%3(,)(,'("';'19'(),20&%(-1"&$(-12%(./12(,':(01/*#1'(1.(*+%(1/#!#',&( ,"$#1( */,-;5( ( <18")*'%))( 2%,')( *+,*( +,)+%)(!%'%/,*%$(./12(*+%(1/#!#',&(-&%,'($,*,8,)%(*/,-;()+1"&$(8%(/%0/1$"-#8&%( ./12( ,( $%!/,$%$( -10:( 1.( *+%( ,"$#15((="/*+%/21/%3(*+%(.#'!%/0/#'*(*1;%')()+1"&$(+,4%()"..#-#%'*&:(+#!+( %'*/10:( #'(1/$%/( *1(2#'#2#>%( *+%( 0/18,8#&#*:( 1.( .,&)%(*1;%'(2,*-+%)(,*('1'7-1//%)01'$#'!( &1-,*#1')(8%*9%%'(*+%("';'19'( ),20&%( ,'$( */,-;)( 9#*+#'( *+%( $,*,8,)%5((?')"..#-#%'*( %'*/10:( &%,$)( *1( %@-%))#4%( ,'$( )0"/#1")(2,*-+%)( ,*( '1'7-1//%)01'$#'!( &1-,*#1')3( /%A"#/#'!( 21/%(0/1-%))#'!(019%/(*1(-"&&(*+%(/%)"&*)3(,'$(*11(2"-+(%'*/10:(")",&&:( &%,$)( *1( ./,!#&#*:( ,'$( '1'7/%0/1$"-#8#&#*:( 1.(.#'!%/0/#'*(*1;%')(#'(*+%(0/%)%'-%(1.('1#)%(,'$($#)*1/*#1'5((6+%/%( ,/%( B( 2,#'( -1201'%'*)3( 0/%)%'*%$( #'( *+%( '%@*()%-*#1')5(
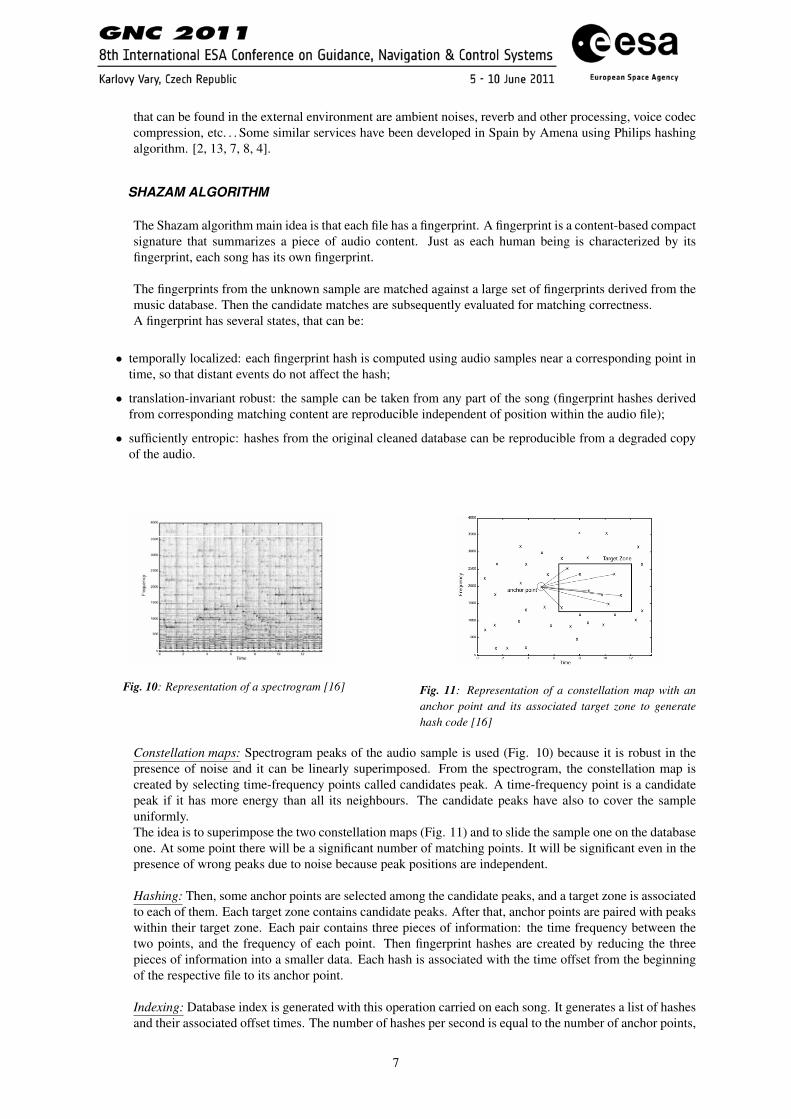
!"#$ %&'()*$+&,)*-../*0&,)$?'(1/$%/( *1( ,$$/%))( *+%(0/18&%2(1.( /18")*( #$%'*#.#-,*#1'( #'(*+%(0/%)%'-%(1.(+#!+&:( )#!'#.#-,'*('1#)%(,'$($#)*1/*#1'3(9%(%@0%/#2%'*%$(9#*+(,(4,/#%*:(1.(-,'$#$,*%(.%,*"/%)(*+,*(-1"&$()"/4#4%(CDE(%'-1$#'!(#'(*+%(0/%)%'-%(1.('1#)%5((F%()%**&%$(1'( )0%-*/1!/,2( 0%,;)3( $"%( *1( *+%#/( /18")*'%))( #'( *+%(0/%)%'-%( 1.( '1#)%( ,'$( ,00/1@#2,*%( &#'%,/( )"0%/01),8#&#*:(GHI5((J(*#2%7./%A"%'-:(01#'*(#)(,(-,'$#$,*%(0%,;(#.(#*(+,)(,(+#!+%/( %'%/!:( -1'*%'*( *+,'( ,&&( #*)( '%#!+81/)( #'( ,( /%!#1'(-%'*%/%$( ,/1"'$( *+%( 01#'*5( ( K,'$#$,*%( 0%,;)( ,/%( -+1)%'(,--1/$#'!( *1( ,($%')#*:( -/#*%/#1'( #'(1/$%/( *1( ,))"/%( *+,*( *+%(*#2%7./%A"%'-:( )*/#0( .1/( *+%( ,"$#1( .#&%( +,)( /%,)1',8&:("'#.1/2( -14%/,!%5( ( 6+%( 0%,;)( #'( %,-+( *#2%7./%A"%'-:(&1-,&#*:( ,/%( ,&)1( -+1)%'( ,--1/$#'!( ,20&#*"$%3( 9#*+( *+%(L")*#.#-,*#1'( *+,*( *+%( +#!+%)*( ,20&#*"$%( 0%,;)( ,/%( 21)*(&#;%&:(*1()"/4#4%(*+%($#)*1/*#1')(&#)*%$(,814%5((6+")3( ,( -120&#-,*%$( )0%-*/1!/,23( ,)( #&&")*/,*%$( #'( =#!"/%(HJ( 2,:( 8%( /%$"-%$( *1( ,( )0,/)%( )%*( 1.( -11/$#',*%)3( ,)(#&&")*/,*%$( #'( =#!"/%( HM5( ( N1*#-%( *+,*( ,*( *+#)( 01#'*( *+%(,20&#*"$%(-1201'%'*(+,)(8%%'(%#',*%$5( (6+#)(/%$"-*#1'(+,)( *+%( ,$4,'*,!%( 1.( 8%#'!( .,#/&:( #')%')#*#4%( *1( OP3( ,)(
Fig. 10: Representation of a spectrogram [16]
!"#$%&#'%( )"!!%)*)( *+,*( %,-+( .#'!%/0/#'*( +,)+( #)( -,&-"&,*%$(")#'!(,"$#1(),20&%)('%,/(,(-1//%)01'$#'!(01#'*(#'(*#2%3()1(*+,*($#)*,'*(%4%'*)($1('1*(,..%-*(*+%(+,)+5( (6+%(*/,')&,*#1'7#'4,/#,'*(,)0%-*(2%,')(*+,*(.#'!%/0/#'*(+,)+%)($%/#4%$(./12(-1//%)01'$#'!( 2,*-+#'!( -1'*%'*( ,/%( /%0/1$"-#8&%(#'$%0%'$%'*(1.(01)#*#1'(9#*+#'(,'(,"$#1(.#&%3(,)(&1'!(,)(*+%(*%201/,&( &1-,&#*:(-1'*,#'#'!( *+%($,*,( ./12(9+#-+( *+%(+,)+(#)(-120"*%$(#)(-1'*,#'%$(9#*+#'(*+%(.#&%5((6+#)(2,;%)()%')%3(,)(,'("';'19'(),20&%(-1"&$(-12%(./12(,':(01/*#1'(1.(*+%(1/#!#',&( ,"$#1( */,-;5( ( <18")*'%))( 2%,')( *+,*( +,)+%)(!%'%/,*%$(./12(*+%(1/#!#',&(-&%,'($,*,8,)%(*/,-;()+1"&$(8%(/%0/1$"-#8&%( ./12( ,( $%!/,$%$( -10:( 1.( *+%( ,"$#15((="/*+%/21/%3(*+%(.#'!%/0/#'*(*1;%')()+1"&$(+,4%()"..#-#%'*&:(+#!+( %'*/10:( #'(1/$%/( *1(2#'#2#>%( *+%( 0/18,8#&#*:( 1.( .,&)%(*1;%'(2,*-+%)(,*('1'7-1//%)01'$#'!( &1-,*#1')(8%*9%%'(*+%("';'19'( ),20&%( ,'$( */,-;)( 9#*+#'( *+%( $,*,8,)%5((?')"..#-#%'*( %'*/10:( &%,$)( *1( %@-%))#4%( ,'$( )0"/#1")(2,*-+%)( ,*( '1'7-1//%)01'$#'!( &1-,*#1')3( /%A"#/#'!( 21/%(0/1-%))#'!(019%/(*1(-"&&(*+%(/%)"&*)3(,'$(*11(2"-+(%'*/10:(")",&&:( &%,$)( *1( ./,!#&#*:( ,'$( '1'7/%0/1$"-#8#&#*:( 1.(.#'!%/0/#'*(*1;%')(#'(*+%(0/%)%'-%(1.('1#)%(,'$($#)*1/*#1'5((6+%/%( ,/%( B( 2,#'( -1201'%'*)3( 0/%)%'*%$( #'( *+%( '%@*()%-*#1')5(
!"#$ %&'()*$+&,)*-../*0&,)$?'(1/$%/( *1( ,$$/%))( *+%(0/18&%2(1.( /18")*( #$%'*#.#-,*#1'( #'(*+%(0/%)%'-%(1.(+#!+&:( )#!'#.#-,'*('1#)%(,'$($#)*1/*#1'3(9%(%@0%/#2%'*%$(9#*+(,(4,/#%*:(1.(-,'$#$,*%(.%,*"/%)(*+,*(-1"&$()"/4#4%(CDE(%'-1$#'!(#'(*+%(0/%)%'-%(1.('1#)%5((F%()%**&%$(1'( )0%-*/1!/,2( 0%,;)3( $"%( *1( *+%#/( /18")*'%))( #'( *+%(0/%)%'-%( 1.( '1#)%( ,'$( ,00/1@#2,*%( &#'%,/( )"0%/01),8#&#*:(GHI5((J(*#2%7./%A"%'-:(01#'*(#)(,(-,'$#$,*%(0%,;(#.(#*(+,)(,(+#!+%/( %'%/!:( -1'*%'*( *+,'( ,&&( #*)( '%#!+81/)( #'( ,( /%!#1'(-%'*%/%$( ,/1"'$( *+%( 01#'*5( ( K,'$#$,*%( 0%,;)( ,/%( -+1)%'(,--1/$#'!( *1( ,($%')#*:( -/#*%/#1'( #'(1/$%/( *1( ,))"/%( *+,*( *+%(*#2%7./%A"%'-:( )*/#0( .1/( *+%( ,"$#1( .#&%( +,)( /%,)1',8&:("'#.1/2( -14%/,!%5( ( 6+%( 0%,;)( #'( %,-+( *#2%7./%A"%'-:(&1-,&#*:( ,/%( ,&)1( -+1)%'( ,--1/$#'!( ,20&#*"$%3( 9#*+( *+%(L")*#.#-,*#1'( *+,*( *+%( +#!+%)*( ,20&#*"$%( 0%,;)( ,/%( 21)*(&#;%&:(*1()"/4#4%(*+%($#)*1/*#1')(&#)*%$(,814%5((6+")3( ,( -120&#-,*%$( )0%-*/1!/,23( ,)( #&&")*/,*%$( #'( =#!"/%(HJ( 2,:( 8%( /%$"-%$( *1( ,( )0,/)%( )%*( 1.( -11/$#',*%)3( ,)(#&&")*/,*%$( #'( =#!"/%( HM5( ( N1*#-%( *+,*( ,*( *+#)( 01#'*( *+%(,20&#*"$%(-1201'%'*(+,)(8%%'(%#',*%$5( (6+#)(/%$"-*#1'(+,)( *+%( ,$4,'*,!%( 1.( 8%#'!( .,#/&:( #')%')#*#4%( *1( OP3( ,)(
Fig. 11: Representation of a constellation map with ananchor point and its associated target zone to generatehash code [16]
Constellation maps: Spectrogram peaks of the audio sample is used (Fig. 10) because it is robust in thepresence of noise and it can be linearly superimposed. From the spectrogram, the constellation map iscreated by selecting time-frequency points called candidates peak. A time-frequency point is a candidatepeak if it has more energy than all its neighbours. The candidate peaks have also to cover the sampleuniformly.The idea is to superimpose the two constellation maps (Fig. 11) and to slide the sample one on the databaseone. At some point there will be a significant number of matching points. It will be significant even in thepresence of wrong peaks due to noise because peak positions are independent.
Hashing: Then, some anchor points are selected among the candidate peaks, and a target zone is associatedto each of them. Each target zone contains candidate peaks. After that, anchor points are paired with peakswithin their target zone. Each pair contains three pieces of information: the time frequency between thetwo points, and the frequency of each point. Then fingerprint hashes are created by reducing the threepieces of information into a smaller data. Each hash is associated with the time offset from the beginningof the respective file to its anchor point.
Indexing: Database index is generated with this operation carried on each song. It generates a list of hashesand their associated offset times. The number of hashes per second is equal to the number of anchor points,
7
multiplied by the number of peaks in the target zone. So by limiting the number of peaks in the targetzone, it limits the combinatorial explosion of pairs. The fact that the search algorithm uses a pair insteadof single point accelerates the process.
Matching: For each matching hash found in the database, the corresponding offset times from the beginningof the sample and database files are associated into time pairs. The time pairs are distributed into binsaccording to the song ID associated with the matching database hash. Then the bins are matched. The factthat a match has been found means that there is a diagonal line within the scatterplot. It is represented bya set of time pairs. The used technique solves the problem in approximately N ∗ log(N) time, where N isthe number of points appearing on the scatterplot. This bin scanning process is repeated for each track inthe database until a significant match is found.
D. SHAZAM ALGORITHM APPLICATION TO THE STAR TRACKER
Context: In the context of the star tracker, the constellation map corresponds to sky picture, acquired by thesensor. In this map, a dot concerns directly a star. That is why the decision was taken to study the possibilityto apply Shazam algorithm in the star tracker software. The main challenge lies in the fact that Shazam theoryhas been developed for a one dimensional audio signal, while a sky picture is a two dimensional signal.The selected approach falls into steps:
• First, to obtain a hash code of the sky image;
• Second, to optimize the reference database.
In Shazam algorithm for music application, songs are sorted as a 2-M database. In star tracker project, thesame concept is extended to the star catalogue, built as a K-d tree [6, 9].
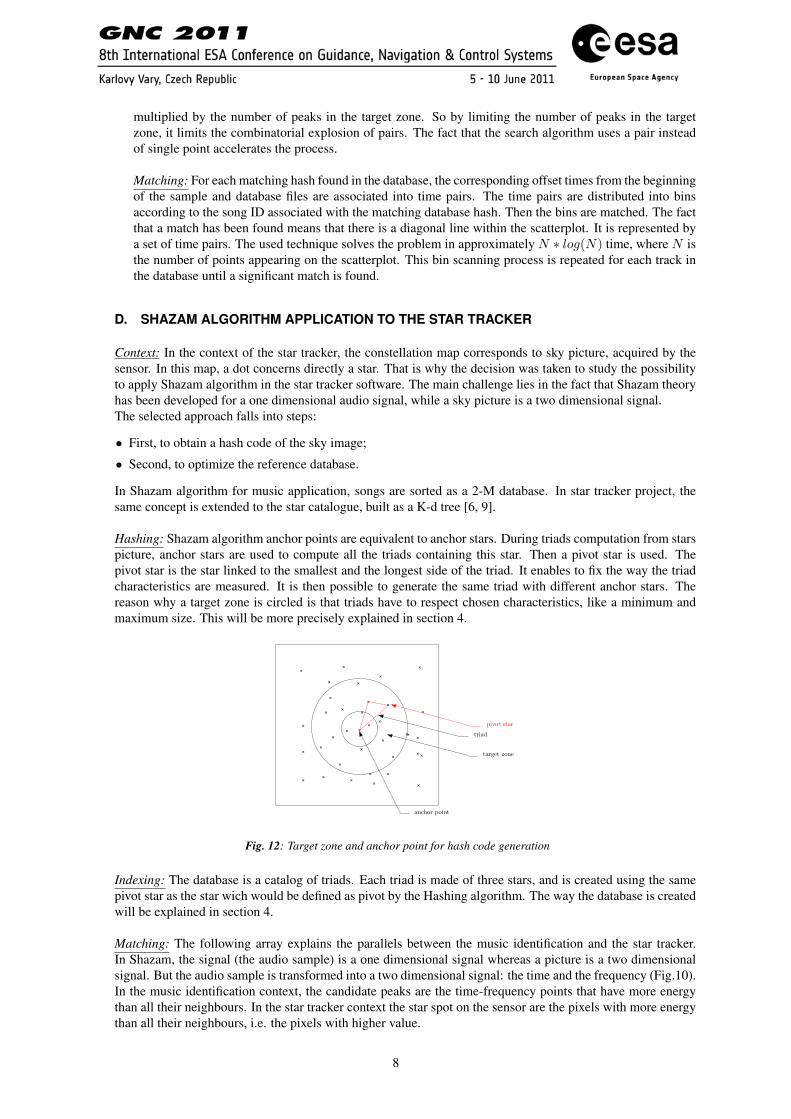
Hashing: Shazam algorithm anchor points are equivalent to anchor stars. During triads computation from starspicture, anchor stars are used to compute all the triads containing this star. Then a pivot star is used. Thepivot star is the star linked to the smallest and the longest side of the triad. It enables to fix the way the triadcharacteristics are measured. It is then possible to generate the same triad with different anchor stars. Thereason why a target zone is circled is that triads have to respect chosen characteristics, like a minimum andmaximum size. This will be more precisely explained in section 4.
target zone
anchor point
pivot star
triad
Fig. 12: Target zone and anchor point for hash code generation
Indexing: The database is a catalog of triads. Each triad is made of three stars, and is created using the samepivot star as the star wich would be defined as pivot by the Hashing algorithm. The way the database is createdwill be explained in section 4.
Matching: The following array explains the parallels between the music identification and the star tracker.In Shazam, the signal (the audio sample) is a one dimensional signal whereas a picture is a two dimensionalsignal. But the audio sample is transformed into a two dimensional signal: the time and the frequency (Fig.10).In the music identification context, the candidate peaks are the time-frequency points that have more energythan all their neighbours. In the star tracker context the star spot on the sensor are the pixels with more energythan all their neighbours, i.e. the pixels with higher value.
8

Shazam Star trackerSignal 1-D (audio) 2-D (image)
Constellation map Spectrogram Filtered imageAnchor point power peaks detected stars
Database elements Hash (anchor point+target zone) Hash (anchor star+target zone)Database management organisation by significant value K-D tree
Fig. 13: Shazam algorithm applied to the star tracker
4. STAR TRACKER SOFTWARE
A. SOFTWARE CONTEXT
ISAE/SUPAERO star tracker students team is divided into two subgroups. The first one is in charge of thehardware part of the project and the second one is responsible for the software part. Software means the codethat runs when the star tracker is operational. The external entities interface with the program: the OBDH,which sends TC, and receives TM, the different housekeeping devices (thermic sonde, voltage sonde, . . . ),controlling the state of the hardware and the clock. Figure A. presents the different inputs and outputs of thesoftware.
Fig. 14: Inputs and ouputs of the software
B. SOFTWARE FUNCTIONAL ARCHITECTURE
The software team is decomposed to correspond to the software part’s needs. The first need is to run thealgorithms to compute the attitude from a raw image of the sky. The second need is to enable these algorithmsto run i.e. to handle the real-time computing and to ensure the clock is synchronize, so that the star tracker cancommunicate with the OBDH, ...That explains the team organisation. The first sub-group is in charge of To support the mission and To changethe mode, and the other one is in charge of To estimate the quaternion (Fig. 15).Figures 15, 16 and 17 are the eFFDB diagrams to illustrate the functional analysis.As said in section 2.B., the mode of the star tracker described in this paper are the lost-in-space mode and thetracking mode. That is why the function To estimate the quaternion is present in this analysis. There are threefunctions running at the same time: the estimation of the quaternion from the raw image of the sky, the missionsupport to enable the algorithm to run, to communicate with the OBDH and to check if the star tracker is allright. The third function is the one that change the current mode when the mission support asks for the change.The scheme 15 explains the functioning of the software when it is in the lost-in-space mode. Three functionsare running at the same time. To estimate the quaternion and To support the mission are into an infinite loop,whereas To change the mode occurs only when To support the mission asks for it.To support the mission runs all the functions which enable the function To estimate the quaternion to run.The star tracker should be able to receive and treat TC (telecommand) sent by OBDH, and to send TM(telemesure). For example, the TC can be an order to change the current mode. In this case, To supportthe mission asks for a change in mode, and the function To change the mode is activated.To support the mission also has to synchronize the clock with the OBDH clock to timestamp the quaternion.To support the mission deals with watchdogs and housekeeping to detect failures.
9

!
!"#$%&'()&$#&*$#+,)&$-.'".!
!"#%,//"-&#&*$#('%%'".#
!"#0*).1$#&*$#("2$#
"#!
$%&!
'()*+!,-./(!
01! 02!
%34!2563!
0-73+()7836!9:)(3*;-5;!!
"#! "#!
"#!
$%&!
Fig. 15: Functional analysis of the software in LIS mode
!
Fig. 16: Functional architecture of the mission support
C. STAR TRACKER MISSION DESIGN
In the previous part the functions To support the mission and To change the mode have been presented. In thispart the function To estimate the quaternion is studied.The function To estimate the quaternion is decomposed in the following scheme.
MISSION FUNCTION DESIGN
Figure 17 is an eFFBD diagram presenting the different steps to compute the quaternion from a raw image.
METHODS STATE OF THE ART
This part, like the previous one, concerns the mission algorithm. This algorithm only runs when lost-in-space or tracking mode is activated. Moreover, the algorithm is not exactly the same for these two modes.The main difference is that in tracking mode, patterns are not created in order to recognize stars, unlike in
10
!
!"#$%&'()*"&
+,&-./+01&&"#$%!&'!&()#*('+,!
&(#!-./0#1!
+*$2%*3'424&(5#)2&
6#$7829"2$%&'(%"&
+(52%"#5:24&;<#"2$9(39&&
+$(#4%&8#"#'3)<2&
+,&0=+1>?+&-0>+@10&"#$%!&'!2'.34&#!
5/)62#7&#)*1!'8&5)-0(&!'59#2&*!
+,&?10>+0&A>++01B&"#$%!&'!2)#/&#!&)-/,*1!
+$(#4%&'(%"&
+,&?,CA@+0&;@>+01B.,B&"#$%!&'!./&2(!&)-/,*!:-&(!&(#!2/&/+'04#1!
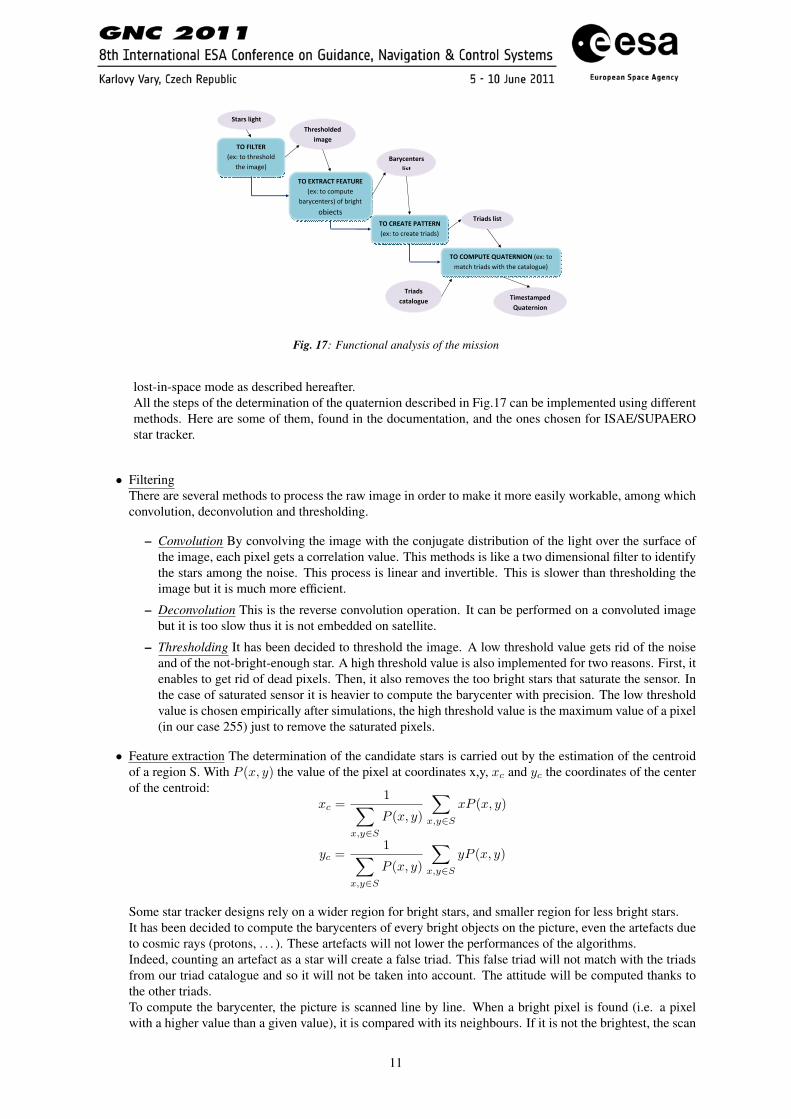
Fig. 17: Functional analysis of the mission
lost-in-space mode as described hereafter.All the steps of the determination of the quaternion described in Fig.17 can be implemented using differentmethods. Here are some of them, found in the documentation, and the ones chosen for ISAE/SUPAEROstar tracker.
• FilteringThere are several methods to process the raw image in order to make it more easily workable, among whichconvolution, deconvolution and thresholding.
– Convolution By convolving the image with the conjugate distribution of the light over the surface ofthe image, each pixel gets a correlation value. This methods is like a two dimensional filter to identifythe stars among the noise. This process is linear and invertible. This is slower than thresholding theimage but it is much more efficient.
– Deconvolution This is the reverse convolution operation. It can be performed on a convoluted imagebut it is too slow thus it is not embedded on satellite.
– Thresholding It has been decided to threshold the image. A low threshold value gets rid of the noiseand of the not-bright-enough star. A high threshold value is also implemented for two reasons. First, itenables to get rid of dead pixels. Then, it also removes the too bright stars that saturate the sensor. Inthe case of saturated sensor it is heavier to compute the barycenter with precision. The low thresholdvalue is chosen empirically after simulations, the high threshold value is the maximum value of a pixel(in our case 255) just to remove the saturated pixels.
• Feature extraction The determination of the candidate stars is carried out by the estimation of the centroidof a region S. With P (x, y) the value of the pixel at coordinates x,y, xc and yc the coordinates of the centerof the centroid:
xc = 1∑x,y∈S
P (x, y)
∑x,y∈S
xP (x, y)
yc = 1∑x,y∈S
P (x, y)
∑x,y∈S
yP (x, y)
Some star tracker designs rely on a wider region for bright stars, and smaller region for less bright stars.It has been decided to compute the barycenters of every bright objects on the picture, even the artefacts dueto cosmic rays (protons, . . . ). These artefacts will not lower the performances of the algorithms.Indeed, counting an artefact as a star will create a false triad. This false triad will not match with the triadsfrom our triad catalogue and so it will not be taken into account. The attitude will be computed thanks tothe other triads.To compute the barycenter, the picture is scanned line by line. When a bright pixel is found (i.e. a pixelwith a higher value than a given value), it is compared with its neighbours. If it is not the brightest, the scan
11

goes on. If it is, the barycenter is computed with a square around the brightest pixel. The size of the squareis the same whatever the magnitude is.With this method to compute barycenter, twin stars will be counted as one star as the two spots on the sensorwill be within the square around the brightest pixel. To deal with it, twin stars are considered as one starduring the creation of the triad catalogue.
• Pattern creationTo identify the sky image taken by the sensor, the natural idea is to recognize the relative positions of starsjust like humans recognize the constellations. This involves to create patterns using the detected stars.
Creating triadsThe selected pattern is a triad. Once all the barycenters are determined, triads are computed. Each triadcontains information about the triangle composed by the three stars: the longest side, the shortest one andthe angle between both of them. The way of creation of the triads is described in section 2.B.
• Database A triad catalogue is embedded to match the triads. This part will be developed in part 2.E.
• Matching triadsFinally, triads are matched with the triad catalogue to get the attitude of the satellite.
This part has not been finished yet. To match the triads, the Hash code is used. Indeed, the three pieces ofinformation about the triad (longest side, shortest side and the angle) are reduced into a smaller data calledkey value so the search of the database will be more efficient. Indeed, the algorithm will search a one inputdatabase (of key value) instead of a three input database (the two sides and the angle).
MISSION SOFTWARE SOLUTION
Concrete solutions should be chosen in order to enable the functions described in Fig. 17 to run. Everyfunction should be associated to a method that carries out the goal of the function. The compliance matrixis a way to check if each function has a solution.
Filtering Feature extraction Pattern creation MatchingThresholding ×Barycenter ×
Triad ×K-D tree ×
Significant value (preliminary study) ×
Fig. 18: Compliance matrix of the mission
MISSION ATTITUDE DETERMINATION FUNCTION DESIGN
One of the main function in Fig.17 is to compute the quaternion. Once the triads are matched, the quater-nion should be computed. There are several methods to compute the quaternion attitude of a satellite. Someof them are described hereafter.ISAE/SUPAERO star tracker will use QUEST [15, 12] which is the main method used nowaday and whichmade the star tracker a key instrument.
Many of these methods are based on Wahba’s problem. It consists in finding the matrix A that transformsthe vector 1 into the vector 2. (Fig.19)In star tracker context, this means finding the matrix to go from the star tracker reference frame to theJ2000 reference frame. This problem is equivalent to finding the matrix that minimizes the function:
J(A) = 12
N∑k=1
ak|Wk −A ∗ Vk|2
12

!
"#$%&'!(!!)*!+,-#!(!
"#$%&'!.!!)*!+,-#!.!
/,%')0!1!
Fig. 19: Wahba’s problem
whereWk, k = 1..N is a set of N measured directions observed in the spacecraft body frame, Vk, k = 1..Nthe corresponding reference directions, and ak, k = 1..N a set of positive weights.Several methods can be used to solve Wahba’s problem. Hereafter are some of them.
Extended Kalman filtersThis method enables the incorporation of dynamic models and redundant sensor signals that have beenmeasured at different times. Extended Kalman filters can handle these data while taking into account theirreliability. But extended Kalman filters are very sensitive to their initialization i.e. the first estimation ofthe attitude. [15]
QUESTQUEST stands for Quaternion ESTimation. Unlike the methods based on extended Kalman filters, theQUEST algorithm does not depend on the first estimation of the attitude. But QUEST cannot handlecomplex dynamic model and needs the attitude rate time history as an input to use data that have beenmeasured at different times.It is based on Wahba’s problem and leads to solve an exact eigenvalue problem.Wahba’s problem, expressed with q the quaternion, consists in finding A(q) that minimizes J(A(q)) underthe constraint qT q = 1 (normalization of the quaternion):
J(A(q)) = 12
N∑k=1
1σ2k
(bk −A(q)rk)T (bk −A(q)rk)
where rk, k = 1..N is a set of known unit direction vectors in inertial coordinates, bk, k = 1..N are theirmeasured values in spacecraft coordinates and σk, k = 1..N are their per-axis direction uncertainties (inradians) [15].
ESOQStanding for EStimator of the Optimal Quaternion, ESOQ algorithm is also based on Wahba’s problem andon solving an exact eigenvalue problem but avoid QUEST sequential rotations by computing the maximumeigenvalue differently [12].
D. SKY SIMULATION
Before embedding the star tracker on a satellite and launching it, the algorithms have to be tested and validated.In order to check if they compute the right quaternion, a sky simulator has been developed to simulate a pictureof the sky corresponding to a quaternion. Thus the sky simulator will be used on the ground, during designand validation stages.
Determination of the quaternion: The aim of the sky simulation is to create a synthetic picture of the skyand the associated quaternion. Then, the picture is processed. The quaternion computed by the star trackersoftware is compared to the one obtained by simulation. To compute this simulation quaternion, the centercoordinates of the sensor are used in the J2000 reference frame. These coordinates are the right ascension and
13
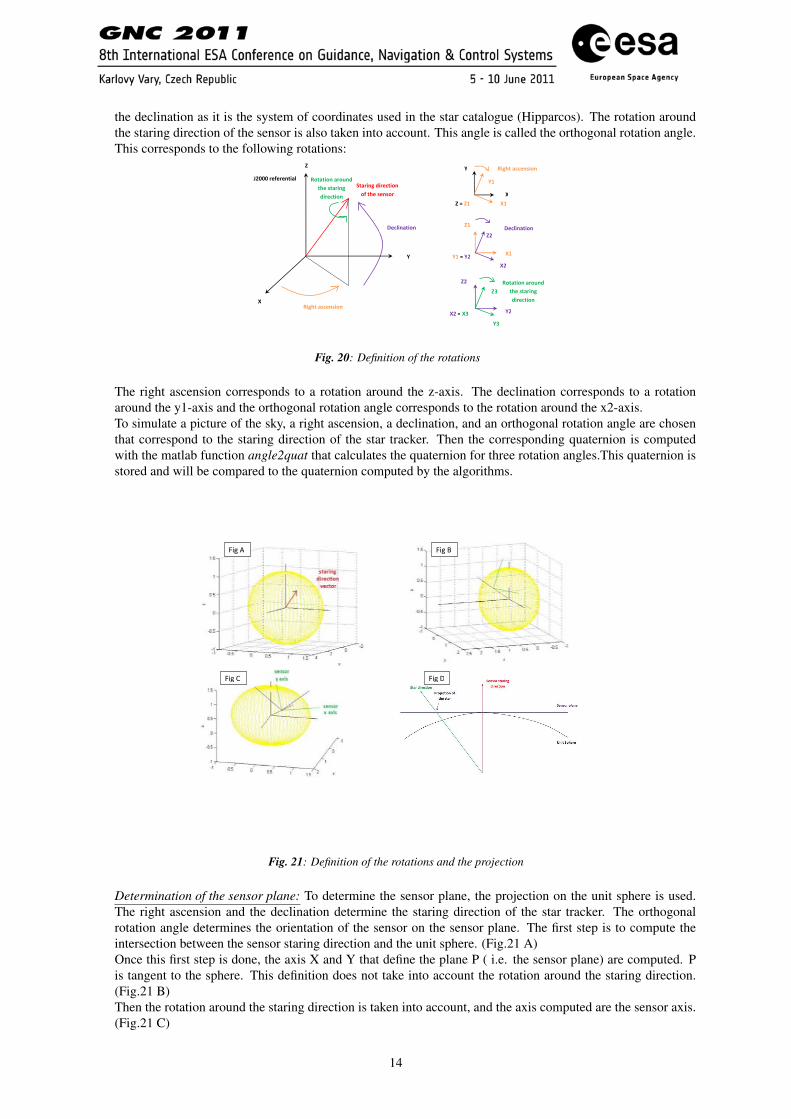
the declination as it is the system of coordinates used in the star catalogue (Hipparcos). The rotation aroundthe staring direction of the sensor is also taken into account. This angle is called the orthogonal rotation angle.This corresponds to the following rotations:
!
!"#
$"%%%#&'('&')*+,-# ./*,*+/)#,&/0)1#*2'#3*,&+)4#1+&'5*+/)#
6*,&+)4#1+&'5*+/)#/(#*2'#3')3/&#
7'5-+),*+/)#
!#
8#
9#
.+42*#,35')3+/)#
9#
8#
9:#
8:#!#;#!:#
9:#;#9"#
!:#
8:#
8"#
7'5-+),*+/)#
!"#
8"#;#8<# 9"#
./*,*+/)#,&/0)1#*2'#3*,&+)4#1+&'5*+/)#
!<#
9<#
.+42*#,35')3+/)#
Fig. 20: Definition of the rotations
The right ascension corresponds to a rotation around the z-axis. The declination corresponds to a rotationaround the y1-axis and the orthogonal rotation angle corresponds to the rotation around the x2-axis.To simulate a picture of the sky, a right ascension, a declination, and an orthogonal rotation angle are chosenthat correspond to the staring direction of the star tracker. Then the corresponding quaternion is computedwith the matlab function angle2quat that calculates the quaternion for three rotation angles.This quaternion isstored and will be compared to the quaternion computed by the algorithms.
Fig A Fig B
Fig C Fig D
Fig. 21: Definition of the rotations and the projection
Determination of the sensor plane: To determine the sensor plane, the projection on the unit sphere is used.The right ascension and the declination determine the staring direction of the star tracker. The orthogonalrotation angle determines the orientation of the sensor on the sensor plane. The first step is to compute theintersection between the sensor staring direction and the unit sphere. (Fig.21 A)Once this first step is done, the axis X and Y that define the plane P ( i.e. the sensor plane) are computed. Pis tangent to the sphere. This definition does not take into account the rotation around the staring direction.(Fig.21 B)Then the rotation around the staring direction is taken into account, and the axis computed are the sensor axis.(Fig.21 C)
14
Determination of the stars on the sensor: The next step is to determine which stars appear on the sensor. Firstthe stars that are on the other side of the sphere are removed thanks to a scalar product. If the scalar productbeteew the staring direction and the star pointing vector is positive, the star is selected. (Fig.21 D)The potential stars are then projected on the sensor plane determined above. The x,y coordinates of the star onthe sensor are xsensor and ysensor. The sensor is a square and its sides are SENSOR SIZE pixels long. As wealready are in the sensor axis, we just have to check if:
−SENSOR SIZE2 < xsensor <
SENSOR SIZE2
−SENSOR SIZE2 < ysensor <
SENSOR SIZE2
The stars that appear on the sensor are directly obtained.
SIMULATION OF THE SKY IMAGE
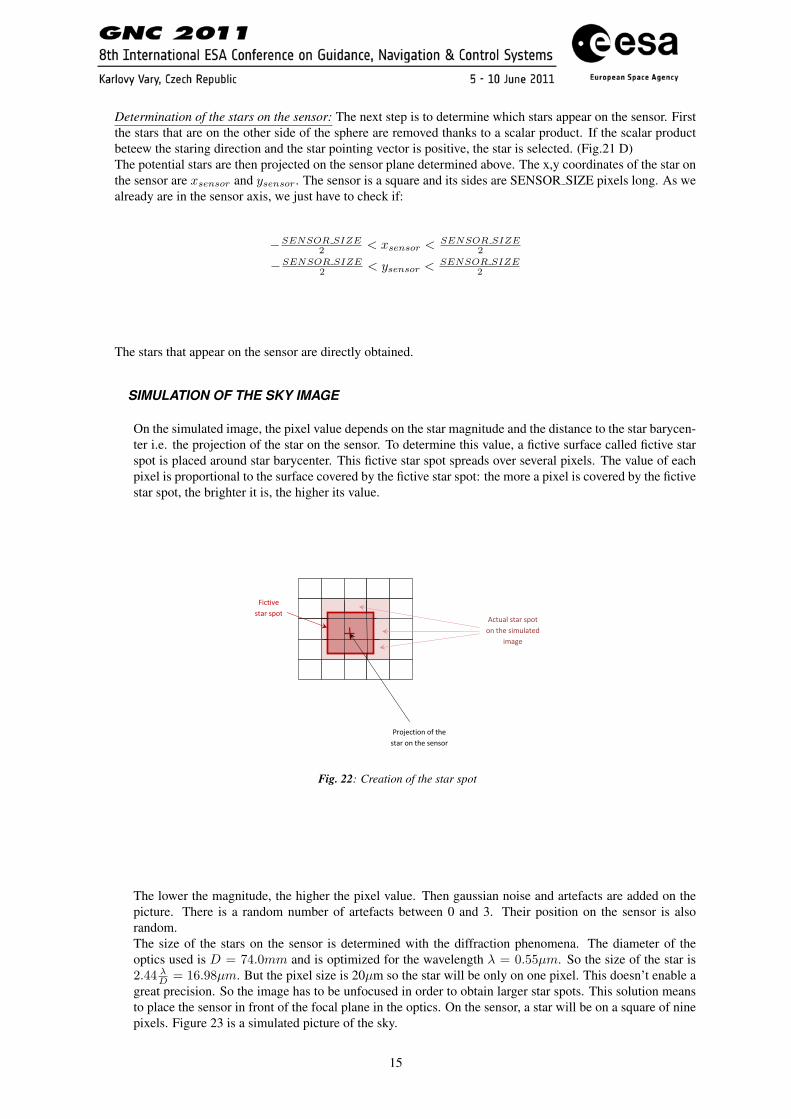
On the simulated image, the pixel value depends on the star magnitude and the distance to the star barycen-ter i.e. the projection of the star on the sensor. To determine this value, a fictive surface called fictive starspot is placed around star barycenter. This fictive star spot spreads over several pixels. The value of eachpixel is proportional to the surface covered by the fictive star spot: the more a pixel is covered by the fictivestar spot, the brighter it is, the higher its value.
!
"#$%&'()$*!$+!(,&!-(.#!$*!(,&!-&*-$#!
/)'()0&!-(.#!-1$(!
2'(3.4!-(.#!-1$(!$*!(,&!-)534.(&6!
)5.7&!
Fig. 22: Creation of the star spot
The lower the magnitude, the higher the pixel value. Then gaussian noise and artefacts are added on thepicture. There is a random number of artefacts between 0 and 3. Their position on the sensor is alsorandom.The size of the stars on the sensor is determined with the diffraction phenomena. The diameter of theoptics used is D = 74.0mm and is optimized for the wavelength λ = 0.55µm. So the size of the star is2.44 λD = 16.98µm. But the pixel size is 20µm so the star will be only on one pixel. This doesn’t enable agreat precision. So the image has to be unfocused in order to obtain larger star spots. This solution meansto place the sensor in front of the focal plane in the optics. On the sensor, a star will be on a square of ninepixels. Figure 23 is a simulated picture of the sky.
15

Fig. 23: Simulation of the sky. Right ascension = 70o, Declination = 45o, orthogonal rotation angle = 10o
E. USE OF DATABASE
INTRODUCTION:
One of the objectives of our study is to optimize the search algorithm in the database. To reach this goal,a study on the database creation and management is done. Moreover a preliminary study is presented todevelop an reference method and to be familiar with this kind of algorithm.
PRELIMINARY STUDY:
In this preliminary study, it has been chosen to create a database composed of two different catalogues.The first one is a star catalogue, where are listed every stars whose position has to be known by the startracker. The second catalogue is a triad catalogue.To compute the angle of a triad, Al-Kashi’s formula is used: for a triad of size a,b and c, and angle γ,
γ = arccos(a2 + b2 − c2
2ab )
Another possible solution to measure the angle of a triad would be to use the scalar product: for a triadwhose both sides a and b are known, with xa,ya and xb, yb the coordinates of the vectors
→a and
→b ,
γ = arccos(xaxb + yaybab
)
This solution has not been studied for the moment.
In order to be as efficient as possible, the triad catalogue has to be well organized so as to ensure a quickand robust matching. In the following, we will study some important aspects of the triad catalogue whichhave a great influence on the matching efficiency.
Influence of the maximal magnitude accepted:The number of stars in the catalogue depends on the maximal magnitude accepted for those stars. Thehigher this magnitude is, the more stars there are. This is important, because the density of stars from thecatalogue on the celestial sphere depends on the number of stars in the catalogue. Indeed, the more starsare referenced in the catalogue, the more referenced stars will be visible in each field of view.This advantage is nevertheless offset by, first, the fact that on a great part of the sky the density of referencedstars is high enough (for example in the Milky Way), and second by the fact that the more stars are in thecatalogue, the more it will take memory, and time to compute the matching.
16

Influence of the size of the triads in the catalogue:This paragraph will demonstrate that the size of the triads has a great influence on the matching algorithm.Indeed, when a triad in the catalogue is large, the probability for that triad to be present on a field of viewis low. This has to be carefully studied because, although the algorithm should be able to determine theattitude of the satellite with only two or three referenced triads present on the picture, it must be sure that, inevery possible direction the star tracker takes a picture, there will be those two or three triads. To verify theassumption, we ran a simulation, in which the entire sky is analysed, to check the number of triads visibleon the picture. In order to be sure that the triads would be seen regardless of the angle of rotation aroundthe normal axe of the sensor, we have only numbered the triads present in the central circle. (Fig.24) Thus,the number of triad per field of view is underestimated; this could be seen as a problem, but it is preferablethan overestimating it.
Fig. 24: Triads numbered as present or not in the simulation
The results of the simulation are presented in Fig.25. The star catalogue used contains 9984 stars. In thissimulation, each star belongs to one triad maximum. The graphs presented are planispheres, on which arepresented the number of triads from the catalogue visible in the FOV, for each direction. This direction isgiven by two angles: the right ascension (0o to 360o) and the elevation (-90o to 90o), defined in the J2000reference frame. The first graph, top left, is the number of triads present on the field of view for a triadcatalogue in which the triads size do not exceed 600 pixels. In the graphs top right, bottom left and bottomright, they do not exceed 500, 400 and 300 pixels. These graphs underline well the fact that when thetriads are small, they have greater chance to appear on a picture taken by the star tracker. A good criterionis to have at least three different triads in the FOV for each direction on the sky. The results given bythis simulation indicates that in order to be compliant with this goal, the maximum size of the triads sidesshould be 300 pixels. The problem is that when triads are small, the angle is measured less precisely. For
Fig. 25: Comparison of the number of triads for four catalogues
a triad of side length a, b and c, and whose errors on the measure of the sides are εa, εb and εc, the error onthe measure of the angle is:
error =∣∣∣∣arccos( (a+ εa)2 + (b+ εb)2 − (c+ εc)2
2(a+ εa)(b+ εb))− arccos(a
2 + b2 − c2
2ab )∣∣∣∣
17

A accurate measure of the angle is very important to discriminate efficiently the triads. Indeed, the betterthe angles are known, the less the recognition of the triads can be ambiguous. Figure 26 presents, fordifferent maximal sizes of triads, the evolution of the number of triads in the catalogue which have thesame characteristics than another one in the same catalogue.
Fig. 26: Comparison of the efficiency of different catalogues
Fig.26 shows that the number of triads which can be mistaken for another triad from the same cataloguedecreases fastly with the decreasing of the error on the measure of the side lengths. But moreover, acatalogue with triads whose size does not exceed 300 pixels is not discriminating enough. For an error ofonly 0,1 pixel, which is the common precision of actual star tracker, eight triads can be mistaken. The maingoal should be to reach zero.
In order to ensure a satisfying precision, and to increase the number of visible triads in the field of view, asolution would be to create several triads with each star. This could indeed enable to increase the size ofthe triad catalogue, and thus the number of triads per FOV, without increasing the number of referencedstars. But the results are not satisfying, as Fig.26 presents it: the three planispheres present the number oftriads visible in each FOV, for (from top to bottom) a triad catalogue in which there are one to three triadsper star.
Fig. 27: Comparison of the number of triad per FOV, for a number of triads from 1 to 3 per star (from top to bottom)
18
Actually, the real difficulty in creating a triad catalogue consists in reaching at the same time two differentgoals: to create a discriminating enough catalogue, to keep a high number of triads visible in every field ofview, without creating a catalogue which would be too heavy in the memory.There are many possible improvements. The first would be to evaluate the better number of triads thecatalogue has to contain, to be both fast during computing, not too heavy in the memory, and high enoughto assure a minimum of three triads per FOV.It could also be decided to increase the number of stars in the star catalogue, but to remove some starswhere they are numerous enough. On the planispheres presented in this study, one can indeed see thatin the direction of the Milky Way, the number of triads is very high (up to 44 triads per FOV for a starcatalogue containing around 1000 stars), what is not necessary at all . . .
SOPHISTICATED DATABASE STATE OF THE ART
Today there are several algorithms for management and creation of database. With the growth of theinternet, this field was subject to research of new database to store all the data. For example, Google isdeveloping lots of searching methods. One of the most interesting ones is the binary space tree. It ispossible to define the Binary Space Partitioning (BSP) as a method which recursively subdivides a spaceinto convex sets by hyperplanes. This subdivision gives rise to a representation of the scene by means of atree data structure known as a BSP tree. There are different kinds of BSP trees which are presented in thispart.
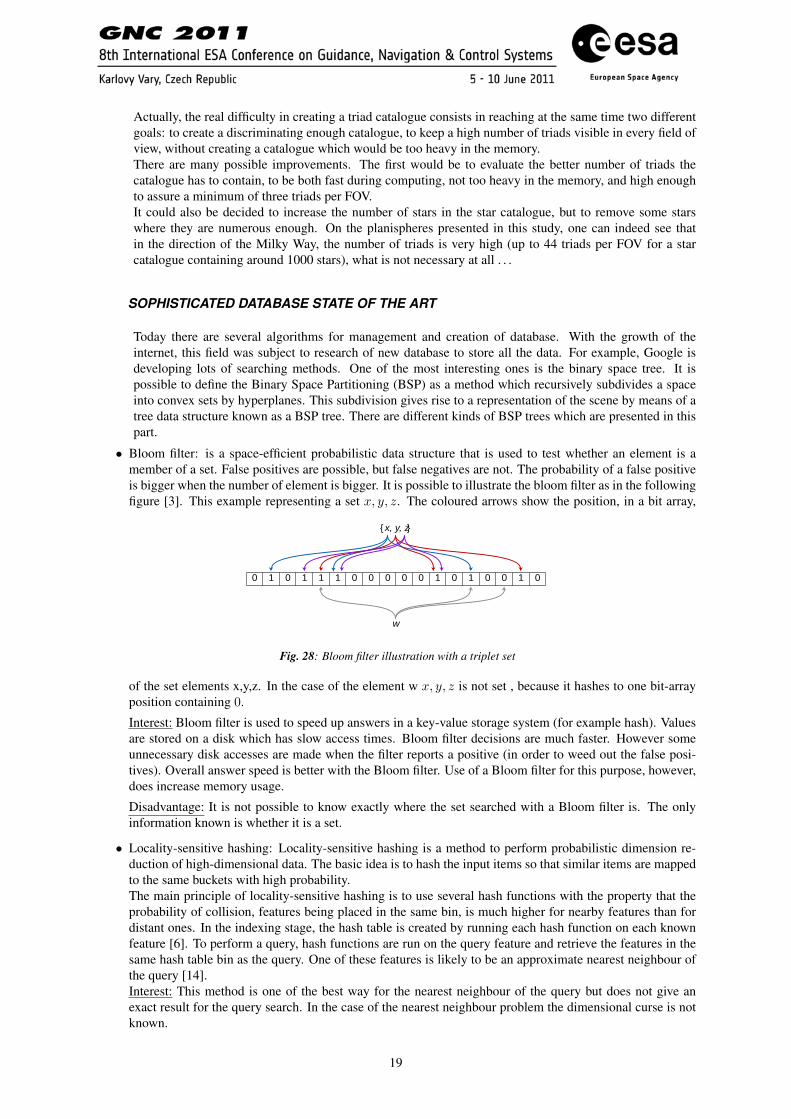
• Bloom filter: is a space-efficient probabilistic data structure that is used to test whether an element is amember of a set. False positives are possible, but false negatives are not. The probability of a false positiveis bigger when the number of element is bigger. It is possible to illustrate the bloom filter as in the followingfigure [3]. This example representing a set x, y, z. The coloured arrows show the position, in a bit array,
0 1 0 1 1 1 0 0 0 0 0 1 0 1 0 0 1 0
{ x, y, z}
w
Fig. 28: Bloom filter illustration with a triplet set
of the set elements x,y,z. In the case of the element w x, y, z is not set , because it hashes to one bit-arrayposition containing 0.
Interest: Bloom filter is used to speed up answers in a key-value storage system (for example hash). Valuesare stored on a disk which has slow access times. Bloom filter decisions are much faster. However someunnecessary disk accesses are made when the filter reports a positive (in order to weed out the false posi-tives). Overall answer speed is better with the Bloom filter. Use of a Bloom filter for this purpose, however,does increase memory usage.
Disadvantage: It is not possible to know exactly where the set searched with a Bloom filter is. The onlyinformation known is whether it is a set.
• Locality-sensitive hashing: Locality-sensitive hashing is a method to perform probabilistic dimension re-duction of high-dimensional data. The basic idea is to hash the input items so that similar items are mappedto the same buckets with high probability.The main principle of locality-sensitive hashing is to use several hash functions with the property that theprobability of collision, features being placed in the same bin, is much higher for nearby features than fordistant ones. In the indexing stage, the hash table is created by running each hash function on each knownfeature [6]. To perform a query, hash functions are run on the query feature and retrieve the features in thesame hash table bin as the query. One of these features is likely to be an approximate nearest neighbour ofthe query [14].Interest: This method is one of the best way for the nearest neighbour of the query but does not give anexact result for the query search. In the case of the nearest neighbour problem the dimensional curse is notknown.
19
Disadvantage: A given query feature can be found in a wrong bin, i.e. not in the bin containing its nearestneighbour.
• K-d tree: A k-d tree is a data structure which stores a set of points from a k-dimensional space. It wasexamined in detail by [1] [5]. The idea is to build a binary tree over the feature space, where each nodeowns a region of the space which is disjoint from the region owned by its parent node. Each non-terminalnode has an axis-aligned splitting hyper-plane in two; its left child owns the subspace to the left sub-plane,and the right child the subspace to the right sub-plane. In this way, the k-d tree defines a hierarchicalsubdivision of the feature space into axis-aligned hyper-rectangles.For the features indexing step using a geometric hashing system, the set of features is known beforehandand is static, so there is no need to add or delete features from the tree. Moreover Bentley’s [1] optimizedkd-tree construction method can be used. This tree is particularly well used for the geometric hash [9].
Interest: The K-d tree is the better way to create the database if a feature matching and neighbours searchalgorithms are performed. A K-d tree is a partitioned space structure of data which able to store points andto search more efficiently than a linear table of points.
FUTURE STUDY:
K-d tree is the better way to organize a database because it is the only one which can find exactly an elementinside the database and its neighbours at the same time. After the end of the preliminary study, a k-d treeis implemented with a hash function as in [1, 9]. In our case the geometric hash will be the triad. Fromthis study results to be obtained are expected to be better than a basic matching method. Moreover we willtry to use the power of the nearest neighbour problem solved easily by the k-d tree implementation to buildsome sub-catalogues to optimize the matching.
5. IMPLEMENTATION ON MATLAB/SIMULINK
The main challenge in implementing the algorithms is to handle the real time computing. Indeed thealgorithm embedded on the star tracker will manage real time computing but these algorithms are notdeveloped in a real time environment but on Matlab. To face this challenge, the code will be automaticallygenerated from the Matlab files for real-time embedded systems. Generating the code automatically is thesolution chosen by Sodern for its star trackers.
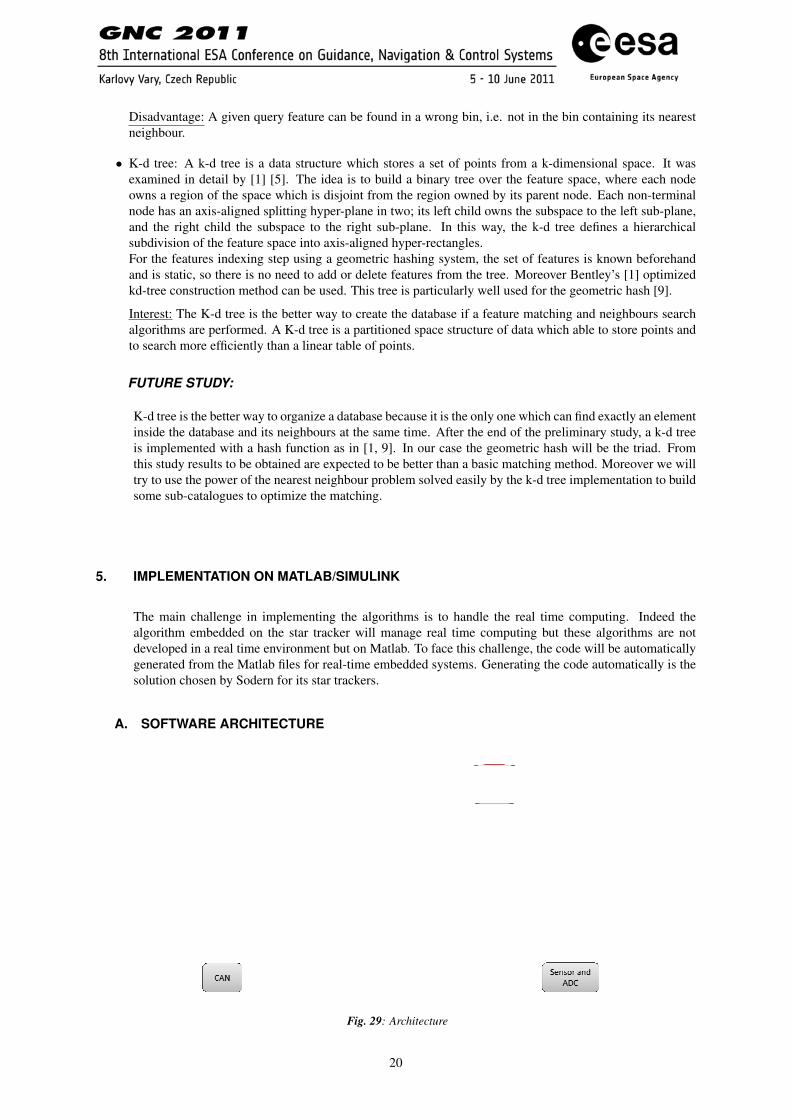
A. SOFTWARE ARCHITECTURE
!
Fig. 29: Architecture
20
The software architecture is chosen to enable the functions described in Fig.15 to run. As the different functionsdo not have the same length and the same priority, there will be three threads:
• The FIFO thread will start as soon as the star tracker receives a TC or needs to send a TM. If receivinga TC, it will read the TC from the Generic CAN (Controller Area Network) Node and will store it in themicro-controller memory (external to the FPGA) with formers TCs awaiting treatment. If sending a TM, itwill store the telemetries and send them to the Generic CAN Node as soon as possible. Finally, it will pauseuntil new event. It is the fastest thread.
• The FAST thread is responsible for the management of the star tracker. Indeed, it will periodically interpreteach TC and order consequent scripts, add TM to sending list, monitor the star tracker with housekeepingmeasurement and watchdogs, orders to change the mode if necessary, order to compute the main mission,which means processing an image and obtaining a quaternion, and to perform light mode changing scripts.This thread contains the functions To support the mission and To change the mode (Fig.15).
• The HEAVY thread will wait until the FAST thread orders it to start. Then, it will be able to run algorithmsof the main mission, to perform mode changing scripts, and to process the image in the FPGA dedicatedcells. This processing will start on a Heavy thread event and then run periodically until break or failure.This thread contains the function To estimate the quaternion (Fig.15).
B. AUTOMATIC CODE GENERATION
First, the models are designed under Matlab environment. The tools needed are Simulink, Stateflow and Real-Time Workshop Embedded Coder. Stateflow chart enables auto-generation of C code from Matlab code thanksto Real-Time Workshop. Obviously, the model must comply with Embedded Matlab standards.After that, there will be several C files generated for real-time embedded systems. Each of them will be testedseparately by implementing it on the breadboard. Then, these files will have to behave like threads beforeimplementing the whole model on the board.Regarding the main mission algorithms, the model will also be designed under Matlab except for image pro-cessing, which will be described in VHDL, implemented and tested directly on the FPGA. Then, the Matlabmodel will be incorporated in the HEAVY thread model and finally, generated in C, verified and validated.
C. CONCLUSION AND PERSPECTIVES
This article has described the current work on ISAE/SUPAERO star tracker which is completely developed bya student team including the hardware, the optics, the software and the structure teams. This paper essentiallyconcerns the algorithm computing the attitude, which is in fact the main mission of a star tracker.The aim is to adapt the principle of music recognition used by Shazam to the recognition of sky regions.Shazam algorithm creates anchor points in a piece of music, related to target zones. The information it gathersis summarized in hashes in order to make the research algorithm faster.In the same way, the star tracker algorithm use anchor star to create triads with stars located in a target zone.Those triad characteristics will be summarized in a hash for the same reason of speed. Concerning the algo-rithm itself, the solutions for filtering, extracting features, creating patterns and computing quaternion havebeen chosen among solutions found in the literature and developed by the authors.An important work has also been realized, concerning the sky simulation for an end-to-end simulation, and apreliminary study of the database.Future works includes finishing the end-to-end simulation, creating a database using the K-D tree organization,testing the algorithm with real pictures of the sky, and implementing the whole software on a breadboard modelto test the real time computing.
6. ACKNOWLEDGEMENT
The authors would like to thank all the people involved in this project and in particular: the hardware teamof ISAE/SUPAERO star tracker (Arnaud Berlioz, Gregoire Desprez, Maxime Godeau, Alain Minier and Noel
21

Mombazet), and ISAE/SUPAERO professors David Mimoun, Jerome Hugues, Arnaud Dion for their help allalong the year. They would also like to thank David Saussie, post doctoral student at ISAE.
REFERENCES
[1] Jon Louis Bentley. Multidimensional divide-and-conquer. Communications of The ACM, 23:214–229, 1980.
[2] Michael A. Casey, Remco Veltkamp, Masataka Goto, Marc Leman, Christophe Rhodes, and Malcolm Slaney.Content-based music information retrieval: Current directions and future challenges. Proceedings of The IEEE,96:668–696, 2008.
[3] Fay Chang, Jeffrey Dean, Sanjay Ghemawat, Wilson C. Hsieh, Deborah A. Wallach, Mike Burrows, Tushar Chandra,Andrew Fikes, and Robert E. Gruber. Bigtable: A distributed storage system for structured data. In IN PROCEEDINGSOF THE 7TH CONFERENCE ON USENIX SYMPOSIUM ON OPERATING SYSTEMS DESIGN ANDIMPLEMENTATION - VOLUME 7, pages 205–218, 2006.
[4] Peter Jan O. Doets and Reginald L. Lagendijk. Distortion estimation in compressed music using only audio fingerprints.IEEE Transactions on Audio, Speech and Language Processing, 16:302–317, 2008.
[5] Jerome H. Freidman, Jon Louis Bentley, and Raphael Ari Finkel. An algorithm for finding best matches in logarithmicexpected time. ACM Transactions on Mathematical Software, 3:209–226, 1977.
[6] Aristides Gionis, Piotr Indyk, and Rajeev Motwani. Similarity search in high dimensions via hashing. In Malcolm P.Atkinson, Maria E. Orlowska, Patrick Valduriez, Stanley B. Zdonik, and Michael L. Brodie, editors, VLDB’99,Proceedings of 25th International Conference on Very Large Data Bases, September 7-10, 1999, Edinburgh, Scotland,UK, pages 518–529. Morgan Kaufmann, 1999.
[7] Jaap Haitsma and Ton Kalker. A highly robust audio fingerprinting system. In International Conference on MusicInformation Retrieval, 2002.
[8] Frank Kurth and Meinard Mller. Efficient index-based audio matching. IEEE Transactions on Audio, Speech andLanguage Processing, 16:382–395, 2008.
[9] D. Lang. Automatic recognition and calibration of astronomical images.
[10] C. C. Liebe. Accuracy performance of star trackers - a tutorial. IEEE Transactions on Aerospace and ElectronicSystems, 38:587–599, 2002.
[11] Stphanie Lizy-Destrez and David Mimoun. Str: a student developed star tracker for the esa-led esmo moon mission. InGlobal Lunar Conference, 2010.
[12] F. Landis Markley and Daniele Mortari. How to estimate attitude from vector observations.
[13] James P. Ogle and Daniel P. W. Ellis. Fingerprinting to identify repeated sound events in long-duration personal audiorecordings. In International Conference on Acoustics, Speech, and Signal Processing, pages 233–236, 2007.
[14] Loic Pauleve, Herve Jegou, and Laurent Amsaleg. Locality sensitive hashing: A comparison of hash function types andquerying mechanisms. Pattern Recognition Letters, 31:1348–1358, 2010.
[15] Mark L. Psiaki. Extended quest attitude determination filtering.
[16] Avery Wang. An industrial strength audio search algorithm. In International Symposium/Conference on MusicInformation Retrieval, 2003.
[17] Avery Wang. The shazam music recognition service. Communications of The ACM, 49:44–48, 2006.
22