This is a postprint of: Lønborg, C., Yokokawa, T., Herndl ...
42
This is a postprint of: Lønborg, C., Yokokawa, T., Herndl, G.J. & Alvarez-Salgado, X.A. (2015). Production and degradation of fluorescent dissolved organic matter in surface waters of the eastern north Atlantic ocean. Deep Sea Research, Part A. Oceanographic Research Papers, 96, 28–37 Published version: dx.doi.org/10.1016/j.dsr.2014.11.001 Link NIOZ Repository: www.vliz.be/nl/imis?module=ref&refid= [Article begins on next page] The NIOZ Repository gives free access to the digital collection of the work of the Royal Netherlands Institute for Sea Research. This archive is managed according to the principles of the Open Access Movement, and the Open Archive Initiative. Each publication should be cited to its original source - please use the reference as presented. When using parts of, or whole publications in your own work, permission from the author(s) or copyright holder(s) is always needed.
Transcript of This is a postprint of: Lønborg, C., Yokokawa, T., Herndl ...

This is a postprint of: Lønborg, C., Yokokawa, T., Herndl, G.J. & Alvarez-Salgado,
X.A. (2015). Production and degradation of fluorescent
dissolved organic matter in surface waters of the eastern north
Atlantic ocean. Deep Sea Research, Part A. Oceanographic
Research Papers, 96, 28–37
Published version: dx.doi.org/10.1016/j.dsr.2014.11.001 Link NIOZ Repository: www.vliz.be/nl/imis?module=ref&refid=
[Article begins on next page]
The NIOZ Repository gives free access to the digital collection of the work of the Royal
Netherlands Institute for Sea Research. This archive is managed according to the principles
of the Open Access Movement, and the Open Archive Initiative. Each publication should be
cited to its original source - please use the reference as presented.
When using parts of, or whole publications in your own work, permission from the author(s)
or copyright holder(s) is always needed.

Production and degradation of fluorescent dissolved organic matter in surface waters of the 1
eastern North Atlantic Ocean 2
Christian Lønborga,b*
, Taichi Yokokawac, Gerhard J. Herndl
d,e and Xosé Antón Álvarez-3
Salgadoa 4
a IIM–CSIC, Instituto de Investigacións Mariñas, Eduardo Cabello 6, 36208 Vigo, Spain 5
b Australian Institute of Marine Science, PMB 3, Townsville MC, QLD 4810, Australia 6
cCenter for Marine Environmental Studies, Ehime University, Matsuyama 790–8577, Japan 7
d Department of Limnology and Oceanography, University of Vienna, Althanstrasse 14 8
A-1090 Vienna, Austria. 9
eDepartment of Biological Oceanography, Royal Netherlands Institute for Sea Research 10
(NIOZ), P.O. Box 59, 1790 AB Den Burg Netherlands. 11
12
*Corresponding author: 13
Australian Institute of Marine Science 14
PMB 3, Townsville MC, QLD 4810 15
Australia 16
Phone: 0061 (0) 7 4753 4382 17
Fax: 0061 (0) 7 4772 5852 18
Email: [email protected]

1
Abstract 20
The distribution and fate of coloured dissolved organic matter (CDOM) in the epipelagic 21
Eastern North Atlantic was investigated during a cruise in the summer 2009 by combining 22
field observations and culture experiments. Dissolved organic carbon (DOC) and nitrogen 23
(DON), the absorption spectra of CDOM and the fluorescence intensity of proteins (Ex/Em 24
280/320 nm; F(280/320)) and marine humic-like substances (F(320/410)) were measured in 25
the upper 200 m. DOC and DON showed higher concentrations in the top 20 m than below, 26
and DOC increased southwards, while DON decreased. F(280/320) and F(320/410) showed 27
maxima near the deep chlorophyll maximum (at about 50 m), suggesting that these 28
fluorophores were linked to phytoplankton production and the metabolism of the associated 29
microbial community. The coloured and fluorescent fractions of DOM showed low levels 30
south of the Azores Front, at about 35◦N, likely due to the accumulated photobleaching of 31
the waters transported eastwards by the Azores current into the study area (at 20ºW). 32
Twelve culture experiments were also conducted with surface water (5 m) to assess the 33
impact of microbial degradation processes on the bulk, coloured and fluorescent fractions 34
of DOM. After 72 hours of incubation in the darkness, 14 ± 9% (average ± SD) of the 35
initial DON was consumed at an average rate of 0.24 ± 0.14 µmol l-1
d–1
and the protein-36
like fluorescence decayed by 29 ± 9% at a net rate of 0.06 ± 0.03 QSU d–1
. These rates 37
were significantly lower south of the Azores front, suggesting that DOM in this region was 38
of a more recalcitrant nature. Conversely, the marine humic-like fluorescence increased at a 39
net rate of 0.013 ± 0.003 QSU d–1
. The close linear relationship of DON uptake with 40
F(280/320) consumption (R2= 0.91, p <0.0001, n = 12) and F(320/410) production (R
2= 41
0.52, p <0.008, n = 12) that we found during these incubation experiments suggest that the 42
protein-like fluorescence can be used as a proxy for the dynamics of the labile DON pool 43

2
and that marine humic-like materials can be produced as a by-product of microbial DOM 44
degradation. 45
Keywords: Coloured dissolved organic matter, bioavailability, absorption and fluorescence 46
spectroscopy, Eastern North Atlantic Ocean.47

3
1. Introduction 48
The largest pool of reactive nitrogen in the open ocean is contained in dissolved organic 49
matter (DOM), which originates mainly from phytoplankton and heterotrophic bacteria 50
exudation, viral cell lysis, protozoan grazing and zooplankton sloppy feeding (Bronk, 2002; 51
Nagata, 2000). Although a variable fraction of the DOM pool can be utilized by marine 52
microbes in hours to days, most of it is recalcitrant to microbial degradation over time-53
scales of years to millennia (Hansell, 2013). In the coastal ocean, 22 ± 12 % (average ± SD 54
of an extensive global data base) of the dissolved organic carbon (DOC) and 35 ± 13 % of 55
the dissolved organic nitrogen (DON) is bioavailable with half-life times of 10 and 6 days, 56
respectively (Lønborg and Álvarez-Salgado, 2012). Information about the bioavailability 57
and degradation rates of DOM in open ocean waters is noticeably rarer, particularly in the 58
case of DON, but see the studies by Kirchman et al. (1991) and Lestcher et al. (2013) for 59
the few existing estimates (data range < 3 to 48%). 60
A fraction of the DOM pool absorbs light strongly in the UV and blue range of the 61
spectrum, with a part of this energy being re-emitted as fluorescence (Coble, 2007; 62
Stedmon and Álvarez-Salgado, 2011). This coloured DOM (CDOM) is a major factor 63
determining the underwater light field and attenuation of UV radiation in the ocean (Nelson 64
and Siegel, 2013). The fluorescence emission of CDOM (FDOM) in natural waters is 65
mainly due to protein- and humic-like compounds (Coble, 1996). The protein-like 66
fluorescence is related to the aromatic amino acids (tyrosine, tryptophan and 67
phenylalanine) and has been suggested as a suitable tracer for bio-labile DOM (Yamashita 68
and Tanoue, 2003; Lønborg et al., 2010). Conversely, the resistance to microbial 69
degradation of humic materials has led to consider the humic-like fluorescence as an 70
indicator for recalcitrant DOM, which is either of terrestrial origin or generated as a by-71

4
product of the microbial degradation of biogenic organic matter (Nieto-Cid et al., 2006; 72
Yamashita and Tanoue, 2008; Lønborg et al., 2010; Jørgensen et al., 2011, Kowalczuk et 73
al., 2013). Andrew et al. (2013) has also suggested that chemical or microbial modification 74
of terrestrial organic material could also be an alternative source of humic-like FDOM. 75
Although numerous studies have used the fluorescence intensity of protein- and humic-like 76
compounds to trace changes in the composition, production and degradation of DOM (e.g. 77
Coble et al., 1990; Guillemette and Del Giorgio, 2012), quantitative relationships between 78
DOM and FDOM properties are still lacking. 79
In this study we determined the distribution and fate of CDOM during a summer cruise 80
in the Eastern North Atlantic (ENA) Ocean from 42º to 27ºN by combining field 81
observations and culture experiments. This study is complementing the work by Lønborg 82
and Álvarez-Salgado (2014), who studied the variability of DOM and CDOM in the dark 83
ENA Ocean and Benavides et al. (2013) who studied the role of N2 fixation and the uptake 84
and regeneration of DON in the upper water column during the same cruise. In this paper 85
we aimed at 1) describing the spatial variability of bulk, coloured and fluorescent DOM 86
components in epipelagic waters (0–200 m); 2) determining the short-term changes in 87
CDOM optical properties during seawater culture experiments; and 3) establishing 88
quantitative relationships between changes in FDOM and DOM bioavailability in the 89
epipelagic ENA Ocean. 90
2. Material and methods 91
2.1. Field data 92
Surface water samples (0–200 m) were collected during the CAIBOX cruise on board 93
the R/V Sarmiento de Gamboa from 25 July to 14 August 2009 (Fig. 1). Salinity, 94

5
temperature, chlorophyll a (Chl a), and inorganic nutrient (Nitrate-NO3–, Phosphate- 95
HPO42–
and Silicate- SiO4H4) profiles were obtained at 71 stations (white dots in Fig. 1). 96
Salinity, temperature and fluorescence of Chl a (F-Chl a) were recorded with a CTD 97
SeaBird 911 and a Sea-Tech fluorometer mounted on a General Oceanics rosette sampler 98
equipped with 24 Niskin bottles of 12 litres. Bottle samples were typically collected at 3- 4 99
depths ranging between 5 and 200 m. The CTD salinities were calibrated with bottle 100
samples analysed on board with a Guildline 8410-A Portasal. The F-Chl a records were 101
calibrated by filtration of 250 ml of sample water through a Whatman GF/F filter, 102
extraction in acetone (90% v/v), and fluorimetric determination with a Turner Designs 103
10000R fluorometer standardised with pure Chl a (Sigma) (Yentsch and Menzel, 1963). 104
Water samples for the analysis of inorganic nutrients were collected in 50 ml acid washed 105
polyethylene bottles and preserved in the dark at 4ºC until analysed on board within a few 106
hours. 107
The squared Brunt-Väisälä frequency (N2) is commonly used to quantify the 108
stratification of the water column. Following Millard et al., (1990), N2
can be calculated as:
109
z
gz
g
)ln(N2
(1) 110
Where g is the gravity acceleration constant (9.8 m s–2
), z is the water depth, and ρ is the 111
water density at depth z. Integration of Eq. 1 between two depth levels (1 and 2), 112
1212
2 lnN zzg , provides a measure of the average stability of the water 113
column between z1 and z2. Here we will report values of N , i.e., the square root of N2, in 114
min–1
. The higher the N , the larger the stratification. 115

6
Profiles of dissolved organic carbon (DOC) and nitrogen (DON), absorption spectra of 116
coloured DOM (CDOM) and fluorescence intensities of protein- and humic-like substances 117
were obtained at 16 stations (black dots in Fig. 1). 118
2.2. Incubation experiments 119
Additional water was collected at 5 m at the first 12 of the 16 stations where DOM 120
variables were measured (framed stations in Fig. 1). This water was used to conduct 121
incubation experiments to measure changes in bulk concentrations and optical properties of 122
DOM over a period of 72 hours. Filtration of the water started within 20 min of collection; 123
one part was filtered through a dual-stage (0.8 µm and 0.2 µm) filter cartridge (Pall-124
Acropak supor Membrane) which had been pre-washed with 10 l of Milli-Q water; the 125
second part was filtered through pre-combusted (450°C for 4 h) Whatman GF/C filters to 126
establish a microbial inoculum. After filtration, the water was transferred into a 20 l carboy 127
and the microbial inoculum was added to the 0.2 µm filtrate corresponding to 10% of the 128
total volume. Thereafter, the water was transferred into 20 glass bottles of 500 ml 129
(headspace ~100 ml), with four replicate bottles being sacrificed for analyses at times 0, 12, 130
24, 36 and 72 hours. The incubators were kept in the dark at 15°C, this temperature was 131
chosen as it represents the yearly average water temperature in the top 200 m in our study 132
area. Unfiltered water from these bottles was used at time 0 and 72 hours to follow changes 133
in bacterial production (BP). Samples for the analysis of dissolved inorganic nitrogen 134
(NH4+ and NO3
–+NO2
–) and phosphate (HPO4
2–), DOC, total dissolved nitrogen (TDN) and 135
CDOM absorption were collected in four replicates at 0 and 72 hours. DOM fluorescence 136
(FDOM) was measured at all time points. The samples for the dissolved phase were 137
collected after filtration through 0.2 µm filters (Pall Supor membrane Disc) in an acid-138

7
cleaned glass filtration system under low N2 flow pressure. Water samples for inorganic 139
nutrients (NH4+, NO3
–+NO2
– and HPO4
2–) were collected in 50 ml acid washed (HCl) 140
polyethylene bottles and kept frozen (-20°C) until measured in the base laboratory. All 141
glasswares used were first acid-washed in 10% HCl and thereafter rinsed with Milli-Q and 142
sample water prior to use. 143
2.3. Sample measurements 144
BP was determined by [3H]-leucine incorporation as outlined in Yokokawa et al. (2012). 145
Briefly, duplicate subsamples (1.5 ml) were dispensed into screw capped 2.0 ml centrifuge 146
tubes and 5 nM (final concentration) of [3H]-leucine was added and incubated at 15°C in 147
the dark for 1 to 4 h. One trichloroacetic acid (TCA)-killed blank was used per sample. The 148
incubation was terminated by adding TCA (final concentration 5%), and the samples were 149
centrifuged at 18,000 × g for 10 min, followed by a TCA rinse (5%) and an ethanol rinse 150
(80%). Thereafter, 1.5 ml of scintillation cocktail (Ultima Gold) was added to the samples 151
and after 12-18 hours, the disintegrations per minute (DPM) were measured using a spectral 152
liquid scintillation counter (Perkin Elmer, Tri-Carb 3100TR). Quenching was corrected 153
using an external standard channel ratio and the DPM of the TCA-killed blank were 154
subtracted from the average DPM of the samples. The leucine incorporation rates were 155
expressed in pmol l-1
d–1
. 156
Inorganic nutrients (NH4+, NO3
–+ NO2
–, HPO4
2– and SiO4H4) were determined using 157
standard segmented flow analysis (SFA) (Hansen and Koroleff, 1999). The precisions were 158
± 0.05 μmol l–1
for NH4+ and SiO4H4, ± 0.1 µmol l
–1 for NO3
- + NO2
- and ± 0.02 µmol l
–1 159
for HPO42–
. 160

8
Samples (10 ml) for DOC and TDN analysis were collected in pre-combusted (450ºC for 161
12 h) glass ampoules and preserved by adding 50 μl of 25 % H3PO4. DOC and TDN 162
samples were analysed using a Shimadzu total organic carbon analyser (platinum catalyst) 163
connected to an Antek TN measuring unit. Concentrations were determined by subtracting 164
a Milli-Q blank and dividing by the slope of a daily 4 points standard curve made from 165
potassium hydrogen phthalate and glycine. To avoid the small error associated with day-to-166
day instrument variability, all samples from a given experiment were analysed on a single 167
day. Using the deep ocean reference samples (Batch 9–2009, Florida Strait at 700 m) we 168
obtained a concentration of 45.0 ± 1.4 µM for DOC and 33.4 ± 0.6 µM for TDN (average ± 169
SD, n = 6). The nominal values provided by the reference laboratory (Hansell laboratory) 170
are 41–44 and 32.25–33.75 µM, respectively. DON concentrations were calculated as the 171
difference between TDN and DIN (DON = TDN – DIN) with the standard error (SE) 172
calculated as the sum of the contributions: SE2
DON = SE2
TDN + SE2
NH4 + SE2NO3+NO2. The 173
DOM consumed over the 72 hours incubation is defined here as the bioavailable pool 174
(BDOM), and the remaining as the resistant pool (RDOM). The DOM utilization rate was 175
calculated by dividing BDOM by the incubation time (BDOM/Δt). 176
The CDOM absorption spectra were measured on a Perkin Elmer Lambda 950 177
spectrophotometer equipped with 10 cm quartz cells using Milli-Q water as a blank. 178
Spectral scans were collected between 250 and 750 nm. The absorption coefficient at any 179
wavelength, aCDOM(λ) (m–1
), was calculated as: 180
aCDOM(λ) = 23.03 × [Abs(λ) – Abs(600–750)] (2)
Where Abs(λ) is the absorbance at wavelength λ, and Abs(600–750) is the average 181
absorbance between 600 and 750 nm, which corrects for the residual scattering by fine size 182

9
particle fractions, micro-air bubbles or colloidal material present in the sample, or refractive 183
index differences between the sample and the reference (m–1
), the factor 23.03 converts 184
from decadic to natural logarithms and furthermore considers the cell path-length. The 185
estimated detection limit of this spectrophotometer is 0.001 absorbance units or 0.02m−1
. 186
CDOM fluorescence was measured using a Perkin Elmer LS 55 luminescence 187
spectrometer working with a xenon discharge lamp, equivalent to 20 kW for 8 µs duration, 188
and a 1-cm quartz fluorescence cell. The slit width was 10.0 nm for the excitation and 189
emission wavelengths and an integration time 60 seconds was used. Measurements were 190
performed at a constant temperature of 20°C and Milli-Q water was used as a blank. The 191
excitation/emission (Ex/Em) point measurements were performed at the traditional humic-192
like peaks A (average Ex/Em, 250/435 nm; termed F(250/435)), C (terrestrial humic-like 193
substances, average Ex/Em wavelengths of 340/440 nm; termed F(340/440)), M (marine 194
humic-like substances, average Ex/Em, 320/410 nm; termed F(320/410)) and the protein 195
peak T (protein-like substances, average Ex/Em, 280/320 nm; termed F(280/320)) as 196
proposed by Coble (1996). Fluorescence measurements were expressed in quinine sulphate 197
units (QSU), i.e., in μg equivalents of QS l–1
, by calibrating at Ex/Em 350/450 nm against a 198
quinine sulphate dihydrate (QS) standard dissolved in 0.05 M sulphuric acid. The limit of 199
detection limit, calculated as 3 × the standard deviation of the blank, was 0.03 QSU for 200
F(250/435), 0.05 QSU for F(340/440) and 0.02 QSU for F(320/410) and F(280/320). 201
Whereas F(250/435) and F(340/440) did not change significantly during the course of the 202
experiments (see results section), F(280/320) decayed and F(320/410) built-up according to 203
a first-order kinetics (Fig. 2). The F(280/320) consumed over the 72 hours incubation was 204
here defined as the bioavailable pool (BF(280/320)), and the remaining as the resistant 205
fraction (RF(280/320)). The F(280/320) utilization rate was calculated by dividing 206

10
BF(280/320) by the incubation time (BF(280/320)/Δt). The built-up of F(320/410) over the 207
incubation period is defined as the produced pool (PF(320/410)), and the remaining at the 208
end of the incubation as the resistant fraction (RF(320/410)). 209
Single linear regression analyses were performed to obtain the best-fitting coefficients 210
between pairs of variables obtained with regression model II as described in Sokal and 211
Rohlf (1995). Prior to regression, normality was checked and the confidence level was set 212
at 95%, with all statistical analysis conducted in Statistica 6.0. The coefficient of variation 213
(C.V.) was calculated as the (Standard deviation/Mean) × 100. 214
215
3. Results 216
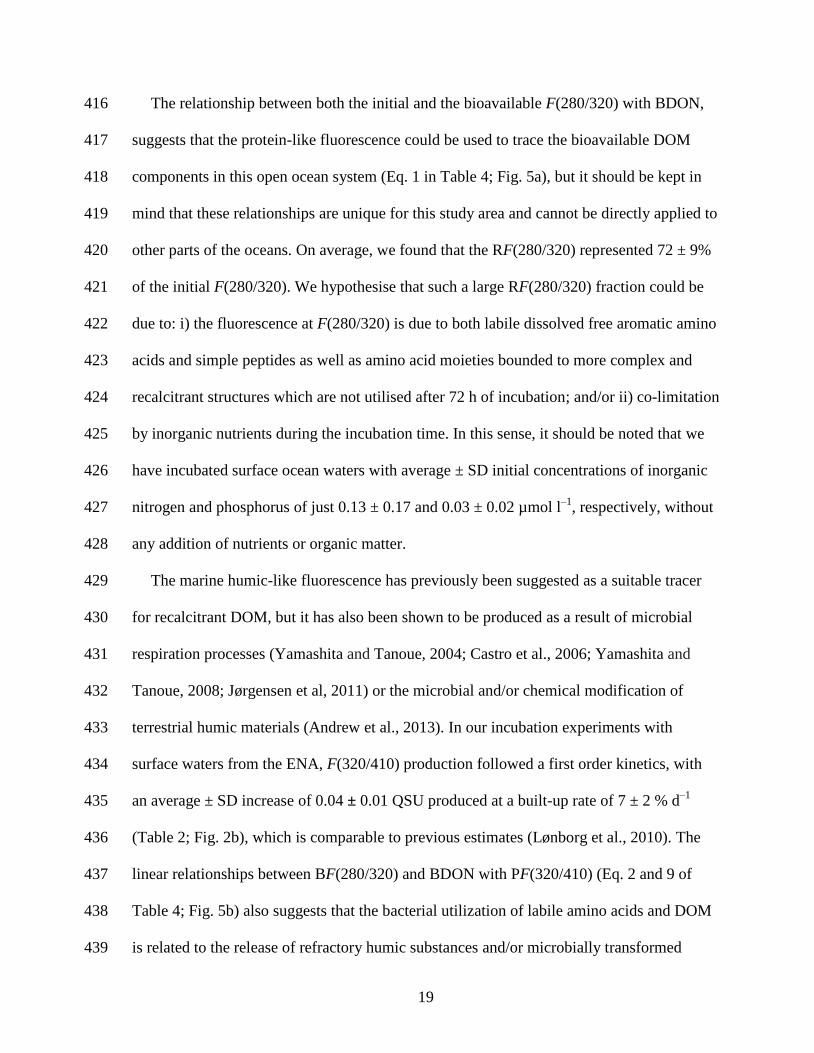
3.1. Hydrographic and chemical characteristics of the surface Eastern North Atlantic 217
(ENA) ocean 218
Salinity varied between 35.3 and 37.2, increasing westwards (from the coast to the open 219
ocean) and southwards (from the temperate to the subtropical ENA) with the presence of a 220
sharp salinity gradient at about 35◦N (see the meridional evolution of the depth of the 36.2 221
isohaline; Fig. 3a). The temperature varied between 12.5 and 24.9◦C, increasing westwards 222
and southward with an abrupt gradient again at 35ºN (see the meridional evolution of the 223
depth of the 16.2ºC isotherm; Fig. 3b). A marked seasonal thermocline was detected 224
between 50 and 70 m, which deepened southwards. These sharp salinity and temperature 225
gradients at about 35◦N identify the position of the Azores front (Fig 3a and b). At the 226
stations close to the Canary Islands, the influence of the coastal upwelling of NW Africa 227
could be identified with more saline and colder water reaching shallower parts of the water 228
column (Fig. 3a & b). 229

11
The profiles of the Brunt-Väisälä frequency ( N ) showed a marked stability maximum, 230
coinciding with the seasonal thermocline, throughout the cruise track (Fig. 3c). The profiles 231
south of 35◦N showed slight increases of N between 50–100 m suggesting a higher degree 232
of stratification in this depth range (Fig. 3c). The Chl a profiles were characterised by 233
generally low values which varied between 0.10 and 1.69 mg m–3
, with higher 234
concentrations north of 35◦N (Fig. 3d). The high stability of the water column at around 50 235
m favoured the development of a marked deep chlorophyll maxima (DCM) to the north of 236
35ºN, which weakened dramatically and deepened down to approx. 100 m south of that 237
position (Fig. 3d). The DCM became shallower close to the Canary Islands in response to 238
coastal upwelling. 239
Inorganic nutrient concentrations were generally around the detection limit in the upper 240
50 m (Fig. 3e & f). In parallel to the meridional change of water temperature below the 241
seasonal thermocline, subsurface nutrient levels were higher north of 35◦N, while they were 242
around the detection limit down to 200 m south of that latitude. The influence of the NW 243
African upwelling area could be detected at the southern stations with nutrients (> 3 µM for 244
NO3–
and > 0.15 µM for HPO42–
) reaching shallower parts of the water column (Fig. 3e & 245
f). 246
Higher levels of DOC and DON were generally observed in the surface 50 m with 247
average ± SD concentrations of 66 ± 7 µmol l-1
of C and 6.3 ± 0.9 µmol l-1
of N, and 248
decreasing towards average values of 54 ± 3 µmol l-1
of C and 5.6 ± 0.4 µmol l-1
of N at 249
200 m (Fig. 4a & b). DOC concentrations increased southwards while DON decreased, 250
resulting in an increasing average C/N ratio of DOM from 10 to 12 in the surface 50 m 251
(Fig. 4a, b & c). The upwelling of NW Africa was detectable at the southernmost stations 252

12
with more DOC-depleted deep water reaching the surface, while no clear impact was found 253
for DON (Fig. 4a, b & c). The average ± SD C/N molar ratio of the upper 50 m, 11 ± 2, was 254
not significantly different form the C/N molar ratio at 200 m, 10 ± 2. 255
The CDOM absorption and fluorescence indices used in this work varied similarly with 256
position and depth (Fig. 4d-g). Absorption coefficients at 254 nm (aCDOM(254)) and 340 nm 257
(aCDOM(340)) and fluorescence intensities of protein-like (F(280/320)) and marine humic-258
like (F(320/410)) substances were generally higher near the coast than in the open ocean 259
and decreased southwards along 20ºW (Fig. 4d-g). The CDOM absorption and fluorescence 260
levels were also generally higher at the southernmost stations due to the impact of the 261
upwelling system of NW Africa, resulting in more CDOM-rich deep waters reaching the 262
surface (Fig. 4 d-g). 263
Vertical profiles were characterised by a subsurface maximum around the depth of the 264
N maximum and the DCM, being shallower for the shorter, aCDOM(254) and F(280/320), 265
than for the longer wavelength, aCDOM(340) and F(320/410), indices. Whereas aCDOM(254) 266
varied within a relatively narrow range between 0.98 and 1.75 m–1
with a coefficient of 267
variation (C.V.) of 16.1% (Fig. 4d), the variability of aCDOM(340) was much larger: from 268
0.08 to 0.35 m–1
, with a C.V. of 40.3% (Fig. 4e). The protein-like fluorescence 269
(F(280/320)) varied between 0.43 and 1.98 QSU with a C.V. of 37.8% (Fig. 4f). The 270
fluorescence intensity of the humic-like substances F(250/435) varied between 0.32 and 271
1.23 QSU with a C.V. of 32.4% (data not shown), the terrestrial humic-like substances 272
(F(340/440)) between 0.09 and 0.72 QSU with a C.V. of 43.0% (data not shown) and the 273
marine humic-like compounds (F(320/410)) between 0.10 and 0.87 QSU with a C.V. of 274
43.7% (Fig. 4f). The three humic-like fluorophores showed similar spatial patterns 275
13
(F(250/435) vs. F(340/440), R2 = 0.97, n = 62, p < 0.0001; F(250/435) vs. F(320/410), R
2 276
= 0.97, n = 62, p < 0.0001; F(340/440) vs. F(320/410), R2 = 0.98, n = 62, p < 0.0001), 277
suggesting that the processes controlling their fluorescence intensities impact them in 278
similar ways. 279
3.2. Incubation studies conducted in the surface Eastern North Atlantic Ocean 280
The incubation experiments were conducted at twelve stations (framed stn numbers, Fig. 281
1). Chl a concentrations at these sites ranged between 0.11 and 0.19 mg m–3
, initial nutrient 282
concentrations were below the detection limit for NH4+
and ranged from > 0.1 to 0.6 µmol 283
N l–1
for NO3–+ NO2
–,and from 0.01 to 0.06 µmol P l
–1 for HPO4
2– (Table 1). Initial DOC 284
concentrations varied between 71 and 83 µmol C l–1
. After 72h of incubation, the 285
differences between the initial and final DOC values were < 3 µmol C l–1
(data not shown). 286
These changes were not significant considering that the standard error of the determination 287
of DOC was about 1 µmol C l–1
. Initial DON (DON0) concentrations varied between 4.6 288
and 5.4 µmol N l–1
, of which 14 ± 9% (average ± SD) was consumed over the 72 hours of 289
incubation (Table 2). The degradation rate of DON, BDON/∆t, varied between 0.09 ± 0.06 290
and 0.48 ± 0.07 µmol N l–1
d–1
(Table 2). Both the DON0 and BDON showed generally 291
lower concentrations south of the Azores front region (Fig. 4). 292
Initial bacterial production (BP) rates ranged from 31 ± 14 to 130 ± 46 pmol l-1
d–1
, 293
decreasing by 35 ± 25% (average ± SD) after 72 hours, following the decrease in DON 294
(Table 2 and 3). These BP rates cannot be compared to field measurements because they 295
came from a dilution incubation experiment (more DOM available per bacterial cell) where 296
grazers previously had been eliminated. 297

14
CDOM absorption coefficients and the fluorescence intensity of F(250/435) and 298
F(340/440) did not change significantly during the course of the incubations (data not 299
shown). In contrast, F(280/320) showed an average decrease of 0.18 ± 0.10 QSU (average 300
± SD) over the 72 hours incubation period corresponding to 29 ± 9% of the initial 301
fluorescence (Table 2), with a generally lower bioavailability south of the Azores front area 302
(Table 2b; Fig. 4). The consumption of F(280/320) followed a first-order kinetics, with an 303
average consumption constant of 9 ± 2 % d–1
(Fig. 2a) and a net average decay rate of 0.06 304
± 0.03 QSU d–1
(Table 2b). The initial and bioavailable fraction of F(280/320) correlated 305
with each other and both were also significantly correlated with BDON (Eq. 1-2 Table 4; 306
Fig. 5a), while the resistant fraction (RF(280/320)) was significantly correlated with initial 307
aCDOM(254), F(250/435) and F(340/440) (Eq. 3–5 in Table 4). Furthermore, the initial 308
F(280/320) was correlated with BDON/∆t (Eq. 6 in Table 4). 309
In our experiments, the F(320/410) production followed a first order kinetics, with an 310
average ± SD built-up constant of 7 ± 2 % d–1
(Fig. 2b) and a net production rate 311
(PF(320/410)/∆t) of 0.013 ± 0.003 QSU d–1
(Table 2c; Fig. 2b) resulting in an average 312
increase over the incubation period of 0.04 ± 0.01 QSU (Table 2c). The production of 313
F(320/410) reached generally lower levels in the incubations with water collected south of 314
the Azores Front area (Table 2c; Fig.4). 315
The initial F(320/410) was significantly correlated with F(280/320) and aCDOM(254) 316
(Eq. 7–8 in Table 4), while PF(320/410) was significantly correlated with BDON and 317
BF(280/320) (Eq. 9-10 in Table 4; Fig. 5b), and the RF(320/410) was related with 318
RF(280/320), aCDOM(254), F(250/435) and F(340/440) (Eq. 11–14 in Table 4). 319
4. Discussion 320

15
The observed southward increase of salinity and temperature in the upper 200 m has 321
previously been explained by large-scale seasonal heating, evaporation, and advection by 322
the ocean currents crossing the study area (e.g. Pérez et al., 2003; Carracedo et al., 2012). 323
The sharp gradient of the thermohaline properties at about 35◦N indicates the presence of 324
the Azores front (Carracedo et al. 2012; Benavides et al., 2013), defined by Pérez et al. 325
(2003) as the position where the 36.2 isoline (Fig. 3a) and 16.2ºC isotherm (Fig. 3b) 326
intercepts 150 m depth. The Azores front, which separates the temperate from the 327
subtropical ENA, is associated to the Azores current, a branch of the Gulf Stream system 328
that originates from near the Grand Banks and flows south-eastwards. It reaches the study 329
area at between 32º and 35◦N (Fig. 1), where it can be identified by the strong temperature 330
and salinity gradients (e.g. Péliz et al., 2005). Waters below the seasonal thermocline north 331
of the Azores front corresponded to the subtropical branches of Eastern North Atlantic 332
Central water (ENACW) formed south of 40ºN, which is characterised by temperatures 333
between 12.5 and 16ºC and inorganic nutrient concentrations of 1.2 – 11.1 µmol l–1
for 334
NO3– and 0.14 – 0.67 µmol l
–1 for HPO4
2– (Pérez et al., 2003; Ríos et al., 1992; Carracedo 335
et al., 2012; Lønborg and Álvarez-Salgado, 2014). South of the Azores front, the Madeira 336
Mode water (MMW), formed north of the Island of Madeira (Fig. 1), was the dominant 337
water mass below the seasonal thermocline. The MMW is characterised by high salinities 338
of 36.5 – 37.0, temperatures of 18 – 20ºC and NO3 –
and HPO42–
levels below the detection 339
limit (Pérez et al., 2005; Carracedo et al. 2012; Lønborg and Álvarez-Salgado, 2014). 340
The DOC and DON concentrations measured during the cruise are comparable with 341
previous values reported for surface waters of the North Atlantic (Doval et al. 2001; 342
Carlson et al. 2010; Letscher et al., 2013; Álvarez-Salgado et al., 2013). The highest levels 343
of DOC and DON were observed in the surface 20 m decreasing with depth. DOC 344

16
increased while DON decreased southwards, which means that the C/N ratio of DOM is 345
higher in the subptropical (~ 12) than in the subpolar ENA (~ 10), coinciding with the 346
lower Chl a and higher temperatures and salinities in the Azores front (Fig. 3 & 4). This is 347
consistent with the accumulation of N-poor DOM in subtropical gyres previously described 348
by Hansell et al. (2009). An intrusion of DOM-rich surface water with a high C/N molar 349
ratio of ~12 down to 100 m was found between 35◦ and 29
◦N (Fig. 4a, b & c), coinciding 350
with the deepening of the seasonal thermocline (Fig. 3c) characteristic of the subtropical 351
gyre (Doval et al. 2001). 352
The lowest CDOM absorption values were measured south of the Azores front area and 353
in surface waters, while higher values were associated with the DCM. A similar surface 354
distribution and levels has previously been found in both the Atlantic and Pacific Oceans 355
and is linked to the larger impact of CDOM photobleaching in the surface waters and south 356
of the Azores front, and a higher production of CDOM in the DCM area (e.g. Yamashita 357
and Tanoue, 2004; Nelson et al., 2007; Swan et al., 2009). aCDOM(254), a proxy for the 358
abundance of conjugated carbon double bonds (Lakowicz, 2006), showed a lower 359
variability than aCDOM(340) due to photo-bleaching caused by UV-B (280–315 nm) and 360
UV-A (315–400 nm) radiation, suggesting that photo-degradation of aromatic and/or highly 361
complex DOM took place leading to a potential shift of the CDOM absorption towards 362
shorter wavelengths (Blough and Del Vecchio, 2002; Tedetti and Sempéré, 2006; Fichot 363
and Benner, 2011; Helms et al., 2013). In agreement with previous open ocean studies, we 364
also found that the CDOM absorption and DOC concentration did not significantly 365
correlate, suggesting that the processes controlling the distributions of these pools are not 366
directly connected, contrary to coastal waters where a close relationship is typically found 367

17
mainly due to the large input of coloured terrestrial DOM (Swan et al. 2009; Mendoza and 368
Zika 2014). 369
The vertical distribution of FDOM followed the pattern previously reported for open 370
ocean systems. Generally, FDOM was low in surface waters where sunlight penetrates and 371
photolysis of the coloured DOM compounds takes place, and increasing with depth due to 372
the decreasing impact of photodegradation and increasing impact of microbial processes 373
resulting in a subsurface FDOM maxima (Jørgensen et al., 2011; Stedmon and Álvarez-374
Salgado 2011; Kowalczuk et al. 2013). The F(320/410) and F(280/320) levels were 375
generally higher north of the Azores front. These high levels coincided with higher Chl a 376
levels, suggesting a link between F(320/410) and F(280/320) and plankton productivity 377
(Fig. 3d; Fig. 4e & f) as also suggested previously (e.g. Yamashita and Tanoue, 2004; 378
Lønborg and Álvarez-Salgado, 2014). Both the absorption and fluorescence of CDOM 379
showed low levels in the warm waters between 35◦ and 29
◦N. The CDOM levels in this area 380
are comparable with previous measurements in the most oligotrophic areas of the ocean and 381
the pattern found is most likely linked to the low productivity of waters carried by Azores 382
Current and following higher penetration of the ultraviolet irradiation leading to an 383
extensive photobleaching during its transport from the origin area near the Grand Banks 384
area towards our study area (Moran et al., 2000; Yamashita and Tanoue 2009; Jørgensen et 385
al., 2011). 386
Differences in the initial DOC and DON concentration and CDOM absorption and 387
fluorescence levels suggested changes in the initial chemical composition of the DOM used 388
for the incubation experiments (Table 1 and 2). Since DOC concentrations did not change 389
significantly over the 72 hours incubation period, we will not discuss these results in more 390
detail. Concerning DON, the consumption of 14 ± 9% (average ± SD) of the initial 391

18
concentration over the 72 hours of incubation (Table 2) is comparable to estimates 392
previously reported for coastal marine systems (Lønborg and Álvarez-Salgado, 2012). 393
However, Letscher et al. (2013) found that open ocean DON is rather resistant to microbial 394
degradation in surface waters, while it is degraded in the upper mesopelagic zone. The 395
reason for our slightly higher DOM bioavailability in surface waters compared to Letscher 396
et al. (2013), might likely reflect differences in the (1) initial bacterial community 397
composition (Friedline et al., 2012), (2) nutrient conditions (Lønborg and Álvarez-Salgado, 398
2012), (3) variation in DOM chemical composition (Flerus et al., 2012) and/or (4) changes 399
in the impact and magnitude of photochemical processes prior to incubation (Mopper and 400
Kieber, 2002). 401
The fact that the aCDOM(254), F(250/435) and F(340/440) did not change significantly 402
during the course of the incubations, suggests that these components are of a recalcitrant 403
nature (Yamashita et al., 2008). Conversely, the F(280/320) pool has previously been 404
suggested as a suitable indicator for the dynamics of total hydrolyzable amino acids 405
(THAA) and it could potentially be used to trace the dynamics of the labile DOM pool (e.g. 406
Yamashita and Tanoue, 2003). The F(280/320) showed an average decrease of 29 ± 9% 407
(Table 2), which is similar to values (28 ± 7%) recently reported for the coastal upwelling 408
system of the Ría de Vigo (Lønborg et al., 2010). The F(280/320) consumption followed a 409
first order kinetics, at an average decay rate of 9 ± 3 % d–1
(Fig. 2a), which means that 410
these protein-like materials were a limiting factor for bacterial growth and they represented 411
a very labile pool which is used on daily scales (Fig. 2a). This decay rate (9 ± 3 % d–1
) is 412
approximately 1/3 of the rates reported (28 ± 13 % d–1
) by Lønborg et al. (2010) for the Ría 413
de Vigo, but as this study was conducted in an oligotrophic system with a lower biological 414
production than the Ría de Vigo, a slower decay rate is expected. 415
19
The relationship between both the initial and the bioavailable F(280/320) with BDON, 416
suggests that the protein-like fluorescence could be used to trace the bioavailable DOM 417
components in this open ocean system (Eq. 1 in Table 4; Fig. 5a), but it should be kept in 418
mind that these relationships are unique for this study area and cannot be directly applied to 419
other parts of the oceans. On average, we found that the RF(280/320) represented 72 ± 9% 420
of the initial F(280/320). We hypothesise that such a large RF(280/320) fraction could be 421
due to: i) the fluorescence at F(280/320) is due to both labile dissolved free aromatic amino 422
acids and simple peptides as well as amino acid moieties bounded to more complex and 423
recalcitrant structures which are not utilised after 72 h of incubation; and/or ii) co-limitation 424
by inorganic nutrients during the incubation time. In this sense, it should be noted that we 425
have incubated surface ocean waters with average ± SD initial concentrations of inorganic 426
nitrogen and phosphorus of just 0.13 ± 0.17 and 0.03 ± 0.02 µmol l–1
, respectively, without 427
any addition of nutrients or organic matter. 428
The marine humic-like fluorescence has previously been suggested as a suitable tracer 429
for recalcitrant DOM, but it has also been shown to be produced as a result of microbial 430
respiration processes (Yamashita and Tanoue, 2004; Castro et al., 2006; Yamashita and 431
Tanoue, 2008; Jørgensen et al, 2011) or the microbial and/or chemical modification of 432
terrestrial humic materials (Andrew et al., 2013). In our incubation experiments with 433
surface waters from the ENA, F(320/410) production followed a first order kinetics, with 434
an average ± SD increase of 0.04 ± 0.01 QSU produced at a built-up rate of 7 ± 2 % d–1
435
(Table 2; Fig. 2b), which is comparable to previous estimates (Lønborg et al., 2010). The 436
linear relationships between BF(280/320) and BDON with PF(320/410) (Eq. 2 and 9 of 437
Table 4; Fig. 5b) also suggests that the bacterial utilization of labile amino acids and DOM 438
is related to the release of refractory humic substances and/or microbially transformed 439

20
organic matter ending up as recalcitrant DOM, as also suggested by the microbial carbon 440
pump hypothesis (Jiao et al., 2010). The highly significant (p < 0.002) positive linear 441
relationship of aCDOM(254), F(340/440) and F(250/435) with RF(320/410) (Eqs. 12–14 of 442
Table 4) suggests that the conjugated carbon double bonds absorbing at 254 nm and the 443
aromatic humic-like rings excited at 250 and 340 nm are of recalcitrant nature. F(320/410) 444
has previously been shown to be very sensitive to photo-bleaching by natural solar 445
radiation (Nieto-Cid et al. 2006), so it should be kept in mind that the F(320/410) 446
production measured in our dark incubation experiments cannot be directly applied to field 447
conditions. In our experiments, the increase in F(320/410) was not followed by a change in 448
CDOM absorption, suggesting that the humic substances produced by the incubated 449
microbial community were different from those initially present in the sample water. In the 450
water used for the incubation, CDOM could have been produced by viral lysis, 451
phytoplankton release and zooplankton sloppy feeding (Rochelle-Newall and Fisher, 2002; 452
Lønborg et al., 2009; 2013; Romera-Castillo et al., 2010). All these CDOM production 453
pathways were playing no, or only a negligible role in the incubation experiments, leaving 454
microbial transformation as the most likely cause for the observed changes in CDOM. 455
Our field and incubation data allowed us to clearly identify the position of the Azores 456
Front region and couple this to the changes measured in the DON and FDOM pools (Table 457
3; Fig 3a and b). The Azores front region has previously been described as an oligotrophic 458
system with low nutrient and Chl a concentrations, as was also found during the CAIBOX 459
cruise. This study furthermore demonstrates that the levels of BDON, PF(320/410) and 460
BF(280/320) are lower south of the Azores Front region, suggesting that the DOM in these 461
waters are of a more recalcitrant nature then found in more productive areas of the open 462
ocean. 463

21
5. Conclusions 464
In this study we combined field and laboratory studies to 1) demonstrate that the 465
coloured and bioavailable fractions of DOM have low levels in the Azores Front area, 466
which is likely due to the extensive photobleaching and low productivity of these waters; 2) 467
show the first quantitative relationships between CDOM fluorescence and DON 468
bioavailability for open ocean surface waters, suggesting that the protein-like fluorescence 469
can be used to trace the bioavailable fraction of DON; and 3) demonstrate that the humic-470
like fluorophores are produced as a by-product of bacterial metabolism and that they can 471
therefore be used as a proxy for organic matter degradation processes in open ocean 472
systems. 473
Acknowledgement 474
We like to thank the captain and crew of R/V Sarmiento de Gamboa and the technicians of 475
the CSIC Unidad de Tecnologia Marina (UTM) for their help during the CAIBOX cruise. 476
The collaboration of the chief scientist, M. Gilcoto, and the scientific party on board is also 477
acknowledged. V. Vieitez analysed the inorganic nutrient and M.J. Pazó the DOC/TDN 478
samples. This study was funded by the Spanish Ministry of Science and Innovation, grant 479
CTM2007–66408–C02–01/MAR. C.L. was funded by a Postdoctoral fellowship from the 480
Carlsberg Foundation. GJH was supported by an Austrian Science Fund project (P23234-481
B11). 482
References 483
Álvarez-Salgado, X.A., Nieto–Cid, M., Álvarez, M., Pérez, F.F., Morin, P., Mercier, H., 484
2013. New insights on the mineralization of dissolved organic matter in central, 485

22
intermediate and deep water masses of the North–Eastern North Atlantic. Limnol. 486
Oceanogr. 58, 681–696. 487
Andrew, A.A., Del Vecchio, R., Subramaniam, A., Blough, N.V., 2013. Chromophoric 488
dissolved organic matter (CDOM) in the Equatorial Atlantic Ocean: Optical proper-ties 489
and their relation to CDOM structure and source. Mar. Chem. 148: 33-43. 490
Benavides, M., Arístegui J., Agawin, N.S.R., Álvarez-Salgado, X.A., Álvarez, M., 491
Troupin, C., 2013. Low contribution of N2 fixation to new production and excess 492
nitrogen in the subtropical northeast Atlantic margin. Deep-Sea Res. I 81, 36–48 493
Blough, N.V., Del Vecchio, R., 2002. Chromophoric DOM in the coastal environment. In: 494
Hansell, D.A., Carlson, C.A. (Eds.), Biogeochemistry of Marine Dissolved organic 495
matter. Academic Press, San Diego, pp. 509–546. 496
Bronk, D.A., 2002. Dynamics of dissolved organic nitrogen. In: Hansell DA, Carlson CA 497
(Eds.) Biogeochemistry of marine dissolved organic matter. Academic Press, USA, p. 498
153–247. 499
Carlson, C.A., Hansell, D.A., Nelson, N.B., Siegel, D.A., Smethie, W.M., Khatiwala, S., 500
Meyers, M.M., Halewood, E., 2010. Dissolved organic carbon export and subsequent 501
remineralization in the mesopelagic and bathypelagic realms of the North Atlantic basin. 502
Deep-Sea Res. II 57, 1433–1445. 503
Castro, C.G., Nieto-Cid, M., Álvarez-Salgado, X.A., Perez, F.F., 2006. Local 504
remineralization patterns in the mesopelagic zone of the Eastern North Atlantic, off the 505
NW Iberian Peninsula. Deep-Sea Res. I 53, 1925–1940. 506
Coble, P.G., Green, S.A., Blough, N.V., Gasgosian, R.B., 1990. Characterization of 507
dissolved organic matter in the Black Sea by fluorescence spectroscopy. Nature 348, 508
432-435. 509

23
Coble, P.G., 1996. Characterization of marine and terrestrial DOM in seawater using 510
excitation-emission matrix spectroscopy. Mar. Chem. 51, 325–346. 511
Coble, P.G., 2007. Marine optical biogeochemistry: The chemistry of ocean colour. Chem. 512
Rev. 107, 402–418. 513
Doval, M.D., Álvarez–Salgado, X.A., Pérez, F.F., 2001. Organic matter distributions in the 514
Eastern North Atlantic–Azores Front region. J. Mar. Sys. 30, 33–49 515
Fichot, C. G., Benner, R., 2011. A novel method to estimate DOC concentrations from 516
CDOM absorption coefficients in coastal waters, Geophys. Res.Lett. 38, 517
doi:10.1029/2010GL046152. 518
Flerus, R., Lechtenfeld, O.J., Koch, B.P., McCallister, S.L., Schmitt-Kopplin, P., Benner, 519
R., Kaiser, K., Kattner, G., 2012. A molecular perspective on the ageing of marine 520
dissolved organic matter. Biogeosciences 9, 1935-1955. 521
Friedline, C.J., Franklin, R.B., McCallister, S. L., Rivera, M.C., 2012. Bacterial 522
assemblages of the eastern Atlantic Ocean reveal both vertical and latitudinal 523
biogeographic signatures. Biogeosciences 9, 2177–2193. 524
Guillemette, F., del Giorgio, P.A., 2012. Simultaneous consumption and production of 525
fluorescent dissolved organic matter by lake bacterioplankton. Environ. Micro. 14, 526
1432–1443. 527
Hansen, H.P., Koroleff, F., 1999. Automated chemical analysis. In: Grasshoff, K., 528
Kermling, K., Ehrhardt, M. (Eds.), Methods of seawater analysis. Wiley-VCH, 529
Germany, pp. 159–226. 530
Hansell, D.A., Carlson, C.A., Repeta, D.J., Schlitzer, R., 2009. Dissolved organic matter in 531
the ocean: New insights stimulated by a controversy. Oceanography 22, 202–211. 532

24
Hansell, D.A., 2013. Recalcitrant dissolved organic carbon fractions. Annu. Rev. Mar. Sci. 533
5, 421-445. 534
Helms, J.R., Stubbins, A., Perdue, E.M., Green, N.W., Chen, H., Mopper, K., 2013. 535
Photochemical bleaching of oceanic dissolved organic matter and its effect on 536
absorption spectral slope and fluorescence. Mar. Chem. 155, 81–91. 537
Jiao, N., Herndl, G.J., Hansell, D.A., Benner, R., Kattner, G., Wilhelm, S.W., Kirchman, 538
D.L., Weinbauer, M.G., Luo, T., Chen, F., Azam, F., 2010. Microbial production of 539
recalcitrant dissolved organic matter: long-term carbon storage in the global ocean. Nat. 540
Rev. Microbiol. 8, 593–599. 541
Jørgensen, L., Stedmon, C.A., Kragh, T., Markager, S., Middelboe, M., Søndergaard, M., 542
2011. Global trends in the fluorescence characteristics and distribution of marine 543
dissolved organic matter. Mar. Chem. 126, 139–148. 544
Kirchman, D. L., Suzuki, Y., Garside, C., Ducklow H.W., 1991. High turnover rates of 545
dissolved organic carbon during a spring phytoplankton bloom. Nature 352, 612–614. 546
Kowalczuk, P., Tilstone, G.H., Zabłocka, M., Röttgers, R., Thomas, R. , 2013. Composition 547
of dissolved organic matter along an Atlantic Meridional Transect from fluorescence 548
spectroscopy and Parallel Factor Analysis. Mar. Chem. 157, 170-184 549
Lakowic, J.R., 2006. Principles of Fluorescence Spectroscopy. Springer, Baltimore. 550
Letscher, R., Hansell, D.A. Carlson, C.A., Lumpkin, R., Knapp, A.N., 2013. Dissolved 551
organic nitrogen in the global surface ocean: Distribution and fate. Global Biogeochem. 552
Cycles 27, doi:10.1029/2012GB004449 553
Lønborg C., Álvarez-Salgado, X.A., Davidson, K., Miller, A.E.J., 2009. Production of 554
bioavailable and refractory dissolved organic matter by coastal heterotrophic microbial 555
populations. Estuar. Coast. Shelf Sci. 82, 682–688. 556

25
Lønborg, C., Álvarez-Salgado, X.A., Davidson, K., Martínez-García, S., Teira, E., 2010. 557
Assessing the microbial bioavailability and degradation rate constants of dissolved 558
organic matter by fluorescence spectroscopy in the coastal upwelling system of the Ría 559
de Vigo. Mar. Chem.119, 121–129. 560
Lønborg, C., Álvarez-Salgado, X.A., 2012. Recycling versus export of bioavailable 561
dissolved organic matter in the coastal ocean and efficiency of the continental shelf 562
pump. Global Biogeochem. Cycles 26, doi:10.1029/2012GB004353. 563
Lønborg, C., Álvarez-Salgado, X.A., 2014. Tracing dissolved organic matter cycling in the 564
eastern boundary of the temperate North Atlantic using absorption and fluorescence 565
spectroscopy. Deep Sea Res. I 85, 35-46. 566
Lønborg, C., Middelboe, M., Brussaard, C.P.D., 2013. Viral lysis of Micromonas pusilla: 567
impacts on dissolved organic matter production and composition. Biogeochemistry 116, 568
231–240. 569
Mendoza, W.G., Zika, R.G., 2014. On the temporal variation of DOM fluorescence on the 570
southwest Florida continental shelf. Prog. Ocean. 120, 189–204. 571
Millard, R.C., Owens, W.B., Fofonoff, N.P., 1990. On the calculation of the Brunt- Väisälä 572
frequency. Deep Sea Res. 37, 167-181. 573
Moran, M.A., Sheldon, W.M., Zepp, R.G., 2000. Carbon loss and optical property changes 574
during long-term photochemical and biological degradation of estuarine dissolved 575
organic matter. Limnol. Oceanogr. 45, 1254–1264. 576
Nagata, T., 2000. Production mechanisms of dissolved organic carbon. In: Kirchman DL 577
(ed) Microbial ecology of the oceans, vol 1. Wiley-Liss, New York, pp. 121–153 578
Nelson, N.B., Siegel, D.A., 2013. Global distribution and dynamics of chromophoric 579
dissolved organic matter. Annu. Rev. Mar. Sci. 5, 447–476. 580

26
Nieto-Cid, M., Álvarez-Salgado, X.A., Pérez, F.F., 2006. Microbial and photochemical 581
reactivity of fluorescent dissolved organic matter in a coastal upwelling system. Limnol. 582
Oceanogr. 51, 1391–1400. 583
Péliz, A., Dubert, J., Santos, A.M.P., Oliveira, P.B., LeCann, B., 2005. Winter upper ocean 584
circulation in the western Iberian basin, fronts, eddies and poleward flows: An overview. 585
Deep-Sea Res. I 52, 621–646. 586
Pérez, F.F., Gilcoto, M., Ríos, A.F., 2003. Large and mesoscale variability of the water 587
masses and the deep chlorophyll maximum in the Azores Front. J. Geophys. Res.- 588
Oceans 108, 3215–3233. 589
Ríos, A.F., Pérez, F.F., Fraga F., 1992. Water masses in the upper and middle North 590
Atlantic Ocean east of the Azores. Deep-Sea Res. 39, 645-658. 591
Rochelle-Newall, E.J., Fisher, T.R., 2002. Production of chromophoric dissolved organic 592
matter fluorescence in marine and estuarine environment: an investigation into the role 593
of phytoplankton. Mar. Chem. 77, 7–21. 594
Romera-Castillo, C., Sarmento, H., Álvarez-Salgado, X.A., Gasol, J.M., Marrasé, C., 2010. 595
Production of chromophoric dissolved organic matter by marine phytoplankton. Limnol. 596
Oceanogr. 55, 446–454. 597
Schlitzer, R. 2012. Ocean Data View 4, http://odv.awi.de 598
Sokal, F.F., Rohlf, F.J., 1995. Biometry. Freeman, New York. 599
Stedmon, C.A., Álvarez-Salgado, X.A., 2011. Shedding light on a black box: UV visible 600
spectroscopic characterization of marine dissolved organic matter. In: Jiao, N., Azam, 601
F., Sanders, S. (Eds.), Microbial carbon pump in the ocean. Science AAA/S, pp. 62–63. 602
Tedetti, M., Sempéré, R., 2006. Penetration of Ultraviolet Radiation in the Marine 603
Environment. A Review. Photochem. Photobiol. 82, 389–397. 604

27
Yamashita, Y., Tanoue, E., 2003. Chemical characterization of protein-like fluorophores in 605
DOM in relation to aromatic amino acids. Mar. Chem. 82, 255-271. 606
Yamashita, Y., Tanoue, E., 2004. In situ production of chromophoric dissolved organic 607
matter in coastal environments. Geophys. Res. Lett. 31, Doi:10.1029/2004GL019734. 608
Yamashita, Y., Tanoue, E., 2008. Production of bio-refractory fluorescent dissolved 609
organic matter in the ocean interior. Nat. Geosci.1, 579-582. 610
Yamashita, Y, Jaffé, R., Maie, N., Tanoue, E., 2008. Assessing the dynamics of dissolved 611
organic matter (DOM) in coastal environments by excitation emission matrix 612
fluorescence and parallel factor analysis (EEM-PARAFAC). Limnol.Oceanogr.53, 613
1900-1908. 614
Yentsch, C. S., Menzel D. W., 1963. A method for the determination of phytoplankton 615
chlorophyll and phaeophytin by fluorescence, Deep Sea Res. Oceanogr.Abstracts 10, 616
221-231. 617
Yokokawa, T., Sintes, E., De Corte, D., Olbrich, K., Herndl, G.J., 2012. Differentiating 618
leucine incorporation of Archaea and Bacteria throughout the water column of the 619
eastern Atlantic using metabolic inhibitors. Aquat. Microb. Ecol. 66, 247–256.620

28
Figure legends 621
Fig. 1. Map showing the cruise track on board R/V Sarmiento de Gamboa over the period 622
25 July to 14 August 2009. The white dots (○) show the 71 hydrographic stations 623
occupied and the black dots (●) the 16 stations where dissolved organic carbon (DOC) 624
and nitrogen (DON), coloured dissolved organic matter (CDOM) absorption and 625
fluorescence measurements were performed. The framed stations are those where water 626
for the incubation experiments was collected. 627
Fig. 2. Time course of the ratio between the average time point concentration and initial 628
concentration of a) protein-like (F(280/320)) and b) marine humic-like fluorescence 629
(F(320/410)). The dashed lines and error bars represent ± the standard errors. 630
Fig. 3. Contour plots of a) salinity, b) temperature, c) Brunt-Väisälä frequency, d) 631
chlorophyll a (Chl a), e) nitrate (NO3–
) and f) phosphate (HPO42–
) plotted as a function 632
of depth in meters (y-axis) along the distance of the cruise track starting at stn 1 (x-axis). 633
The solid lines represented in the section plots a) and b) show the 36.2 isohaline and the 634
16.2ºC isotherm respectively. Black dots in e) and f) represent sampling points and the 635
vertical dotted lines mark changes of direction of the cruise track. Images created using 636
Ocean Data View (Schlitzer, 2012). 637
Fig. 4. Contour plots of a) dissolved organic carbon (DOC) and b) nitrogen (DON), c) ratio 638
of DOC to DON (DOC/DON), d) coloured dissolved organic matter (CDOM) absorption 639
coefficient at 254 nm (aCDOM(254)), and e) at 340 nm (aCDOM(340)), f) fluorescence of 640
protein-like (F(280/320)) and g) marine humic-like (F(320/410)) substances plotted as a 641
function of depth in meters (y-axis) along the distance of the cruise track starting at stn 1 642

29
(x-axis). Black dots represent sampling points and the dotted lines mark changes of 643
direction of the cruise track. Plotting done with Ocean Data View (Schlitzer, 2012). 644
Fig. 5. Plots of the linear relationship between a) bioavailable protein-like fluorescence 645
(BF(280/320)) and dissolved organic nitrogen (BDON) and b) the produced marine 646
humic-like fluorescence (PF(320/410)) and BDON. Solid lines represent the 647
corresponding regression and the error bars the standard errors. R2 = coefficient of 648
determination, p = level of significance. 649
650

30
651

31
Table 1. Biological, chemical and physical properties of the surface (5 m) water samples used for the incubation studies at the 652
time of collection. Salinity, temperature (Temp.), chlorophyll a (Chl. a), nitrate + nitrite (NO3–+NO2
–) and phosphate (HPO4
2–), 653
CDOM absorption coefficient at 254 (aCDOM(254)) and 340 nm (aCDOM(340)) and the initial fluorescence intensities of the humic-654
like fluorophores (F(250/435)) and (F(340/440). Standard errors are shown for values which were measured in 4 replicates. 655
Salinity Temp. Chl. a NO3-+ NO2
- HPO4
2– aCDOM(254) aCDOM(340) F(250/435) F(340/440)
Date (ºC) (mg m-3
) (µmol l– 1
) (µmol l– 1
) (m-1
) (m-1
) (QSU) (QSU)
26/07/2009 35.7 18.6 0.17 0.6 0.06 1.52 ± 0.04 0.16 ± 0.01 0.83 ± 0.01 0.41 ± 0.01
27/07/2009 35.9 19.7 0.14 0.1 0.02 1.44 ± 0.03 0.12 ± 0.01 0.55 ± 0.03 0.24 ± 0.01
28/07/2009 36.0 19.8 0.14 0.0 0.01 1.42 ± 0.02 0.13 ± 0.01 0.48 ± 0.02 0.18 ± 0.01
29/07/2009 35.9 16.6 0.16 0.1 0.03 1.33 ± 0.01 0.10 ± 0.01 0.45 ± 0.01 0.17 ± 0.03
31/07/2009 35.9 18.9 0.17 0.0 0.03 1.53 ± 0.02 0.15 ± 0.01 0.60 ± 0.03 0.25 ± 0.01
1/08/2009 35.9 19.1 0.19 0.2 0.05 1.51 ± 0.03 0.14 ± 0.01 0.84 ± 0.12 0.37 ± 0.05
3/08/2009 36.3 21.9 0.12 0.1 0.00 1.39 ± 0.02 0.12 ± 0.01 0.43 ± 0.04 0.19 ± 0.01
4/08/2009 36.6 23.2 0.12 0.0 0.02 1.22 ± 0.03 0.06 ± 0.01 0.28 ± 0.03 0.09 ± 0.01
5/08/2009 36.6 23.8 0.11 0.1 0.02 1.26 ± 0.04 0.08 ± 0.01 0.39 ± 0.01 0.13 ± 0.05
7/08/2009 37.0 24.0 0.11 0.1 0.02 1.25 ± 0.03 0.07 ± 0.01 0.39 ± 0.03 0.17 ± 0.01
8/08/2009 37.1 24.0 0.12 0.0 0.03 1.32 ± 0.03 0.09 ± 0.01 0.48 ± 0.02 0.14 ± 0.01
9/08/2009 37.1 23.8 0.12 0.2 0.04 1.36 ± 0.01 0.10 ± 0.01 0.28 ± 0.06 0.09 ± 0.02

32
Table 2. Initial (DON(0), F(280/320)(0)), final (RDON, RF(280/320)) and bioavailable 656
(BDON, BF(280/320)) concentrations and degradation rates (BDON/∆t, BF(280/320)/∆t) of 657
a) dissolved organic nitrogen (DON) and b) protein-like fluorescence (F(280/320)) during 658
the incubation experiments. Table c) shows initial (F(320/410)(0)), final (RF(320/410)) and 659
produced (PF(320/410)) pools of marine humic-like fluorescence (F(320/410)) and the 660
production rate (PF(320/410)/∆t). Values are averages of 4 replicates ± standard error. 661
a) DON (0) RDON BDON BDON/∆t
Exp. (µmol l-1
) (µmol l-1
) (µmol l-1
) (µmol l-1
d–1
)
1 5.2 ± 0.2 4.5 ± 0.1 0.7 ± 0.2 0.22 ± 0.07
2 4.7 ± 0.3 3.5 ± 0.1 1.1 ± 0.3 0.38 ± 0.11
3 4.9 ± 0.3 4.3 ± 0.1 0.5 ± 0.3 0.18 ± 0.10
4 5.1 ± 0.4 4.6 ± 0.2 0.5 ± 0.4 0.16 ± 0.14
5 5.0 ± 0.2 3.6 ± 0.1 1.4 ± 0.2 0.48 ± 0.06
6 5.2 ± 0.2 3.8 ± 0.1 1.4 ± 0.2 0.48 ± 0.07
7 4.9 ± 0.4 4.5 ± 0.1 0.5 ± 0.3 0.16 ± 0.13
8 4.9 ± 0.1 3.9 ± 0.2 1.0 ± 0.2 0.34 ± 0.06
9 5.4 ± 0.2 5.1 ± 0.1 0.3 ± 0.2 0.09 ± 0.06
10 5.4 ± 0.2 5.1 ± 0.1 0.4 ± 0.2 0.12 ± 0.08
11 4.6 ± 0.3 4.3 ± 0.2 0.3 ± 0.3 0.09 ± 0.08
12 5.4 ± 0.2 4.9 ± 0.1 0.5 ± 0.2 0.18 ± 0.06
b) F(280/320)(0) RF(280/320) BF(280/320) BF(280/320)/∆t
Exp. (QSU) (QSU) (QSU) (QSU d–1
)
1 0.65 ± 0.01 0.51 ± 0.05 0.14 ± 0.05 0.048 ± 0.016
2 0.79 ± 0.01 0.50 ± 0.02 0.29 ± 0.02 0.097 ± 0.008
3 0.51 ± 0.01 0.41 ± 0.02 0.10 ± 0.02 0.032 ± 0.008
4 0.59 ± 0.01 0.42 ± 0.01 0.17 ± 0.01 0.056 ± 0.003
5 0.83 ± 0.05 0.49 ± 0.03 0.35 ± 0.05 0.115 ± 0.018
6 0.85 ± 0.01 0.53 ± 0.01 0.33 ± 0.02 0.109 ± 0.006
7 0.48 ± 0.01 0.37 ± 0.01 0.10 ± 0.01 0.034 ± 0.003
8 0.57 ± 0.01 0.35 ± 0.02 0.22 ± 0.02 0.073 ± 0.006
9 0.43 ± 0.01 0.33 ± 0.01 0.09 ± 0.01 0.031 ± 0.002
10 0.43 ± 0.02 0.36 ± 0.01 0.07 ± 0.02 0.023 ± 0.006
11 0.40 ± 0.01 0.31 ± 0.01 0.09 ± 0.01 0.031 ± 0.005

33
12 0.53 ± 0.01 0.35 ± 0.01 0.18 ± 0.01 0.060 ± 0.004
c) F(320/410)(0) RF(320/410) PF(320/410) PF(320/410)/∆t
Exp. (QSU) (QSU) (QSU) (QSU d–1
)
1 0.43 ± 0.01 0.47 ± 0.01 0.04 ± 0.01 0.013 ± 0.001
2 0.31 ± 0.01 0.36 ± 0.01 0.05 ± 0.01 0.018 ± 0.003
3 0.23 ± 0.01 0.27 ± 0.01 0.04 ± 0.01 0.013 ± 0.004
4 0.24 ± 0.01 0.28 ± 0.01 0.05 ± 0.01 0.015 ± 0.005
5 0.34 ± 0.01 0.40 ± 0.01 0.06 ± 0.01 0.020± 0.002
6 0.33 ± 0.01 0.37 ± 0.01 0.05 ± 0.01 0.015 ± 0.002
7 0.16 ± 0.01 0.20 ± 0.01 0.04 ± 0.01 0.014 ± 0.002
8 0.12 ± 0.01 0.16 ± 0.01 0.03 ± 0.01 0.011 ± 0.004
9 0.12 ± 0.01 0.14 ± 0.01 0.03 ± 0.01 0.009 ± 0.001
10 0.13 ± 0.01 0.16 ± 0.01 0.03 ± 0.01 0.011 ± 0.002
11 0.12 ± 0.01 0.15 ± 0.01 0.03 ± 0.01 0.011 ± 0.002
12 0.11 ± 0.01 0.14 ± 0.01 0.03 ± 0.01 0.010 ± 0.002
662
663

34
Table 3. Leucine incorporation rates of the bacterial community at times 0 (BP (0)) and 72 664
hours (BP (72)) of incubation. Values are averages of 2 replicates ± standard error, n.d. = 665
not determined. 666
BP (0) BP (72)
Exp. (pmol l–1
d–1
) (pmol l–1
d–1
)
1 89 ± 16 66 ± 6
2 73 ± 6 58 ± 27
3 69 ± 14 56 ± 3
4 130 ± 36 69 ± 1
5 101 ± 4 n.d.
6 114 ± 41 50 ± 16
7 83 ± 2 19 ± 1
8 83 ± 6 26 ± 3
9 96 ± 1 75 ± 7
10 31 ± 14 35 ± 1
11 47 ± 26 40 ± 1
12 75 ± 2 69 ± 2
667
668

35
Table 4. Significant linear regressions between bioavailable dissolved organic nitrogen 669
(BDON), absorption coefficient of CDOM at 254 nm (aCDOM(254)), initial (F(280/320)(0), 670
F(320/410)(0), F(250/435)(0) and F(340/440) (0)), bioavailable (BF(280/320)), produced 671
(PF(320/410)) and recalcitrant (RF(280/320) and RF(320/410)) protein- and humic-like 672
fluorescence, bioavailable protein-like (BF(280/320) and produced humic-like fluorescence 673
(PF(320/410)), and the degradation rate of BDON (BDON/∆t). Slope, intercept, and 674
standard error (SE) are values found by Model II regression. R2 = coefficient of 675
determination, p = level of significance, n.s. - not significant. 676
Eq No. X Y Slope (±SE) Intercept (±SE) R2 p
1 F(280/320)(0) BDON 2.6 ± 0.3 –0.84 ± 0.18 0.90 <0.0001
2 BF(280/320) BDON 4.1 ± 0.4 n.s. 0.91 <0.0001
3 RF(280/320) aCDOM(254) 1.4 ± 0.3 0.78 ± 0.10 0.72 <0.0002
4 RF(280/320) F(250/435)(0) 1.2 ± 0.5 n.s. 0.70 < 0.001
5 RF(280/320) F(340/440)(0) 1.4 ± 0.3 –0.37 ± 0.09 0.74 < 0.001
6 F(280/320)(0) BDON/∆t 0.41 ± 0.17 n.s. 0.62 <0.003
7 F(320/410)(0) F(280/320)(0) 1.75± 0.4 0.27 ± 0.01 0.63 <0.003
8 F(320/410)(0) aCDOM(254) 0.98 ± 0.17 1.15 ± 0.04 0.76 <0.002
9 PF(320/410) BDON 45 ± 14 - 1.1 ± 0.4 0.52 <0.008
10 PF(320/410) BF(280/320) 4.4 ± 2.5 n.s. 0.62 <0.003
11 RF(320/410) RF(280/320) 0.65 ± 0.06 0.38 ± 0.02 0.91 <0.0001
12 RF(320/410) aCDOM(254) 0.92 ± 0.16 1.36 ± 0.04 0.77 <0.002
13 RF(320/410) F(250/435)(0) 1.6 ± 0.3 0.41 ± 0.07 0.76 <0.0003
14 RF(320/410) F(340/440)(0) 0.87 ± 0.14 0.15 ± 0.04 0.79 <0.0001
677
678

36
-20 -15 -10
longitude (E)
-20 -15 -10
30
35
40
lati
tude
(N)
30
35
40
Iber
ian
Pen
insu
laCanary Islands
Afr
ica
Madeira
41015202326
30
34
40
37
43
47
49 5256
6065
Gulf ofCadiz
679
Lønborg et al., Fig. 1 680
681

37
0 20 40 60 80
F(2
80/3
20)/
F(2
80/3
20)
(0)
0.5
0.6
0.7
0.8
0.9
1.0
1.1
a)
incunbation time (hours)
0 20 40 60 80
F(3
20/4
10)/
F(3
20/4
10)
(0)
0.9
1.0
1.1
1.2
1.3
b)
R2 = 0.98, k = 0.09 ± 0.03 d
-1
R2 = 0.97, k = 0.07 ± 0.02 d
-1
682
Lønborg et al., Fig. 2 683
38
684
Lønborg et al., Fig. 3 685

39
686
Lønborg et al., Fig. 4. 687

40
BF(280/320) (QSU)
0.0 0.1 0.2 0.3 0.4 0.5
BD
ON
(µ
mol
L-1
)
0.0
0.3
0.6
0.9
1.2
1.5
1.8
Y = 4.1(±0.4)·X
R2
= 0.91 , p< 0.0001
a)
PF(320/410) (QSU)
0.02 0.04 0.06 0.08
BD
ON
(µ
mol
L-1
)
0.0
0.3
0.6
0.9
1.2
1.5
1.8
Y = -1.1 (±0.4)+45 (±14)·X
R2
= 0.52 , p< 0.008
b)
688
Lønborg et al., Fig. 5. 689


![Apropiación y uso del alfabeto español [Versión postprint]1](https://static.fdocuments.us/doc/165x107/5871f5671a28abf9608bafde/apropiacion-y-uso-del-alfabeto-espanol-version-postprint1.jpg)