THIS DOCUMENT HAS BEEN REPRODUCED FROM · PDF fileDescription of the Multiband Radiometer ......
140
N O T I C E THIS DOCUMENT HAS BEEN REPRODUCED FROM MICROFICHE. ALTHOUGH IT IS RECOGNIZED THAT CERTAIN PORTIONS ARE ILLEGIBLE, IT IS BEING RELEASED IN THE INTEREST OF MAKING AVAILABLE AS MUCH INFORMATION AS POSSIBLE https://ntrs.nasa.gov/search.jsp?R=19800015249 2018-05-11T11:21:18+00:00Z
Transcript of THIS DOCUMENT HAS BEEN REPRODUCED FROM · PDF fileDescription of the Multiband Radiometer ......

N O T I C E
THIS DOCUMENT HAS BEEN REPRODUCED FROM MICROFICHE. ALTHOUGH IT IS RECOGNIZED THAT
CERTAIN PORTIONS ARE ILLEGIBLE, IT IS BEING RELEASED IN THE INTEREST OF MAKING AVAILABLE AS MUCH
INFORMATION AS POSSIBLE
https://ntrs.nasa.gov/search.jsp?R=19800015249 2018-05-11T11:21:18+00:00Z

AgRISTARSg, 0-10.113
SR-P9 - 00410NAS 9 -15466
NASA CR-
's ^q b1e undo 1,gS4
of early a SDoneorsmf,an Of Earth R
+ "'far; eSUurces survev
Supporting Research
A Joint Program forAgriculture andResources InventorySurveys ThroughAerospaceRemote Sensing
Nlovember 1979
Final Report
'VIOLAgricultural Scene Understandingand Supporting Field Researchby M. E. Bauer, L. L. Biehl, C. S.T Daughtry; B. F. Robinson andE. R Stoner
(E80-10113) AGRICULTURAL SCENE N80-23740UNDERSTANDING AND SIIPECRTIbG FIELD ItESEARCH,VOLUME 1 Final Report, 1 Dec. 1978 - 30Nov. 1979 (Purdue U[ ► iv.) 140 r UnciasHC A07/"'F A01 CSCL 02C G3/43 00113
Laboratory for Applications of Remote SensingPurdue UniversityWest Lafayette, Indiana 47907
atV f V T Or CO^y
V41, '9V
C
s osrAt OF '+ QIS
-^' 0
P- 3 , 1
NASA

SR-P9-00410NAS9-15466LARS 112879
FINAL REPORT
VOL. I AGRICULTURAL SCENE UNDERSTANDING AND
SUPPORTING FIELD RESEARCH
BY
M.E. Bauer, L.L. Biehl, C.S.T. Daughtry, B.F. Robinson, E.R. Stoner
The research reported here was initiated during the planning phases ofthe AgRISTARS Supporting Research Project and, although it stands onits own merit, it benefits the Supporting Research Project and becamea part of those plans.
Purdue UniversityLaboratory for Applications of Remote Sensing
West Lafayette, Indiana 47906
November 1379

TABLE OF CONTENTS
Page
List of Tables . . . . . . . . . . . . . . . . . . . . . . . . . . . . . i
List of Figures . . . . . . . . . . . . . . . . . . . . . . . . . . . . ii
A. Field Re- :^. -rch Experiment Design and Data Analysis . . . . . . . . . 1
1. Fie.'' Research Experiment Design . . . . . . . . . . . . . . . . 5
2. Data Analysis . . . . . . . . . . . . . . . . . . . . . . . . . 12
B. Field Research Data Acquisition and Preprocessing. . . . . . . . . . 24
1. Purdue Agronomy Farm Experiments . . . . . . . . . . . . . . . . 24
2. Data Acquisitiom and Preprocessing for Other Test Sites. . . . . 43
C. Development of Multiband Radiometer System . . . . . . . . . . . . . 47
1. Introduction . . . . . . . . . . . . . . . . . . . . . . . . . 47
2. Description of the Multiband Radiometer . . . . . . . . . . . . . 48
3. Description of Data Recording Module . . . . . . . . . . . . . . 53
4. Construction of Truck-Mounted Boom . . . . . . . . . . . . . . . 56
5. System and Users Manuals . . . . . . . . . . . . . . . . . . . . 59
6. Development of Data Handling Software . . . . . . . . . . . . . . 59
7. Interface Hardware and Software . . . . . . . . . . . . . . . . . 65
D. Establishment of Soils Data Base . . . . . . . . . . . . . . . . . . 66
1. Introduction . . . . . . . . . . . . . . . . . . . . . . . . . . 66
2. Study Objectives . . . . . . . . . . . . . . . . . . . . . . . . 67
3. Experimental Approach . . . . . . . . . . . . . . . . . . . . . . 68
4. Soil Properties Data Base . . . . . . . . . . . . . . . . . . . . 70
5. Numerical Analysis . . . . . . . . . . . . . . . . . . . . . . . 84
6. References . . . . . . . . . . . . . . . . . . . . . . . . . . . 91
E. Field Research Data Base Management and Software Development . . . . 93
1. Field Research Data Library and Distribution . . . . . . . . . . 94
2. Data Analysis Software Development and Documentation . . . . . .103
3. Data Processing Software Development . . . . . . . . . . . . . . 105
F. Evaluation of Calibration ProceduresReflectance Factor in Remote Sensing
1. Introduction . . . . . . . . . .
2. Bidirectional Reflectance Factor
3. Discussion of the approach . .
4. Field Procedures . . . . . . . .
for Measurement of BidirectionalField Research. . . . . . . . .109
. . . . . . . . . . . . . . . .109
(BRF) . . . . . . . . . . . . .109
. . . . . . . . . . . . . . .Ill
. . . . . . . . . . . . . . . .112

Table of Contents Cont'd
Page
5. Reference Surfaces . . . . . . . . . . . . . . . . . . . . . . . .112
6. Effects of Non-Directional Illumination . . . . . . . . . . . . . .115
7. Comparison of Spectral Bidirectional Reflectance FactorMeasurements made by Three Spectrometer Systems. . . . . . . . . .125
8. Conclusions . . . . . . . . . . . . . . . . . . . . . . . . . . . .130
9. References . . . . . . . . . . . . . . . . . . . . . . . . . . . .130

LIST OF TABLES
Page
A-1. Outline of Supporting Field Research project plan . . . . . . . . 7
B-1. Summary of the 1979 Supporting Field Research Experimentsat the Purdue Agronomy Farm .. . . . . . . . . . . . . . . . . . . 26
B-2. Summary of spectral measurements Collected at the PurdueAgronomy Farm for the 1979 field research experiments . . . . . . 38
B-3. Summary of agronomic measurements . collected at the PurdueAgronomy Farm for the 1979 field research experiments . . . . . . 40
B-4. Summary of 1979 data acquisition by the Exotech 20C spectro-radiometer system at the Purdue Agronomy Farm . . . . . . . . . . 41
B-5. Summary of 1979 data acquisition by the Exotech 100 fieldradiometer system at the Purdue Agronomy Farm . . . . . . . . . . 42
B-6. Summary of 1979 crop year data acquisition by the NASA/JSChelicopter-mounted field spectrometer system (FSS) 45
B-7. Summary of 1979 crop year data acquisition by the NASA/JSCaircraft multispectral scanners . . . . . . . . . . . . . . . . . 46
C-1. Spectral band specification . . . . . . . . . . . . . . . . . . . 49
D-1. Soil spectral bands for correlation analysis . . . . . . . . . . 84
D-2. Simple correlation coefficients between five soil parametersand reflectance in individual bands for all soils and for soilsgrouped by moisture zone and by temperature regime . . . . . . . 85
D-3. Simple correlation coefficients between five soil parametersand reflectance in individual bands by climatic zone . . . . . . 86
D-4. Physicochemical and site characteristics as predictors ofreflectance in individual spectral bands . . . . . . . . . . . . 88
D-5. Soil reflectances in individual bands as predictors ofsoil parameters within certain climatic zones . . . . . . . . . . 89
E-1. Summary of field research test site locations and major crops 96
E-2. Summary of field research controlled experimental plot testsites and commerical field test sites . . . . . . . . . . . . . . 97
E-3. Summary of major sensor systems used for field research . . . . . 98
E-4. Summary and status of spectral data in the field researchdata library by instrument and data type . . . . . . . . . . . . 99
E-5. Summary of recipients of field research data . . . . . . . . . . 101
F-1. Determination of the variation (K1K2) of the measuredbidirectional reflectance factor from the true bidirectionalreflectance factor . . . . . . . . . . . . . . . . . . . . . . . 123
i

., ii-
LIST OF FIGURES
A-1. The role of field research in the development and
application of remote sensing technology . . . . . . . . . . . . . . 4
A-2. Schematic illustration of multistage approach tomulticrop field research data acquisition. . . . . . . . . . . . . 10
A-3. Locations of 1979 Supporting Field Research test sites . . . . . . 11
A-4. Relationship of red and near infrared reflectance of threesoybean cultivars canopy reflectance as a function ofmeasurement date . . . . . . . . . . . . . . . . . . . . . . . . . . 14
A-5. Effect of row width on soybean canopy reflectance as afunction of measurement date . . . . . . . . . . . . . . . . . . . . 15
A-b. Correlation of red and near infrared reflectance withpercent soil cover of soybean canopies . . . . . . . . . . . . . . . 16
A-7. Comparison of actual measurements of percent soil coverof soybean canopies with that predicted from reflectancemeasurements . . . . . . . . . . . . . . . . . . . . . . . . . . . . 17
A-8. Effect of nitrogen fertilization level on the spectralreflectance of corn canopies . . . . . . . . . . . . . . . . . . . . 20
A-9. Effect of nitrogen fertilization on percent soil cover, leafarea index, fresh biomass and plant nitrogen content of corncanopies as a function of measurement date . . . . . . . . . . . . . 21
A-10. Effect of nitrogen fertilization on the red and nearinfrared reflectance of corn canopies as a function ofmeasurement date . . . . . . . . . . . . . . . . . . . . . . . . . . 22
A-11. Relationship of plant nitrogen and leaf area index toreflectance of corn canopies . . . . . . . . . . . . . . . . . . . . 23
B-1. Design and treatment descriptions of the 1979 PurdueAgronomy Farm corn cultural practices experiment. . . . . . . . . . 28
B-2. Design and treatment descriptions of the 1979 PurdueAgronomy Farm soybean cultural practices experiment . . . . . . . . 29
B-3. Design and treatment descriptions of the 1979 PurdueAgronomy Farm corn nitrogen fe Mization experiment. . . . . . . . 32
B-4. Design and treatment descriptions of the 1979 PurdueAgronomy Farm corn disease experiment . . . . . . . . . . . . . . . 33
B-5. Design and treatment descriptions of the 1979 Purdue AgronomyFarm Winter Wheat nitrogen fertilization and diseaseexperiment. . . . . . . . . . . . . . . . . . . . . . . . . . . . . . 35
Page

Figures cont'd
C-1. Sketch of Multiband Radiometer . . . . . . . . . . . . . . . . 48
C-2. Spectral distribution of passbands superimposed on atypical vegetation spectrum . . . . . . . . . . . . . . . . . . . . 49
C-3. Optical/electronic module of multiband radiometer . . . . . . . . 50
C-4. Chopping arrangement for the multiband radiometer. . . . . . . . . 51
C-5. Sketch of front panel of data recording module . . . . . . . . . . 55
C-6. Positioning of the pick-up truck-mounted boom . . . . . . . . . . 57
C-7. Sketch of pick-up truck-mounted boom . . . . . . . . . . . . . . . 58
C-8. Multiband radiometer data sheet . . . . . . . . . . . . . . . . . . 61
C-9. Multiband radiometer data calibration sheet . . . . . . . . . . . 62
C-10. Multiband radiometer data record sheet . . . . . . . . . . . . . . 63
C-11. Table of contents for multiband radiometer reformattingsoftware manual . . . . . . . . . . . . . . . . . . . . . . . . . . 64
D-l. Climatic zones in the continental United States asidentified by soil temperature regime (Soil Survey Staff,1975; FAO-UNESCO, 1975) and the Thornthwaite (1948) moistureindex . . . . . . . . . . . . . . . . . . . . . . . . . . . . . . . 69
D-2. Spectral curves representing the standard deviations fromthe average reflectance values for twenty check samples ofa silt loam Alfisol measured over ten different laboratorysetups . . . . . . . . . . . . . . . . . . . . . . . . . . . . . . 71
D-3. Numbered guide corresponding to narrative key to soilinformation . . . . . . . . . . . . . . . . . . . . . . . . . . . . 73
D-4. Reflectance curves, soil test results, and sitecharacteristics in the soil data base . . . . . . . . . . . . . . . 74
E-1. Organization of field research data library. LARSPECand LARSYS are Purdue/LARS software systems to analyzespectrometer/radiometer and multispectral scanner data . . . . . . 95
E-2. Table of contents of LARSPEC User's Manual . . . . . . . . . . . .106
E-3. Example of 3-dimensional line type plot using 3-D GraphicsCompatibility System Software. This plot is a temporal(growth stage) plot of three Thematic Mapper bands for corn. . . .107
iii
Page

IV
Figures cont'd Page
E-4. Example of 3-dimensional surface type plot using 3-DGraphics Compatibility System Software. This plot representsthe joint density function for two channels and six classesin a LARSYS statistics deck for Skylab data . . . . . . . . . . . .108
F-1. Truck-mounted multiband radiometer viewing a soybean canopy . . . .113
F-2. Multiband radiometer positioned over painted barium sulfatereflectance panel for field reflectance calibration . . . . . . . .113
F-3. Spectral bidirectional reflectance factor of threereference surfaces used for f!ald research. . . . . . . . . . . . .114
F-4. Bidirectional reflectance factor at 0.6 um, for severalincident angles, A, and reference surfaces. Polar coordinates. . .114
F-5. Spectral bidirectional reflectance factor of painted bariumsull:ate for several incident angles (view angle is normaA . . . . .116
F-6. Spectral bidirectional reflectance factor of a canvas panelfor several incident angles (view angle is normal). . . . . . . . .116
F-7. Bidirectional reflectance factor calibration transfer ofreference surfaces used for agricultural field research . . . . . .117
F-8. Comparison of the functions f and p t as a function ofillumination angle, 6 . . . . t . . .n. . . . . . . . . . . . . . . .121
F-9. Polar plot of comparison of relative response of a normalviewing instrument to a scene characterized by f and aLambertian scene are a function of illumination afigle,e. . . . . . .121
F-10. Plot of the fractional difference between f t and p t, K1 , as afunction of illumination angle, 8. . . . . . . .n. . . . . . . . .123
•-•11. Purdue/LARS Exotech 20C (left) and NASA/JSC FSAS (right)spectrometer systems viewing canvas panel . . . . . . . . . . . . .127
F-12. NASA/JSC field spectrometer system (FSS) viewing canvasreference panel . . . . . . . . . . . . . . . . . . . . . . . . . .127
F-13. Comparison of reflectance measurements of canvas panels bythree field spectrometer systems . . . . . . . . . . . . . . . . . .128
F-14. Pariwise comparison of reflectance measurements of canvaspanels by three field spectrometer systems at threewavelengths . . . . . . . . . . . . . . . . . . . . . . . . . . . .129

A. FIELD RESEARCH EXPERIMENT DESIGN AND DATA ANALYSIS*
Marvin E. Bauer
Major advancements have been made in recent years in the capability
to acquire, process, and interpret remotely sensed multispectral measure-
ments of the energy reflected and emitted from crops, soils, and other
earth surface features. As a result of experiments such as the Large
Area Crop Inventory Experiment (LACIE), the technology is moving rapidly
toward operational applications (1). There is, however, a continuing
need for morequantitative knowledge of the multispectral characteristics
of crops and soils if further advancements in technology development and
application are to be made.
Understanding of the relationships between the spectral characteris-
tics and important biological-physical parameters of earth surface fea-
tures can best be obtained by carefully controlled studies over fields
and plots where complete data describing the condition of targets are
attainable and where frequent, timely spectral measurements can be ob-
tained. It is these attributes which distinguish field research from
other remote sensing research activities.
In 1975, field research activities in support of LACIE were ini-
tiated (2). Spectral, agronomic, and meteorological measurements were
made at LACIE test sites in Kansas, South Dakota and North Dakota for
three years. The remote sensing measurements include data acquired by
truck-mounted spectrometers, a helicopter-borne spectrometer, airborne
multispectral scanners, and the Landsat multispectral scanners (MSS).
These data were supplemented by an extensive set of agronomic and mete-
orological data acquired during each mission.
*The contributions of Larry Biehl, Craig Daughtry, Marilyn Hixson, JeffKollenkark, Barrett Robinson, Vern Vanderbilt and Greg Walburg to TaskIA, Experiment Design and Data Analysia, are gratefully acknowledged.

-2-
The LACIE field Measurements data form one of the most complete and
best documented data sets acquired for agricultural remote sensing re-
search. Thus, they are well-suited to serve as a data base for research
to: (1) quantitatively determine the relationship of spectral to agro-
nomic characteristics of crops, (2) define future sensor systems, and (3)
develop advanced data analysis techniques. The data base, which has be-
come an integral part of the Supporting Research and Technology (SR&T)
data base, is unique in the comprehensiveness of sensors and missions
over the same sites throughout several growing seasons and in the cali-
bration of all multi.spectral data to a common standard.
Analyses of the field data have provided insight into the spectral
properties and spectral identification and assessment of crops. The
analyses have included investigations of the spectral separability of
barley and spring wheat; determination of the effects of cultural and
environmental factors on the spectral reflectance of wheat; development
of predictive relationships between spectral and agronomic variables re-
lated to wheat growth and yield; and comparisons of Landsat MSS and
thematic mapper spectral bands for crop identification and assessment.
As we look ahead to building as part of the AgRISTARS program (3) a
capability for new and improved agricultural applications utilizing remote
sensing techniques, it is important to begin to conduct the field research
required to understand as quantitatively as possible the spectral charac-
teristics of crops other than wheat, such as corn, soybeans, rice, sor-
ghum, barley, sunflowers and cotton. It is with this background that a
supporting field research element has been included in the AgRiS AUS
Supporting Research Project.
The objective of this task has been to: (1) design a multiyear
technical program of Supporting Field Research which will result in
broadly applicable quantitative and predictive relations between crop
reflectance and emittance spectra and crop attributes of interest and
(2) perform initial dF:a analyses to support objective 1. An overview
of the experimental approach for supporting field research is shown in
Figure A-1.

-3-
The remainder of this chapter summarises the Supporting Field Re-
search project plan deeveloped during 1979 and describes the initial re-
sults of two analyses of the reflectance properties of corn and soyb&ans.
Several additional aspects of the field research project are described in
other sections of this report.
References
1. MacDonald, R.B., and F.G. Hall. 1978. LACIE: An Experiment inGlobal Crop Forecasting. Proc. Plenary Session, LACIE Symp., Houston,Texas, October 23-26, pp. 17-48.
2. . 1979. AgRISTARS: A Joint Program for Agriculture andResources through Aerospace Remote Sensing.
3. Bauer, M.E., M.C. McEwren, W.A. Malila, and J.C. Harlan. 1978. De-sign, Implementation, and Results of I.ACIE Field Research. Proc.LACIE Symp., Houston, Texas, October 23-26, pp. 1037-1066.

4 d
RESEARCH PLOTS
CONTROLLED EXPERIMENTS
DATA ANALYSISANALYSIS PRODUCTS
w ^ CLASSIF!-
LL .^ I CATIONUj
WAVELENGTH
U YIELDJ
w ESTIMATION
LAI
z
W y 4 °^ ^^ CROP
UjCC
U.1 CALENDAR
D
c9 o S
cr
^. BRIGHTNESS
Ur VSOIL
© v W MOISTURE
V) u % MOISTURE
w SENSOR
W DESIGNcc
WAVELENGTHAPLE SEGMENTS
NATURAL VARIATION
TECHNICAL EXPERIMENTISSUES DESIGN
CLASSIFICATION DESIRED ANALYSISYIELD ESTIMATION PRODUCTS
CROP CALENDARS 1
SOIL MOISTURE APPROACH
SENSOR DESIGN rDATA
REQUIREMENTS
DATAACQUISITION
-4-
Figure A-1. The role of field research in the development and applica-tion of rzmote sensing technology.

-5-
1. Field Research Experim±nt Design
In this section the objectives and experimental approach for Sup-
porting Field Research are described. An outline of the proj -ct plan
developed in 1979 is presented in Table A-1 as a summary of the plan;
the length of the plan (75 pages) does not permit its inclusion in this
report.
1.1 Objectives
The overall objectives of the multicrop supporting field research
are to design, acquire and make available well-documented spectral data
sets with detailed agronomic and physical observations. The 4ata will be
used for analysis and modeling to obtain a quantitative understanding of
the radiation characteristics of crops and their soil backgrounds and to
assess the capability of current, planned and future satellite systems to
capture available useful spectral information. Specific research objec-
tives for which research was initiated in 1979 are:
- Determine the relationship of crop growth and development stagesto the reflectance and radiant temperature characteristics ofcorn and soybeans.
- Evaluate the potential for estimating from spectral measurementsimportant agronomic attributes of crop canopies such as leaf areaindex, biomass and percent scil cover which may be related tograin yield.
- Determine the effects of stressed, normal, and above averagegrowing conditions on the radiation patterns and spectral identi-fication of corn, soybeans, and small grains. Stresses of partic-ular interest are moisture deficits, nutrient deficiencies anddiseases.
- Identify and quantify the agronomic, environmental and measurementconditions which are the dominant factors determining observedspectral characteristics.
- Determine the effects of soil background conditions such as color,texture, roughness and moisture on the spectral response of cropcanopies.

-6-
- Compare and evaluate the capability of present, planned andpossible future sensors to capture available spectrally derivedinformation describing crops and soils.
1.2 Experimental Approach
During 1979, experiments emphasizing corn and soybeans, together
with wheat and other small grains will be conducted. Although it would
be highly desirable to i^itiate work on other crops such as rice, sorghum,
and cotton, resources L,, do so are not available in 1979.
An overview of the experimental approach is shown in Figure A-1. At
the beginning of the project the technical issues and specific objectives
to be addressed with field research data were defined. This led to the
definition of the experimental design for data acquisition and processing
and the initial definition of data analysis plans and products.
A multistage approach to data acquisition with areal, vertical, and
temporal staging is used (Figure A-2). Areal sampling is accomplished
with test cites in different parts of the Great Plains and Corn Belt.
Vertical staging, or collection of data by different sensor systems at
different altitudes, ranges from mobile towers to Landsat. Temporally,
data is collecteu at seven to 21-day intervals to sample important crop
growth stages, and during several years to obtain a measure of the year-
to-year variations in growing conditions and their influence on spectral
response.
The test locations are two-five by six mile segments in Hand County,
South Dakota, and Webster County, Iowa, and two agricultural experiment
stations the Purdue University Agronomy Farm at West Lafayette, Indiana,
and the University of Nebraska, Sandhills Agricultural Laboratory near
North Platte, Nebraska (Figure A-3). Winter wheat and spring wheat are
both major crops in Hand County, while the other sites were selected for
study of corn and soybeans.

-1-
Table A-1. Outline of Supporting Field Research project plan.
I. Introduction
II. Objectives and Summary of'Experimental Approach
III. Test Site DescriptionsA. Webster County, IowaB. Hand County, South Dakota
IV. Descriptions of Controlled ExperimentsA. Purdue Agronomy FarmB. Sandhills Experiment Station
V. Description of Data Analysis and ModelingA. Crop Growth and Development Stage DeterminationB. Estimation of Canopy VariablesC. Effects of StressD. Effects of Agronomic. Environmental and Measurement ConditionsE. Effects of Soil Background Conditions'F. Comparison of Sensor Capabilities
VI. Data AcquisitionA. Field Research Test SitesB. Purdue Agronomy FarmC. Sandhills Experiment Station
VII. Sensor DescriptionsA. Landsat Multispectral ScannerB. Airborne Multispectral ScannersC. Helicopter-borne Field Spectrometer SystemD. Truck-mounted Field Spectrometer Systems
VIII. Sensor Calibration and Correlation ProceduresA. Calibration of Truck-mounted Spectrometer SystemsB. Calibration of Helicopter-borne Field Spectrometer SystemC. Calibration of Airborne Multispectral Scanner DataD. Sensor Correlation Procedures
IX. Data ProcessingA. Ixandsat Multispectral Scanner DataB. Aircraft Multispectral Scanner DataC. Field Spectrometer System (FSS) DataD. Exotech Model 20C Spectroradiometer Data
X. Data Evaluation and VerificationA. Landsat MSS DataB. Aircraft Multispectral Scanner and Photographic DataC. Helicopter and Truck-mounted Spectrometer Data
XI. Data Library and Data Distribution
XII. Schedules
XIII. Project Organization and Management
XIV. References

-8-
The primary sensors for data collection are truck-mounted radiometer
and spectrometer, a helicopter-borne spectrometer, and aircraft multi-
spectral scanner, and the Landsat-2 and -3 multispectral scanners. Each
sensor system has unique capabilities for acquiring spectral data. The
spectrometer systems produce the highest quality reflectance measurements,
but provide only limited measurements of spatial variability. On the
other hand, an aircraft scanner provides spatial sampling of the scene
and can obtain data at multiple altitudes, but its spectral coverage,
while broader than Landsat MSS, is limited to a fixed set of wavelength
bands. The helicopter and aircraft data acquisition systems have the ad-
vantage of flexible scheduling and, therefore, provide greater opportunity
to obtain cloud-free data at critical crop growth stages than the Landsat
system provides. Landsat provides wide-area coverage, but is limited in
its spatial resolution and the placement and number of spectral bands.
The staging of data acquisition is summarized in Figure A-2. Heli-
copter-spectrometer and aircraft-scanner data is collected over commercial
fields in a series of flightlines over the sites in Hand and Webster
counties. Landsat MSS data is also acquired and processed for each Land-
sat overpass during the seasons over the entire test site. These data
provide a measure of the natural variation in the temporal-spectral char-
acteristics of wheat, corn, and soybeans and surrounding cover types.
The truck-mounted spectrometer and radiometer collect spectra of crops
in controlled experimental plots of corn, soybeans, and winter wheat at
the Purdue Agronomy Farm. These data combined with the more detailed and
quantitative measurements of crop and soil conditions which can be made on
the plots, enable more complete understanding and interpretation of the
spectra collected from commercial fields. Past experience has shown than
there are generally too many interacting variables in commercial fields to
determine exact causes of observed differences in spectral response. With
data from plots where only two to four factors are varied under controlled
conditions, it is possible to determine more exactly and understand more
fully the energy-matter interactions occurring in crops.

-9-
The spectral measurements are supported by descriptions of the tar-
gets and their condition. The observations, counts, and measurements of
the crop canopy include: maturity stage, plant height, biomass, leaf area
index, percent soil cover, and grain yield. Also, included are measure-
ment conditions such as sensor altitude and view angle, as well as measure-
ments of the atmospheric and meteorological conditions. The data are sup-
plemented by aerial photography and ground-level vertical and oblique
photographs of the fields and test plots.
A data library of all spectral, agronomic, meteorological and photo-
graphic data collected is maintained at Purdue/LABS. The data are pro-
cessed in standard data formats and measurements units and are made avail-
able to NASA/JSC-supported investigators and other interested researchers
upon request.

-ia
app,
M. W
~ 44 Oe•' c .i
coAi
10A
M^. u
u ^ts^ o
^ u^ dd ax to m
0^ow
m OA o
uEI. m /^u 0
^0^ae a
a HH <z
0,au
m
Cuto
touccro
Xu1-+
mmdw
wa014Q44u
0
0u
UcdO
0.aro
v0otdum.Hu
0
WO
O
ut0HuU)a
u,Hu
uto
cc
o' 9I
♦ I
I
op t^1A
^^1-4 4J
^ ton^
O •
s. ^ U R0
'pd u o,--^ dl ti! Ud1 m +^+
k+ O- tdax
o f0N. •
0°o u^
.c c
Ou0P. C4
U coF+ to
41coA
Ccn^4 U) ♦ I
p U ^ ♦ ♦I
C; IN
Ir
u uco 0m A Or
Na
wu
I
u
N ^ daQ^ 'd2 d
Ir
TIW
NO00M

-11-
1. Webster County, Iowa
2. Hand County, South Dakota3. Purdue Agronomy Farm, West Lafayette, Indiana4. Sandhills Experiment Station, North Platte, Nebraska
Figure A-3. Locations of 1979 Supporting Field Research test sites.

-12-
2. Data Analysis
In this section the results of several analyses of field research
data conducted during the past year are briefly summarized. The past
year has been in many ways a year of transition from analyses of 1ACIE
Field Research data which looked at wheat and other small grains to
AgRISTARS Supporting Field Research where considerable attention is being
given (by Purdue) to acquisition and analysis of data on corn and soybeans.
During the past year two studies of wheat largely described in last
year's final report have been completed and will be submitted to technical
'ournals. In completing the work, our previous analyses of the relation-
ships of crop canopy variables such as leaf area index were extended to
evaluate prediction equations on independent data sets. The results
provide additional evidence that measures of vegetative growth, includ-
ing leaf area index, biomass, and percent cover can be predicted from
multispectral measurements. In the second investigation, additional
analyses of the source of variation in the spectral response of spring
wheat canopies were completed. In this experiment, planting date and soil
moisture were the primary factors which affected the reflectance of
canopies from tillering to maturity. Differences in reflectance were
primarily caused by differences in leaf area index, biomass, percent
soil cover, and maturity stage. Additional analyses and modeling of
the spectral response of spring wheat canopies as a function of maturity
stage, solar zenith and azimuth angles, sensor view angle and direction,
and wavelength are being conducted and will be reported at a later date.
Preliminary results from two investigations with corn and soybean
data acquired in 1978 at the Purdue Agronomy Farm have been obtained
and are briefly summarized in the following sections. Additional analyses
of these data are currently being performed and collection of a second
ye a r's data on the same experiments has recently been completed.
2.1 Soybean Canopy Refle ctance Cha rac teristics
The objectives of the first experiment were to determine the

-13-
relationship of reflectance and agronomic characteristics of soybean
canopies throughout the growing season, including (1) examination of the
effects of cultural practices on reflectance and (2) prediction of canopy
characteristics from reflectance measurements.
Reflectance spectra and agronomic measurements were acquired for
81 soybean plots throughout the 1978 growing season. The factors inves-
tigated were three row spacings (15, 46 and 91 cm), three plant popula-
tions (185, 259, and 334 thousand plants per hectare) and three cultivars
(Amsoy, Wells and Elf). At intervals of 5 to 10 days, spectral reflectance
was measured in four Landsat MSS wavelength bands using an Exotech 100
radiometer. Agronomic measurements included plant height, biomass, leaf
area index, percent soil cover, maturity stage and surface soil moisture.
In analyzing the data it was found that plant population had no
significant effect on reflectance, height, biomass, leaf area index or
percent soil cover.
Figure A-4 shows the relationship of maturity stage (measurement date)
to reflectance during the growing season. There were no significant
differences among the three cultivars except near the end of the growing
season when differences in maturity stage caused significant changes in
reflectance. Row width caused differences in both red and infrared
reflectance until the wide rows reached approximately 100 percent soil
cover (Figure A-5).
High correlatil^ns were fowld between reflectance in both red and near
infrared wavelength bands (Figures A-6) to percent soil cover.
And, these relationships were used to develop a simple regression model
to Fredict percent soil cover (Figure A-7). Similar analyses are being
conducted for other canopy variables.
In summary, (1) no significant spectral or agronomic differences due
to population were found, (2) the cultivars were spectrally and agronomically
similar until near maturity, (3) row width which caused different
proportions of soil and vegetation in the scene, was !! dominant influence

u.•
«0
wv.0
3
d
0
db"
1
-14-
Red Reflectance 10.6-0.7}trn)
Date
Near Infrared Reflectance 10.8 .1.1 jim)
7/15 8/1 8115 9/1 9/15 10/1
10/15
Date
Figure A-4. Relationship of red and .ear infrared reflectance ofthree soybean cultivars canopy reflectance as a functionof measurement date.

LL
mac
s
-15—
Red Reflectance KL6-0.7Nml
7/u
Wu
Dab
Near Infrared Reflectance 10.8-1.1yuml
Dab
Figure A-5. Effect of row width on soybean canopy reflectance as afunction of measurement date.

-16-
Red Reflectance 10.6.0.7jiml
K 0000..0000...
^'• :.N •0.987r
'v
0000 0000.... .. ........... ........3[
20 140 8o 80 100
Soil Cover t%1
Near Infrared Reflectance IQ8 -1.104
R3 ( r • 0.94
A
40
a •0000. .0000 .......... ...............c20f..... .. .
0
.. 000000000000... .0..0.00.0000..... 0000.. «.. 0000 .. . . .. 0.00.6
• :. • : . .
0000
. .
20
40 80 So 100
Soil Cover 1%1
Figure A-6. Correlation of red and near infrared reflectance withpercent soil cover of soybean canopies.

-17-
•
N 0 0 ^•^•• N •• •
•. •
•• •
Predicted Soil Cover •M67 + 10.978 0 ail-18.478 0 tIMol
SV
d 4v
so
. n
•
Y
20 40 60 so
Actual Soil C:-ver MI
Figure A-7. +:ompjar:st,n of ait*ul measurements of percent soil coverof soybean canopies with that predicted from reflectanceme.tiF,ur , ments.

-18-
on reflectance throughout most of the season, (4) spectral reflectance
tias highly correlated with soil cover, and (5) prior to 100 percent
soil cover, sun angle and row width interact to influence spectral
reflectance.
2.2 Carr Canopy Reflectance Characteristics
In a secon^ a%periment, the relationship of the agronomic characteris-
tics, particularly the effects of nitrogen fertilization, growth stage
and leaf area and biomass to multispeetral reflectance were investigs-
ted. Nitrogen deficiency has been shown to alter the single leaf
reflectance characteristics of corn and other species, but few studies
have been conducted with field -grown canopies.
In this experiment reflectance spectra and agronomic measurenents
were acquired throughout the growing season of 12 plots of corn. The
experimental treatments were 0, 67, 134, and 202 kg per hectare of
nitrogen fertilizer in a randomized complete block design with three
replications. Bidirectional reflectance factor of the canopies was
measured at approximately weekly intervals over the 0.4 to 2.4 Um wave-
length range using the Exotech 20C spectroradiometer. Agronomic measure-
ments of the canopies included growth stage, leaf area index, percent
soil cover, biomass, and nitrogen concentration.
The spectra for the low and high nit-ogen fertilization treatments
from a mid-August measurement date are shown in Figure A-8. The changes
in soil cover, leaf area index, biomass, and plant nitrogen associated
with measurement date (Maturity stage) and nitrogen fertilization level
are shown in Figure A-9. In Figure A-10, f,;,e relationship of reflectance
to measurement date and nitrogen fertilizat .*. on are illustrated. And,
In Figure A-11 the relationship of plant nitrogen content and leaf area
index are shown.
In summary, nitrogen ferti l ization caused significant nanges in
several measures of the amount of vegetation, i.e. less nitrogen, less
biomass, leaf area, and ground cover.

-19-
The agronomic characteristics of the canopies were in turn manifested
in the spectral response of the canopies. Reflectances in the green
and red wavelength regions were most strongly related to loaf and plant
nitrogen concentrations. Leaf area index, biomass and percent soil
cover were most strongly related to near infrared reflectance. The
results indicate the potential of using multispectral remote sensing
to monitor crop condition, but considerable more research is required to
develop a complete and quantitative understanding of the effects of
crop stresses, such as nitrogen deficiency, or the spectral response of crops.

-20-
50
ov
0 40uLLavcv 30
c 200wvv
to IC
G .6 1.0 1.4 1.8 22
Wavelength Nm
Figure A-8. Effect of nitrogen fertilization level on the spectralreflectance of corn canopies.

8 9 N $(Luyb) u8504IN Weld
-21-
w
I
I
N f .Q. NQ
:opus eaiy noel
f
i
1
i
xO N
1
1 1
1 1
1 t1
l
l
O
CO,.J) JPA03 IIOS
O
J,
i1111
1
1
i
s
^
,f
1 I 1 /
NO b
(= lu/f)}I)SgvwOIO 4GOJJ
I
I
IA
O+^1
.GN d41 +^N edW 'C!
w JJC:
G
yO
41 O1+ 41W 9W Wl0 O41.-1 G
w
11 J.1w ut uwM toO coO td
aJ
M
1r p41 Ga la
uGO
,o u41 w
N O
^ G4M1 J40
ww u
d 41
$4 1aN u
o r.
+-1 .i°i
d awvw
Id41lr
00wlw

0.63 - 0.69}im
..0vmLL
m 16uCrovR 12mo^
c 8Ou
m 4
IF-
-22-
- --• 0 Kg/ha• 202 Kg/ha
d-0*
nv
0
7/1 7/15 6/1
9n
Date
ifr'•' 0.76.0.90Nm \
r
•--- 0 Kg/ha- 202 K"a
n40
..Ogo 35
LLmuCH
30
ma
v 25um
v20
8/1 8/15
Date
Figure A-10. Effect of nitrogen fertilization on the red and nearinfrared reflectance of corn canopies as a function ofmeasurement date.

0 .• •
•
••
so
ntvr 40wWauCr- 30
Tj
v
n20
00v
v 10m
On : :: : •
••
0.76-0.90 Nm
-23-
18
100 200 300 400 500 600
Plant Nitrogen (9/m2)
n
^v 12
vAY.
9
ud6
0inum 3
0
0
01.0 2.0 3.0
4.0
Loaf Area Indox
Figure A-11. Relationship of plant nitrogen and leaf area index toreflectance of corn canopies.

-24-
B. FIELD RESEARLH DATA ACQUISITION AND PREPROCESSING*
Larry Biehl and Craig S.T. Daughtry
The objectives of the taak were to acquire and preprocess the data
required to accomplish the objectives of the Supporting Field Research
project as described in section A. The overall objectives of the task
are: (1) develop data acquisition and preprocessing plans, (2) acquire
the 1979 field research data as defined in the plans, and (3) preprocess
the field research data for use by researchers. The data were acquired
at the Purdue University Agronomy Farm and at test sites in Webster
ounty, Iowa, Hand County, South Dakota, and MacPherson County, Nebraska.
1. Purdue Agronomy Fare Experiments
During 1978 experiments to investigate the spectral characteristics
of corn and soybean crops were initiated at the Purdue Agronomy Farm.
These experiments emphasized determination of the effects on the spectral
responses of maturity stage, canopy variables such as leaf area index and
biomass, stresses such as moisture and nutrient deficiencies, and cultural
practices such as row spacing. These experiments, with some modification,
and additions were continued to obtain additional years of data (1978 was
an unusually good year with respect to weather although planting was late).
This section describing the results of work conducted under Task 1B,Field Research Data Acquisition and Preprocessing. The experiment designwas led by Marvin Bauer and Craig Daughtry. The plot preparation andfield measurements of wheat, corn, and soybeans were directed by CraigDaughtry. Barrett Robinson and Larry Biehl were responsible for thespectral measurements.
Greg Walburg, Jeff Kollenkark, Larry Hinzman, Vic Pollara, MikeStabenfeldt, Joe Tarantino, Mark Lewis, Steve Jackson, E.B. Rawles,Karen Ortman, and Vic Fletcher assisted in the plot preparation and datacollection. Cathy Kozlowski assisted h-r Don McLaughlin, Andy Teetzel,Mike Guba, Mike Sepp, and Cathy Axtell were responsible for the dataprocessing.

-25-
1.1 Objectives
The following overall objectives were selected for the experiments
to be conducted at the Purdue Agronomy Farm:
- To determine the reflectance and radiant temperature character-istics of corn and soybeans as a function of maturity stageand amount of vegetation present.
- To determine the effects of stresses including moisture deficits,nutrient deficiencies and disease on the reflectance and radianttemperature properties of corn, soybeans, and winter wheat.
- To determine the effect of important agronomic practices (e.g.$planting date, plant population, fertilization) and environmentalfactors on the spectral characteristics of corn and soybeans.
- To support the development of corn and soybean yield modelswhich use as an input spectral response as a function of cropdevelopment stage under stressed and normal growing conditions.
- To assess, using present and future Landsat spectral bands, thespectral separability of corn, soybeans, and other typical CornBelt crops and cover types as a function of date and maturitystage and soil background conditions (color, texture, moisture,tillage).
- To determine the effects of measurements conditions such as sensoraltitude and solar elevation and azimuth angles on crop reflectance.
1.2 Experiment Descriptions
Ten experiments were developed for the Purdue Agronomy Farm to
accomplish the objectives of Supporting Field Research. The experiments
included studies of crop stress, cultural practices, instrument observation
parameters and canopy geometric characteristics. A summary of the experi-
ments, treatments, and spectral instrument systems are given in Table B-1.
More detailed descriptions of the experiment designs and treatments of
the major experiments are given in Figures B-1 through B-5. The spectral
and agronomic measurements were collected at approximately weekly intervals
throughout the growing season.
Corn Cultural Practices Experiment
The objectives of this experiment are to determine (1) the threshold

-26-
Table H-1. Summary of the 1979 Supporting Field Research Experiments atthe Purdue Agronomy Farm.
Experiment, Treatments, and Primaz-i Sensor System
Winter Wheat: Nitrogen Fertilization and Disease (Exotech 20C andExotech 100)
3 Cultivars3 Nitrogen Fertilizer Rates (0, 60, and 120 kg/ha)
Corn: Cultural Practices (Exotech 100)
3 Planting Dates (May 2, 16, and 30)3 Plant Populations (25, 50, and 75 thousand plants/ha)2 Soil Types (Chalmers-dark and Fincastle-light)2 Replications
Soybeans: Cultural Practices (Exotech 100)
3 Planting Dates (May 10, 24, and June 7)2 Cultivars (Amsoy-narrow, group II maturity and Williams-bushy,
group III maturity)2 Soil Types (Chalmers-dark and Fincastle-light)2 Replications
Corn: Nitrogen Fertilization (Exotech 20C)
4 Nitrogen Fertilizer Rates (0, 67, 134, 202 kg/ha)3 Replications
Corn: Disease Southern Corn Leaf Blight(Exotech 20C)
3 Leaf Blight Treatments (None-resistant, early and late infection)2 Hybrids (Pioneer 3545 and DeKalb XL43)2 Replications
Corn and Soybeans: Moisture Stress (Exotech 20C)
3 Moisture Levels
Corn: Soil Background (Exotech 100)
2 Surface Moisture Levels (moist and dry)2 Surface Tillage Conditions (rough and smooth)2 Replications
Soybeans: Row Direction and Sole: Azimuth and Zenith Angles (Exotech 100)
9 Row Directions (90.105,120,135,150,165,180,210,240 degrees plaited in 76 cmrows, plus narrow rows (25 cm) and bare sofa)

-27-
Table B-1. Con't
Experiments, Treatments and Primary Sensor System
Soybeans and Corn: Sensor Altitude and Field of View (Exotech 100)
10 Sensor Heights from 0.5 to 10 m above canopy
Wheat, Corn and Soybeans: Geometric Characterization
2 Crops (corn and soybeans)3 Methods (laser, point quadrat and photographic)

-zs-
.^ N N^ Q M A O M
~+ Q ^11 go, O
on
r N A h N Na L1 M O Q O.
Ywt
Ma o is
Q °"m
wo 06
.°r a s o o w
Pf P1 P1 N
o Q a Q r.do
Or4
1rlu
O1
0
M
A
4•
T
.y N N 1 nN Q a Q a.
"n o a ^ a ^
w o a ^ o ^
Y
Q 0.wMaf
^ a s h A a
N ^+ A.p • ^D r N
o Q e.
A N •+ b N .+^e Q a ^e Q ^.
A r
O O. O ^,
31L Y C
w Y wC
•rY
06 w
r r
.ee.i^0
.-ta+V-4V40
V.4ajtouC
W
rtV40ta
'eba
pq
Na
^"^
sw
uM uw ^
ou
o
}-d ,may W
to Pwoc
vi u ^ br't 0
uC)
M
ab o 'e7r4 -r4
ws a w
OONx a a Ch. 4
• -1 N N1.0L
WO
cOrlua
,-iu
* .00 = .00 bc0 m oD ugg a ►
A Cd cc cc
c w° a a a co wO 41 41
u C up O O XC O O O 4^
r-4►ri o v+ w
u N Ln r- ar
^ ^ ^d .^ N f'1 C +^iA a a a oo++
,a uU) to
C d W4► A a8uto4) O C+ r- P% .r
-4 oqH u a(^ w 41
r
w
N P900
^ WM
Ar A A A

176 173 176 177 178 179 180 111 182 185 186 18S 186
T
^S n
02 01 DS D2 D2 D3 D 1 D2 D3 "To 01 Dla2 y a2 a1 al a1 a2 t2 al a3
i
alV2 V2 I1 ► 1 v2 v V1 v v
V2v
1.8 n
Plot No.
Treatment Coda
Dark Soil
Plot No.
TreatmentCode
plot No.
TreatmentCede
166 113 166 145 142 161 160 159 138 137 136 12! 126
l! tD1 O1 D1 02 D2 D2 03 D1 D2 D! D l 02 Mn
a, a2 a a al a a l a a a2 av v v v v v v v v v v v
121 122 123 126 125 126 127 128 129 130 131 172 155
TD2 0 1 D3 D3 D2 01 02 D1 01 113 D2 03 Be- 13 1
a l al a2 4 R2 12 ai 112 R1 al 22 alV2 v2 V1 v Ti v V v v v v V
Light Soil
Plot No.
Treatment Code
161 162 163 166 165 166 167 168 169 170 171 172 115 T15 1
D2 DS D1 05 D2 D2 sere D1 D 1 D1 DS 02 D5
R1 r R2 R2 a212 R, R1 R2 a1 al R2
11 1VI V1 V 1 V2 V1 V V2 V2 V1 Y V 1.
Treatment Descriptions
Planting Date
Dark Soil
D =May 10D2=M ay 24D3=June 15
Light Soil
D =May 24D1=June 15D3=Ju ly 3
Row Width
R =25 cmR2= 76 cm
Varied
V =Amsoy 71V2-Williams
Figure B-2. Design and treatment descriptions of the 1979 Purdue Agronomy Farmsoybean cultural practices experiment.

-30-
of early season spectral detection of corn, (2) the spectral response of
corn sq a function of growth and amount of vegetation, and (3) the effect
soli b-.ckground differences, particularly soil color, on the spectral
response and early detection of corn. The treatments were as follows:
3 Planting Dates ( May 2, 16, and 30)3 Plant Populations (25,000, 50,000 and 75,000 plants per hectare)2 Soil Types (Chalmers, dark and Fincastle, light)
A split p.ot design with two replications was used. Spectral
measurements, along with agronomic characterizationa of the canopies and
surface soil, were made at approximately weekly intervals throughout the
growing season.
The spectral reflectance measurements were made with a Landsat band
radiometer (Exotech Model 100). Radiant temperatures and overhead color
photographs of the canopies were obtained simultaneously with the reflec-
tance measurements. The major agronomic measurements of the plots ir,^luded
growth stage, percent soil cover, height, leaf area index, biomass, and
surface soil moisture and condition. Grain yields were measured at harvest
time.
Soybean Cultural Practices Experiment
The objectives of this experiment are the same as the corn cultural
practices experiment. Treatments similar to those of the corn experiment,
but representing major different soybean cultural practices were selected.
The treatments were as follows:
3 Planting Dates (May 10, May 24 and June 14)2 Row Spacings (25 and 76 cm)2 Cultivars (Amsoy, narrow canopy type and Williams, bushy type)2 Soil Types (Chalmers and Fincastle)
A split plat design with two replications was used. Spectral and
agronomic measurements were made as for the corn experiment.
Corn Stress Experiments
Experiments with three major types of stress were conducted on corn:

-31-
nitrogen nutrition, southern corn leaf blight disease, and moisture
deficits. These stresses were selected as examples of important factors
influencing the growth and yield of corn. Nitrogen fertilization is one
of the primary factors responsible for the increased yields in the U.S.
in the past 25 years. Southern corn leaf blight is an example of a non-
systemic fungus disease capable of significantly reducing the photosynthesis
capacity of corn. And, differences in moisture availability account for
much of the variation from year to year in corn yields.
Nitrogen Fertilization
The first experiment was with nitrogen fertilization. Four levels
of fertilization, 0, 67, 134, and 202 kg/hectare, providing a range from
distinctly deficient to abundant have been selected from a long team ferti-
lization experiment. The specific objectives of the experiment were to
(1) determine the threshold of spectral detection of nitrogen deficiency
and (2) determine kind and magnitude of changes in reflectance and thermal
response as a function of level of nitrogen nutrition. Three replications
were used. Measurements were made at approximately 10 day intervals
throughout the growing season with the Exotech 20C spectroradiometer over
the 0.4 to 2.4 um wavelength range. Radiant temperature of the canopy was
also measured. In addition to the standard agronomic data (leaf area index.
etc.) leaf nitrogen and chlorophyll concentrations will be determined. And,
leaf reflectance measurements were made on several dates.
Leaf Blight
The second experiment was to investigate the effects of a non-systemic
fungus disease, southern corn leaf blight (Helminthosporium maydis). on
the multispecti',,l reflectance and rad+ant temperature of corn. The specific
objectives of the experiment were similar to those of nitrogen fertiliza-
tion experiment, i.e. determine the relationship of disease severity level
to the spectral characteristics of corn. The factorial treatments included
2 Hybrids and 3 Leaf Blight Treatments (non. early and late innoculation).
The early and late innoculation provided two different levels of disease

ON
N N^^ ON N
ti MN P-4
o r%
O ON
O fnN
r. nO ^DN
o ON
V1 N
N N
O ON N
0 0N
N .?O erf
N ^
TM
uOr4oa
N.Wu0rq04
..
.!Lua
00
1
iQO
dO.fl
aae^
Or paxJ w
w
yOC CO O"4 V4u up, eq
w ^u P-4m ^V wu wC41 C
u od0
d 10d
w u
CC Ceo w
Oe uto"4 8W w
AO{ad
fi
as
dw7Op
4r
-32-
r^.
i
T
LO C
x d
u ^c
O ^0 Z^ da
H
duO
aVC
C6 d
O =-+ a^• 1q
^O W
O
^ Co^ o
uu
O w
•rd
a aO
b v1IV u u1u O
eo a .-+.r da w .+
a► wVi Q
_ ^ aC Ow wO :0%u e► 9
ago '^ o
wC! "^ dV 7C VO k w
.d V4p• N 04
.r N P1

-33-
M
^O
d
vO
O ice+.^ NW
O
uOcg
o ow., o
c^
o
4o w
w
^+C v
uAd N
F+
o^
O^nO^
7tiRO
.0 O^ +1
a^u
C ^^ ua o
o .,u
v ^^o xuN wa ga
0
v `'s^ wo a cGo,o a
a N .1a ua
r'1 U.T ►+ O
^ ^ au fr4
N pn 41
YIM
v
vMTI'off
i7
AP.
prCON
vO.Q
N
ON
o%
vuwO
C0
aNusbvv
LCVVRI61Nu
ceo,rtova
1
dN700
^.1w
-34-
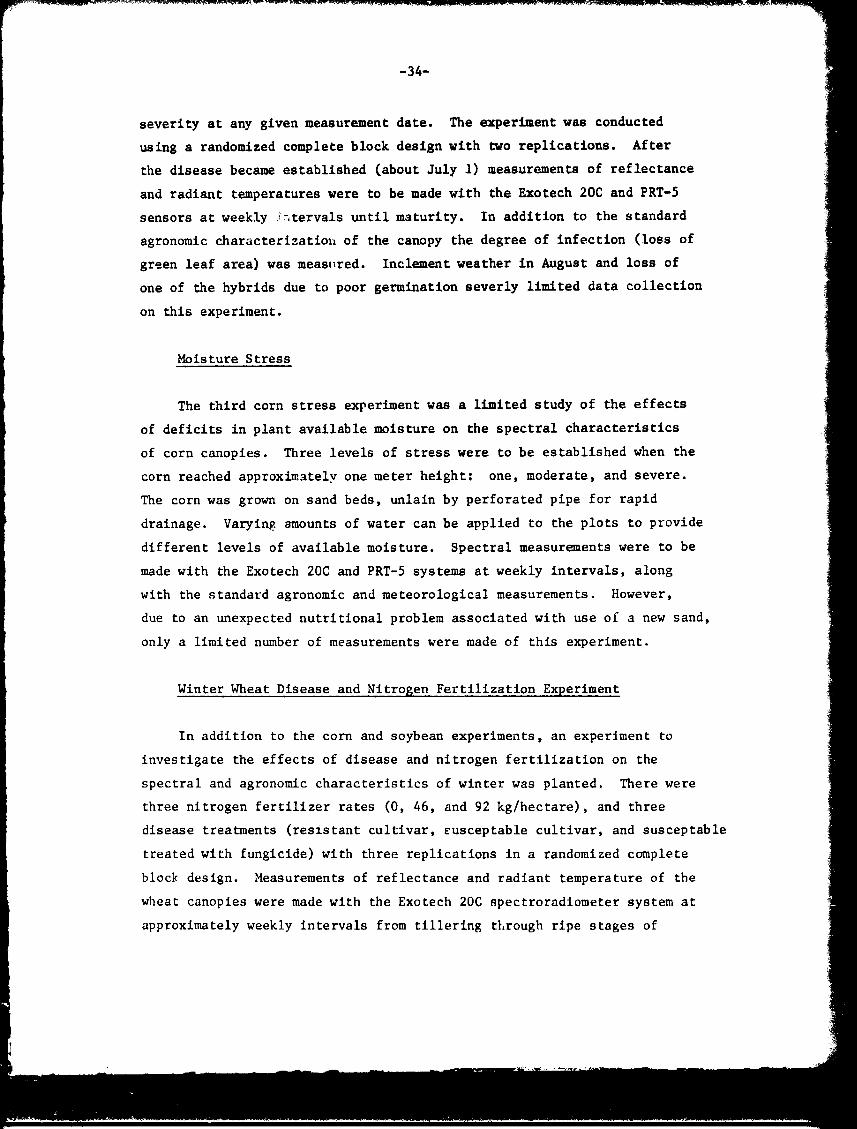
severity at any given measurement date. The experiment was conducted
using a randomized complete block design with two replications. After
the disease became established (about July 1) measurements of reflectance
and radiant temperatures were to be made with the Exotech 20C and PRT-5
sensors at weekly .1'.-tervals until maturity. In addition to the standard
agronomic characterization of the canopy the degree of infection (loss of
green leaf area) was measured. Inclement weather in August and loss of
one of the hybrids due to poor germination severly limited data collection
on this experiment.
Moisture Stress
The third corn stress experiment was a limited study of the effects
of deficits in plant available moisture on the spectral characteristics
of corn canopies. Three levels of stress were to be established when the
corn reached approximately one meter height: one, moderate, and severe.
The corn was grown on sand beds, unlain by perforated pipe for rapid
drainage. Varying., amounts of water can be applied to the plots to provide
different levels of available moisture. Spectral measurements were to be
made with the Exotech 20C and PRT-5 systems at weekly intervals, along
with the standard agronomic and meteorological measurements. However,
due to an unexpected nutritional problem associated with use of a new sand,
only a limited number of measurements were made of this experiment.
Winter Wheat Disease and Nitrogen Fertilization Experiment
In addition to the corn and soybean experiments, an experiment to
investigate the effects of disease and nitrogen fertilization on the
spectral and agronomic characteristics of winter was planted. There were
three nitrogen fertilizer rates (0, 46, and 92 kg/hectare), and three
disease treatments (resistant cultivar, eusceptable cultivar, and susceptable
treated with fungicide) with three replications in a randomized complete
block design. Measurements of reflectance and radiant temperature of the
wheat canopies were made with the Exotech 20C spectroradiometer system at
approximately weekly intervals from tillering through ripe stages of

aa°10OM41V1au
N
^gg
Li
a.
baOQHp
64J
bHOaO^hOr.4
0!
N
44 4jo a
4)
1.1O HV4 41Ai d4 g
,a
V 0!
Nb 01
m
abm
H a♦J O
rl
a ^0co NaV400 T1rl ^al H
etvW
LA
A
yHa00,-rk+
-35-
x x
'' s a
M
a ^ ^
.^+ ZTOS vssa
.N+ ir1 N
N 1A rl
O 1+f Np .^J ^ 9
^ ^ d
►mod ^. i
TTOS visa
r x
N ^ ^N Z >
r
N ^N
N^ •i
^. a►
N Z >
N 1L >
Nr
^ ?
rN
Z >
,fn lJoS aria
YSY
7 Ow
u A YO 4
M1 ^- u
MitY
Y '{1
.+ yM Yn y
r.
49 T
Y Y ^1
U Y Mv
^ v v
a• • •
a > > ^+e
MM M
YU t4CN
tC
• •
C S Z Y
^o fYt fit N •^ C O O C M~ ^ r Y ^
• / /on M
•ter itx i z
Y
N
A
0Nq

-36-
development. Agronomic characterizations of the canopies included: leaf
area index, biomass, percent soil cover, height, lodging, disease severity,
leaf nitrogen concentration, and grain yield.
Row Direction and Solar Azimuth and Zenith Angles
The objective of the experiment is to determine the effect of rows and
row direction, variables in the area of cultural practices, on the reflective
response of a soybean canopy as a function of azimuth and zenith sun
angles. The design of the experiment involved 11 plots. One plot was
planted in east-west and north-south rows 25 cm wide to obtain, at later
growth stages, a canopy with negligible row effects. A second plot was
bare soil, providing an opporti.nity to monitor the reflectance of the soil
background of the soybean plots. The remaining nine plots were planted in
soybeans with 76 cm wide rows with the following azimuthal directions:
90-270, 105-285, 120-300, 135 -315, 150-330, 165-345, 180-360, 210-030,
and 240-060 degrees. The row directions were selLcted to maximize the
probability of obtaining data during the morning hours when cloud conditions
are more favorable for data collection than in the afternoon. Reflectance
data were acquired at 15 minute intervals throughout the day on three
days, representing three canopy growth stages. Data analysis will involve
mathematically modeling the effect of combinations of sun azimuth and sun
zenith angles on the reflectance from a row crop of soybeans. The
experiment design permits the effect of sun angles to be analyzed independently.
Sensor Altitude and Field of View
The object of the experiment is to determine how the canopy reflectance
varies as a function of height above the crop and, p rticularly, whet
minimum height is needed to acquire repeatable reflectance measurements.
Data were acquired on three canopies, mature corn planted in 7/6 cm rows,
wature soybeans planted in 96 cm rows with 50 to 70% ground cover, and
mature soybeans planted in 76 cm rows with 100% ground cover. The canopies
provided scenes with a range of row offects from pronounced rows to no
obvious rows. Data were acquired at 10 heigh ts hanging from 0.5m to 10m
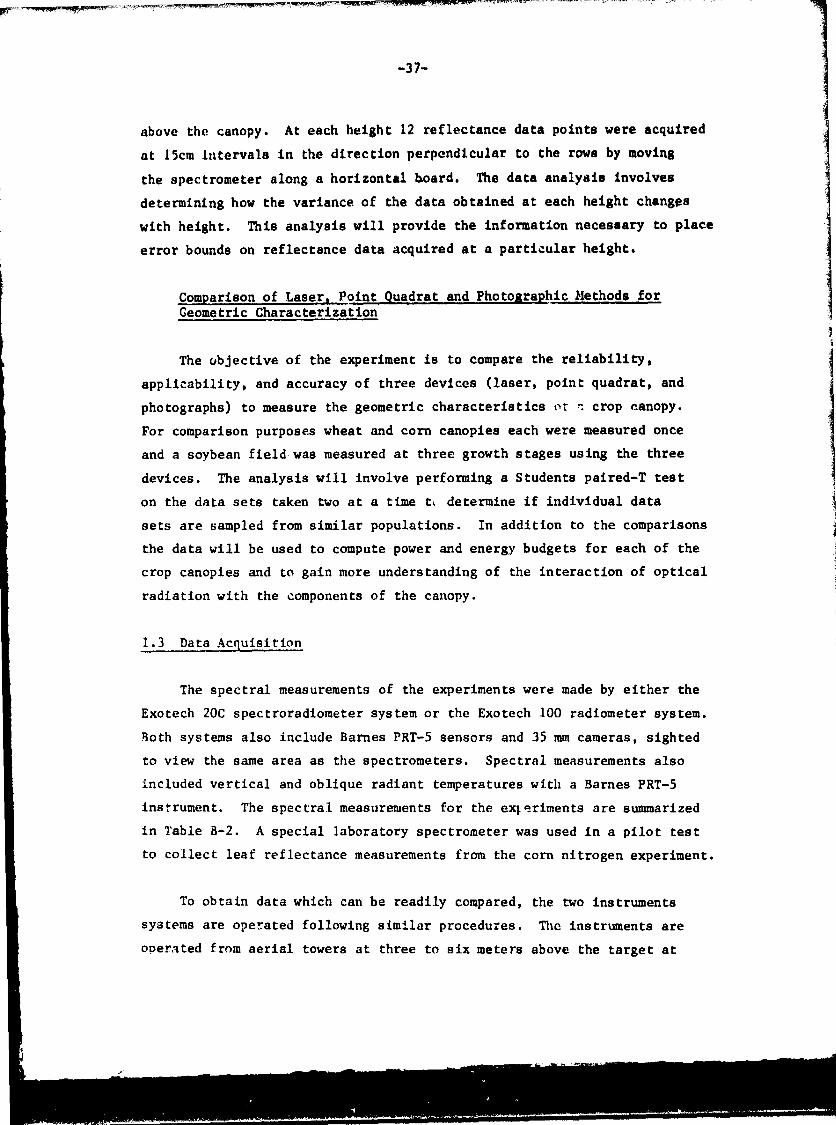
-37-
above the canopy. At each height 12 reflectance data points were acquired
at 15cm Intervals in the direction perpendicular to the rows by moving
the spectrometer along a horizontal board. The data analysis involves
determining how the variance of the data obtained at each height changgs
with height. This analysis will provide the information necessary to place
error bounds on reflectance data acquired at a particular height.
Comparison of Laser, Point Quadrat and Photographic Methods forGeometric Characterization
The objective of the experiment is to compare the reliability,
applicability, and accuracy of three devices (laser, point quadrat, and
photographs) to measure the geometric characteristics cat ^ crop canopy.
For comparison purposes wheat and corn canopies each were measured once
and a soybean field was measured at three growth stages using the three
devices. The analysis will involve performing a Students paired-T test
on the data sets taken two at a time t, determine if individual data
sets are sampled from similar populations. In addition to the comparisons
the data will be used to compute power and energy budgets for each of the
crop canopies and to gain more understanding of the interaction of optical
radiation with the components of the canopy.
1.3 Data Acquisition
The spectral measurements of the experiments were made by either the
Exotech 20C spectroradiometer system or the Exotech 100 radiometer system.
Both systems also include Barnes PRT-5 sensors and 35 mm cameras, sighted
to view the same area as the spectrometers. Spectral measurements also
included vertical and oblique radiant temperatures with a Barnes PRT-5
instrument. The spectral measurements for the experiments are summarized
in Table B-2. A special laboratory spectrometer was used in a pilot test
to collect leaf reflectance measurements from the corn nitrogen experiment.
To obtain data which can be readily compared, the two instruments
systems are operated following similar procedures. The instruments are
operated from aerial towers at three to six meters above the target at

-38-
Table B-2. Summary of spectral measurements collected at the PurdueAgronomy Farm for the 1979 field research experiments.
Experiment, Instrument System, and Spectral Measurements
Stress Experiments (nutrition, moisture, disease)
Exotech 20C Field Spectrometer System
Bidirectional reflectance factor (0.4-2.4 tiara)Radiant temperatureColor photographs
Cultural Practices Experiments (Corn, Soybeans)
Exotech 100 Field Radiometer System
Bidirectional reflectance factor (Landsat MSS spectral bands)Radiant temperatureColor photographs
Instrument Parameter Experiments
Exotech 100 Field Radiometer System
Bidirectional reflectance factor (Landsat MSS spectral bands).Color photographs

-39-
heights which minimizes the shadowing of skylight and yet ensures that
the field of view of the instrument includes only the desired subject.
Care is taken to avoid scene shadowing and minimize the reflective interaction
due to personnel or vehicles. The routine data taking mode of the instru-
ments is straight down, for determination of bidirectional reflectance
factor. Measurements of the BaSO4 painted reference panel are made at 15
minute intervals. Two measurements of each plot are typically made by
moving the sensor so that a new scene within the plot fills the field of
view.
Data recorded at the time of each measurement describing the measure-
ment parameters include: date, time, reference illumination, air
temperature, barometric pressure, relative humidity, wind speed and
direction, percent cloud cover and type, field of view, latitude, longitude,
and zenith and azimuth view angles.
Detailed agronomic measurements of the crop canopies included crop
development stage, vegetation measurements, crop condition, soil background
condition, grain yield, and additional measurements for specific experi-
ments. The agronomic measurements are summarized in Table B-3. The
agronomic and spectral data are supplemented by vertical and horizontal
color photographic of each plot.
Augmenting the spectral and agronomic measurements were meteorological
data. The meteorological data included air temperature, barometric
pressure, relative humidity, wind speed, and wind direction. A record of
the irradiance was collected by a total incidence pyranometer on strip
charts. Additional environmental data including precipitation, pan
evaporation, dew point, solar radiation, and net radiation were acquired
hourly by a computerized agricultural weather station located on the Agronomy
Farm.
Spectral measurements, along with agronomic and meteorological data,
were acquired on each day that weather conditions permitted. A general
summary of the data collection by experiment for the Exotech 20C and

-40-
Table B-3. Summary of agronomic measurements collected at the PurdueAgronomy Farm for the .1979 .field research experiments.
Agronomic Measurements
Crop Development Stage
Amount of Vegetation
Plant HeightPercent soil coverNumber of plants per square meterNumber of leaves per plantLeaf_ area indexTotal fresh and dry biomass(g/m2jDry biomass of leaves, stems, and heads, ears or pods (g/m2)
Crop Condition
Percent leaves green, yellow, and brownPlant water content (g/m )Presence and severity of stress
Soil Background Condition
Percent moistureMunsell colorRoughness
Additional Data for Specific Experiments
Leaf nitrogen and chlorophyll concentrations (wheat and corn nitrogenfertilizer experiments)
Leaf water potential (moisture stress experiments)Leaf blight infection levels (corn blight experiment)
Grain Yield

-41-
Table B-4. Summary of 1979 data acquisition by the Exotech 20Cspectroradiometer system at the Purdue Agronomy Fans.
__..Experiment
Soybean
Measurement Winter Corn Corn Leaf Moisture Cultural Other
Date Wheat Nitrogen Blight Stress Practices Crops
Week Ending Number of Obserwitions
May 5 39 - - -12 3819 3826 - - - -
June 2 389 38 - - - -
16 87 16 - 10 - -
23 38 18 - 6 - -
30 37 16 - 8 - 9
July 7 38 29 - - - -14 - 15 3 - - -
21 - 32 19 - 3
28 - - - - -
Aug. 4 - 15 - - - -11 - - 9 4 17 3
18 - 15 - - - -
25 - -
Sept. 1 - - -8 - 16 7 - - -
15 - 16 - - - -
-42-
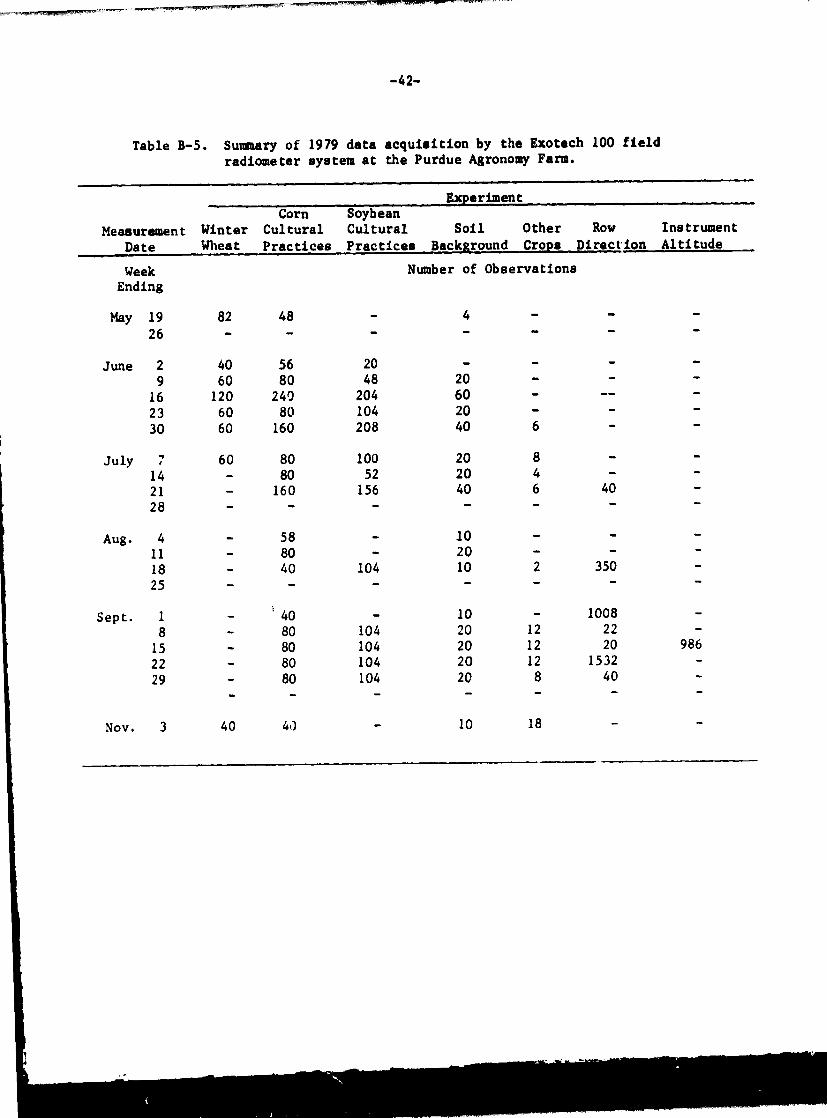
Table B-5. Summary of 1979 data acquisition by the Exotech 100 fieldradiometer system at the Purdue Agronomy Farm.
ExperimentCorn Soybean
Measurement Winter Cultural Cultural Soil Other Row Instrument
.. DateWheat Practices Practices Background Crops Direction Altitude
Week Number of Observations
Ending
May 19 82 48 - 4 - - -
26 - - - - - - -
June 2 40 56 20 - - - -
9 60 80 48 20 - - -
16 120 240 204 60 - -- -
23 60 80 104 20 - - -
30 60 160 208 40 6 - -
July 60 80 100 20 8 - -
14 - 80 52 20 4 - -
21 - 160 156 40 6 40 -
28 - - - - - - -
Aug. 4 - 58 - 10 - - -
11 - 80 - 20 - - -
18 - 40 104 10 2 350 -
25 - - - - - - -
Sept. 1 - S40 - 10 - 1008 -
8 - 80 104 20 12 22 -
15 - 80 104 20 12 20 986
22 - 80 104 20 12 1532 -
29 - 80 104 20 8 40 -
Nov. 3 40 40 - 10 18 -

I
-43-
Exotech 100 is given in Tables B-4 and B-5, respectively. Crop maturity
stages from seedling to aeneacence for 1979 are represented in these
data.
1.4 Data Preprocessing
Preprocessing of the 1978 Exotech 20C spectrometer data and the
Exotech 100 Landsat band radiometer data collected at the Purdue Agronomy
farm were completed during this year. Preprocessing of the 1978 FSS data
collected at the Hand County, South Dakota, intensive test site were also
completed.
A major portion of the data collected at the Purdue Agronomy Farm
during 1979 has been completed and is available for analysis. All
the Exotech 100 data from May through July have been processed. Additional
agronomic data will be added to the identification records as it
becomes available.
2. Data Acquisition and Preprocessing for Other Test Sites
Field research test sites utilized in 1979 in addition to the Purdue
Agronomy Farm included Hand County, South Dakota, Webster County, Iowa
and the University of Nebraska Agriculture Research Station in McPhearson
County, Nebraska. The Iowa and Nebraska test sites were added during 1979
to expand the corn and soybean test sites. The major crops at the Hand
County test site are small grains (spring and winter wheat).
The test sites in South Dakota and Iowa represented commercial fields.
The major spectral systems were the NASA/JSC helicopter-mounted spectrometer
(FSS) and aircraft multispectral scanner systems. The Nebraska test
site included controlled plots of corn moisture stress and irrigation
experiments. The NASA/JSC aircraft multispectral scanner was the major spectral
system used in Nebraska.
At the South Dakota test site the FSS and aircraft scanner systems

-44-
collected three flightlines of data totaling eighteen f lightline miles.
At the Iowa test site, the FS3 and aircraft scanner systems collected
data over five flightlines totaling 23 miles. At the Nebraska test site
the aircraft scanner collected data over one flightline at 490 meters
above the plots.
Aircraft scanner data and helicopter mounted spectrometer data
were collected during nearly every scheduled mission. A summary of the
data collection by test site for the Field Spectrometer System and the
aircraft multispectral scanners is given in Tables B-6 and B-1, respectively.
It should be noted that on August 30 at the Webster County, Iowa, intensive
tftst site both 11 channel I4MS data and 8 channel NS-001 data were
collected. The NS-001 scanner includes the thematic mapper wavelength
bands. Data from the two scanners can be compared.

-45-
Table B-6. Summary of 1979 crop year data acquisition by the NASA/tSChelicopter-mounted field spectrometer system (FSS).
Test Site
Mission Hand Co. Webster Co.Date S. Dakota Iowa
Data Acquisition DatR
1978
Sept. 20-22 9/21
Oct. 24-28 10/26
1979
April 17-19 -
24-27 -
May 8-12
14-16 5/15
23-25 5/23
May 30 - June 3 6/1
June 10-12 6/1119-23 6/2128-30 6/29
July 10-14 -16-18 7/16,1724-28 7/25
Aug. 3-5 8/47-11 8/11
21-23 -
Aug. 30 - Sept. 1 8/30
Sept. 17-19 9/1726-28 9/27
Oct. 23-25 10/25
Nov. 1-3 11/2
Indicates that data were not obtained due to inclement weather.

-46-
Table B-7. Summary of 1979 crop year data acquisition by the NASA/JSCaircraft multispectral scanners.+
Test SiteMission Hand Co. Webster Co. McPhearson Co.Date S. Dakota Iowa Netraska
Data Acquisition Date
April 24-27 -
May 8-12 -
30-June 3 6/2
June 19-23 -
July 10-14 7/10
16-20 7/16 7/2024-28 7/25
Aug. 30 - Sept. 1
8/30* 8/30*
-Indicates that data were not obtained due to inclement weather or aircraftbreakdown.
+MSS scanner used unless noted otherwise.*Both the MMS and NS001 scanner were used.

-47-
C. DEVELOPMENT OF MULTIBAND RADIOMETER SYSTEM*
Barrett F. Robinson
1. Introduction'
To develop the full potential of multispectral data acquired from
satellites, increased knowledge and understanding of the spectral char-
acteristics of specific earth features is required. Knowledge of the
relationships between the spectral characteristics and important parame-
ters of earth surface features can best be obtained by carefully controlled
studies over areas, fields, or plots where complete data describing the
condition of targets '.s attainable and where frequent, timely spectral
measurements can be obtained. The currently available instrumentation
systems are either inadequate or too costly to obtain these data. Addi-
tionally, there is a critical need for standardized acquisition and cali-
bration procedures to ensure the validity and comparability of data.
The objective of this task is to develop a multiband radiometer sys-
tem for agricultural remote sensing field research. The radiometric in-
strument will be a multiband radiometer with 8 bands between 0.4 and 12.5
micrometers; the data acquisition system will rec d data from the multi-
band radiometer, a precision radiation thermometer, and ancillary sources.
The radiometer and data handling systems will be adaptable to helicopter,
truck, or tripod platforms. The system will also be suitable for portable
hand-held operation. The general characteristics of the system are that
it will be: (i) comparatively inexpensive to acquire, maintain, and oper-
ate; (ii) simple to operate and calibrate; (iii) complete ::it;, .t,.. d2:a
handling hardware and software and (iv) well-documer.tAd for use by research-
ers.
*This section describes the results of work conducted under Task 2.1C Devel-
opment of Multiband Radiometer Systems. Professor L. F. Silva and D. P.DeWitt of Purdue/LARS and M. T. Heidt and Richard Juday of NASA/.ISC con-tributed to the preparation of the RFQ and Statement of Work. Roy Tsuchidadeveloped and directed the construction of the pick-up truck mounted boom.Professor D. P. DeWitt and Shirley Davis of Purdue/LARS contributed to theUser Manuals. Development of the software was directed by Larry Biehl andwas accomplished by Cathy Kozlowski. Development of interface software
was accomplished by C. S. Linn.

Figure C-1. Sketch of MultibandRadiometer
-48-
The instrument system will be a prototype of an economical system
which can be utilized by many researchers to obtain large numbers of accu-
rate, calibrated spectral measurements. As such, it is a key element in
improving and advancing the capability for field research in remote sen-
sing.
This report describes the design specifications of the multiband
radiometer and data recording modules, preparation of system and user's
manuals, construction of a truck-mounted boom, and development of data
handling software.
2. Description of the Multiband Radiometer
The multiband radiometer will simultaneously produce analog voltages
which are proportional to scene radiance in each of eight spectral bands.
The radiometer will be a stand-alone device capable of operation with a
variety of data acquisition systems. The prototype radiometer will be
capable of operation from 0
to 600C, when mounted on a tripod, truck,
boom, helicopter, or small plane.
To achieve reliability in reflectance measurement, a field calibration
procedure using a reference surface is to be employed for the reflective
spectral bands (refer to section F). For the thermal channel, direct field
comparison with two reference blackbodies at known temperature will be used
to establish the thermal radiance scale.

s= ,
va0NUdG4
W
aHUWWWa
50 125
0
0.5 1.0 1.5 2.0
-49-
2.1 Specifications and Features of the Multiband Radiometer
Spectral Bands. The prototype unit will be equipped with a standard
set of spectral bands which match, as nearly as is practical, the seven
bands of the Thematic Mapper multispectral scarcer. Filters will be dura-
ble and suitable for use under field conditions of temperature and humid-
ity. A summary of the spectral bands is shown in Table C-1 and Figure C-2.
WAVELENGTH (jAn)
Figure C-2. Spectral distribution of passbands superimpobed on atypical vegetation spectrum.
Table C-1. Spectral Bond Specification
Band
50% ResponseWavelengths
i^un) Detector
L*
W•m 2
-1-sr
1 0.45 - 0.52 Silicon 312 0.52 - 0.60 Silicon 273 0.63 - 0.69 Silicon 254 0.76 - 0.90 Silicon 455 1.55 - 1.75 PbS 166 2.08 - 2.35 PbS 67 10.40 - 12.50 LiTa03 8-328 1.1.5 - 1.30 PbS 21

-50-
Examination of Figure C-2 will show that, while the four Landsat
bands (0.5-0.6; 0.6-0.7; 0.7-0.8; 0 . 8-1.1 um) sample the vegetation spec-
trum coarsely and over a limited range, the seven Thematic Mapper bands
provide complete and rather detailed coverage of the spectrum. Table C-1
and Figure C-2 show the eighth spectral band (1.15-1. 30 yam) which was
selected by LARS agronomists on the basis of spectrometer studies.
Field of View. The instrument will be equipped with co-alig ►ied fields
of view (1°, 15°, and diffuser) which may he exchanged under field condi-
tions (see Figure C-3).
^. DIFFUSER ( laf4'.o.v.)I
5PACER (15 T....)
1 - 0NNErBOA
F;LTER ^-♦.
_DITECTOR/PRE AMP CAPSULE.
Figure C-3. Optical/electronic module of multiband radiometer.
Dynamic Range. The reflective channels will have adjustable ranges
(0.2, 0.5, 1.0, 1.5, 2.0, 3.0 and 5.0) which will be internally adjusted
so that radiance of L* (see Table C-1) will produce a response of 3 volts
in the 0 to 5 volt output range for a gain setting of 1.0. L* is deter-
mined to be the nominal in-band radiance of a perfectly diffusing diffuser
normal to the irradiance at sea level on a clear day (m-1).
The thermal channel will have a single range of in-band radiances
corresponding to blackbody temperatures from -20°C to -+-70 0C which Will
produce voltages in the 0 to 5 volt range.

QgQR E R
MT,S
-51-
Chopping Arrangement. The multiband radiometer will consist of eight
modular optical-electronics units centered on a 10.16 cm circle. The
front-mounted chopper will limit the entry of radiance flux to the optical
modules (see Figure C-4).
Figure C-4. Chopping arrangement for the multiband radiometer.
Modularity. The multiband radiometer will be suitable for reconfig-
uration in field environments. Detector/preamp capsules 14 em in length
will be plugged into a mother board, Lenses, filters, and spacers will
screw into the capsule as indicated in Figure C-4.
Controls and Display. The gain of each reflective channel will be
selectable by a panel mounted switch. A panel mounted analog meter will
display channel output voltages as selected by a panel mounted switch.
Oain Status Signals. On command from an external source (TTL zero)
the output from each reflective channel will be switched from data signal
to an analog voltage indicating the gain setting of the channel. This
feature is useful when the radiometer is mounted on the end of a long
boom and for reading the gain of the channel. into a data logging device.

-52-
Camera Boresight. The instrument will be equipped with a mount suit-
able for boresighting a 35mm camera to 0.3 0 of the optical axis.
Camera Control. A camera control signal will be fed, through the
input cable, to a jack on the exterior of the electronics case to enable
remote camera operation.
Low Battery Warning Signal. The multiband radiometer will provide a
TTL zero signal when the battery is judged to be too low for accurate
operation.
System Temperature Signals. Several temperature monitoring devices
will be imbedded in the prototype multiband radiometer for monitoring system
temperatures.
Electronic Filtering. Each channel will be quipped with 4 Hz and
20 Hz filters which are internally selectable.
Measurement Precision. The performance of the reflective channels is
limited by demodulation noise and Rain draft due to temperature changes.
Detector temperatures will be monitored and analog compensation will be
used to limit the relative limit of uncertainty in reflectance measurement
to 1% (silicon) and 2% (lead sulfide) for a 5 Celsius degree step in tem-
perature imposed for 20 minutes (20 Hz filter).
The thermal channel will also be ;ompensated and the temperature of
the chopper monitored to produce an NEAT of less than 0,5 Celsius degrees
for the above conditions.
Wei &ht And Volume. 15.24 x 20.32 x 13.65 cm^Less than 3 Kg (production system)3.5 Kt prototype.
Power. The instrument will he powered by any 12 volt battery and pro-
tected for vehicular battery oneration. Two separate 12 volt rechargeable
batteries which may be carried in a "fanny pack" will be supplied. A
c,hnrger will be provided to recharge the batteries. Battery life will be
greater than 3 hours in conCi.nuous service.

-53-
Cables. Connecting cables, 1.2m and 15m will be provided for hand-
held and boom operation, respectively.
2.2 Development and Acquisition of Multiband Radiometer
During the first and second quarters, specifications for the multi-
band radiometer and the data recording module were finalized. The Request
for Quotation (RFQ) was prepared in concert with the Technical Monitor and
consultants familiar with the procurement of optical instruments. The RFQ
was issued by Purdue University on May 3, 1979. Fifteen vendors for the
radiometer and eight vendors for the data recording modules were encour-
aged to bid on all or part of the system. Two proposals were received
for the multiband radiometer and one proposal was received for the data
recording system. The proposals were evaluated in concert with the Tech-
nical Monitor and it was decided to award the contract for production of
the prototype multiband radiometer to Barnes Engineering Co., Stamford, CT.
Delivery is anticipated by mid-July 1980.
In order to realize the advantages of multiple unit pricing for the
optical filters for a multiple-radiometer program (and to limit risk on
the part of the vendor where only a single prototype radiometer was being
placed under contract) it was decided (in concert with the Technical Mon-
itor) that LARS and Barnes would cooperate in the selection of vendors for
the optical filters and preparation of the purchase specifications. LARS
would then purchase the filters and Barnes would perform acceptance eval-
uation and warrant instrument performance.
Following the preparation of the Preliminary Design Report (meetings
with vendor are scheduled for November 29 and 30, 1979), the selection of
filter vendors should be completed near the start of the next contract
year.
3. Description of the Data Recording Module
The Data Recording Module (DRM) will digitize, format, and store analog
data in a solid state memory. The DRM will accept analog signals from the

-54-
multiband radiometer and other sources as appropriate to the measurement
situation. It will operate under the same environmental conditions as the
multiband radiometer.
The main function of the DRM is to record the data from the multiband
radiometer and other data channels within 2.5 milliseconds - corresponding
to 15 cm at 61 meters per second. Additionally, the unit will provide a
suitable interface for a printing calculator to allow on-site evaluation
of system performance and to provide a means for analysis of limited
quantities of data (typically, a H.P. 97S will require about 30 seconds
to process a single observation (all channels) to the desired final form
and print the results. The principal transfer mechanism will be 16 bit
parallel with handshake which is well suited for entry to many micro-
processors and computers. A parallel to serial conversion may be required
for some systems but can be easily accomplished external to the DRM.
3.1 Specifications and Features of the Data Recording Module
Data Acquisition
Data Inputs: 15 single ended channels> 10 MQ input impedance
Resolution: 12 bits
Accuracy: ± 1 bit (00C to 600C)
Stored Data (4K increments to 64K - 16 bit static RAM withdata retention battery)
Year, Day of Year, Time, Observation Number (auto advance),up to 15 channels of data and radiometer channel gain (optional),will be recorded for each observation.
Data Retention: 30 days
Data Output
Display: Memory contents
Transfer: Memory contents direct to parallel input port ondigital computer or translating device. Memorycontents may be directed to printing calculatorsuch as the Hewlett-Packard 97S for on-site compu-tation of reflectances, radiances, and temperatures.

I1
I Ul
I
------
—^ T
1 6
IW j ^ ly 1
--JL_J ^.
--------
^
------
ON 1 ELP_
W I ' ( ^)1 I '
IL
^_J._.I
z'_ __ _ I_°L 1 I
I NI 1^i tt ^a I (^ ^j
I •ac • 1 '
b
abMOu
ue0A
wO
a!
wAir.O
w44O
u
y
V41wO00
W
-55-
^nw
1 I Fill
J ^Y^
rI YIL' aWI
ft O
' OI
W'^^ A
v'
ZIOt
t
oc im
i
LJ , Z 1I Vt
' I
QI
LOI k..l
4it Q
a'
t
ET
FU
t ^ t
T
ahd
^ a
t v
1 Ln 1
I I
4
^ M t
II
LC ln
.r` '•k^

-56-
Control Functions
Intervalometer Action. Based on internal clock, adjustable timing
intervals for acquisition of data and activation of camera from 0.1 to
10 seconds will be provided.
Data/Gain Status control for radiometer gain interrogation
Low Batter Warning - Audible
Channel Over-Range Warning - Audible
Remote Activation of Acquisition
Observation Number (6 BCD characters) available for use by databack camera
Power
The instrument will be powered by any 12 volt battery and protected
for vehicular battery operation. Two separate 12v rechargeable batteries
will be supplied. Battery life will be greater than 3 hours in continuous
service. A charger will be supplied to recharge the batteries. Batteries
will be external to the logger case.
Weight and Volume
The logger will be light enough to hand carry with the radiometer.
Battery and logger may be strapped to user and comfortable to carry.
3.2 Development and Acquisition of Data Recording Module
Due to the high cost of the prototype data recording module proposal
received, it was decided that Purdue/LARS would build the prototype data
recording module. The initial design is completed and the major parts
are on order. Completion by June 1980 i4 estimated.
4. Construction of Truck-Mounted Boom
As part of the task, a pick-up truck-mounted boom was constructed. A
discussion of the trade-offs in the mechanical design, appropriate stress

7.6m
3.66m
-57-
computations, and a description of the boom are documented in LARS Tech-
nical Report 090879, Design and Evaluation of a Pick-up Truck-Mounted
Boom for Elevation of a Multiband Radiometer System, by Roy Tsuchida.
The specifications for the boom design incorporate several years of field
experience by LARS with similar structures. Except for discussion of
performance I^ests,which will be conducted when construction of the boom
is completed, this document is complete and has been supplied to the Tech-
nical Monitor. The boom assembly and its operation are shown in Figures
C-6 and C-7.
CALISAATIOM POSITION
FIELD POSITIOM
Figure C-6. Positioning of the pick-up truck-mounted boom.

-58-
INSTRUMENT A#OPITCH ADJUSTMENT
ALUMINUM RECTAMCWAA WitS"x 2'X 4' 6063 - T52
POt YURETxAAff TREADWHEEL
ALUMINUM PIPE
SIZE 5 SCHEDULE W 609I-T6
MOUNTING SLEEVE
RYDAA JAIC
rLINAND PUMP
DER
KING POST
WINLH'^ ^^
Figure C-7. Sketch of pick-up truck-mounted boom.

-59-
5. System and User Manuals
System manuals are being prepared for the multiband radiometer and
data recording modules. Each manual includes the following topics:
• General Information (description, specifications, etc.)• Installation• Operation• Theory of Operation• Maintenance and Repair• Testing Procedures
A detailed outline of the system manual has been prepared and provided to
the Technical Monitor. It supersedes the version supplied at the time of
the second quarterly report.
In addition, a users manual is being prepared to provide information
to researchers and system users on the following topics:
• Fundamentals of Measurement and Calibration• Field Measurement and Calibration Procedures• Performance Evaluation Tests• Experimental Design (including a sample experiment)
A detailed outline and partial draft of the User's Manual for Agricul-
tural Researchers has been supplied to the Technical Monitor.
6. Development of Data Handling Software
A software system was designed and implemented to aid in the handling
and preprocessing of multiband radiometer data along with associated agro-
nomic, meteorological, and other ancillary data. The software system was
initially built around an Exotech 100 Landsat band radiometer system and
later made more general for any multiband radiometer system having one to
twelve channels.
The software system presently uses 80 column computer cards for ra-
diometer data input. Presently for the Exotech 100 system, the data is
recorded on printed paper tape, copied to 80 column record sheets, and

-60-
keypunched. The program is designed, however, to accept data input directly
from the Data Recording Module. Examples of the record sheet inputs are
given in Figures C-8 thru C-10.
The software system calibrates the data according to one of several
algorithms selected by the researcher. The algorithms presently include:
• Inband Bidirectional Reflectance Factor - direct scene toreference comparison
• Inband Bidirectional Reflectance Factor - scene to referencecomparison with sun angle correction
• Inband Bidirectional Reflectance Factor - scene to interpolatedcomparison between two reference observations
• Inband Transmittance
• Direct Ratio of Two Observations
The software system also accepts other logger recorded data such as
radiant temperature and air temperature probe measurements. These measure-
melts are calibrated as specified by the researcher and stored with the
calibrated spectral measurements.
The processed multiband radiometer data are stored on tape in a format
that is compatible with the LARSPF.0 software for researcher data access and
analysis. The processed data include agronomic measurements, meteorological
measurements, instrument parameters, and experiment identifiers. These
other measurements are entered via the same record sheets used for process-
ing the Exotech 20C data.
The software system is documented and will be updated as needed. A
copy of the table of contents of the Multiband Radiometer Reformatting
Software Manual is given in Figure C-11. Presently the software system
has been tested using the Purdue/TARS Exotech 100 system data from 1978
and 1979 via computer cards as input. Additional tests and software re-
visions will be made when the data acquisition module becomes available.

-61-
4(
tty •
tl
M W ^' I— 1 1 !- ^ _-
t Y ^
T
Y 1- -1 J r 1 j_{..
a x ^;TTT,-- j- t-
lw
W r - - I _TT
4
T^V
s N
to
(+L N
Y ---yl
t C
M tom. —_'^y..._.j. • • ♦ ♦ f • _^. ^
«N R I - I : - -.1--y
^ h n t N S ^ m.. ^ .. .. ri r. ... .. w .. r •

-62-
i
VOs
YNid
c
N r
dr.
d Pd ^LN
F qcO e y`^c
O 4 N OQ L 0Y u u 0 u
.Pi u tp 7 A
.^I L ^ 7 w'J w d O u dU 1+ N 7 GN
a c u 0O ^+ u O
v uc oup
6 U22'O
9 m
CC = — vr,a N
Lj
>. ,q
C
S V
vi Y
N..11 Gd7
OY
dY
OY
Y
O
uNd
w
+1
Y
wzh.
v ^•Na0
a POW 'IP71_ Y
.aP^W 'IPD^^
vY WA G6
F
Y
7 VY Nd
e
__ _ _ r 1 1 TT ^ ^ i 1 1
I _
I
----1—•--_•.__• .---1--T-
I I
I
-4- 1 -f - +I —
4J
N
FO.H
Q
.n
6
co+4.J
Q
{4
r
Q
bco
r
S ^
e-^
T
H
^ U..tGJ
00
W
N N r^ 7 N ^ r f6 tr C+ 'T V+ .p f- fD C+

dV
aM
^ ro O u., C N C
u br
roV
,^ N
ru auro
O !LV
v ^ u S^ O ^.. a00 Y • YC
3O d V
R w w04 .4 O
PwV Y V
•r.1N G Vej acNp. 2 >Y
n{^. L
—C Ai
W bN
T4M
b uuN
ubJ
c
Ace
.. oWx ^9 l a<n • q
..r U
tJ N
ICI ^!
aG L +
mI
l.: aL I
>• R
Av C
ILa L.^
p f.Tj Y^m
at
bu -O
.] c wV V
7 Y b H
uw
roa Y _
Ob4 i+I-
baO v b
ub m
b:+ saewL. u
m N
w
M N
a w
rc
wu V CN b
N jw
N v
.., b D bNt,
Va c
w bo - > b u q u amy
.4 C 6N
u ^. eN C
F. N ro 7ro V M
C^•
u uN
I
L >>
w Mb 06 >
L. 4N h b0O
N7 ^
- ro
Q
i
i
U
00V4
W
n d)
V
OUd1934
td
cdo ^
ANd
rlb
a.d
cd
ti
u
i
-63-
•1 N M y N 10 h Ip p O •+ N n R r ^O h m P G.^ N r.l N '1 H N rl N A ry

-64-
.—,_ -^_.^ _^._
Multiband Radiometer Reformatting Software Manual
Table of Contents
Page
1. Instructions for Processing Multiband Radiometer Data. . . . . . . . . 1-1
1.1 Instructions for Running Reformatting Program. . . . . . . . 1-11.2 Description of Processing Output . . . . . . . . . . . . . .
2. Multiband Radiometer Reformatting Program Descriptions . . . . . . . . 2-1
3. LARS Field Spectrometer/radiometer Data Storage Tape Format. . . . . . 3-1
4. Multiband Radiometer Reformatting Algorithms . . . . . . . . . . . . . 4-1
5. Supporting 'rabl(!s or Disk Files . . . . . . . . . . . . . . . . . . . . 5-1
5.1 Experiment Names (EXPMF.NT NAMES) . . . . . . . . . . . . . . 5-25.2 Wavelength Band Identification (INSTMENT CODES). . . . . . . 5-45.3 Reflectance Calibration Tables (RFLSTND X100). . . . . . . . 5-75.4 Data Conversion Tables (PRT5 X100) . . . . . . . . . . . . . 5-115.5. Ephermeris Data (EPHEM DATA) . . . . . . . . . . . . . . . . 5-155.6 Print Format for IDPRNT (PRINTFMT LARSPEC) . . . . . . . . . 5-17
6. Instructions for Completing Data Sheets . . . . . . . . . . . . . . . . 6-1
6.1 Multiband Radiometer Data Record Sheet . . . . . . . . . . .6.2 Multiband Radiometer Calibration Sheet . . . . . . . . . . .6.3 Multiband Radiometer Measurement Record Sheet 1. . . . . . .
7. Contributors to Multiband Radiometer Reformatting System . . . . . . . 7-1
Figure C-11. Table of Contents for Multiband Radiometer Reformatting;Software Manual
3-65-
1
7. Interface Hardware and Software
In preparation for entry of data from the Data Recording Module, a
DR-11C Bit Parallel I/O Interface and a DD11-DF Bark Plane were installed
on the Purdue/LARS PDP 11/34A minicomputer. The installation is being
brought on line and should be completed early in December 1979. A pro-
gram for testing the interface has been prepared and additional interface
software is on order.
Entered data will be quickly stored in core memory until the entry
is complete. Data will then be stored on a disk awaiting transfer from
the PDP 11/34A to thA IBM 3031 for calibration and reformatting to LARSPEC
compatible format.
3
i

-66- .
D. ESTABLISHMENT OF SOILS DATA BASE
Eric R. Stoner and Marion F. Baumgardner*
1. Introduction
Although a large body of knowledge has been accumulated about the
physical and chemical characteristics of soils as they are influenced by
the soil forming factors of climate, parent material, relief, biological
activity, and time, there is only limited knowledge of how these factors
relate to the reflected radiation from surface soils. Earlier studies
have shown that information about the spectral properties of soils may be
useful in their identification and characterization (4,5,6,7).
Modern soil classification systems emphasize the importance of infor-
mation about the quantitative composition of soils. In order to differen-
tiate among soil groups, it is necessary to rely on laboratory measurements
of selected soil properties. Physical and chemical determinations of most
soil properties follow well established procedures of laboratory analyses.
Based on their importance in understanding the genesis of soil, certain of
these soil properties are selected as diagnostic criteria in the soil
classification process. By a procedure of empirical correlation, critical
limits between sets of soils are established, designed to reflect the in-
fluence of the soil forming factors of climate, parent material, relief,
biological activity, and time.
Quanritat.ive measurements of soil spectral properties have become
available as a diagnostic tool for the soil scientist with the advent of
such instruments as the Exotech Model 20C spectroradiometer. However, the
climatic and genetic effects on the relationships between measur.2d spectral
properties ant specific chemical, physical, and biological properties of
the soil are not well understood. Whereas soil color is used as diagnostic
criterion in the U.S. Soil Taxonomy (8), the determination of soil color by
*The contributions of Richard A. Weismiller, Larry L. Bichl, Barrett F.Robinbon, Virgil L. Anderson, John B. Peterson, Lou M. Nash and Lyn T.Kirschner to the experiment design, data collection and data analysis for:a q k 2.1D Establishment of Soils Data Base are gratefully acknowledged.

-67-
comparison with a color chart continues to be a rather nonquantitative and
subjective procedure, Spectral characterization of soil "color" by means
of quantitative spectroradiometric measurements may add to the precision
with which soils can be differentiated. With this increased precision of
soil spectral characterization, the relationships with the more important
diagnostic soil characteristics or qualities that are not so easily and
accurately observed may be better understood.
A study was, therefore, initiated in 1977 to develop a data base of
soil reflectance and physical-chemical properties and investigate the rela-
tionships of reflectance and important physical-chemical properties of
sails (1). During the current year the data base and initial statistical
analysis of the data have been completed and are summarized in this report.
Two, more detailed technical reports (2,3) describing the results of the
investigation have also been prepared.
2. Study Objectives
The general objective was to define quantitatively the relationships
between soil reflectance and physicochemical properties of soils of sig-
nificance to agriculture. Selection of soil samples with a wide range of
important soil characteristics by statistical stratification of continental
United States climatic zoates permits the evaluation of climatic and genetic
effects on the relationships between multispectral reflectance and these
soil properties. A further objective was to define the relationships suf-
ficiently to design further research to quantify the contributions which
different soil components make to the multispectral characteristics of
specific soils. The ultimate objective of this research approach is to
provide a body of knowledge in the form of a soils data base which will
render remote multispectral sensing a valuable tool for mapping soils, de-
termining land use capabilities and soil productivity ratings, identifying
crops and predicting crop yields.

-68-
3. Experimental Approach
3.1 Stratification and Sampling
Approximately 250 soils, representing a statistical sampling of the
more than 10,000 soil series in the United States were selected for this
investigation. Selections were made from a list of the more than 1300
Benchmark soil series representing those soils with a large geographic
extent and whose broad range of characteristics renders these soils so
widely applicable for study.
Stratification of soil sampling was used on series type location
within climatic zones. Climatic strata included the frigid, inesic, ther-
mic, and hyperthermic soil temperature regimes as defined by the U.S. Soil
Taxonomy (8,9,10) as well as the perhumid, humid, subhumid, semiarid, and
grid moisture regions as identified by Thornthwaite's 1948 *Moisture Index
(11). A random selection procedure was used within each stratified cli-
matic zone to select a number of soils series approximately in proportion
to the geographic extent of that region (Figure D-1).
3.2 Collection of Soil Samples
The Soil Survey Investigation Division of the Soil Conservation Ser-
vice (USDA) cooperated with the Laboratory for Applications of Remote Sen-
sing, Purdue University by taking responsibility for field collection of
almost 500 individual soil samples from 190 counties within 39 states. Two
separate soil samples were collected for each soil series, one at a site
near the type location for the current official series, and another at a
site from one to twenty miles distant from the first site in a different
mapping delineation of the same series. Samples were forwarded to Purdue
University complete with additional site information regarding; exact sam-
pling; location, physiographic position, slope, drainage, vegetatlon, and
parent material. Brazilian soils were sampled in connection with a soil
survey of Parana State, Brazil (12).

-69—
•
W En
co
••
W W WW it
0 OD
• T 0 rl ri
00 11
LL. ` t
C6 po
Ln
LL v lo
^..^ F '^..•^' W
3 ^OQDq
-_-_ ^P-

-Nm
T4 Oeyed R811 f mWR Im %R ^ % $1A%Bw tat mss l8f T pff ss ::
taRFe mRSHFFwts IR RR Rttm t8 stRWfAis tMg $Tmgm IR 148 r,44
the Hit 01 41s mAs slit ffmWR 18f mt 10smm q8t %1R%4BR§ Bf
s8}} w tf4 : 411 wieRSumRts nfg 'Rags 8R HA 8 1 "IRB t n44 0wecg SJH}}WIW I8T $1 4HFS Rt 9 8RF=tFRt wlttm isRWR RR Rs Fs=
t8s t 0qR tOlm . §$FF}RII^ FSR g tfmtFq 18 q4Rmf ^* z 8^, €} pl
t#th ^q w^ 1 4p tg ttRAS 414 t$8 R811 IR FlIFF t4s* 4s SER FS 04, sRE=HFRt}Qn; eH}}#^3Rt8n; RR$ s?eFttR^FRAA:
§8}} ^O±eFtRRFF SRS ^fFRwO H§14 RA Ww, kWsl N s FFE ° R$ =
amFtFF OlmA f9f 4488f Hit T04 R W}FFtmtFt m}R$Fd t44 RR Ff47
#c#a} #}}HTR}R148R sBHFFF; tFaOWFR 8FtlFS ,V RA$ s?^m$^F stR$F • ^PBctfRl
;eat}R s here to eR }A 9 : 9} }RFtemFRts BYeR thF 9 : ;3 ; ?, utn Wsye}eR t^'
range. Q }AAA ^stt tHR^stFR }8d}R8 F8#}F^ ^^}R^BRt }R^^ ^t^ ,y}$F$ ^RFide'^t
^;^ad^at}8R sim^}R^ t° thRt R^ s8}8^ }}}H^}RRt}8R: ^RFSsF$ ^Rt}1}^ su}taKe
was Hse$ as a FRl}hRt}8R ata^ldRd;}th leHSHFmFAts hF}#? ER^eR after
evF^y }€ sg#} sate}e t8 RFFBHRt t8 ^8ss^}F FhRRFS }R tF Intensity
pf thF i}}F}m}RRt}RR sBHfEe, 4 mgfF $F tF}}F$ FKF}FARt}8R 8^° thF #}sttume}t-
tatipt} ^s foµnd in Fe feReRFFS ^^: ^^^ ^^ sRd a:
xeReatable HF??t}tRt}`.'8 RFtR F 8 ^e }FFtFRFS mFRSHFgFFRts madeus p$ th#P prpeegRFp Is ev}$FRt pms^eFttB} FH vFS 8 FheF ssmRles ^nea-
sured oR each Rf OF teR 44yR BFFdFd t8 FHR 8YFF Pp }Rd}v}d} qa sqi} Pam-
ples (FipFe P-2) ^ ^4p48m s R }} e€}eFtHRFF tFFd}R s 8 t'F3 t Y segeratelyprepaxed F#{}castle s}}t }gam s4 } same}gp (R f#Rg=s}}ty Mlxed ^FStc Aeric
Achraaual f) gave vpFy si{ai}aF tesults.
4. Soil Properties Data Base
4.1 comp w Record i m NUCOR QUALd'fY
An idep ttficatioa rep4Fd cgnts^plpF 199 JtpTp of }p 8 Rat}Qp iTicluding
complete soil taxonomic classificat#qp a}gp$ kr}th site chspcter.stics and
laboratory analyses is available in computer taRe €grmat for all of the

-71-
+1 ST DV S-1 ST DVS .........
.4.6 1. 1.4 1.6 2.2
.8 1.2 1.6 2. 2.4
WAVELENGTH(MICROMETERS)
Figure D-2. Spectral curves representing the standard deviationsfrom the average reflectance values for twenty checksamples of a silt loam Alfisol measured over tendifferent laboratory setups.
40
30
20X
oc
10
0
-72-
soils in this study. This information together with digitized soil reflec-
tance data is accessible for editing and rapid retrieval of all soils in-
formation by means of the LARSPEC software package (16). Graphical dis-
play of soil reflectance curves as shown in this report is accomplished by
one of the LARSPEC processors while another processor permits selection of
specific soil analyses, site characteristics, and taxonomic data in the
abbreviated format used here.
4.2 Soil Atlas
An abbreviated format was chosen for presentation of selected soil
properties in an atlas of soil reflectance properties to be published as
a LARS Technical Report (3) and as a Purdue University Agriculture Experi-
ment Station research bulletin. Soils are arranged in this atlas by alpha-
betical order of the 39 states from which they were sampled. Four soils
from Parana State, Brazil follow at the end. Four soils are displayed on
each page, while information specific tj one of two field samples is given
in separate columns under each soil series name. A few soils are repre-
sented by only one field sample. A narrative key follows, with each num-
bered item of soil information identified in Figure D-3 described in detail
as it appears in the atlas.
Examples of various soils with widely-differing chemical, physical and
spectral properties are illustrated in Figure D-4. These data summaries
for twelve soils from seven of the ten soil orders represent only a small
part of the data for 251 soils listed in the soil atlas.
4.3 Narrative Key to Soil Information
Soil Series Name with Two-Letter State Abbreviation
The series is the lowest category in the soil taxonomic system. Names
of series as a rule are abstract place names with no connotation regarding
soil diagnostic properties. The atlas contains sail information for 247
of the more than 10,000 soil aeries recognized in the United States. Theme
247 soil series were selected from a list of over 1,300 benchmark HollH

73-
1) ONTONAGON (M I )2) Clossic Eutroboralf3) very fine. mixed4) humid zone5) glacial lake plain sediments6) Ontonagon Co.
7) Ap horizon8) B slope9) mod. well drained10) clay11) 7%S 22%Si 70%C
12) 2.5YR 3/6 (moist)5YR 6/4 (dry)
13) 4.88% O.M.
14) 38.0 meq /100g CEC15) 1.73% Fe203
Ap horizonB slopemod. well drainedclay6%S 29%Si 662C2.5YR 4/4 (moist)5YR 6 /4 (dry)3.95% O.M.31.6 meq / 1008 CEC2.76% Fe203
16) 47.5 MW%
43.2 MW% , ----
30
20--^^--
- r
17) pap 10 ,'
0 -1 1 1 i--i--F--+--F--+
.4 .7 1.1.3
1.61.9
2.2
WAVELENGTH (uM)
Figure D-3. Numbered guide corresponding to narrative key to soilinformation.

Aridlc Ar11iustoll
fine, sontworillonitic mesi;
seslarld zonesilty eolian sediments
Grant Co.
Ap horizonA slope
well drainedg ilt loam825 72151 202CIOYR 3/2 (moist)10YR 5/3 (dry)2.141 O.M.I1.4 seq/1008 CEC
Ap horizonA slope
well drainedsilt loam1215 70151 1820IOYR 3/2 (moist)IOYR 5/2 (dry)1.781 O.M.21.3 seq/1008 CEC
0.792 To 20 3 0.862 Te203
37.3 M4X • __ 35.6 MUX-___.
30
20
0
"4 .7 1. 1.31.6
1.922.2
WAVELE14GTH I wMI
NCWRRK(KY)
Aerlc Fluventic Paplsqueptfine-silty, mixed, nonacid. mrsic
hvmld son@
mixed alluvium
Daviess Co.
Ap horizonA slopes. poorly drainedsilt lose
2525 57251 182010YR 4/2 (moist)lOYR 613 (dry)1.532 O.M.1S.1 seq/100& CEC
Ap horizonA slopes. poorly drained
silt loam42S 792S1 I82ClOYR 4/3 (solst)10YR 6/4 (dry)2.842 O.M.17.0 meq/lOUg CEC
1.052 To 20 3 1.932 Fr 103
29.0 M►Y/. I - 34.1 Mu1
30
20
110
0
.a .7L/100
1.1.3
1.6
1.9
WAVELENGTH ImMI
30
20
x^10
^ 4.7 I 1.71.6
1.91.2
wAVELfNGTM I-M)
-74-
PRRTT(KS)
RICHFIELD(KS)
Psammentic Maplustalf
sandy. mined, thermicsulhumid son*
sandy #91106 depositsPratt Co.
Ap horizon Ap horizon
11 slope 5 slopewell drained well drainedfine sandy loam fine sandy loam7315 242111 32C 61x5 372111 21ClOYR 3/3 (moist) 10YR 4/3 (moist)7.SYR 6/4 (dry) 7.SYR 6/2 (dry)O.S52 O.M. 0.442 O.M.2.6 meq/1005 CEC 1.1 meq/1008 CEC0.311 Fe 203 0.251 To 203
11.0 MHX• - 13.4 MNX4_--_
30
20
K
0 .
4.7 1. 1.31.6
1.92.2
WAVELENGTH luM1
COLBY(KS)
Ustic Torriorthentfine-silty. mixed, calcareous. manic
semiarid zonecalcareous silty material
Mssilton Co.
Ap horizon Ap horizonA slope A slopewell drained veil drainedsilt loam silt loam22x11 54251 2410 1526 62251 242C10YR 5/3 (moist) lOYR 5/3 (moist)lOYR 6/4 (dry) 10YR 6/4 (dry)1.241 O.M. 0.851 O.M.30.3 seq/100& CEC 30.2 seq/100& CEC0.691 Fe20, 0.682 Fe203
37.3 MWY. • _____ 36.6 Mr'/.'___.
Figure D-4. Reflectance curves, soil test results, and site character-
istics in the soil data base.

q
-75-
WHITLEY(KY)
Typit Mapludulttine-silty, mimed, stoic
bust/ somepart alluvium, Part acid residuum
Laurel Co.
M I OLHN0(LH )
Typtc Ochraqualf
fine, sontmorillonitic, thtrsic
humid sane
clayey sediments
Acadia Parish
Ap horizon8 *lopewell drainedsilt loo2325 57251 202C10YR 4/3 (moist)IM 6/4 (dry)3.301 O.M.13.7 seq/LOOS CEC1.532 Fe 203
Ap ;orisona slopewall drained
silt loam1625 65x51 191CIOYR 4/3 (moist)IOYR 6/4 (dry)
2.:71 O.M.14.. seta/1008 CEC2.112 Fe 203
Ap horizon
A slope
poorly drained
silty clay loam
S%S 57251 382C
IOYR 4/2 (moist)
10YR 6/3 (dry)
2.422 O.M.
23.12 meq/1008 CEC0.882 Fe 203
Ap horizon
A slopepoorly drained
silty clay loam
32S GMI 1220IDYR 3/1 (moist)IOYR 6/3 (ary)
2.322 O.M.
27.3 meq11008 CEC0.622 Fe 203
18.5 MC/.-- 95.9 Mw% O ----
30
20
x
'^ 10
0 4--$ 1--+-+- +- + t.4
.71.
1.31.6
1.92.2
WAVELENGTH IwmI
CALHOUN(LA)
7yPic Clossaqualffint-silty, mixed, thersic
humid son*loess
East Baton Rouge Parish
Al horizon Al horizon
A slope A slopepoorly drained poorly drained
silt loan al)t loam
1515 71251 142C 2025 69251 IOUIOYR 5/3 (soist) IOYR 5/3 (moist)10YA 7/3 (dry) JMR 6/4 (dry)1.742 O.M. 2.402 O.M.7.1 meq/IOOS CEC 11.4 meq/1008 CEC0.601 ►* 203 0.72 Fe 203
34.6 MW/ ._ 33.7
37.7 Mw7.- _._.- 11.2
30
20
an 10
.s.7
1.1.3
1.6:.9
2.2
IIAVEIENGTH I rMI
KENNER(LA)
Fluvaquentic E.tdisaprist
euic, thermichumid zone
herbaceous plant remains with clayey
alluviumJefferson Parish
,el horizon Oel horizon
A slope A slope
v. poorly drained v. poorly drained
suck muck
4%S 401Si 562C 32S 31251 661C
7.5YR 210 (moist) 10YR 211 (moist)
IOYR 211 ';dry) IOYR 2/1 (dry)
55.141 O.M. 54.3b1 O.M.
73.6 seq/IOUs CEC 82.1 meq/1008 CEC
0.001 Fe 203 0.001 Fe203
77.2 Mw7.-_ _ 73.1 MW%--___
30""
301
20 20
X
^ ' V10 i a^
10
0 ^-+ ^-+ -+-^ p -r--r f -4 + + 1- + -+--4- -4 . i
.I.T 1.3 1.9 .7 1.9 1.9
i. 1.6 2.2 I 1. 1.6 2.2
WAVELENGTH IMMI W4VELENGII+ IrM I
Figure D-4. Continued. er t .^^t

30
20
'& 10CO
0.4
.71.
1.31.6
1.92.2
WAVELENGTH ( ISM)
3030
20
oc 10m
20
IX 10m
0 '^ 71.
1.31.6
1.92.2
WAVELENGTH (-MI
0 .4 .71.
1.31.6
1.92.2
WAVELENGTH I rM )
-76-
CASCAVEL(PR.BRASIL)
9aplic Acrorthozvery-fine. oxidic. thendc
hes4d manebasalt
M+oitipio of Cascmml
Al borisonB slopeexcess. drainedClayISIS l8ZSi 67ZC2-SYR 3/3 (moist)2.STR 3/e (dry)3.552 O.M.19.8 meq/1008 CEC23.32 Fe203
ORTHOXs._
GUARAPUAVA (Pry . BRAS I L )
r,•pic Acrohumoxvery-fine, oxidic. thervdc
humid zoneandesite
Hunicipio of Gaarmpuava
Al horizonD slopeexcess. drained
clayGZS 46ISi 48ZC7.5YR 3/2 (moist)7.5YR 4/4 (dry)9.232 O.M.41.6 amq /lODS CE;14.02 Fe203
HI)MOX s _
PRTO BRRNCO(PR.BRRSIL
Haplic Acrorthozvery-fine. kaoliritic, thermic
humid zonebasalt
Muricipio of Pato Branco
Ap horizonB slopesxcess. drainedclay
92S 232Si 6820SYR 3/2 (moist)SYR 4/4 (dry)3.702 O.M.20.2 seq/1008 CEC11.22 Fa203
CRTHOX s -
30
20
o e10in
.47
1.1.3
1.51.9
2.2
WAVELENGTH I.MI
LONDRINR(PR.BRRSIL)
lypic Haplorthoxvery-fine, kaoliritic, hyperthermic
humid zone
basaltMunicipio of Londrina
Allp horizonC slopeexcess. drainedclay9ZS 142Si 772C2.5YR 3/6 (moist)2.5YR 4/6 (dry)2.282 O.M.22.1 meq /100g CEC25.62 F-t2f 3
ORTHOX#-
Figu a D-4. Continued.

-77-
whose large geographic extent renders them an important part of a state or
resource area. Soil samples were taken from sites within states having the
respoc.sibility for maintaining the standard series description for that
soil series. Data from these soils are widely applicable to soils occurring
in the continental United States.
Soil Subsroua Name
Subgroup names consist of the name of a great group modified by one
or more adjectives. About 970 subgroups are currently recognized in the
United States. The name of a great group consists of the name of a sub-
order and a prefix that consists of one or two formative elements suggest-
ing something of the diagnostic properties. There are about 225 great
groups in the U.S. soil taxonomy (8). Names of suborders have exactly two
syllables. The first syllable connotes some information about the diagnos-
tic properties of the soils while the second is the formative element from
the name of the order. Forty-seven suborders are recognized, while there
are only ten soil orders.
It has been observed that high organic content surface soils of the
Mollisol and Histosol soil order frequently have a concave-shaped reflec-
tance curve in the 0.6 to 1.3 Ian wavelength region. Lower organic content
surface soils of the Alfisol soil order frequently have convex-shaped re-
flectance curves in the same wavelength region. Reflectance curves for
surface soils of the Ultisol soil order often resemble those for Alfisols
except for the presence of slight dips in the curve at 0.7 and 0.9 um
caused by iron absorption. It should be understood that these generaliza-
tions about soil reflectance of certain soil orders are only an aid to
facilitate the appreciation of differences in spectral properties among
surface soils. Soil orders distinguished primarily by subsoil horizon
properties cannot always be expected to show characteristic reflectance in
the sii: :ee hori -on.
Soil Family Modifiers
Names of soil families are polynomial, consisting of the name of a
subgroup and adjectives. These adjectives L'escribe the particle-size

-78-
class (11 classes plus others if strongly contrasting), the mineralogy (20
classes and a few subclasses), the temperature regime (8 classes), and, in
some families, depth of soil (3 classes), consistence (2 classes), moisture
equivalent (2 classes) and other properties. Names of most families have
three adjectives modifying the subgroup but some have only one or two and
others have four or more. Soil properties are used in this category without
regard to their significance as marks of processes or lack of them. About
4,500 families are presently recognized in the United States.
Redundancy is avoided in naming families, thus, for example, the modi-
fier frigid is left out of families in which the formative element bor in
the suborder name indicates soils having a frigid temperature regime. Par-
ticle-size distribution and mineralogy are specified for only those horizons
of major biologic activity below plow depth.
Soils have been observed to increase in reflectance with increasing
soil temperature. This is most likely explained by decreased organic matter
contents in warmer regions. Lower organic content soils reflect more than
those with elevated levels of organic matter.
Soil mineralogy appears to influence soil reflectance in various man-
ners. While soils with gypsic mineralogy reflect highly because of the
inherent reflectance properties of gypsum, montmorillonitic soils, often
associated with higher organic matter levels, show low reflectance attribu-
table to this high organic matter content.
Moisture Zone i
Although the soil moisture regime is an important property of a soil,
the moisture regimes defined in the U.S. soil taxonomy are not always in-
cluded in the taxonomic name, and are defined not necessarily by climatic
1 4
moisture zone, but rather in terms of the ground-water level and the pres-
ence or absence of water held at a tension less than 15 bars throughout the
year. Moisture zones in this atlas are defined in terms of climatic mois-
ture zones as described by the Thornthwaite moisture index (11). Five main
moisture zones are defined on this hisis in the continental United States.

-79-
Soils from wetter climates ge*aernlly reflect less than those from dry
climates because of organic matter accumulation under higher rainfall con-
ditions. Exceptions to this rule occur when soils are formed under prairie
grass vegetation in drier climates.
Parent Material
Parent material, as the initial geologic material from which soils are
formed, can be expected to demonstrate an eventual influence on soil reflec-
tance. Certain soils referred to as lithochromic are even known to owe
their spectral colors to inheritance from the parent material rather than
from soil-forming processes. Parent material types listed in the atlas
were obtained from the established series profile descriptions for each soil.
Count
The county wi 1 1 = n the state where soils were collected is listed in
order to specify the sampling location for each of two sets of samples
whose analyses follow.
Horizon Designation
All soil samples represented only the surface soil, containing mate-
rial from 0 to 15 cm (0 to 6 inches) if depth to a A horizon permitted.
Those surface soils under cultivation or which still show the marks of cul-
tivation are designated by the symbol "p" following the capital letter sym-
bol for the horizon. Undisturbed soils are represented by horizon desig-
nations such as Al, All, Al-A21 and All-Al2.
Slope Class
Relief, as expressed by slope class ,g rouping, is an important soil-
forming factor that is characteristic of each site ill soil landscap .
Slope classes in this atlas follow the convention of capital letter symbols
D, 12-18°:; E, 18-257, C, 11.5-35%; G, greater than 35:,.

-80-
Internal Drainage
All soil series have a specific internal drainage which is indicative
of the local landscape position and broader climatic conditions under which
they formed. Drainage classes used in this atlas are as follows: v. (very)
poorly drained, poorly drained, s. (somewhat) poorly drained, mod. (moder-
ately) well drained, well drained, s. excess. (somewhat excessively) drained,
and excess. (excessively) drained.
Soils have been seen to show overall decreased reflectance with in-
creasingly poorer drainage. Very poorly drained soils reflect considerably
less than any of the other drainage classes at all wavelengths. As a site
characteristic integrating the effects of climate, local relief, and accu-
mulated organic matter, soil drainage characteristics are closely associated
with reflectance properties of surface soils.
Textural Class Name
Twenty-one textural class names have been defined in terms of size
distribution of five sand size fractions plus silt and clay as determined
by mechanical analysis in the laboratory (8). Organic soils are identified
by using the term muck in place of the textural class name,.
Because textural class names are defined wholly in terms of size dis-
tribution, the actual consistence or structure of the crushed, sieved soil
samples may nut necessarily be conveyed by this name. Highly aggregated
clays iaay in score cases present surface structures similar to that of coarse
sands. Use of the textural class name, however, is still the best available
conventio -t fo- expressing the size relationships among soil separates.
Percent Sander g ilt, and Clav
Particle size analysis was performed on organic matter-free soil por-
tions (17). Clay and silt contents were determined by sedimentation—
pipetting while fiv,,, sand size fractions (here summed to give one sand
amount) were separated by passing tnrou f,:l a nest of sieves.
-81-
Decreasing particle size has been seen to increase soil reflectance
among sand textured soils, possibly by forming a smoother surface with
fewer voids to trap incoming light. The inverse appears to he true with
medium to fine textured soils, however, possibly because increased mois-
ture content and organic matter content associated with higher clay con-
tents lead to lower reflectance.
Munsell Color Designations
Color standard comparisons were obtained at two soil moisture levels:
air dry and field capacity. Moist soil colors were obtained by moistening
samples and reading the color at a point in which visible moisture films
were not present. Dry soil colors were obtained on the air dry sieved
samples. All soil colors were determined by comparison to standard color
chips of the Munsell Soil Color Charts.
Munsell designations for color consist of separate notations for hue,
value, and chroma, which are combined in that order to form the color desig-
nation. The symbol for hue is the letter abbreviation of the color of the
rainbow preceded by numbers from zero to ten. The notation for value, or
relative lightness of color ranges from zero, for absolute black to ten,
for absolute white, Chroma, or saturation, is the relative purity or
strength of the spectral color and increases in number with decreasing
grayness.
It is important to remember in comparisons between soil reflectance
data and soil colors that the wavelength region of human physiological per-
ception of visible reflectance extends only from about 0.4 to 0.7 µm, while
reflectance data presented here extend from about 0.5 to 2.3 pTn. While the
color imparted to a soil may be due to specific absorptions in the visible
region, it may also he caused by intense absorptions outside the visible
wavelengths in either the ultraviolet or near infrared, the influence of
which may extend into the visible. This points out the importance of having
a full range of reflectance data from the visible to the middle infrared for
thorough characterization of soil spectral properties.

-82-
Organic Matter Content
Organic matter contents were determined by the modified Walkley-Black
procedure of acid dichromate digestion with ferrous ammonium sulfate titra-
tion (17). Organic matter appears to be one of the dominant soil parame-
ters responsible for imparting spectral properties to soils. Increased
organic matter contents as a rule lead to decreased reflectance throughout
the reflective spectrum. Many cases can be seen in this atlas where dupli-
cate scil samples with otherwise similar properties exhibit different re-
flectance curves because of slight differences in organic matter content.
Although increased organic matter content has been seen to decrease
soil reflectance in mineral soils, the form or decomposition stage of or-
ganic material is more important in understanding reflectance properties
of organic soils. Less decomposed organic materials have higher reflec-
tance in the near infrared region because of enhanced reflectance attribu-
table to remnant cell structure of well preserved fibers. In contrast, very
highly decomposed organic materials show very low reflectance throughout
the 0.5 to 2.3 Um.
Cation Exchange Capacity
Cation exchange capacity (CEC) was measured for each soil sample as
the sum of extractable cations of Ca, Mg, K, Na, plus extractable acidity,
all expressed in terms of milliequivalents per 100 g of soil (17).
Cation exchange capacity is frequently seen to have a high negative
correlation with reflectance, especially in the 2.08-2.32 }¢n middle infra-
red region. Although there is >> direct physical basis for this relation-
ship, it seems that cation exchange capacity is acting as a natural inte-
grating factor for clay type and content as well as organic scatter content,
soil parameters which exhibit inherent spectral behavior.
Iron Oxide Content
Free iron was measured by the so-called CBD procedure (17). Ferric
iron absorption bands can be seen in certain soil reflectance curves in the

-83-
0.7 and 0.9 M wavelength regions. Broad bands at these wavelengths fre-
quently occur in high iron content soils; while a sharp, narrow absorption
band at 0.9 ltm is evident in many soils of relatively low or even negligible
iron content.
Different forms of iron oxides are known to impart red and yellow
colors to soils. Reflectance data in this atlas indicate that near infra-
red absorption may be partly responsible for coloring in high iron content
soils.
Moisture Percentage by Weight (:dW%)
Soil moisture content by weight was determined gravimetrically on the
soil samples used to obtain reflectance measurements. All soil samples were
equilibrated at a one-tenth bar moisture tension, so resulting moisture dif-
ferences are closely related to clay type, soil texture, and organic matter
content. All other properties being equal, an increase in soil moisture
content decreases soil reflectance at all wavelengths.
Strong water absorption bands at 1.45 and 1.95 M are present in all
of the spectral curves of these uniformly-moist soils. Weak water absorp-
tion bands at 1.2 and 1.77 um are seen in some loaf organic content fine
sandy soils. Actual soil moisture content has been seen to be most highly
correlated with soil reflectance in the 2.08-2.32 um region.
Plot of Bidirectional Reflectance Factor (BRF%) Versus Wavelength (=)
A convenient standard measure of reflectance that closely simulates
the directional characteristics of illumination and viewing in en airborne
remote sensor is the bidirectional reflectance factor. Bidirectional re-
flectance factor can be described as the ratio of the flux reflected by an
object under specified conditions of negligibly small solid angles of irra-
diation and viewing to that reflected by the ideal, completely reflecting,
perfectly diffusing surface, identically irradiated and viewed (18).

-84-
Wavelength, expressed in micrometer (lam) units, denotes the portion
of the electromagnetic spectrum under consideration. Wavelength regions
frequently referred to are the visible (0.38-0.72 lun), near infrared
(0.72-1.3 lam), and middle infrared (1.3-3.0 lam).
5. Numerical Analysis
5.1 Statistical Correlation Studies
For the purpose of statistical correlation all soil spectral curves
were represented by ten spectral bands (Table D-1). Bands 1-8 all have
bandwidths of 0.1 um. Bands 1 and 2 are visible bands. Bands 2 and 4 are
centered on the regions of known ferric iron absorption. Most of bands
1-8 resemble, but may not coincide exactly with existing bands on Landsat
or Skylab S192. Bands 9 and 10 are proposed Thematic Mapper bands with
band 10 being slightly altered by the cutoff of spectroradiometric data
at 2.32 ltm.
Table D-1. Soil Spectral Bands for Correlation Analysis.
BandWavelength Spectral
BandWavelength Spectral
(11M) Region Offn) Region
1 0.52-0.62 visible 6 1.02-1.12 near IR
2 0.62-0.72 visible 7 1.12-1.22 near IR
3 0.72-0.82 near IR 8 1.22-1.32 near IR
4 0.82-0.92 near IR 9 1.55-1.75 middle IR
5 0.92-1.02 near IR 10 2.08-2.32 middle IR
Statistical correlations between five soil parameters and reflectance
in these individual bands is listed for various groupings of soils (Tables
D-2 and D-3). Correlations are seen to improve with more specific climatic
grouping of soil data. The 95% confidence intervals on the correlation
coefficient give an idea of the range of correlation values that can be
expected based on the number of soils in each climatic grouping.

_^ LO
C ^ A
e ^ vr M
^wu LY
^ sla
"1 62w
i NM
°3r Nr r rN Q ISt.t aw O vC^a
N.- wNrv O'
pp
1O Y
O a OIYYY N L'
0— ^+Y Nw
.^ LL + wL
r N ^c >
443 L
NAa^
E
N
e^O Y
C r^
Y r Y
r iY
w .+ + LO. S. N Ma r
r 9ON
N
_N H
vp^
Or
NMw
r Y0^p c
L r0144_Y rM N
Y8
o NI
PI • r 1 r 1v vy v y v yL xf V
V-1L/ r V N yyyyyL
1
.^.^ lot ^f INnr 1A L
r lN`
^ 140L.
m 1an 16f V NV V IDV
1 In 1 In 1 In / h
to^•fn vv L
^ev,1 1n
N_10N 1v y
V
1 A
-85—
h
O 1 N
^V
A
^ yy1
A
O yy1
ID
1•• 1
I N •r^V
NIW!
I b ^16I f1 1 1 1
.-
O f10 1
Vf^1 II1
•
+^^r y1O LInd
on
IDp^^ 1 V^LhonIh
.-Opp.^/vVNL.N^/f•1
In
Off.10 1•.+VhL1•IhIf
1 1 1 1 1
0 0 o gom Vr% o a o ^^Av 1 w V 1 A+ I w r —00 1
V V X N^V N — V way/ A S V w^V MTV^^ ` CIA L.^^ h L 40 L 100 LrA ^h L LY•v YN^ YIDvTf c1D V U-11: 4 YN YIn^ C3^• ^ ^ • 1D / f 1 1•! 1 1D ^ 1 hi i 1 1 1 I 1
^ 1 ^ 1 r N 1yy yy yl yyf V A V PIV hVII^n 1^/m IA
1 1 1 1
f Or• 1 10 1 f•1 1 Ny
` 1100 V ^ V IH Y A LIA I In 1 Im
111 1 1
y1}.r y/m L
^ y1O L
O 1y1n L
f Y1 f
•1^I In
fO N1 A
A ((VyyI O
1 1 1 i
3 Sn'on
r• 11.1• V1^
^ vy1
f0 410 V.-I A
\` 1LVOI1 ID
Pf yy1
in Lh Vf1yy/ W
1 1 / 1
C uw P 10 ur ^- + T r ^1
OM
IAO
mL ♦ ON wL
N r BO rco
3N
a10wr
1010w .°+
010Lr N
Nr f
^q¢
► N
r M 7 ami. •Aw N 401 NI
ffV =

O
i NT r°e
C Yr Q
Y
M
^• Cr s^ a
r _
L YN
rO ^^11M wL
M. 9M
yjC G
M
N ^.
ry yw ^
C M tU 40r r NNM Q
A ^ ftr_ L
O y 0W Q
7wl
Y NC
in a L
w
^• x CO0
C OI.r.2 Ioi uM. a
L
SON
_Y M
y YdY^ bN N
N
O
9"
L
004Or
Np7 2L yat
N N_yM1 MMM
^Ovg
A•••IpQv Vin L.
1 O1
^Ov V
1 A1
O Mrv /VNv1
1
Ov L
1
1
^A ^NO
1 p 1
G! vV
^N
IQJ li0
1 1
A i0
V v y11a v ^ L
1 m 1 m
1 1
-86-
tV^p` ` OL 1 VV '"' V —Vfp► Y^y ^:N Lyy. f N L NL nL
y• • • OI in M. O ' /V% •• V i0 V m AVr+ 1 1'f 1 M f 1 N 1 1 I^^. NN ' N1 ^
1 1 1 1 1
fr'1^ i~0^b
^^ r^A.MSID .r• r ^^ ^rN
n vL@GN
`W
w` w` '' Vr L 1:, r $ r Z V v r.^^
I NAA ooV A^ iON V qr V v ." oV f VAIAI 1Qi IA IA 1 ^ /N 1^ IiNO1 1 ;
I W1 1 , , : 1
ram Y M A M pCONr r.INO pr ^M; —in A N w0^ owl .0 MMy Y Nvyy ^^ yy1 Amy ^O 1 ^^Qyy i1O yy1 N N Nyy Nr ilf'f 1 A f^A V a—V` m`^M L. AL.+.M L•i0 L EAf. G ML EyNvyp{I P!
Cl P y y N V y10 V yi0 V NA V y i0 V f V D1p V y10 V YA VCc N GG p ^y^ N ` Iff 1 i0 1 ^ 1 ^ ^ 1 A ^ f0•f 9 .0 1 ^ C N
1 1 ^ ffRl • y ^
1 1 1Yi
m mN
Or ^h
V V y1 r y1v N ` 1N0 v
N NII N I M I A
1 1 1
N a^N N _ 1+0 A ^ N M ^ O .+ f1O .^. O _r A _Nr 1 r l m 1 ^^ i0 1 N 1 r 1 N 1
i0L vippL rL "V V ryyL vV M V vV N 1i0 V i0 V A V A V m y iNp v N V fN^/ V yPj v a L A L
f. N . A on 0i1 p , N A V to Vul
I A I A I A 1 IQ I N / A 1 i7/ 1• / A 1 /0 / A
1 1 1 1 / 1 1
^ T y. yP r C
[ r N^.E Y
^yN^1
E r IHNtJ• iD
Q• M^ 9N o10 ^Q yNT o
r `• v N E1^1 aN
^ LN in N N E do
N N
P ^ rT NN
y ^^11^ m E N .C p^f`
/"1 4 A M 1p
F

-87-
Reflectance in all of the spectral bands is seen to be negatively
correlated with the natural logarithmic transformation of organic matter
content. Reflectance in the important 2.08-2.32 Wn band is negatively
correlated, in addition, to moisture cont..nt, cation exchange capacity,
iron oxide content and clay content, while it is positively correlated
with medium and fine sand contents.
5.2 Prediction Models
A forward stepwise inclusion procedure was used to estimate the reflec-
tance in individual wavelength bands using certain agronomic and site char-
acteristics as predictors. The importance of climatic zone, parent material,
and drai..age characteristics in explaining soil reflectance was brought out
in this analysis (Table D-4). Other soil parameters had an expected in-
fluence on reflectance, with organic matter being the single most important
variable in all but band 10, where moisture content was the first variable
,'.o be included in the regression equation. Although the R 2 values were not
high for this analysis of 481 soils, the inclusion of site characteristics
pointed to the importance of these soil-forming factors as contributors
to soil reflectance.
Prediction models for certain soil parameters using only soil reflec-
tance data as inputs reveal high R 2 values when soils are grouped by spe-
cific climatic zone (Table D-5). The importance of visible, near infrared,
and middle infrared reflectance data is seen repeatedly. Iron oxide has
high predictive values only in the humid frigid and some arid regions.
Results are highly climate specific. As in previous studies of this type,
cation exchange capacity often shows higher R . values than other soil pa-
rameters which are known to exhibit inherent spectral behavior. Cation
exchange capacity seems to be acting as a natural integrating factor for
several other soil parameters such as organic matter and particle size.
Extending these results to the level of airborne remote sensors, it
is likely that reflectance dat:F .ron carefully selected wavelength bands
could be used to extract information from bare soil areas that could be
related to levels of organic matter, soil moisture, iron oxide content,

eNC
L
VyGN
wa9
c
u
MyY
yL
0
0MVvVLnMA
MYVN
L4
U
Lwru
Y
Mc
A
r
0
N
Ld
QWri
CNO
A7
cM
vLrN
m
NOc
wLA
C•
r
L
W
i
Y
ri
1s1i
-88—
F-
~ sn0au6t
It}An{lt
~ au}Jew
^Je3uawtpas
---------------1-taooa
Xpood 324MawOSL
---------2twJ843 pt^e
2tsaw ptJt
p0l . ; p ► Jt
3tuua43Jadjf4 pp etwas
3tsaw ptJe}was
., p16tJ; ptJetwas
31uu441 ptwn44nsV
Otsaw ptwn4Qns
p t5p; ptwn4Qns
Dtuu241 ptwn4
3tsaw ptwn4
pl6ti; ptwn4
jua3u03 aptxo uoJt
ua un^ ate• Y 3 1 tu^T 3ualu03 1l}s out;
L Lo luslu03 puts out;v u
346 tar, RqCL u a6irjuanjad aJnlslow
----------------------
N
v9C
h
O
&n N
OI A O OI
a o
W h h m
10 PI 1"1 wf %n m
h 10 Pf N N N fr
0
10 H7 W
to
at
M1 f f f 0%
on f %n f f f
f 10 10 N In In
h N N N N N -In on f"f In
m r
o atr
O f Or
0% b
N %n m 10 h h O^ 10 h
m ^ O/ m m ^ h m
W --
r r .- ^ r r r r .- n
/y .-..N.- .-. N .-. rN-f r ^ ^ rNi .--• IN C% N PI N N W O ^O Y1 PI • In • G910 IA /^ 10 W ^0 W W • H1 r VS r V7 r H1 r f N Q i1 v/ v I v 1 v/ -.+N +.•NON vI/1 ---eA^N N • N N N O I,! IA OV) 10 h W OI
N'
r v v v -i v v v .^ vr N A f V1 10 h m Oh O i
F

-89-
Q P o 0^ .- P P O O ^ wf•+ • Q N ^p N
^: O ^P •1 • N
V Y C O o r-• P b AO A N P r f•t r r r• A ^.O Aa ll, OfP O AG M COQ N• fN NN %nf 1 nh f•f rq, ►- O • ►
AO•rw
L
oV
• r •rCDP
^r •N •- rN N ^ N ^ N P O^ • PYU
C
401.4W w
c O O o
N
w
•+ L V
O ^O P ^0 n h ^0 n ao A• N A O A ^0 +^L • v ^a .^ .^ .gyp .00V
.p•I •Ob Y P N A
.OPf r •.CD.r r P Q^ r r .^ Pf f .-•
L
C6 C ^ rT r Or Y Y r ♦ _O •.T ko
N .- r t'f r O • A C N f-1 P O O^► ^ ^ M^+V- _^♦+ N O^ wO w^~ ww^h ww+^
NwOv APr w+nO w - SqP
O Yt^ Yf frPf rHTf r• h -.•- ^0Ar0^ - f ^r 10 ^-•-^^ oL Nr U • N C U • P V -V •O^ V -V •O^ V •P V -V•r - C•rte •ONt .- .- Ma .- c ^:- r o •40 o c o - r-Or N
N.-O
v .^ P r P r of .^ r ^+f wf •_V Y N
pL
L L r r rQ Y V
O Y CPI co N f N46 44
aCw C r 1A h ID 0: f ® P
.- M ^1M^ j Y^O^ O NP1 A •^A P/ O N h A `^O r ^A O Wn P1Ni^17 ^ ^ ,m •N
10 fG•P
of•Y1
P A• N
h Pf•fD •P •I^f • •PQ ^ . -
a Y E ^° ^O• C 0 0 0 o C; C; o ^- cV ^ r r .+ ^- ^ RI rC
w YN .• r
^• Os: a o a ao
IC
•eC• v m 0-1 0= 0% ^r. A N ^0 f•1 %0 . r h .0 Q f N O 1Qw Q1Y • f • of • ,^ . f • p^ • r-
^ •0+ •O •Or •^M O OI P1 M1 0S r •V r C!
Y 6VC
N
wv vG
u w NY N
06 45
Vu v
N A ^V
^ ^E ^ N G a N ^ V! ^ a T E ^r
p Y, r. ^ ^ L ^ C N
Nod dw Nr 4N4
E6n ~%0 ~kb V^D yO N LfV ^' A Y i0 f _%0f 1'f Q •-' ^" f N_0 P'1 a+ NN V _0
u'tY p EE L w L L T^
C6 S w E w
wO ^ S d ~E L @ wrU N M ^N M N MO
.0H

-90-
particle size content, or even an indicator of potential productivity
such as cation exchange capacity for certain specified climatic areas.
Where prior information is available about soil drainage and parent mate-
rial classes, even better correlations can be expected within more homo-
geneous areas of soil inference.
5.3 Discussion of Results
Based on results of statistical analyses as well as on qualitative
evaluation of soil reflectance/absorption characteristics, the following
wavelengthsare critical for identification of soil reflectance character-
istics: 0.52 to 0.62 W (green wavelength region highly correlated with
organic matter content), 0.7 Wn and 0.9 dun (ferric iron absorption wave-
lengths), 1.0 pm (ferrous iron and hydroxyl gibbsite absorption wavelength),
1.22 to 1.32 M and 1.55 to 1.75 pm (regions of highest reflectance for
many soils, correlated with many soil properties), 2.08 to 2.32 ►gym (region
of highest correlations with soil moisture). Although spectral bands for
the Thematic Mapper sensor include 0.52 to 0.60 pmt, 1.55 to 1.75 = and
2.08 to 2.35 um, the 0.76 to 0.90 pm near infrared wavelength band is too
broad for specific iron oxide studies in soils, a fact that could limit
its usefulness in erosion studies as well as soil productivity surveys.
It can be seen that soils with widely-differing physicochemical and
site characteristics are no more similar in their reflectance properties
than are different species of plants throughout their growth cycles. To
treat soil reflectance as a constant, unchanging characteristic from loca-
tion and from date to date is to ignore the well-ordered physical and chem-
ical relationships that impart diverse spectral reflective character to
soils. The soils data base developed in this study should help further
an understanding of the diverse nature of soils as they would be viewed
by remote sensors.
C-"2---

-91-
6. References
1. Bauer, M. E., et al., "Agricultural Scene Understanding," LARS Con-tract Report 112578, Laboratory for Applications of Remote Sensing,Purdue University, West Lafayette, Indiana, November 1978.
2. Stoner, E. R., "Physicochemical, Site, and Bidirectional ReflectanceFactor Characteristics of Uniformly-Moist Soils," Ph.D. Thesis,Purdue University, West Lafayette, Indiana. Also published as LARSTechnical Report 111679, November 1979.
3. Stoner, E. R., M. F. Baumgardner, L. L. Biehl, and B. F. Robinson,"Atlas of Soil Reflectance Properties," LARS Technical Report 111579,Laboratory for Applications of Remote Sensing, Purdue University,West Lafayette, Indiana, November 1979.
4. Bowers, S. A. and R. J. Hanks, "Reflectance of Radiant: Energy of Soils,"Soil Sci. 1-00:130-138, 1965.
5. Cipra, J. E., M. F. Baumgardner, E. R. Stoner, and R. B. MacDonald,"Measuring Radiance Characteristics of Soil with a Field Spectrora-diometer," Soil Sci. Soc. Amer. Proc. 35:1014-1017, 1971.
6. Condit, H. R., "The Spectral Reflectance of American Soils," Photo-grammetric Eng. 36:955-966, 1970.
7. Montgomery, 0. L., "An Investigation of the Relationship Between Spec-tral Reflectance and the Chemical. Physical and Genetic Characteristicsof Soils," Ph.D. Thesis, Purdue University, West Lafayette. Indiana.Also published as LARS Technical Report 082776, August 1976.
8. Soil Survev Staff, "Soil Taxonomy--a Basic System of Soil Classifi-cation for Making and Interpreting Soil Survey," Soil Conservation 3
Service, U.S. Dept. of Agric., Agriculture Handbook No. 436, Washing-ton, D.C., 1975.
9. Smith, Guy D., Ranklin Newhall and Luther H. Robinson, "Soil Tempera-ture Regimes, Their Characteristics and Predictability," SCS-TP-144.Soil Conservation Service, U.S. Dept. of Agric., Washington, D.C., 1964.
10. FAO-ITNESCO, "Soil Map of the World, Vol II: North America," UnitedNations Educational, Scientific, and Cultural Organizat ; on, Paris, 1975.
11. Thornthwaite, C. W., "An Approach toward a Rational Classificationof Climate," Geograph. Rev. 38:55-94, 1948.
12. Fasolo, P. J., "Mineralogical Identification of Four Igneous ExtrusiveRock Derived Soils from the State of Parana, Brazil," M.S. Thesis,Purdue University, West Lafayette, Indiana, 1978.
13. Silva, L. F., R. M. Hoffer, and J. E. Cipra, "Extended WavelengthField Spectroradiometry," Proc. 7th International Symposium on RemoteSensing of Environment, Ann Arbor, Michigan, pp. 1509-1518, 1971.

-92-
14. Leamer, R. W., V. I. Meyers, and L. F. Silva, "A Spectroradiometerfor Field Use," Rev. Sci. Instrum. 44:611-614, 1973.
15. DeWitt, D. P. and B. F. Robinson, "Description and Evaluation of aBidirectional Reflectance Factor Reflectometer," Technical Report091576, Laboratory for Applications of Remote Sensing, Purdue Univer-sity, West Lafayette, Indiana, September 1976.
16. Simmons, W. R., S. Wilkinson, W. C. Zurney, and J. L. Kast, "LARSPEC:Analysis Program for EXOTECH Model 20C Model 20C Data," LARS ProgramAbstract 5000, Laboratory for Applications of Remote Sensing, PurdueUniversity, West Lafayette, Indiana, 1975.
17. SCS-USDA, "Soil Survey Laboratory Methods and Procedures for Collect-ing Soil Samples," Soil Survey Investigations Report No. 1., U.S. Govt.Printing Office, Washington, D.C., 1972.
18. Nicodemus, F. E., J. C. Richmond, J. J. Hsia, I. W. Ginsberg, and T.Limperis, "Geometrical Considerations and Nomenclature for Reflec-tance," National Bureau of Standards Monograph 160, U.S. Govt. Print-ing Office, Washington, D.C., 1977.

-93-
E. FIELD RESEARCH DATA BASE MANAGEMENT AND SOFTWARE DEVELOPMENT*
Larry L. Biehl
The development of the field research data library at Purdue/LABS
was initiated in the fall of 1974 by NASA/Ji.hnson Space Center (JSC)
with the cooperation of the United States Department of Agriculture (USDA)
as a part of the Large Area Crop Inventory Experiment (LACIE). The
purpose of the data base is to provide fully annotated and calibrated
multitemporal sets of spectral, agronomic, and meteorological data for
agricultural remote sensing research. Spectral, agronomic, and meteorological
measurements were made over primarily wheat on three LACIE test sites in
Kansas, North Dakota, and South Dakota for the first three years. During
the past two years, the data library has been expanded to include data
collected for corn and soybean experiments in Indiana, Iowa, and Nebraska,
as well as from a major U.S. soils experiment.
Milestones achieved during the past year have been:
- Data library and distribution
Inclusion of 1978 crop year data• Inclusion of part of 1979 crop year data• Inclusion of 1978 soils data• Distribution of data to researchers• Update of field research data library catalogPreparation of report on the evaluation of spectraldata calibration procedures.
- Development and documentation of analysis software
- Development and documentation of processing software
The report on the evaluation of spectral data calibration procedures
is given in section F.
*This section describes the results of Task. 3B, Field Research Data BaseManagement and Distribution, along with software development and documen-tation which were performed in part under Tasks )A and 1B. The contribuc{onsof Cathy Kozlowski and Don McLaughlin to data processing software develop-ment and data preparation; of Nancy Fuhs, Jeanne Etheridge, Jerry MaJkowski,and Jill Heinrich to data analysis softwure development and documentation;and of Donna Scholz, Jo Albert, Bev C;arventer, and ray Benson to data basemanagement are gratefully acknowledged.

-94-
1. Field Research Data Library and Distribution
The general organization of the field research data library is
illustrated in Figure E-1. The data in the library includes spectral
measurements, agronomic measurements, meteorological measurements,
photography, mission logs, and data verification reports. The data
formats available to researchers are digital tape, film, and data
listings.
The data have been collected over several test sites and for
different crops as illustrated in Table E-1. The test sites are of
two types, controlled experimental plots and commercial fields.
Table E-2 presents a summary of the experimental plot and commercial field
test site locations.
The instruments used to collect the spectral data are listed in
Table E-3. The spectrometer data are processed into comparable units,
bidirectional reflectance factor, in order to make meaningful comparisons
of the data acquired by the different sensors at different times and
locations. The uee of this approach is evaluated in section F. The
spectrometer data tapes contain the spectral bidirectional reflectance
factor measurements along with most of the corresponding agronomic and
mctcorolc gical measurements. The data is stored in Purdue/LABS spectrometer/
radiometer data storage tape fo*_mat.
The multispectral scanner data are approximately linearly related
to scene radiance. The information is available for the researcher to
calibrate the scanner data to in-band bidirectional reflectance factor
if desired. Most of the scanner data are stored in LARSYS Version 3
format; some data are available in universal format.
A summary of the spectral data in the data library is given in
Table E-4. In the past twelve months, five aircraft scanner runs and
18,000 spectrometer/radiometer observations for the 1978 crop year have
been made avIilable to researchers. The 1978 data includes spectral
observations of over 500 soil samples from 39 states of the United States
as well as Brazil, Costa Rica, Sudan, Spain, and Jordon along with their

lowa a«+ E
N ^+ H^ EN/pf
,ta w° A
N
cnCd
4a
Nb ua^ a«+ ro
tL D
f.^
a
ro
roG
ro r••1N to
to uV! O •r+
,C V! 000.co u Oro O •, ••rN- E o00 N O 1•+O.CCO
0 4-A oe 0 u0.O•+ ►.«+
.rro ev
a+ ro
aui A0.tiN O
4 C
roau
to
E••04 OO 4+^ a)ro E
Oro ^.U a,+
u ro
0.rocn Cl
fr
ro
r••1ro
u41C ro4 O
u
VI V! C:
ro ro ^
c^ cn a
asu= ro
a^ co^A
Nu
a ^O N VIC 0. ^•+•.^ c0 ro
a c^ vi
F••asNe^e
4)
9w00
ara't7 ro
b
4! W
naa
bu^ uca d
PU a0
Ri •rl
a ++W^4
bC$W
ti+td 4►1•I L,o ar
r+ oro •DAj to
41W
.0 a!
cw aa!
E0
to 1Ww u
4!b 0.^-d N
a,•^ 4JW N
o roa
C to0"4 oJ.^ L
N tl7
R Olto 1J
bl) m
O N
iw
00o.4w

0U
d 3+^ oN H.a9
Na0HUMO
•rte
6ba^v
N00MuuOM
O1-WMN
N01
uw
vNa^
b
aJMww0
w
rn
1w
o^
.a
H
V
ar ctiO CC t0
u ba s~aHaMH
toO iWU ^
b ttlC Ae0x
oiJ
-,4A
0
a^i w
.aw
o. wO 0U >+
-96-
c°v
o a`^oNN^M wN ^01 d.0 Zauz
C1 1 1 1
CU
Na
1 I 1 I ICr9,O OU to
NO
N NC Ctb e0 1+4J w 01
00 00*^U En U cn 3
w w to w
C C C CM M •rl M
3 3 3 3-a .a •a •a
N 00 00 60C: e
41 •C: [
►+ a, w v w a, w a
w to W to
•4 tV •4 ego v4 Cd
w w wu ^ u ^ u e^^C aJ
C ,,,OCC! C 0! 1 I
3 ^ 3 3 3
Ln %o r-
cO o+

-97-
Table E-2. Summary of field research controlled experimental plot testsites and commercial field test sites.
Location Crop Years
Controlled Experimental Plot Test Sites
Kansas State University Agriculture ExperimentStation, Garden City, Kansas 1975-77
North Dakota State University AgricultureExperiment Station, Williston, North Dakota 1975-77
Purdue University Agronomy Farm, West Lafayette,Indiana 1978-79
University of Nebraska Agriculture ExperimentStation, Sandhills, Nebraska 1979
Commercial Field Test Sites
Finney County, Kansas 1975-77
Williams County, North Dakota 1975-77
Hand County, South Dakota 1976-79
Webster County, Iowa 1979

-98-
Table E-3. Summary of major sensor systems used for field research.
Platform and Sensor
Spacecraft Multispectral Scanners
Landsat 1Landsat 2Landsat 3
Aircraft Multispectral Scanners
24-channel Scanner (MSS)11-channel Modular Multispectral Scanner (MMS)
Helicopter-mounted Spectrometer
NASA/JSC Field Spectrometer System (FSS)
Truck-mounted Spectrometers
NASA/ERL Exotech 20D Field SystemNASA/JSC Field Signature Acquisition System (FSAS)Purdue/LARS Exotech 20C Field System
Truck-mounted Multiband Radiometers
Purdue/LARS Exotech 100 Landsat Band Radiometer Field System

-99-
Table E-4. Summary and Status of Spectral Data in the field research datalibrary by instrument and data type.
Crop Year(s) and Status
Instrument/Data Type 1975-1978 1979
Complete Complete In Processing
Landsat MSSWhole Frame CCT (Frames) 124 --- ---
Aircraft Multispectral Scanner(Dates/Flightlines) 46/301 1/5 5/
Helicopter Mounted FieldSpectrometer(Dates/Observations)
Field Averages 74/6870 --- 171Individual Scans 74/114,829 --- 17!
Truck Mounted Field Spectrometer/Multiband Radiometer(Dates/Observations)
NASA/JSC FSAS 45/813 --- ---Purdue/LABS Exotech 20C 99/7055 18/716 5/134NASA/ERL Exotech 20D 45/645 --- ---Purdue/LABS Exotech 100 32/6077 16/3120 9/5097

-100-
physical and chemical properties. This data set is described in section D.
Also 40, )0 spectrometer/radiometer observations for the 1979 crop year have
been processed and made available to researchers.
Four institutions have received or accessed field research data during
the past year. In addition all the data are routinely available to
researchers at Purdue/LARS. Also, investigators at NASA/Johnson Space
Center and the Environmental Research Institue of Michigan have direct access
to the digital data via remote terminals to the LARS` computer. Table E-5
summarizes the data that have been distributed during the past three years
and indicates which institutions received data during this past year.
The Field Research Data Library Catalog summarizes the data available.
The catalog includes a separate volume for each crop year during which data
were collected. The volumes for the 1978 and 1979 crop years have slightly
different formats than the volumes for the 1975-1977 crop years. The
instrument indices for the spectrometer data contain much more information
including experiment summaries, solar zenith angles, and cloud cover summaries
to help researchers determine which data meet their needs. The 1975-1977
crop year volumes are being converted to the new format.

-101-
Table E-5. Summary of recipients of field research data.
Organ iza t ion /rata ProvidedNumber
of Request@
NASA/Goddard Space Flight Center >53Greenbelt, Maryland
Spectrometer Data - 50 dates/45,000 observationsAircraft PhotographyLandsat segments and color composites - 8Helicopter and ground photographyField mapsAgronomic and meteorological measurements(Also access to data through Purdue/LARS %emote terminal)
General Electric Corporation 2Philadelphia, Pennsylvania
Spectrometer data - 21 dates/15,000 observationsLandsat frames and color composites - 7Agronomic and meteorological measurementsField mapsAircraft and ground photography
Uaiversity of South Florida 1Tampa, Florida
Spectrometer data - 27 dates/2600 observationsAgronomic and meteorological measurements
USDA, Agriculture Research Seroice 1Weslaco, Texas
Spectrometer data - 2 dates/3500 observationsAgronomic and meteorological measurementsField maps
Goddard Inbtitute for Space Studies 3 3New York, New York
Spectrometer data - 51 dates/24,000 observationsAircraft scanner data - 4 dates/12 flightlinesAgronomic and meteorological measurementsField maps

-17:-
Table E-5. Summary of recipients of field research data (cont).
Organization/Data Provided
Numberof Requests
Ecosystems, Inc. *3Gambrills, Maryland
Spectrometer data - 13 dates/805 observationsAgronomic and meteorological measurements
Environmental Research Institute of Michigan +3
Ann Arbor, Michigan
Access to data through Purdue/LARS remote terminal
NASA, Johnson Space Center +Houston, Texas
Access to data through Purdue/LARS remote terminal
Purdue University, Laboratory for Applications of Remote Sensing +West Lafayette, Indiana
Location of field research data library
* Received from NASA/Goddard Space Center.
+ SR&T users of field research data.
3 Recipients of field research data during 1979.

-103-
2. Data Analysis Software Development and Documentation
During the field research project over the past five years, over
140,000 observations of calibrated spectrometer data and 300 flight lines
of aircraft scanner data have been collected. Researchers require more
powerful research tools to analyze the data efficiently and effectively.
During this past year several analysis software tools were developed
and/or documented. The achievements include:
rpansion and Documentation of LARSPECImplementation of Statistical Analysis System (SAS)Implementation of 3-dimensional graphics software
2.1 Expansion and Documentation of LARSPEC
A new name was selected for the software system on the Purdue/LABS
computer which accesses the spectrometer/radiometer data and associated
agronomic and meteorological measurements. The new name is LARSPEC which
replaces the name EXOSYS. Major capabilities which were added to LARSPEC
this year are: (1) ability to access multiband radiometer data, such as
data from the Exotech 100 Landsat band radiometer, (2) increased ability
to transfer agronomic_ data to disk for use by the SAS or SPSS statistical
routines, (3) addition of crop productivity parameters to identification
recorus. A concentrated effort is being made to adequately document these
new capabilities for researchers.
The original documentation for LARSPEC, formerly called EXOSYS, was
written in 1974. Since then several new capabilities have been added to
the processors, outdating the pre-existing documentation. With the addition
of new graphics and clustering capabilities in 1978, the decision was
made to develop a new LARSPEC User's Manual containing a control card
dictionary, examples of inputs and outputs, and error messages. The
manual should enhance the usefullness of the LARSPEC software system
for field research data analysis. Since LARSPEC is a dynamic software
system, the LARSPEC User's Manual will continue to be revised as new
capabilities are added. The Table of Contents for the LARSPEC User's Manual
is given in Figure E-2. In the next few months additional documentation,
The LARSPEC Training Manual, will be developed.

-104-
2.2 Implementation of Statistical Analysis System (SAS)
The Statistical Aralvsis System (SAS) was implemented on the computer
late this year to ircrease statistical analysis capabilities. SAS augments
other statistical analysis routines, such as SPSS, which are already available
on the LARS' computer, SAS is available on a trial basis to determine its
usefulness. The capabilities of SAS include a wide range of statistical
procedures including general linear models, multivariate analysis of variance,
and a variety of linear and nonlinear regression methods. SAS also includes
report writing capabilities, data management tools, and line printer plot
and chart routines.
2.3 !Wlementation of 3-Dimensional Graphics Software
During this past year, a set of 3-dimensional graphics software routines
were implemented on the LARS' computer. The software is the 3-D Graphics
Compatibility System (GCS) acquired from the U. S. Army Corps of Engineers at
the Waterways Experiment Station, Vicksburg, Mississippi. The software
routines, in Fortran, can be used in the development of researcher tools for
more complex displays and analyses of spectral-agronomic data. The software
has the capability for plotting 3-D graphics in perspective or orthographic
projections fcr 3-D rectangular, spherical, or cylindrical coordinate systems.
The axes may be in linear or logarithmic units. Examples are given in
Figures E-3 and E-4. The user may, 'walk' around, over or under the graph
or object by defining the view point and site point with six numbers.
Documentation for the 3-D GCS system has recently been distributed to
researchers at Purdue/LABS, NASA/Johnson Space Center, and the Environmental
Research Institute of Michigan. Also, a high resolution graphics terminal
has been ordered. The new terminal, a Tektronix model 4054, is expected to be
r,_ceived and made available for researcher's use during the first size months
of 1980. The graphics terminal will be a valuable tool for data verification
and data analysis.

-105-
3. Data Processing Software Development
Two major processin,
this year. The first is
band radiometer data and
identification records.
correctly, th- multiband
in section C.
g software capabilities were developed and documented
the software to process the Exotech 100 Landsat
the second is software to update spectrometer
The Exotech 100 processing software, or more
radiometer data processing software is described
The software to update LARSPEC identification records provides the
capability to ?rocess the Exotech 20C and Exotech 100 spectral data soon
after it is collected prior to having all the agronomic measurements. The
agronomic data can be added to the identification records later when they
become available. Previously the data, spectral and agronomic, had to be
reprocessed completely to add new information. This capability is the
reason that a large part of the 1979 Purdue Agronomy farm data is available
for analysis before the end of the year.

-106-
LARSPEC USER'S MANUAL
Table of Contents
1. LARSPEC Processing Functions
2. Procedures for Using LARSPEC
2.1 Batch Mode
2.2 Interactive Mode Via Control Cards from Disk File
2.3 Interactive Mode Via Control Cards from Card Reader
2.4 Interactive Mode Via Control Cards from Terminal
3. Control Card Dictionary
3.1 Terminal Commands
3.2 Monitor Control Cards
3.3 DSEL Processor Control Cards
3.4 GSPEC Processor Control Cards
3.5 IDLIST Processor Control Cards
4. Discussion of Processor Function Input and Output
4.1 Data Selection Processor (DSEL)
4.2 Data Graph Processor (GSPEC)
4.3 Identification Record List'Processor (IDLIST)
5. LARSPEC Error Messages
Appendix A. Abbreviated Control Card Listing
Appendix B. LARS Field Spectrometer/Radiometer Data Storage Tape Format
Appendix C. Description of Data Tape Utility Processor
Figure E-2. Table of contents of LARSPEC User's Manual.

-1o7-
'wA
PLOT 732SY MATURITY STAGE SYM Mr1TU11TY Wax
i 1.5 62 2.0 7 6.2
2.S 6 7.0LS 9 6.0S 6.0 10 9.0
i
i
..IV
Sl•f^^ itf`M . ^ +^ +e i./y
!o s!
m_ I _I
r •.............r
^.7
^^ L
L .dl
1J
Figure E73. Example of 3-dimensional line type plot using 3-D GraphicsCompatibilit) System software. This plot is a temporal(growth stage) plot of three Thematic Mapper bands for corn.

4s 11a
-108-
JOINT OENSITY FUNCTION PLOTCLASS CLASS NAM CLASS CLASS NAME
4 EXTRATI 9 DECIOS SOIL 11 RIVERT VEGION I9 LAKE2
vim lolat 240. 240. .11Sim Polat 24. 24. 0via" -120. 120. - .11..11
Figure E-4. Example of 3-dimensional surface type plot using 3-D GraphicsCompatibility System software. This plot represents the jointdensity function for two channels and six classes in a LARSYSstatistics deck for Skylab data.
__

-109-
F. EVALUATION OF CALIBRATION PROCEDURES FOR MEASUREMENT OF BIDIRECTIONALREFLECTANCE FACTOR IN REMOTE SENSING FIELD RESEARCH*
Barrett F. Robinson and Larry L. Biehl
1. Introduction
The use of measurements of optical radiation for identification and
area estimation of agricultural crops from earth satellites has reached
near operational status for some crops (1,2). As the technology develops
there is growing awareness of the need for quantitatively understanding
the optical properties of crops and soils.
Researchers are heading to the fields in increasing numbers with a
variety of instruments to measure radiation reflected and emitted by soils
and crop canopies. While many types of measurements will prove to be useful,
there is a need for data which may be compared from site to site and instru-
ment to instrument, indep,ndent of atmospheric conditions.
This section describes and evaluates a reflectance calibration
procedure which has been used since 1974 by Purdue/LABS and NASA/JSC in
the field research project sponsored by NASA/JSC to obtain field measure-
ments which are being analyzed across sites, instruments, and dates in on-
going agricultural experiments (3).
2. Bidirectional Reflectance Factor (BRF)
A reflectance factor is defined as the ratio of the radiant flux
actually reflected by a sample surface to that which would be reflected
into the same reflected beam geometry by an ideal (lossless) perfectly
* This section describes work performed under Tasks 1B and 3B. Thecontributions of Professors David P. DeWitt and LeRoy F. Silva of PurdueUniversity and Dr. David E. Pitts and Mr. Richard Juday of NASA/JohnsonSpace Center are gratefully acknowledged.

-110-
diffuse (Lambertian) standard surface irradiated in exactly the same way
as the sample (4)•
The essential field calibration procedure consists of the comparison
of the response of the instrument viewing the subject to the response of
the instrument viewing a level reference surface. For small fields of
view (less than 200 full angle) the term bidirectional reflectance factor
has been used to describe the measurement: one direction being associated
with the viewing angle (usually 00 from normal) and the other direction
being the solar zenith and azimuth angles.
The true bidirectional reflectance factor R(si'Y er'#r) isdefined for incident and reflected beams where ( 6i,4i) and (er,#r) are
the zenith and azimuth angles of the incident beam and reflected beam,
respectively (4).
The essential field calibration procedure consists of the measurement
of the response, V s , of the instrument viewing the subject and measurement
of the response, Vr, of the instrument viewing a level reference surface
to produce an approximation to the bidirectional reflectance factor of
the subject.
VRs(81.mi:er.^r) ' s Rr (8i ,# i ;er .®r) (1)
Vr
where Rr(8i'4i;er'fr) is the bidirectional reflectance factor of the
reference surface. R is required to correct for the non-ideal reflectance
properties of the reference surface.
The assumptions in the procedure are:
(1) The incident radiation is dominated by its directional component;
this is discussed below.
(2) The instrument responds linearly to entrant flux.
(3) The reference surface is viewed in the same manner as the subjectand the conditions of illumination are the same.
(4) The entrance aperture is sufficiently distant from the subjectand the angular field of view is small with respect to the

-111-
hemisphere of reflected beams. For our purposes a 200 angularfield of view is about the limit for this assumption.
(5) The reflectance properties of the reference surface are known;this is discussed below.
For multiband radiometers the reflectance factor results from the
response of the instrument to the radiance of the subject and the reference
in each effective passband and, therefore, is an in-band reflectance. For
spectroradiometers the spectral bidirectional reflectance factor is computed
at each resolved wavelength.
3. Discussion of the Approach
The objective of the approach is to obtain a property of the scene
which is nearly independent of the incident irradiation and atmospheric
conditions at the time of the measurement. The majority of measurements
are made by viewing along the normal to the subject and the level reference
surface with solar angles similar to those for satellite overpasses.
Under these conditions, the properties of the subject are measured which
affect the response of a satellite-borne sensor.
If the researcher desires, the irradiance and directional radiance of
the subject may be determined from the raw data,provided the instrument is
calibrated. However, the estimation of these quantities usually involves
a high degree of uncertainty. Fortunately, it is not necessary to know
them to compute the reflectance factor.
An understanding of the factors which affect the bidirectional
reflectance factor of agricultural scenes will provide a basis for improved
identification and characterization of agricultural crops. A deeper
understanding will be required in the future with the advent of improvements
in characterizing the optical properties of the atmosphere over frames of
satellite-borne sensor data and future satellite sensors which may view
the surface at angles significantly different from normal.
WNW-

-112-
4. Field Procedures
The field procedure for reflectance factor calibration will vary with
the instrument system depending mainly on the means used to support the
instrument above the crop. The principle is, as nearly as possible, to
measure the level reference surface with the same conditions of irradiation
and viewing as the crop was measured. For example, Figure F-1 shows a
multiband radiometer mounted on a pick-up truck mounted boolq viewing a
soybean canopy. When viewing the crop, at a height of 4.2 meters, the
diameter of the 15 0 field of view is 1.1 meters. Figure F-2 shows the
boom rotated for the calibration operation. To ensure filling the field of
view during the calibration operation, the instrument is positioned at a
height of about 2 meters above the 1.2 meter square painted barium sulfate
reference panel. At this distance, the diameter of the field of view, 0.53
meters, can be confidently located on the reference surface. For this
mounting technique, the time from the nearest calibration is about 8 minutes.
Reference surface data is interpolated to,compute inband reflectance factors
for each of the 15 plots which were measured (twice) during the interval.
Similar procedures are used with the other instruments described below.
S. Reference Surfaces
As listed above, an assumption for measuring HRF is that the reflectance
properties of the reference surface are known. Three kinds of reference
surfaces have been used by Purdue /LABS and NASA/JSC for field research.
They are pressed barium sulfate powder, painted barium sulfate, and canvas.
The canvas reference surfaces are about 6 by 12 meters and are painted with
a durable, diffuse paint. The nominal reflectance of the canvas panel is
around 60 percent. All three reference surfaces are highly diffuse (for
the solar angles encountered) an] have medium to high reflective properties.
Each of the reference surfaces were used
to meet the requirements for a given instrumentation system. The spectral
bidirectional reflectance factor for the three reference surfaces are
illustrated in Figure F-3. Figure F-4 illustrates the gonior etric properties

-113-
Figure F-1. Truck-mouuru.l multiband radiometer viewing a soybeancanopy.
Figure F-2. Mul t ibai,. UU41eL,r positioned over painted barium
sulfate r, r , .nc-i { panel for field reflectance cal i-brat ion.
4

--114-
100
••^,•M.. N.NM..,4
•.•••MN••••~
60 •, • • • •
i ••
tO• •
t
pressed barium sulfate •-20 painted barium sulfate
•_ •_ .' Canvas panel
0 ;
Figure F-3.
+ - pressed barium sulfateo - painted barium sulfate
100 -* . , a - Canvas penal. ,
80 ,• .
u 60 ..W
AO , A•,
V4 0 2O LO 60 80 100.ron
Bidirectional Reflectance Factor (2)
Figure F-4. Bidirectional reflectance factor at0.6 um, for several incident angles, 0,and reference surfaces. Polar coordinates.
MN^wV
V
w
ro
wvId
•8 1.62.
2.4
Wavelength (us)
Spectral bidirectional reflectance factor ofthree reference surfaces used for fieldresearch.
12

-115-
of the three reference surfaces from S to 55 degrees off normal at 0.6 um
The spectrul goniometric properties of painted barium sulfate and canvasare shown in Figures F-S and F-6 respectively. The BRF calibration transferfor the reference surfaces iq illustrated in Figure F-7.
Pressed barium sulfate is highly reflective (Figure F-3) from 0.4 to2.4um (5,6) and differs no more than 3% from Lambertian (Figure F-4) for
0 tt^ ii degree zenith angles. Pressed barium sulfate is primarily used
as an indoor laboratory standard to calibrate the field painted barium
sulfate reference surfaces. The pressed barium sulfate is used at incident
angles of 10 degrees off normal in the indoor laboratory setup (7),
Painted barium sulfate is highly reflective (Figure 3) from 0.4 to
2.4um when prepared as described by Shai and Schut t.(8) If applied
properly, painted barium sulfate differs no more than 5% from Lambertian
for 0 to SS degree zenith angles (Figures F-4 and F-5). Painted barium
sulfate panels are used as the reference surfaces for truck -mounted
spectrometer /multiband radiometer systems. The solar zenith angles
normally allowed or encountered during data collection by truck-mounted
systems are 15 to 45 degrees.
The canvas panel is medium reflective (Figure F-3) from 0.4 to 2.4 um.
and differs no more than 8% from Lambertian for 0 to SS degree zenith angles
(Figures F-4 and F-6). The canvas panel is used as the reference surface
for a helicopter-moointed spectrometer system. The solar zenith angles
normally allowed or encountered during data collection by the helicopter-
mounted system are 15 to 53 degrees.
6. Effects of Non-Directic-ial Illumination
As indicated above, an assumption for the measurement of BRF is that
the incident radiation is directional. Clouds and skylight cause the
irradiance of the subject and reference surface to be other than directional.
Clouds can be avoided by taking data on clea,: days. Skylight, which can
not be avoided, will be discussed first.

-116-
K100
MOV
w^r
V60
9r 40A
120
.i.8 .
1.2
1.62.
2.4
Wavelength (um)
Figure F-3. Spectral bidirectional reflectan ^.i factor ofpainted barium sulfate for several incidentangles (view angle is normal).
w 10010
SO
u80
eU
V^^ ;I
40
0u
V .I 1.2
a.8 1.6 2.4
Wavelength (um)
Figure F-6. Spectral bidirectional reflectance factor ofa canvas panel for several incident angles(view angle is normal).
•
•r141
00M.1boD

-117-
Aircraft MSsTruck-Mounted and
Laboratory Soectrometers Helicopter-Spectrometer
('Exotech
xotech 20C Mounted(Exotech 20C) FSAS Spectrometer
20D (FSS)
Pressed Barium Sulfbce Painted Barium Sulfate Canvas CalibrationLaboratory Standard Field Standard Standard
Figure F-7. Bidirectional reflectance factor calibration transfer of referencesurfaces used for agricultural field research.

-11E-
6.1 Effects of Skylight_
Some of the flux incident upon the subject and reference is due to
scattered sunlight. The effects of this component (skylight) may be
treated by assuming that the radiance of the hemisphere is uniformly
distributed. This is a conservative assumption in that the skylight is
brightest in the vicinity of the solar disc (9). This increases the
directional nature of the irradiance and the results need to be (and are)
modified slightly to compensate for this assumption. The radiance of the
surface is assumed to have a direct component, dL D , due to radiation from
the direction of the sun and a diffuse component, dLd , due to uniformly
distributed skylight.
dL (e i 3O i ;er ,0 r) = f(e i 3O i ;e r ,0 r) dED ( e i 3O i ) + J
f(e i 3O i ;e r ,Or) Ld (e i 3O i ) d0 i
2n
where incident and reflected angles are subscripted and i and r, respectively
and
dL(ei'Oi'er'Or) is the radiance in the direction (e r ,0r ) (W.m 2 •sr 1)
f(e i3 O i ;e r ,0 r) is the bidirectional reflectance distribution function of the
surface (sr 1)
dED (e i3 O i ) is the directional component of the irradiance (W-m 2)
including sun and directional irradiance of sky covered by solar disc.^
Ld (0 i3 O i ) is the diffuse radiance of the sky, Ed (W-m- l -sr 1)
n
Ed is the total diffuse irradiance from the hemisphere (W•m-2)
and
dil i = cose i sine de id0 1 (sr).
For viewing along a normal to the surface.
dL(di,oi;0,0) = f(e i 3O i ; 0 , 0) dED ( e i 3O i ) + Ed p t (2r;0,0)
1n
where p t is the hemispheric-normal reflectance of the subject and
pt(2r;0,0) f f(eito 1 ;0,0) dOi.
211
(2)

the directional irradiance is uniform and collimated, the reflectance factor
for a normally viewed surface, in the presence of skylight, is:
R.E (ei . Yomt i i D i i r d (3)
f s(ei.01 0.0) C D(ei.oi) + EdJ
where t and s subscripts refer to "target" and "standard", respectively and
the reference surface or standard is assumed to be Lambertian.
The structure of the subject and the reflectance characteristics of its
components (i.e., leaves, tassels, soil background, etc.), combine to produce
a complicated relationship between p t and f t (e i ,:
ssi
;0,0). However, for any
sun angle pair (e i ,fi), f t may be greater or le than pt. The relationa
may be expressed as
Pitt = ftI
( e j ,f j ; 0 , 0) 1 + K 1 (e i .®i)^ (sr 1 )• (4)
where K1 (e i ,oi) simply represents the fractional amount by which f t differs
from pt.W
Then, Equation ( 3) becomes
f t (8 i.Y0.0) K1(8i.^i) Ed
fs (e i 3O1 ; 0.0) dED (ei.^i) + Ed
40 11
Defining the ratio of the diffuse irradiance to the total irradiance to be
Ed
K2 (8 i .^i ) ` dEd (e i ,^i) + Ed .

-120-
RF(8i.oi;0.0) = Rt ( 81 ,Oi ;(J,0) C1 + K1 - K2 J (6)
where Rt (8 i , m 1 ;0,0) is the true bidirectional reflectance factor for normal
viewing.
K1 (8 i , oi ) varies with wavelength, structure of the canopy, etc. An
estimate of K1 can be obtained from measurements of ft(8i,mi;8r,or) spaced
across the hemisphere; however, solar zenith angles less than 150 do not
occur at our latitudes (40 0 N) and f t (0,0;0,0) has to be estimated.
For a variety of laboratory and field subjects viewed normally and
illuminated at angles by a collimated source, it has been shown that 85%
to 90% of the variance of the instrument response is explained by cose c (10).
Examination of functions f t (8i ,¢i ;0,0) which resemble typical experimental
results indicates that those functions, which satisfy the 85% to 90% criterion
mentioned above, yield JKJ 0.15 for solar zenith angles used for normal
data acquisition.
To serve as an example we select a function, f t , which resembles a
bidirectional reflectance distribution for vegetation and has a normal-
hemispheric reflectance, p t . Ignoring azimuthal effects, we let
ft( eiI 0 1 ;0,0) = 5 p t (cose c) ($r 1 ) (1)4 n
A
Then, since p t (2n;0,0) =f(8 i , mi ; 0,0) dQiS
2n
Pt ' p(2n;0,0) =2n n/2
4 Pt (cos8 i) sine s cosec ds i dp i(8)
t f 10 0
A comparison of f and the constant P t /n, the reflectance distribution
function of a Lambertian surface, is shown in Figure F-8. The relative
responses of an instrument viewing normally scenes, characterized by ft
and P tbi, that are illuminated with a collimated constant intensity source
at several angles, 0, are shown in Figure F-9. The angular response for
i

V
GO
N 1.0C!a:
uGO1
8
Ly 0.5CH
O1
Sri
^J
tb
flL
Lan surface
e-60Op
-121-
pt21-
iw
Pt
.. narev
J
< W
0
0 20 40 60 80
Illumination Zenith Angle, 8.
Figure F-8. Comparison of the functions f. and p t as
a function of illumination angle, 8.
6=0
@=90
0.0 , 0.5 1.0
Relative Instrument Response
Figure F-9. Polar plot of comparison of relative responseof a normal viewing instrument to a scenecharacterized by f and a Lambertian sceneas a function of iflumin - ton angle, 6.

-122-
the subject satisfies the 85% to 90% criterion in that 88% of the variance
of the response is explained by (pt/n)cosei.
From Equation 4, values of K i (ei) are computed and shown in Figure F-10.
Figure F-10 indicates that with the assumption of uniformly distributed
skylight, JK 1 1 <0.2 for all angles from 0 to 63 degrees. To take into account
the directional nature of the skylight, we consider that much of skylight
originates from the vicinity of the solar disk and that flux is reflected
by the average value of f t (6 1) over the range of 8 i (111 Thus, much of the
skylight is reflected by effectively the same reflectance distribution
function as the direct component is reflected. Therefore, a value of
iK 1 1 <0.1 is felt to be justified.
The ratio of the diffuse irradiance to the total irradiance is:
K2 = K2 (e10 (9)
This ratio varies with wavelength, sun angle, and atmospheric conditions.
K 2 has been modeled and measured for a variety of conditions and typical
values are presented in Table F-1.
From Table F-1, the maximum value of Ke K 2 is 0.03. Therefore, the
reflectance factor measured including the skylight will differ from the
true reflectance factor by a systematic 3% of value on a hazy day (visibility =
8 km) for the spectral band 0.5 to 0.6um (9,12).
6.2 Effects of Clouds
As a large cumulus cloud approaches the solar disc, a sensor of global
irradiance will indicate increased intensity (as much as 30% i- ypical).
Then, as the cloud begins to cover the solar disc, the intensity decreases
markedl y (typically to 20% of the original intensity). Thus, any measurement
made during these events will be subject to error due to intensity changes
with time. More importantly, a sizeable error can be introduced by the marked
difference in direction of the light from the cloud. Unlike the• skylight,
the cloud has no compensating effect on the other side of the sun. Therefore,
under these conditions, even a complete measurement made in an instant will
be subject to sizeable error.

0.4
0.2
00% 0.0
ac-0.2
-0.4
-123-
Illumination Zenith Angle, 6.
Figure F-10. Plot of the fractional difference betweenf and p t, K , as a function of illuminationangle, T 1
Table F-1. Determination of the variation (K 1K2) of the measuredbidirectional reflectance factor from the truebidirectional reflectance factor.
Ratio of diffuse to total K1•K2irradiance (K2)
Spectralor K10.
Range(um) Visibility Visibility
8 Km 23 Km 8 Km 23 Km
0.5 - 0.6 .30 .07 . ( 11'? .007
0.6 - 0.7 .23 .05 .02 .005
0.7 - 0.8 .20 .03 .02 .003
0.8 - 1.0 .15 .02 .02 .`U2
1.55- 1.75 .05 .02 .01 .002
2.1 - 2.3 .05 .05 .01 .005
-124-
Frequently, clouds will appear on the horizon on an otherwise clear
day; their effect is diminished in that they irradiate from a large 8i.w
For example, using f(8) defined above, the radiance of the subject due to
clouds on the horizon is:
b r/2
Lcc Lcf(8i) cosei sinOi do d#i (W-m -2• sr 1 ) (10)
a a
where Lc is the constant radiance of the clouds, a and b are angles des-
cribing the azimuthal range of the clouds and a is the zenith of the top
of the range of clouds.
Lcc - k pc EDpt(Cosa)5/2 (W,ID 2• sr 1)
0 1)
where k is the fraction of the azimuthal horizon encompassed by the clouds
and pc is the reflectance of the clouds (p c)-50%) over the reflective spectral
range. From this it may be determined that bands of clouds covering half
the horizon to an elevation of 20 degrees (zenith of 70 degrees) will produce
little effect on the measurement of reflectance factor. Furthermore, a few
sationary low and middle clouds at large angles from the solar disc can
be shown to produce little effect as long as they do not subtend a significant
solid angle of the hemisphere.
The effects of thin cirrus clouds are the most frustrating. If they are
widely distributed, they contribute errors related to K 1 (0 i ,o i), discussed
above, by increasing the "skylight". As well, they cause changes in the
intensity of the direct component of the irradiance by moving (sometimes
rapidly) across the solar disc. However, there are days when, for sufficiently
long periods, the variation of intensity due to tnin cirrus is less than ± 1%.
Sometimes, on such days, we continuously monitor the total and spectral
irradiance and succumb to the temptation to take data and correct for the
changes, ignrring the effects on K1.
For completely overcast days, the intensity of the irradiance changes
rapidly and unpredictably with occasional periods of relative constancy. During
the "constant" periods, a poor approximation to f(2n;0,0) can be measured.

-125-
However, since we are interested in the directional properties (to relate
to satellite sensed data), these days are best spent on other activities.
7. Comparison of Spectral Bidirectional Reflectance Factor Measurementsmade by Three Spectrometer Systems
During the Large Area Crop Inventory Experiment (LACIE) (3),four
different spectroradiometer systems were used to collect agricultural field
spectral BRF measurements. The spectroradiometer systems were used in five
different test sites in North Dakota, South Dakota, and Kansas. Common
scenes, canvas panels, were transported between the test sites to be used
for the reflectance calibration of a helicopter mounted spectrometer and if
researchers desire, ai:craft scanner data. In July of 1977, three of the
spectrometer systems were brought together to the, Williams county, North
Dakota, test site for a formal comparison study. The three spectrometer
systems were:
• Exotech 20C Field Spectrometer System, a circular variable filter-wheel, truck-mounted instrument operated by Purdue/LARS
• Field Spectrometer System (FSS), a circular variable filterwheel,helicopter-mounted instrument operated by NASA/JSC
• Field Signature Acquisitions System (FSAS), an interferometer,truck-mounted instrument operated by NASA/JSC.
The fourth spectrometer system, the NASA/ERL Exotech 20D, was used
during 1975 only. All four instrument systems measured the spectral
bidirectional reflectance factor of agricultural crops, primarily small
grains, from 0.4 to 2.40m. The field techniques and reference surfaces
normally used by the crews of each of the instrument systems were us6d
during the measurements of the common scenes for the comparison study.
The scenes were six gray canvas panels, and a green canvas panel. The
gray panels represent scenes with relatively constant spectral characteristics
at different reflectance levels; the green panel represents a scene with
varying spectral character. The truck-mounted systems measured the spectral
BRF of the seven panels on July 15 and 17, 1977,,Figure F-11. The
helicopter-mounted spectrometer system, the FSS, viewed the four gray panels
on July 17, 1977: a fifth panel, the brightest, was the reference panel.

• 126-
The FSS viewed the green panel on August 4, 1977. All measurements were
collected with less than 15 minutes between measurements of the scene
and the reference surface. The reference surface for the Purdue/LABS system
was a 1.2 meter square painted barium sulfate panel viewed at 2.4
meters below the instrument, The reference surface for the NASA/JSC FSAS
system was a 0.6 meter diameter circular painted barium sulfate panel
viewed at 1.2 meters below the instrument. The reference surface for the
NASA/JSC FSS system was a 6 x 12 meter canvas panel mounted on a solid,
fixed platform at 6 meters below the •Lnstrument (Figure F-12).
The spectral BRF measurements by the three field systems of the canvas
panels (5 to 60 percent), compared quite favorably, as illustrated in Figure
F-13. The major difference in the three field systems occurs in the 0.9
to 1.8Nm range for the green panel BRF measurements above 65 percent. The
specific reason(s) for the differences have not been determined. A
quantitative comparison of the measurements for three wavelengths is given
in Figure F-14. If the measurements from the field systems were identical,
the points in Figure F-14 would fall on the dashed line. A linear regression
analysis was performed on each of the pair-wise system comparisons for each
of the three wavelengths. The coefficients of det-irmination, r 2 , from the
regression analysis were 0.994 or higher. The BRF measurements from the
separate field systems agree to within 4 percent of value for BRF ranges
from 5 to 60 percent, the normal range for most normally viewed agricultural
crop canopies.
The results of the instrument comparison study indicate that the
procedure developed for the measurement of BRF is sound. Moreover,
quantitative information about the comparison of the measurements from
different spectroradiometer systems is available. The use of common scenes
such as canvas panels is a valuable aid in accessing the comparability of
several spectrometer systems. The comparison can be done by bringing the
systems together as was done for the above study or by transferring the
common scenes from site to site.

-127-
Figure F-11. Purdue/LARS Exotech 20C (left) and NASA/?SC HAS(right) spectrometer systems viewing canvas panel.
Figure F-12. NASA/JSC field spectrometer system (FSS) viewingcanvas reference panel.

Soo ool 1
>^erM
00
SAO
Ell
20
0.4 1 .2 L.•
1.8 2.4
100 raw& >
pr8s
....»» ..» b oteett !oCi0 . •. •• •. rsAs
40
20
0.1 1.2
:`.i
I.i 2.4
100 ran*& S
sorss
txoteell 20Cpeas
40
20
0^ -+-►^-+- 4-4-+-+-+- -4-a^. Z^-.i 1.8 2.4
Wavelength (um)
Figure F-13. Comparison of reflectancemeasurements of canvas panelsby three field spectrometersystems.
-128-
100 New pow& 1
anteA too^o ^-•-^•- rsus
so
20
0
w100 panel :
aC6
00rss
•...:_ ». xxoteek =sCY 60 Meuw 10
ev
w .i 1.6 2.4
100 NMl /
s0M -^ rss
90 ......... 1:xoteea !KUa rMw
40w4e4
20.^
ter-.,. ,...aaf..A..^...r,....0V
aaH100 Gore*" paMl rss
sxete" !0Ceo...... rsAx
Eo
AO
20
0 ►-r-+-r++^-* ^^-+1.2
i.i 2. 2.4
Wavelength (un)

-129-
80 r 0.55 Um 0.95 um
60, 4' ,e
' 6,e
40 •
w0 20V
W AP^► 0
.
0 20 40 60 8o 0 20 40 60 80VUdrlWda
802.20 um
ti 60 + FSS vs. Exotech 20C' 0 FSS vs. FSAS
' e FSAS vs. Exotech 20C
00 40 gat
20
00 20 LO 60 80
Wavelength (um)
Figure F-14. Pairwise comparison of reflectance measurements of canvas panelsby three field spectrometer systems at three wavelengths.

Bidirectional reflectance factor (BRF) is an appropriate and useful
optical property for remote sensing field research because it is a
fundamental property of the subject. The described procedures for use
of reflectance surfaces provide a good approAmation to the true BRF of
the subject because the irradiance is dominated by its directional component,
the reference surface is nearly Lamberri.an and the BRF of the subject is
not radically different from Lambertian.
The described procedure is an effecrive means to acquire data which
may be meaningfully compared from time to. time, site to site, and instrument
to instrument because:
• It is relatively easy to train instrument operators to obtainrepeatable results
• The reference surfaces can be prepared and tested at centrallocations; therefore, most researchers do not need sophisticatedcalibration apparatus.
• The performance of different instruments can be easily comparedunder field conditions.
Acquisition of meaningful data requires that measureaents be made at
the appropriate scale. This entails positioning the sensor at a proper
distance above the subject, and careful consideration of the field of view.
Without careful planning, these factors and other procedural errors can
seriously limit the usefulness of well calibrated data.
9. References
1. MacDonald, R. B. and F. G. Nall, "LACIE: An Experiment in Global-CropForecasting." Proceedings of the LAC'Z Symposium, NASA/Johnson SpaceCenter, Houston, Texas, October 1978, Document Ito. JSC-14551, pp. 17-48.
2. Landgrebe, D. A., "Monitoring the Earths Resources from Space - CanYou Really Identify Crops by Satellite?". American Federation ofInformation Proces sing Systems (AFIPS) Confer ence Proceedings. Vol 48.pp. 233-241, AFIPS Press. Montvale. NJ. 47645. 1979.

-131-
3. Bauer, M.E., M.C. McEwen, W.A. Malila, and J.C. Harlan, "DesignImplementation and Results of LACIE Field Research," Proceedingsof the LACIE Symposium, NASA/Johnson Space Center, Houston, Texas,October 1978, Document No. JSC-16015, pp. 1037-1066.
4. Nicodemus, F.E., et al., Geometrical Considerations and Nomenclature",r Reflectance, NBS Monograph 160, U.S. Govt. Printing Office,Washington, D.C. 20402, October 1977.
S. Gram, F. and G. W. Luckey, 'Optical Sphere Paint and a Working Standardof Reflectance." Applied Optics, Vol. 7, No. 11, pp. 2289-2294,November 1978.
6. Billmeyer, F. W., Jr., D. L. Lewis and James G. Davidson, "Goniometry ofPressed Baa::um S 1.1fate," Color Engineering, May-June 1971.
7. DeWitt, D. F. and B. F. Robinson, Description and Evaluation of aBidirectional Reflectance Factor Reflectometer, Technical Report091576, Purdue University, Laboratory for Applications of RemoteSensing, September 1976.
8. Shai, C. M. and J. B. Schutt, "Formulation Procedure and Spectral Datafor a Highly Reflecting Coating From 200 nm to 2300 nm," Doc.X-762-71-266, NASA/Goddard Space Center, Greenbelt, MD, July 1971.
9. Turner, R. E., W. A. Mallila, and R. F. Nalepka, "Importance ofAtmospheric Scattering in Remote Sensing," Proceedings of the SeventhInternational Symposium on Remote Sensing of the Environment, TheUniversity of Michigan, pp. 1651-1696, 1971.
10. Egbert, D. D., "A Practical Method for Correcting BidirectionalReflectance Variations," Proceedings of the Fourth Symposium onMachine Processing of Remotely Sensed Data, Purdue University,Laboratory for Applications of Remote Sensing, pp. 178-192, 1977.
11. Wolfe, W. L. and G. J. Zissos (eds.), The Infrared Handbook, Officeof Naval Research, Department of the Navy, Washington, D. C., pp.343. 1978.
12. Duggin, M. J., "On the Natural Limitations of Target Differentiationby Means of Spectral Discrimination Techniques," Proceedings of theNinth International Symposium on Remote Sensing of the Environment,Environmental Research Institute of Michigan, Ann Arbor, Michigan,pp. 499-515, 1974.


![The Advanced Microwave Radiometer – Climate Quality (AMR-C) … · 2018-03-08 · Microwave Radiometer (HRMR) [6] and a Supplemental Calibration System (SCS). The radiometer channels](https://static.fdocuments.us/doc/165x107/5f35db4eb6ba30245530385e/the-advanced-microwave-radiometer-a-climate-quality-amr-c-2018-03-08-microwave.jpg)