Third Quarter 2010 Report to Shareholders - Bank of Montreal information slides/3/1/Q3... · Third...
52
Third Quarter 2010 Report to Shareholders BMO Financial Group Reports Solid Results for its Third Quarter, Earning $669 Million of Net Income P&C Canada Continues to Deliver Strong Performance with Good Revenue Growth BMO Capital Markets Results Reflect a More Challenging Capital Markets Environment Provisions for Credit Losses Continue to Improve Tier 1 Capital Ratio Remains Strong, at 13.55% Financial Results Highlights: Third Quarter 2010 Compared with Third Quarter 2009: • Net income of $669 million, up $112 million from a year ago • EPS 1 of $1.13 and cash EPS 2 of $1.14, both up $0.16 from a year ago • Return on equity of 13.7%, compared with 12.1% a year ago • Provisions for credit losses of $214 million, down $203 million from a year ago Year-to-Date 2010 Compared with a Year Ago: • Net income of $2,071 million, compared with $1,140 million in 2009 • EPS of $3.51 compared with $1.97 and cash EPS of $3.55 compared with $2.01 Toronto, August 24, 2010 – For the third quarter ended July 31, 2010, BMO Financial Group reported net income of $669 million or $1.13 per share. Canadian personal and commercial banking continued to deliver strong performance, with net income of $426 million, up $64 million or 17% from a year ago. Today, BMO announced a fourth quarter dividend of $0.70 per common share, unchanged from the preceding quarter and equivalent to an annual dividend of $2.80 per common share. “The focus we are maintaining on helping our customers succeed and our strategic investments in businesses with good growth potential have translated into a solid year-over-year increase in earnings, adding to our already strong capital position,” said Bill Downe, President and Chief Executive Officer, BMO Financial Group. "Our results underline the benefit of the bank’s diversified business mix.” 1 All Earnings per Share (EPS) measures in this document refer to diluted EPS unless specified otherwise. 2 The adjustments that change results under generally accepted accounting principles (GAAP) to cash results are outlined in the Non-GAAP Measures section at the end of Management’s Discussion and Analysis (MD&A), where such non-GAAP measures and their closest GAAP counterparts are outlined.
Transcript of Third Quarter 2010 Report to Shareholders - Bank of Montreal information slides/3/1/Q3... · Third...
Third Quarter 2010 Report to Shareholders
BMO Financial Group Reports Solid Results for its Third Quarter, Earning $669 Million of Net Income
P&C Canada Continues to Deliver Strong Performance with Good Revenue Growth
BMO Capital Markets Results Reflect a More Challenging Capital Markets Environment
Provisions for Credit Losses Continue to Improve
Tier 1 Capital Ratio Remains Strong, at 13.55%
Financial Results Highlights:
Third Quarter 2010 Compared with Third Quarter 2009:
• Net income of $669 million, up $112 million from a year ago
• EPS1 of $1.13 and cash EPS2 of $1.14, both up $0.16 from a year ago
• Return on equity of 13.7%, compared with 12.1% a year ago
• Provisions for credit losses of $214 million, down $203 million from a year ago
Year-to-Date 2010 Compared with a Year Ago: • Net income of $2,071 million, compared with $1,140 million in 2009 • EPS of $3.51 compared with $1.97 and cash EPS of $3.55 compared with $2.01
Toronto, August 24, 2010 – For the third quarter ended July 31, 2010, BMO Financial Group reported net income of $669 million or $1.13 per share. Canadian personal and commercial banking continued to deliver strong performance, with net income of $426 million, up $64 million or 17% from a year ago. Today, BMO announced a fourth quarter dividend of $0.70 per common share, unchanged from the preceding quarter and equivalent to an annual dividend of $2.80 per common share. “The focus we are maintaining on helping our customers succeed and our strategic investments in businesses with good growth potential have translated into a solid year-over-year increase in earnings, adding to our already strong capital position,” said Bill Downe, President and Chief Executive Officer, BMO Financial Group. "Our results underline the benefit of the bank’s diversified business mix.” 1 All Earnings per Share (EPS) measures in this document refer to diluted EPS unless specified otherwise. 2 The adjustments that change results under generally accepted accounting principles (GAAP) to cash results are outlined in the Non-GAAP Measures section at the end of Management’s Discussion and Analysis
(MD&A), where such non-GAAP measures and their closest GAAP counterparts are outlined.

BMO Financial Group Second Quarter Report 2010 • 1
“P&C Canada continues to set the pace for the company, with net income of $426 million, up 17% from a year ago. Revenue was up a healthy 9.3%, driven by volume growth across most products. We have seen year-over-year increases in the average number of product categories used by both personal and commercial customers. “Our commercial business investments have bolstered our success in meeting the needs of our customers and driven both revenue growth and a growing market share for commercial loans, which now stands at more than 20%, rising from a year ago and the preceding quarter. "Results in BMO Capital Markets this quarter reflected a more difficult capital markets environment, with significantly lower trading results and fewer opportunities across many businesses. We are continuing to build our capabilities and have made recent hires to help position us for growth across key sectors as the market environment improves. “PCG's net income was down slightly as results a year ago included a recovery of prior periods’ taxes. Results were better in most businesses as we continue to deliver the high level of service and advice that our clients expect. "P&C U.S. is focused on customer acquisition and retention. In personal banking, we’re replicating strong offers across the company. We’ve launched Harris Helpful Steps, patterned after BMO’s SmartSteps program, and we’ve successfully completed the integration of the transferred U.S. mid-market clients into our commercial banking model, organizing the business by specialized sectors. "In summary, our businesses are focused on the promise of delivering great customer experience and we are producing good results, given the current operating environment. While there are some signs of slower economic growth on both sides of the border, we are encouraged that provisions for credit losses improved again this quarter.” Mr. Downe also noted that, “This quarter, BMO became carbon neutral with respect to energy and transportation worldwide. This fulfills − on schedule − a commitment we made to our customers and shareholders nearly two years ago. Sustainability and success go hand in hand, and we are proud to be doing our part.”

2 • BMO Financial Group Third Quarter Report 2010
Operating Segment Overview P&C Canada
Net income was a strong $426 million, up $64 million or 17% from a year ago. There were revenue increases across each of our personal, commercial and cards businesses, driven by volume growth across most products, the inclusion of Diners Club in our financial results and an improved net interest margin. Good revenue growth together with effective management of operating expenses resulted in strong cash operating leverage of 5.5%. We continue to invest strategically to improve our competitive position while managing our operating expenses prudently. Our goal is to be the bank that defines great customer experience. We continue to identify what customers want and need and to maintain our commitment to listen, understand and provide guidance to our customers, resulting in year-over-year increases in the average number of product categories used by both personal and commercial customers. In personal banking, our mortgage balances increased this quarter for the first time since exiting the broker market. Our Spring Home Financing Campaign was launched in March and is designed to give the right advice to help customers make the right home financing decisions. We provide customers with a full suite of attractive products to meet their needs, including our Homeowner ReadiLine and our new, straightforward low fixed-rate mortgage. In commercial banking, we continue to offer BMO SmartSteps for Business to provide small business owners convenient access to advice on how to manage their business. During the quarter we demonstrated our continued support for the agriculture segment with the launch of AgriInvest and the Prairies Financial Flood Relief Program. We continue to rank second in Canadian business lending market share and our goal is to become the bank of choice for businesses across Canada. We are the largest MasterCard issuer in Canada as measured by transaction volumes. We are growing our cards business, while maintaining prudent credit management and have had significantly better credit loss rates than the average of our peers. During the quarter, BMO introduced two new credit card offerings that give small business owners low rates, low fees and simple choices. These new cards feature complimentary membership in the BMO Premium BizAssist program that helps busy small business owners run and protect their business, while delivering significant savings through enhanced rewards and the elimination of an annual card fee.
P&C U.S. (all amounts in U.S. $)
Net income was $38 million, down $14 million or 27% from a year ago. Lower earnings were primarily driven by higher provisions for credit losses on an expected loss basis, the impact of impaired loans and a valuation adjustment on our serviced mortgage portfolio due to lower long-term interest rates. The benefit of loan spread improvement and deposit balance growth was largely offset by the impacts of a decrease in commercial loan balances, due to lower client loan utilization, and deposit spread compression. On a basis that adjusts for the impact of impaired loans, a reduction in the Visa litigation accrual and acquisition integration costs, net income was $54 million, down $11 million or 17% from a year ago. The cash productivity ratio was 72.6%. Adjusted on the same basis as above, the cash productivity ratio was 66.2%. In the last quarter, we announced our acquisition of certain assets and liabilities of AMCORE Bank N.A., a Rockford, Illinois-based bank. Since the closing of the transaction, we have stabilized the acquired operations, made substantial progress towards major integration milestones and initiated a customer calling program to reach out to priority customers. We are on track to complete the conversion of the business to the Harris platform in the fourth quarter. We are progressing on our objective of positioning P&C U.S. for growth through the consolidation of U.S. mid-market clients into our commercial banking model. To provide improved focus and superior advice to our clients, we have added additional resources to support select industry sectors. Leveraging the strong Harris reputation as well as the larger scale of this consolidated commercial banking business should allow us to acquire new customers and grow revenues at a faster pace while improving overall productivity. In personal banking, we have developed Harris Helpful Steps. The program was launched in June and delivers five simple steps to help consumers save more, spend smarter and take control of their finances. For the second consecutive year, the Harris Contact Center was certified as a Center of Excellence by BenchmarkPortal, in conjunction with Purdue University’s Center for Customer-Driven Quality (CCDQ). BenchmarkPortal is a recognized leader in benchmarking and certifying contact centers and only 10% of applicants earn the designation.
BMO Financial Group Third Quarter Report 2010 • 3
Private Client Group (PCG)
Net income was $108 million, a decrease of $5 million or 5.5% from the same quarter a year ago. Results a year ago included a $23 million recovery of prior periods’ income taxes. PCG net income, excluding the insurance business, was $74 million, up a strong $28 million or 54% from a year ago as we continue to see growth across all of our businesses. Insurance net income was $34 million for the quarter, down $33 million or 48% largely due to last year’s tax recovery. The insurance business experienced solid growth in net premiums, the benefit of which was more than offset by the effects of unfavourable movements in interest rates and equity markets on policyholder liabilities. PCG revenue grew by $23 million or 4.5% as there was solid growth across most of our businesses, driven by a 9.5% (11% in source currency) improvement in client assets under management and administration. Revenue from the insurance business was down overall, as growth from net premiums was more than offset by the effects of unfavourable market movements on policyholder liabilities. We remain focused on continuing to deliver the high level of service and advice that our clients expect, especially in the current economic environment. PCG launched eight new Exchange Traded Funds (ETFs) in the quarter, expanding its product line to a total of 30 ETFs. These latest additions further diversify our offering in a number of areas, including the health care and oil and gas sectors. This expansion further demonstrates our commitment to being a leader in the growing Canadian ETF market and offering a full range of investment options to investors.
BMO Capital Markets
Net income was $130 million, a decrease of $180 million or 58% from a year ago. There were lower revenues this quarter after very strong performance in the favourable environments of the preceding four quarters. Lower revenues, both year over year and relative to the second quarter, were driven by a combination of the negative impact of widening credit spreads, lower trading margins and fewer trading opportunities. The weaker economic conditions for corporate banking also contributed to the year over year revenue decline. We are continuing to build our capabilities and have made recent hires to help position us for growth across key sectors as the market environment improves. BMO Capital Markets was involved in 114 new issues in the quarter including 34 corporate debt deals, 32 government deals, 42 common equity transactions and six issues of preferred shares, raising $51 billion or $12 billion more than in the previous quarter.
Corporate Services
Corporate Services incurred a net loss in the quarter of $35 million. Results were $251 million better than in the prior year due primarily to lower provisions for credit losses. Improved revenues were largely offset by higher expenses. Provisions for credit losses charged to Corporate Services were reduced by $272 million. BMO employs a methodology for segmented reporting purposes whereby expected credit losses are charged to the client operating groups, and the difference between expected losses and actual losses is charged (or credited) to Corporate Services.
Caution
The foregoing sections contain forward-looking statements. Please see the Caution Regarding Forward-Looking Statements.

Financial Highlights (Unaudited) (Canadian $ in millions, except as noted) For the three months ended For the nine months ended
July 31, 2010
April 30,
2010
January 31,
2010
October 31,
2009
July 31,
2009
Change from
July 31, 2009
July 31, 2010
July 31,
2009
Change from
July 31, 2009
Income Statement Highlights Total revenue $ 2,907 $ 3,049 $ 3,025 $ 2,989 $ 2,978 (2.4) % $ 8,981 $ 8,075 11.2 % Provision for credit losses 214 249 333 386 417 (48.7) 796 1,217 (34.6)Non-interest expense 1,898 1,830 1,839 1,779 1,873 1.4 5,567 5,602 (0.6)Net income 669 745 657 647 557 20.1 2,071 1,140 81.7
Net Income by Operating Segment
Personal & Commercial Banking Canada $ 426 $ 395 $ 403 $ 398 $ 362 17.3 % $ 1,224 $ 1,017 20.3 % Personal & Commercial Banking U.S. 40 46 51 51 58 (30.9) 137 235 (41.8)Private Client Group 108 118 113 106 113 (5.5) 339 253 33.7 BMO Capital Markets 130 260 214 260 310 (58.0) 604 613 (1.4)Corporate Services (a) (35) (74) (124) (168) (286) 88.0 (233) (978) 76.1
Common Share Data ($) Diluted earnings per share $ 1.13 $ 1.26 $ 1.12 $ 1.11 $ 0.97 $ 0.16 $ 3.51 $ 1.97 $ 1.54 Diluted cash earnings per share (b) 1.14 1.28 1.13 1.13 0.98 0.16 3.55 2.01 1.54 Dividends declared per share 0.70 0.70 0.70 0.70 0.70 0.00 2.10 2.10 0.00 Book value per share 33.13 32.04 32.51 31.95 31.26 1.87 33.13 31.26 1.87 Closing share price 62.87 63.09 52.00 50.06 54.02 8.85 62.87 54.02 8.85 Total market value of common shares ($ billions) 35.4 35.3 28.9 27.6 29.6 5.8 35.4 29.6 5.8
As at
July 31,
2010
April 30,
2010
January 31,
2010
October 31,
2009
July 31,
2009
Change from
July 31, 2009
Balance Sheet Highlights Assets $ 397,386 $ 390,166 $ 398,623 $ 388,458 $ 415,356 (4.3)% Net loans and acceptances 173,555 169,753 169,588 167,829 173,553 (0.0) Deposits 242,791 239,260 240,299 236,156 244,953 (0.9) Common shareholders’ equity 18,646 17,944 18,054 17,626 17,144 8.8
For the three months ended For the nine months ended
July 31,
2010
April 30,
2010
January 31,
2010
October 31,
2009
July 31,
2009
July 31,
2010
July 31,
2009
Financial Measures and Ratios (% except as noted) (c) Average annual five year total shareholder return 5.6 7.2 3.5 1.8 4.0 5.6 4.0 Diluted earnings per share growth 16.5 +100 +100 4.7 (1.0) 78.2 (27.0)Diluted cash earnings per share growth (b) 16.3 +100 +100 4.6 (2.0) 76.6 (26.9)Return on equity 13.7 16.4 14.3 14.0 12.1 14.8 8.5 Cash return on equity (b) 13.9 16.6 14.4 14.2 12.3 14.9 8.7 Net economic profit (NEP) growth (b) +100 +100 +100 10.4 (35.1) +100 (+100)Operating leverage (3.8) 17.9 24.0 8.5 3.3 11.8 (1.2)Cash operating leverage (b) (3.9) 17.7 23.9 8.3 3.3 11.7 (1.2)Revenue growth (2.4) 14.8 23.9 6.3 8.4 11.2 9.2 Non-interest expense growth 1.4 (3.1) (0.1) (2.2) 5.1 (0.6) 10.4 Cash non-interest expense growth (b) 1.5 (2.9) 0.0 (2.0) 5.1 (0.5) 10.4 Non-interest expense-to-revenue ratio 65.3 60.0 60.8 59.5 62.9 62.0 69.4 Cash non-interest expense-to-revenue ratio (b) 65.0 59.7 60.5 59.2 62.5 61.7 69.0 Provision for credit losses-to-average loans and acceptances (annualized) 0.50 0.59 0.79 0.89 0.94 0.62 0.88 Gross impaired loans and acceptances-to-equity and allowance for credit losses 12.81 14.34 13.11 14.06 12.74 12.81 12.74 Cash and securities-to-total assets ratio 34.6 35.8 33.9 31.9 30.0 34.6 30.0 Tier 1 capital ratio 13.55 13.27 12.53 12.24 11.71 13.55 11.71 Total capital ratio 16.10 15.69 14.82 14.87 14.32 16.10 14.32 Credit rating (d) DBRS AA AA AA AA AA AA AA Fitch AA- AA- AA- AA- AA- AA- AA- Moody’s Aa2 Aa2 Aa2 Aa1 Aa1 Aa2 Aa1 Standard & Poor’s A+ A+ A+ A+ A+ A+ A+ Twelve month total shareholder return 22.4 68.7 67.1 25.1 21.4 22.4 21.4 Dividend yield 4.45 4.44 5.38 5.59 5.18 4.45 5.18 Price-to-earnings ratio (times) 13.6 14.1 13.6 16.3 17.8 13.6 17.8 Market-to-book value (times) 1.90 1.97 1.60 1.57 1.73 1.90 1.73 Net economic profit (loss) ($ millions) (b) 158 264 171 159 79 593 (227)Return on average assets 0.67 0.78 0.66 0.63 0.52 0.70 0.34 Net interest margin on average earning assets 1.88 1.88 1.85 1.73 1.74 1.87 1.60 Non-interest revenue-to-total revenue 46.0 50.1 49.3 51.7 50.8 48.5 48.9 Equity-to-assets ratio 5.3 5.3 5.2 5.2 4.7 5.3 4.7
All ratios in this report are based on unrounded numbers. (a) Corporate Services includes Technology and Operations. (b) Refer to the “Non-GAAP Measures” section of Management’s Discussion and Analysis for an
explanation of cash results and net economic profit. Securities regulators require that companies caution readers that earnings and other measures adjusted to a basis other than generally accepted
accounting principles (GAAP) do not have standardized meanings under GAAP and are unlikely to be comparable to similar measures used by other companies.
(c) For the period ended, or as at, as appropriate. (d) For a discussion of the significance of these credit ratings, see “Credit Ratings” on p.16 of Management’s Discussion and Analysis.
Certain comparative figures have been reclassified to conform with the current period’s presentation.
4 • BMO Financial Group Third Quarter Report 2010
Management’s Discussion and Analysis MD&A commentary is as of August 24, 2010. Unless otherwise indicated, all amounts are in Canadian dollars and have been derived from financial statements
prepared in accordance with Canadian generally accepted accounting principles (GAAP). The MD&A should be read in conjunction with the unaudited
consolidated financial statements for the period ended July 31, 2010, included in this document, and the annual MD&A for the year ended October 31, 2009,
included in BMO’s 2009 Annual Report. The material that precedes this section comprises part of this MD&A.
Bank of Montreal uses a unified branding approach that links all of the organization’s member companies. Bank of Montreal, together with its subsidiaries, is known as BMO Financial Group. As such, in this document, the names BMO and BMO Financial Group mean Bank of Montreal, together with its subsidiaries.
Summary Data
(Unaudited) (Canadian $ in millions, except as noted) Q3-2010
Increase (Decrease)
vs. Q3-2009
Increase (Decrease)
vs. Q2-2010 YTD-2010
Increase (Decrease)
vs. YTD-2009
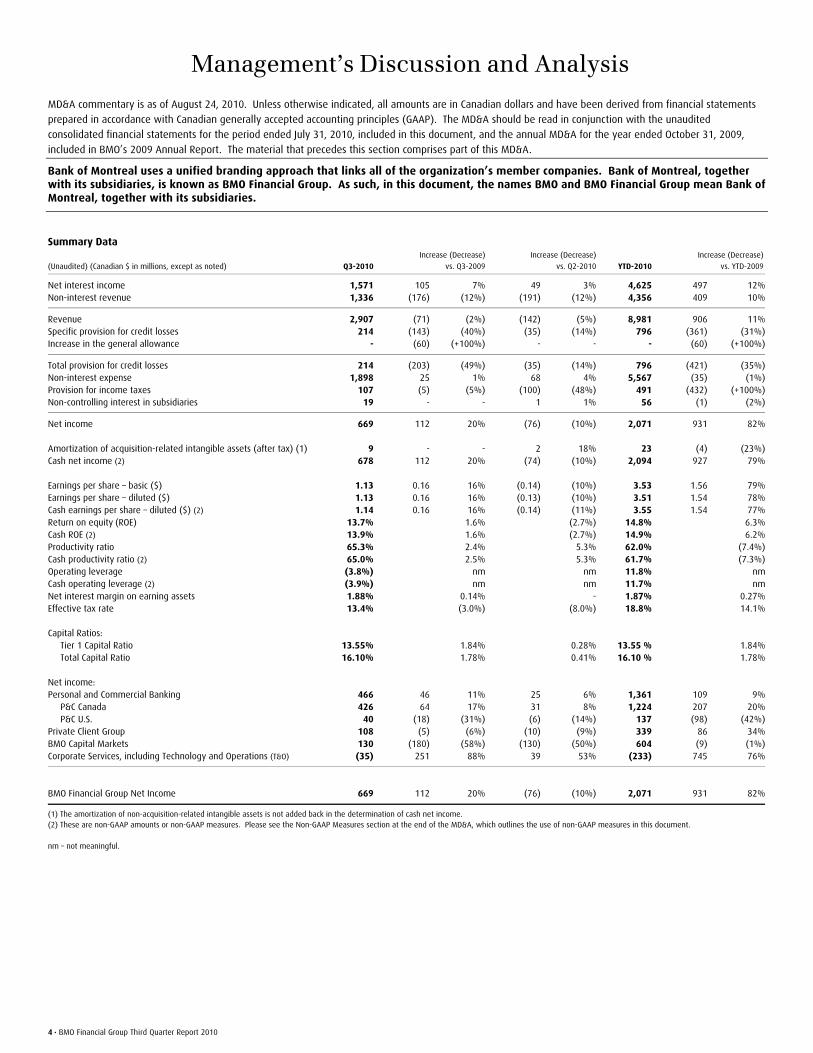
Net interest income 1,571 105 7% 49 3% 4,625 497 12%Non-interest revenue 1,336 (176) (12%) (191) (12%) 4,356 409 10%
Revenue 2,907 (71) (2%) (142) (5%) 8,981 906 11%Specific provision for credit losses 214 (143) (40%) (35) (14%) 796 (361) (31%)Increase in the general allowance - (60) (+100%) - - - (60) (+100%)
Total provision for credit losses 214 (203) (49%) (35) (14%) 796 (421) (35%)Non-interest expense 1,898 25 1% 68 4% 5,567 (35) (1%)Provision for income taxes 107 (5) (5%) (100) (48%) 491 (432) (+100%)Non-controlling interest in subsidiaries 19 - - 1 1% 56 (1) (2%)
Net income 669 112 20% (76) (10%) 2,071 931 82% Amortization of acquisition-related intangible assets (after tax) (1) 9 - - 2 18% 23 (4) (23%)Cash net income (2) 678 112 20% (74) (10%) 2,094 927 79% Earnings per share – basic ($) 1.13 0.16 16% (0.14) (10%) 3.53 1.56 79%Earnings per share – diluted ($) 1.13 0.16 16% (0.13) (10%) 3.51 1.54 78%Cash earnings per share – diluted ($) (2) 1.14 0.16 16% (0.14) (11%) 3.55 1.54 77%Return on equity (ROE) 13.7% 1.6% (2.7%) 14.8% 6.3%Cash ROE (2) 13.9% 1.6% (2.7%) 14.9% 6.2%Productivity ratio 65.3% 2.4% 5.3% 62.0% (7.4%)Cash productivity ratio (2) 65.0% 2.5% 5.3% 61.7% (7.3%)Operating leverage (3.8%) nm nm 11.8% nmCash operating leverage (2) (3.9%) nm nm 11.7% nmNet interest margin on earning assets 1.88% 0.14% - 1.87% 0.27%Effective tax rate 13.4% (3.0%) (8.0%) 18.8% 14.1% Capital Ratios: Tier 1 Capital Ratio 13.55% 1.84% 0.28% 13.55 % 1.84% Total Capital Ratio 16.10% 1.78% 0.41% 16.10 % 1.78% Net income: Personal and Commercial Banking 466 46 11% 25 6% 1,361 109 9% P&C Canada 426 64 17% 31 8% 1,224 207 20% P&C U.S. 40 (18) (31%) (6) (14%) 137 (98) (42%)Private Client Group 108 (5) (6%) (10) (9%) 339 86 34%BMO Capital Markets 130 (180) (58%) (130) (50%) 604 (9) (1%)Corporate Services, including Technology and Operations (T&O) (35) 251 88% 39 53% (233) 745 76%
BMO Financial Group Net Income 669 112 20% (76) (10%) 2,071 931 82%
(1) The amortization of non-acquisition-related intangible assets is not added back in the determination of cash net income. (2) These are non-GAAP amounts or non-GAAP measures. Please see the Non-GAAP Measures section at the end of the MD&A, which outlines the use of non-GAAP measures in this document. nm – not meaningful.

BMO Financial Group Third Quarter Report 2010 • 5
Management’s Responsibility for Financial Information Bank of Montreal's Chief Executive Officer and Chief Financial Officer have signed certifications relating to the appropriateness of the financial disclosures in our interim MD&A and unaudited interim consolidated financial statements for the period ended July 31, 2010 and relating to the design of our disclosure controls and procedures and internal control over financial reporting. Bank of Montreal's management, under the supervision of the CEO and CFO, has evaluated the effectiveness, as at July 31, 2010, of Bank of Montreal's disclosure controls and procedures (as defined in the rules of the Securities and Exchange Commission and the Canadian Securities Administrators) and has concluded that such disclosure controls and procedures are effective. Bank of Montreal's internal control over financial reporting includes policies and procedures that: pertain to the maintenance of records that in reasonable detail accurately and fairly reflect the transactions and dispositions of the assets of BMO; provide reasonable assurance that transactions are recorded as necessary to permit preparation of the financial statements in accordance with Canadian generally accepted accounting principles and the requirements of the Securities and Exchange Commission in the United States, as applicable; ensure receipts and expenditures of BMO are being made only in accordance with authorizations of management and directors of Bank of Montreal; and provide reasonable assurance regarding prevention or timely detection of unauthorized acquisition, use or disposition of BMO assets that could have a material effect on the financial statements. Because of its inherent limitations, internal control over financial reporting can provide only reasonable assurance and may not prevent or detect misstatements. Further, projections of any evaluation of effectiveness to future periods are subject to the risk that controls may become inadequate because of changes in conditions, or that the degree of compliance with the policies or procedures may deteriorate. There were no changes in our internal control over financial reporting during the quarter ended July 31, 2010 that materially affected, or are reasonably likely to materially affect, our internal control over financial reporting. As in prior quarters, Bank of Montreal's audit committee reviewed this document, including the unaudited interim consolidated financial statements, and Bank of Montreal’s Board of Directors approved the document prior to its release. A comprehensive discussion of our businesses, strategies and objectives can be found in Management’s Discussion and Analysis in BMO's 2009 Annual Report, which can be accessed on our website at www.bmo.com/investorrelations. Readers are also encouraged to visit the site to view other quarterly financial information.
Caution Regarding Forward-Looking Statements Bank of Montreal’s public communications often include written or oral forward-looking statements. Statements of this type are included in this document, and may be included in other filings with Canadian securities regulators or the U.S. Securities and Exchange Commission, or in other communications. All such statements are made pursuant to the safe harbour provisions of, and are intended to be forward-looking statements under, the United States Private Securities Litigation Reform Act of 1995 and any applicable Canadian securities legislation. Forward-looking statements may involve, but are not limited to, comments with respect to our objectives and priorities for 2010 and beyond, our strategies or future actions, our targets, expectations for our financial condition or share price, and the results of or outlook for our operations or for the Canadian and U.S. economies. By their nature, forward-looking statements require us to make assumptions and are subject to inherent risks and uncertainties. There is significant risk that predictions, forecasts, conclusions or projections will not prove to be accurate, that our assumptions may not be correct and that actual results may differ materially from such predictions, forecasts, conclusions or projections. We caution readers of this document not to place undue reliance on our forward-looking statements as a number of factors could cause actual future results, conditions, actions or events to differ materially from the targets, expectations, estimates or intentions expressed in the forward-looking statements. The future outcomes that relate to forward-looking statements may be influenced by many factors, including but not limited to: general economic and market conditions in the countries in which we operate; interest rate and currency value fluctuations; changes in monetary policy; the degree of competition in the geographic and business areas in which we operate; changes in laws; judicial or regulatory proceedings; the accuracy and completeness of the information we obtain with respect to our customers and counterparties; our ability to execute our strategic plans and to complete and integrate acquisitions; critical accounting estimates; operational and infrastructure risks; general political conditions; global capital market activities; the possible effects on our business of war or terrorist activities; disease or illness that impacts on local, national or international economies; disruptions to public infrastructure, such as transportation, communications, power or water supply; and technological changes. We caution that the foregoing list is not exhaustive of all possible factors. Other factors could adversely affect our results. For more information, please see the discussion on pages 32 and 33 of BMO’s 2009 Annual Report, which outlines in detail certain key factors that may affect BMO’s future results. When relying on forward-looking statements to make decisions with respect to Bank of Montreal, investors and others should carefully consider these factors, as well as other uncertainties and potential events, and the inherent uncertainty of forward-looking statements. Bank of Montreal does not undertake to update any forward-looking statement, whether written or oral, that may be made, from time to time, by the organization or on its behalf, except as required by law. The forward-looking information contained in this document is presented for the purpose of assisting our shareholders in understanding our financial position as at and for the periods ended on the dates presented and our strategic priorities and objectives, and may not be appropriate for other purposes. In concluding that we will complete the conversion of the operations acquired through the second quarter Rockford, Illinois-based bank transaction, we have assumed that no competing priorities emerge that take a priority claim to the needed staffing and technical resources and that no serious systems problems arise on the conversion. Assumptions about the performance of the Canadian and U.S. economies as well as overall market conditions and their combined effect on the bank’s business, including those described under the heading Economic Outlook and Review, are material factors we consider when determining our strategic priorities, objectives and expectations for our business. In determining our expectations for economic growth, both broadly and in the financial services sector, we primarily consider historical economic data provided by the Canadian and U.S. governments and their agencies.
Regulatory Filings Our continuous disclosure materials, including our interim filings, annual MD&A and audited consolidated financial statements, our Annual Information Form and the Notice of Annual Meeting of Shareholders and Proxy Circular are available on our website at www.bmo.com/investorrelations, on the Canadian Securities Administrators’ website at www.sedar.com and on the EDGAR section of the SEC’s website at www.sec.gov.

6 • BMO Financial Group Third Quarter Report 2010
Economic Outlook and Review
Canada’s economic recovery is continuing, albeit at a more moderate rate than earlier in the year. Employment is growing briskly and business investment has picked up. However, consumer spending is moderating and housing has slowed from the high levels of activity last year. Since the recession ended last summer, the economy has regained nearly all of its lost output and jobs. It is expected to continue growing at a moderate rate this year, supported by still-low interest rates, expansive fiscal policy and steady global demand for commodities. However, housing should weaken further because some demand was pulled forward in anticipation of higher interest rates, tighter mortgage rules and the new harmonized sales tax introduced in Ontario and British Columbia. Exports are expected to slow in response to a stronger Canadian dollar. The economy is projected to grow 3.2% in 2010 and 2.8% in 2011, lowering the unemployment rate to 7.4% at the end of 2011. The Bank of Canada will likely continue to tighten monetary policy gradually in the year ahead. Higher interest rates should restrain growth in personal credit and residential mortgages, although rising business investment will support commercial loan demand. The U.S. economy continues to grow moderately, supported by expansionary monetary and fiscal policies and healthy global demand. Business capital spending remains strong amid solid earnings growth. However, personal consumption has been restrained by weak employment growth, tight credit conditions and balance sheet deleveraging. Commercial real estate remains weak, due to high vacancy rates, and home sales fell sharply after the homebuyer tax credit ended in April. The U.S. economy is projected to grow 2.9% in 2010 and 2.7% in 2011, with support from low interest rates tempered by tighter fiscal policy next year. Consumer and business loan demand should improve slowly as credit standards ease. With unemployment high and inflation low, the Federal Reserve is expected to maintain its policy of very low interest rates well into 2011. Capital markets activity should benefit as the economic expansion continues, with companies taking advantage of low interest rates to issue new debt or refinance. Our U.S. banking operations are largely located in the Midwest, a region that is generally tracking the national growth trend. Manufacturing and consumer spending have slowed somewhat from earlier in the year, while housing and commercial real estate remain weak. The Midwest economy is expected to grow moderately in the year ahead, consistent with the rest of the country. This Economic Outlook section contains forward-looking statements. Please see the Caution Regarding Forward-Looking Statements.
Foreign Exchange
The Canadian dollar equivalents of BMO’s U.S.-dollar-denominated net income, revenues, expenses, provisions for credit losses and income taxes were decreased relative to the third quarter of 2009 due to the weakening of the U.S. dollar, but were increased relative to the second quarter of 2010 by the strengthening of the U.S. dollar from the second quarter. The average Canadian/U.S. dollar exchange rate, expressed in terms of the Canadian dollar cost of a U.S. dollar, fell by 6% from a year ago and rose by 2% from the average of the second quarter of 2010. The following table indicates the relevant average Canadian/U.S. dollar exchange rates and the impact of changes in the rates. Effects of U.S. Dollar Exchange Rate Fluctuations on BMO’s Results Q3-2010 YTD-2010 vs.
(Canadian $ in millions, except as noted) vs. Q3-2009 vs. Q2-2010 YTD-2009
Canadian/U.S. dollar exchange rate (average)
Current period 1.0453 1.0453 1.0439 Prior period 1.1102 1.0273 1.1925Increased (decreased) revenue (45) 12 (329)Decreased (increased) expense 29 (8) 191Decreased (increased) provision for credit losses 7 (1) 63Decreased (increased) income taxes and
minority interest - - 17
Increased (decreased) net income (9) 3 (58)
At the start of each quarter, BMO assesses whether to enter into hedging transactions that are expected to partially offset the pre-tax effects of exchange rate fluctuations in the quarter on our expected U.S.-dollar-denominated net income for that quarter. As such, the hedging activities partially mitigate the impact of exchange rate fluctuations within a single quarter; however, the hedging transactions are not designed to offset the impact of year-over-year or quarter-over-quarter fluctuations in exchange rates. The U.S. dollar strengthened over the course of the current quarter, as the exchange rate increased from Cdn$1.0158 per U.S. dollar at April 30, 2010 to an average of Cdn$1.0453. The gain or loss from hedging transactions in future periods will be determined by both future currency fluctuations and the amount of underlying future hedging transactions, since the transactions are entered into each quarter in relation to expected U.S.-dollar-denominated net income for the next three months. Hedging transactions resulted in an after-tax gain of $5 million for the year to date. The effect of currency fluctuations on our investments in foreign operations is discussed in the Income Taxes section. Other Value Measures
Net economic profit was $158 million (see the Non-GAAP Measures section), compared with $264 million in the second quarter and $79 million in the third quarter of 2009. BMO’s average annual total shareholder return for the five-year period ended July 31, 2010 was 5.6%.
BMO Financial Group Third Quarter Report 2010 • 7
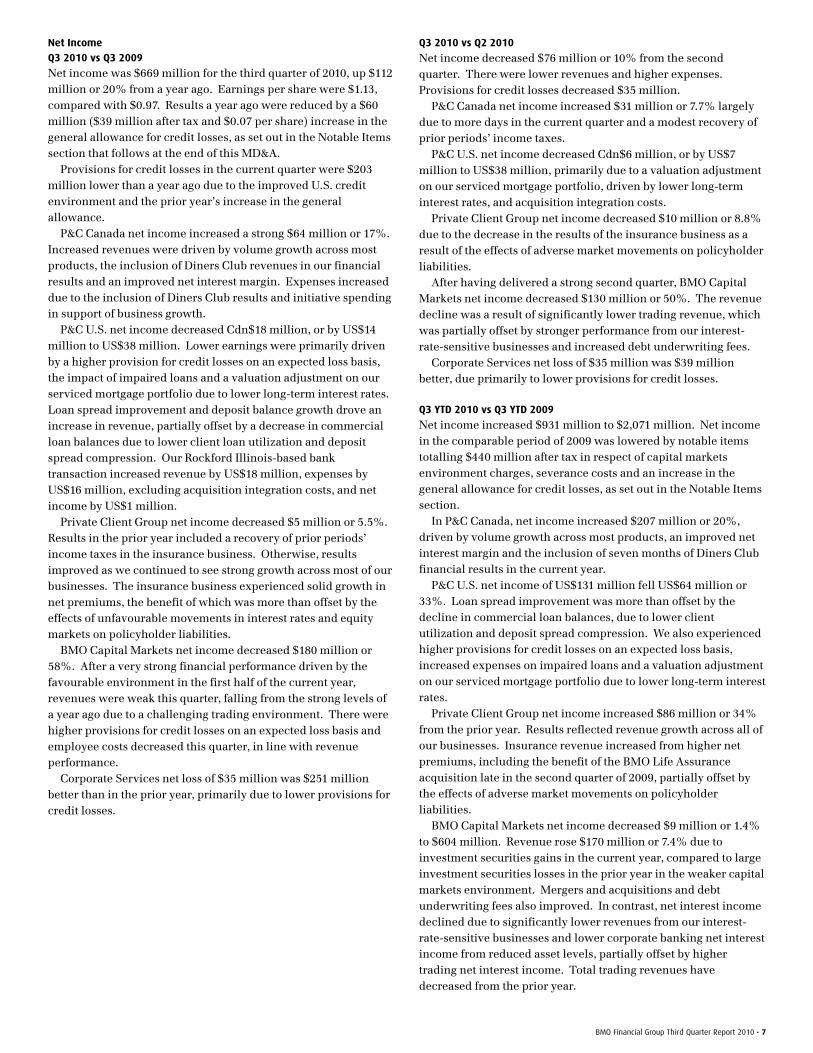
Net Income Q3 2010 vs Q3 2009
Net income was $669 million for the third quarter of 2010, up $112 million or 20% from a year ago. Earnings per share were $1.13, compared with $0.97. Results a year ago were reduced by a $60 million ($39 million after tax and $0.07 per share) increase in the general allowance for credit losses, as set out in the Notable Items section that follows at the end of this MD&A. Provisions for credit losses in the current quarter were $203 million lower than a year ago due to the improved U.S. credit environment and the prior year’s increase in the general allowance. P&C Canada net income increased a strong $64 million or 17%. Increased revenues were driven by volume growth across most products, the inclusion of Diners Club revenues in our financial results and an improved net interest margin. Expenses increased due to the inclusion of Diners Club results and initiative spending in support of business growth. P&C U.S. net income decreased Cdn$18 million, or by US$14 million to US$38 million. Lower earnings were primarily driven by a higher provision for credit losses on an expected loss basis, the impact of impaired loans and a valuation adjustment on our serviced mortgage portfolio due to lower long-term interest rates. Loan spread improvement and deposit balance growth drove an increase in revenue, partially offset by a decrease in commercial loan balances due to lower client loan utilization and deposit spread compression. Our Rockford Illinois-based bank transaction increased revenue by US$18 million, expenses by US$16 million, excluding acquisition integration costs, and net income by US$1 million. Private Client Group net income decreased $5 million or 5.5%. Results in the prior year included a recovery of prior periods’ income taxes in the insurance business. Otherwise, results improved as we continued to see strong growth across most of our businesses. The insurance business experienced solid growth in net premiums, the benefit of which was more than offset by the effects of unfavourable movements in interest rates and equity markets on policyholder liabilities. BMO Capital Markets net income decreased $180 million or 58%. After a very strong financial performance driven by the favourable environment in the first half of the current year, revenues were weak this quarter, falling from the strong levels of a year ago due to a challenging trading environment. There were higher provisions for credit losses on an expected loss basis and employee costs decreased this quarter, in line with revenue performance. Corporate Services net loss of $35 million was $251 million better than in the prior year, primarily due to lower provisions for credit losses.
Q3 2010 vs Q2 2010
Net income decreased $76 million or 10% from the second quarter. There were lower revenues and higher expenses. Provisions for credit losses decreased $35 million. P&C Canada net income increased $31 million or 7.7% largely due to more days in the current quarter and a modest recovery of prior periods’ income taxes. P&C U.S. net income decreased Cdn$6 million, or by US$7 million to US$38 million, primarily due to a valuation adjustment on our serviced mortgage portfolio, driven by lower long-term interest rates, and acquisition integration costs. Private Client Group net income decreased $10 million or 8.8% due to the decrease in the results of the insurance business as a result of the effects of adverse market movements on policyholder liabilities. After having delivered a strong second quarter, BMO Capital Markets net income decreased $130 million or 50%. The revenue decline was a result of significantly lower trading revenue, which was partially offset by stronger performance from our interest-rate-sensitive businesses and increased debt underwriting fees. Corporate Services net loss of $35 million was $39 million better, due primarily to lower provisions for credit losses. Q3 YTD 2010 vs Q3 YTD 2009
Net income increased $931 million to $2,071 million. Net income in the comparable period of 2009 was lowered by notable items totalling $440 million after tax in respect of capital markets environment charges, severance costs and an increase in the general allowance for credit losses, as set out in the Notable Items section. In P&C Canada, net income increased $207 million or 20%, driven by volume growth across most products, an improved net interest margin and the inclusion of seven months of Diners Club financial results in the current year. P&C U.S. net income of US$131 million fell US$64 million or 33%. Loan spread improvement was more than offset by the decline in commercial loan balances, due to lower client utilization and deposit spread compression. We also experienced higher provisions for credit losses on an expected loss basis, increased expenses on impaired loans and a valuation adjustment on our serviced mortgage portfolio due to lower long-term interest rates. Private Client Group net income increased $86 million or 34% from the prior year. Results reflected revenue growth across all of our businesses. Insurance revenue increased from higher net premiums, including the benefit of the BMO Life Assurance acquisition late in the second quarter of 2009, partially offset by the effects of adverse market movements on policyholder liabilities. BMO Capital Markets net income decreased $9 million or 1.4% to $604 million. Revenue rose $170 million or 7.4% due to investment securities gains in the current year, compared to large investment securities losses in the prior year in the weaker capital markets environment. Mergers and acquisitions and debt underwriting fees also improved. In contrast, net interest income declined due to significantly lower revenues from our interest-rate-sensitive businesses and lower corporate banking net interest income from reduced asset levels, partially offset by higher trading net interest income. Total trading revenues have decreased from the prior year.

8 • BMO Financial Group Third Quarter Report 2010
Corporate Services net loss improved $745 million from a year ago. The improvement was attributable to significantly higher revenues, a large reduction in provisions for credit losses and reduced expenses. Improved revenues were driven by a lower negative carry on certain asset-liability interest rate positions as a result of management actions and more stable market conditions. Revenues in 2009 were lowered by funding activities that enhanced our strong liquidity position. There were $118 million ($80 million after tax) of severance costs recorded in the second quarter of 2009, as set out in the Notable Items section. Revenue
BMO analyzes consolidated revenues on a GAAP basis. However, like many banks, BMO analyzes revenue of its operating groups and associated ratios computed using revenue on a taxable equivalent basis (teb). This basis includes an adjustment that increases GAAP revenues and the GAAP provision for income taxes by an amount that would raise revenues on certain tax-exempt items to a level equivalent to amounts that would incur tax at the statutory rate. The offset to the group teb adjustments is reflected in Corporate Services results. In the current quarter and for applicable prior periods, we have now accounted for certain BMO Capital Markets transactions on a basis that reflects their teb. We believe these adjustments are useful and reflect how BMO Capital Markets manages its business, since it enhances the comparability of taxable revenues and tax-advantaged revenues. The change results in increases in net interest income and income taxes in BMO Capital Markets with offsetting amounts reflected in Corporate Services. There was no overall net income change in either of the two groups. Total revenue decreased $71 million or 2.4% from a year ago primarily due to a significant reduction in BMO Capital Markets. Revenue was appreciably higher in P&C Canada and in Corporate Services. The Rockford, Illinois-based bank transaction added to revenues in the quarter. The weaker U.S. dollar decreased revenue growth by $45 million or 1.5 percentage points, primarily in BMO Capital Markets and P&C U.S. Revenue decreased $142 million or 4.7% from the second quarter of 2010, due largely to lower revenues in BMO Capital Markets. The stronger U.S. dollar increased revenue growth by $12 million or 0.4 percentage points. Changes in net interest income and non-interest revenue are reviewed in the sections that follow. Net Interest Income
Net interest income increased $105 million or 7.2% from a year ago due primarily to improvement in P&C Canada and Corporate Services. There was a reduction in BMO Capital Markets. As discussed in the section above, certain amounts reflected in Capital Markets in prior periods have been restated to reflect their teb with an offsetting adjustment in Corporate Services. BMO’s overall net interest margin improved 14 basis points year over year to 1.88%. There were increases in P&C Canada and P&C U.S. In P&C Canada, the improvement was due mainly to an increase in spreads on deposit products from unusually low levels a year ago. In P&C U.S., the improvement was due to better loan spreads and deposit balance growth, partially offset by deposit spread compression. In BMO Capital Markets the decrease was mainly due to lower spreads on lending assets partly offset by higher spreads in trading assets. Corporate Services improved net
interest income was primarily due to a lower negative carry on certain asset-liability interest rate positions as a result of management actions and more stable market conditions. Average earning assets decreased $4 billion or 1.2% relative to a year ago, but adjusted to exclude the impact of the weaker U.S. dollar, increased by $3 billion. On a Canadian dollar basis, the decrease was driven by a reduction in BMO Capital Markets due mainly to reduced money market and corporate lending assets. P&C U.S. average earning assets were also lower as underlying origination growth was more than offset by lower client loan utilization and new mortgage originations being sold in the secondary market. There was volume growth in P&C Canada and Private Client Group. Relative to the second quarter, net interest income rose $49 million or 3.2%. The increase was mainly due to more days this quarter as well as increased group margins in P&C Canada and P&C U.S. P&C Canada margin rose due primarily to higher volumes in more profitable products and higher mortgage refinancing fees. P&C U.S. net interest margin growth was attributable to improved loan spreads. BMO’s overall net interest margin was unchanged. Increased group margins in P&C Canada and P&C U.S. were offset by lower net interest income in Corporate Services and a lower margin in BMO Capital Markets due to decreased spreads on trading assets. Average earning assets decreased $0.5 billion as a decrease in trading assets in BMO Capital Markets offset growth in P&C Canada. The stronger U.S. dollar this quarter increased total bank earning assets by $2 billion. Year to date, net interest income increased $497 million or 12%, due largely to growth in P&C Canada and Corporate Services. BMO’s overall net interest margin improved 27 basis points for the year to date to 1.87%. Improved margin in P&C Canada was due mainly to actions taken in 2009 to mitigate the impact of rising long-term funding costs and higher volumes in more profitable products. In P&C U.S., improved loan spreads were only partially offset by lower deposit income due to spread compression and lower deposit balances. Corporate Services improved net interest income was primarily due to a lower negative carry on certain asset-liability interest rate positions as a result of management actions and more stable market conditions. Revenues in 2009 were lowered by funding activities that enhanced our strong liquidity position. BMO Capital Markets’ margin was flat as higher spreads on trading assets were offset by lower spreads on money market and corporate lending assets. Average earning assets for the year to date decreased $15 billion or 4.3% relative to a year ago, but increased by $1 billion adjusted to exclude the impact of the weaker U.S. dollar. On a Canadian dollar basis, the decrease was driven by a reduction in BMO Capital Markets due mainly to reduced money market and corporate lending assets. P&C U.S. average earning assets were also lower due in part to the weaker U.S. dollar. There were increases in average earning assets of P&C Canada, due mainly to strong growth in consumer lending and the addition of Diners Club cards balances. Private Client Group assets also increased, due mainly to the acquisition of BMO Life Assurance.

BMO Financial Group Second Quarter Report 2010 • 9
Net Interest Margin (teb)*
(In basis points) Q3-2010
Increase (Decrease) vs.
Q3-2009
Increase (Decrease) vs.
Q2-2010 YTD-2010
Increase (Decrease) vs.
YTD-2009
P&C Canada 296 9 5 294 14P&C U.S. 370 59 15 353 41
Personal and Commercial Client Group 308 17 5 305 18Private Client Group ** 277 (16) (3) 279 (73)BMO Capital Markets 95 (1) (6) 96 (1)Corporate Services, including Technology and Operations (T&O)*** nm nm nm nm nm
Total BMO 188 14 - 187 27
Total Canadian Retail**** 295 5 7 293 8
* Net interest margin is disclosed and computed with reference to average earning assets, rather than total assets. This basis provides a more relevant measure of margins and changes in margins. Operating group margins are stated on a teb basis while total BMO margin is stated on a GAAP basis.
** PCG’s Q2 2009 acquisition of BMO Life Assurance added assets that earn non-interest revenue, accounting for a reduction in PCG’s net interest margin of 66 basis points for the year to date. Adjusted to exclude the impact of the acquisition, PCG’s net interest margin for the year to date decreased 7 basis points year over year.
*** Corporate Services net interest income is negative and lowers BMO’s overall net interest margin to a greater degree in 2009 than in 2010. **** Total Canadian retail margin represents the net interest margin of the combined Canadian business of P&C Canada and Private Client Group. nm - not meaningful
Non-Interest Revenue
Non-interest revenue is detailed in the attached unaudited consolidated financial statements. Non-interest revenue decreased $176 million or 12% from a year ago. The decrease was due to reduced revenues in BMO Capital Markets. There were significant decreases in trading revenues, driven by a combination of the negative impact of widening credit spreads, lower trading margins and fewer trading opportunities. Securitization revenue, insurance revenue and underwriting fees were also lower. There were increases in mutual fund revenues and securities commissions as well as investment securities gains. Card fees also increased, due largely to the Diners Club acquisition in the first quarter of 2010. Securitization revenues decreased $35 million from a year ago to $167 million. There was a $1.6 billion reduction in securitized assets. Revenues included gains of $20 million on the sale of loans for new securitizations, up $5 million from a year ago, and gains of $107 million on sales of loans to revolving securitization vehicles, down $42 million from a year ago. The combined impact of securitizing assets in the current and prior periods decreased pre-tax income in the current quarter by $21 million. We recorded securitization revenues of $167 million. We recognized less interest income ($126 million less); reduced credit card fees ($112 million less); and lower provisions for credit losses ($50 million less). We securitize loans primarily to obtain alternate sources of cost-effective funding. In the quarter, we securitized $1.7 billion of residential mortgage loans. Securitizations are detailed in Note 3 to the attached unaudited consolidated financial statements. Relative to the second quarter, non-interest revenue decreased $191 million or 12%. The decrease was primarily attributable to BMO Capital Markets with a smaller reduction in Private Client Group. Trading revenues were significantly lower, driven by a combination of the negative impact of widening credit spreads, lower trading margins and fewer trading opportunities. Investment securities gains and insurance revenues were also lower. Securitization revenues, lending fees and other revenues increased. Year to date, non-interest revenue increased $409 million or 10% due primarily to BMO Capital Markets. The improvement was largely attributable to the prior year’s $471 million charge
related to the Canadian credit protection vehicle, as outlined in the Notable Items section. There was very strong growth in investment securities gains due to the large losses in the prior year. There were good increases in card services revenues, securities commissions, mergers and acquisitions fees and debt underwriting fees due to better economic conditions. There was good growth in P&C Canada due to higher revenue from cards, due largely to the inclusion of seven months of Diners Club financial results in the current year. Securitization revenues and trading revenues were sharply lower than a year ago.
Non-Interest Expense
Non-interest expense is detailed in the attached unaudited consolidated financial statements. Non-interest expense increased $25 million or 1.4% from a year ago to $1,898 million. The weaker U.S. dollar reduced expense growth by $29 million or 1.6 percentage points. Expense growth was largely due to the Rockford, Illinois-based bank transaction in the second quarter, higher initiative spending and increased provincial sales tax (PST). There were also increases in premises and equipment including computer costs, related to software development, and in professional fees, primarily related to supporting our business growth. Employee compensation costs were lower due in large part to reduced performance-based compensation, partly offset by higher salaries from increased staffing in all groups, reflecting our strategic investments. Non-interest expense increased $68 million or 3.8% from the second quarter. The stronger U.S. dollar increased expense growth by $8 million or 0.5 percentage points and more calendar days in the third quarter also contributed to the increase in expense. There were increases for investments in technology, as well as increases in professional fees, as outlined above, PST and capital taxes. Costs of the acquired business also contributed to expense growth. Employee compensation costs were slightly lower due to reductions in performance-based costs and severance, despite higher staffing levels as we invest in the businesses. Year to date, non-interest expense decreased $35 million or 0.6% to $5,567 million. The weaker U.S. dollar lowered expense growth by $191 million or 3.4 percentage points. Employee compensation costs decreased as results a year ago included a $118 million severance charge in Corporate Services. Adjusted for

10 • BMO Financial Group Third Quarter Report 2010
the severance charge, increased employee compensation costs included higher performance-based compensation, in line with improved results, partly offset by lower salaries and benefits costs. There were reductions in premises costs including computer costs, professional fees and deposit insurance. The foregoing reductions were offset in part by the effect of acquired businesses. Cash operating leverage for the year-to-date period was 11.7%. We continue to focus on managing our expenses while growing and investing in our businesses. On July 1, 2010, the harmonized sales tax was implemented in both Ontario and British Columbia. This has increased the sales tax paid in these two jurisdictions. The result is expected to be a net increase in expense to our Canadian operations but the increase is not expected to be significant. Risk Management
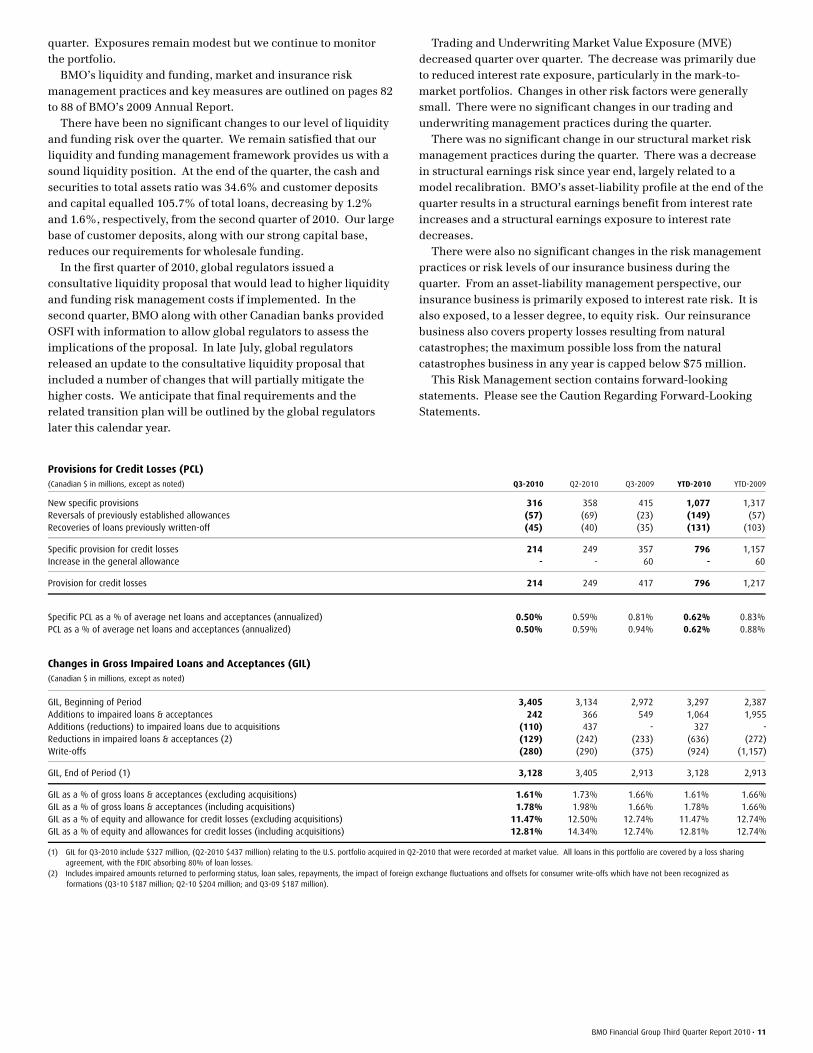
The most significant risks we face continue to relate to uncertainty regarding the strength of the economic recovery, especially in the United States. While credit migration is lower in most portfolios, in the United States the slow pace of job growth and weak housing market continue to impact the residential real estate portfolios. U.S. commercial real estate markets also remain weak. In addition, concerns over European sovereign debt may add volatility to the fragile recovery. Credit losses in the loan portfolio continue to moderate. Specific provisions for credit losses in the third quarter of 2010 were $214 million or an annualized 50 basis points of average net loans and acceptances, compared with $249 million or 59 basis points in the second quarter of 2010 and $357 million or 81 basis points in the third quarter of 2009. The decrease in current quarter provisions was mainly driven by lower migration in the portfolio, given the economic recovery, and higher reversals and recoveries than experienced a year ago. On a geographic basis, specific provisions in Canada and other countries were $110 million in the third quarter of 2010, $126 million in the second quarter of 2010 and $164 million in the third quarter of 2009. Provisions in the United States for the comparable periods were $104 million, $123 million and $193 million, respectively. There was no general provision in the quarter or in the second quarter of 2010. There was a $60 million increase in the general allowance in the third quarter of 2009. The small increase in the general allowance during the current quarter was due to changes in foreign exchange rates. BMO employs a methodology for segmented reporting purposes whereby expected credit losses are charged to the client operating groups quarterly, based on their share of expected credit losses. The difference between quarterly charges based on expected losses and required quarterly provisions based on actual losses is charged (or credited) to Corporate Services. The following paragraphs outline credit losses by client operating group based on actual credit losses, rather than their share of expected credit losses. Actual credit losses in the third quarter of 2010 were: $171 million in P&C Canada; $103 million in P&C U.S.; and a recovery of $10 million in BMO Capital Markets. The P&C Canada losses of $171 million include credit losses of $50 million related to securitized assets, which are reflected as a reduction of non-interest revenue in Corporate Services under our securitization
reporting methodology and are therefore not included in BMO’s $214 million of specific provisions. Actual credit losses in the second quarter of 2010 were: $205 million in P&C Canada (which includes losses of $55 million on securitized assets reported as a reduction of non-interest revenue in Corporate Services); $101 million in P&C U.S.; $2 million in PCG and a recovery of $4 million in BMO Capital Markets. Actual credit losses in the third quarter of 2009 were: $177 million in P&C Canada (which includes losses of $43 million on securitized assets reported as a reduction of non-interest revenue in Corporate Services); $132 million in P&C U.S.; $7 million in PCG and $84 million in BMO Capital Markets. Formations decreased in the current quarter, with new impaired loan formations totalling $242 million, down from $366 million in the preceding quarter and from $549 million in the same quarter a year ago. U.S.-related formations accounted for over half of BMO’s total new formations. Total gross impaired loans were $3,128 million at the end of the current reporting period, down from $3,405 million at the end of the second quarter and up from $2,913 million in the third quarter of 2009. Impaired loans in the third quarter include $327 million (down from the preliminary estimate of $437 million in the preceding quarter) of the loans acquired in the second quarter Rockford, Illinois-based bank transaction. No allowance was required on the acquisition in the second quarter because the loans were recorded at fair market value. Under the terms of the transaction, the Federal Deposit Insurance Corporation (FDIC) absorbs 80% of losses on the acquired loans. Excluding those loans in both periods, gross impaired loans, at $2,801 million, were down from $2,968 million at the end of second quarter. The impaired loans from the acquisition are not included in the formations figures above. The total allowance for credit losses at the end of the quarter was $1,879 million, compared with $1,885 million in the preceding quarter. Allowances were comprised of a specific allowance of $577 million and a general allowance of $1,302 million. The general allowance is maintained to absorb impairment in the existing credit portfolio that cannot yet be associated with specific credit assets and is assessed on a quarterly basis. There were $13 million of impaired loan sales in the current quarter, $5 million of sales in the second quarter of 2010 and $40 million of sales in the third quarter a year ago. BMO’s loan book continues to be comprised of consumer and commercial portfolios that are well diversified. Total consumer and commercial loans represented 86.1% of the loan portfolio at the end of the quarter, up from 86.0% in the second quarter and 78.7% a year ago. Approximately 88.2% of the total consumer portfolio is comprised of secured loans. Excluding credit card loans, approximately 90.7% of consumer loans are secured. In the United States, the consumer portfolio totals US$14.8 billion and is primarily comprised of three main asset classes: residential first mortgages 33%, home equity products 33% and indirect automobile loans 29%. The consumer portfolio continues to be pressured by weak job and housing markets. The U.S. commercial real estate market remains weak. In the euro zone region, BMO’s exposures to Greece, Ireland, Italy, Portugal and Spain are mostly related to financial institutions for trade finance, lending and trading products. There was no significant change in the exposure of BMO or the BMO-managed structured investment vehicles to the region during the
BMO Financial Group Third Quarter Report 2010 • 11
quarter. Exposures remain modest but we continue to monitor the portfolio.
BMO’s liquidity and funding, market and insurance risk management practices and key measures are outlined on pages 82 to 88 of BMO’s 2009 Annual Report. There have been no significant changes to our level of liquidity and funding risk over the quarter. We remain satisfied that our liquidity and funding management framework provides us with a sound liquidity position. At the end of the quarter, the cash and securities to total assets ratio was 34.6% and customer deposits and capital equalled 105.7% of total loans, decreasing by 1.2% and 1.6%, respectively, from the second quarter of 2010. Our large base of customer deposits, along with our strong capital base, reduces our requirements for wholesale funding. In the first quarter of 2010, global regulators issued a consultative liquidity proposal that would lead to higher liquidity and funding risk management costs if implemented. In the second quarter, BMO along with other Canadian banks provided OSFI with information to allow global regulators to assess the implications of the proposal. In late July, global regulators released an update to the consultative liquidity proposal that included a number of changes that will partially mitigate the higher costs. We anticipate that final requirements and the related transition plan will be outlined by the global regulators later this calendar year.
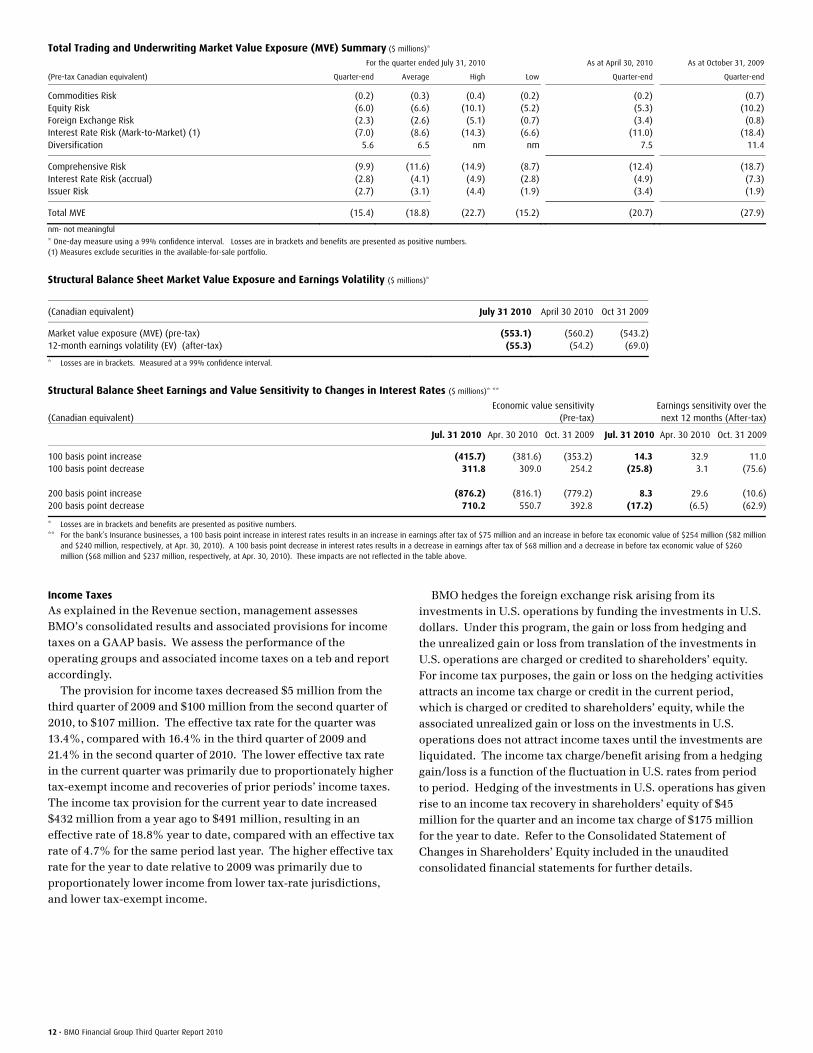
Trading and Underwriting Market Value Exposure (MVE) decreased quarter over quarter. The decrease was primarily due to reduced interest rate exposure, particularly in the mark-to-market portfolios. Changes in other risk factors were generally small. There were no significant changes in our trading and underwriting management practices during the quarter. There was no significant change in our structural market risk management practices during the quarter. There was a decrease in structural earnings risk since year end, largely related to a model recalibration. BMO’s asset-liability profile at the end of the quarter results in a structural earnings benefit from interest rate increases and a structural earnings exposure to interest rate decreases. There were also no significant changes in the risk management practices or risk levels of our insurance business during the quarter. From an asset-liability management perspective, our insurance business is primarily exposed to interest rate risk. It is also exposed, to a lesser degree, to equity risk. Our reinsurance business also covers property losses resulting from natural catastrophes; the maximum possible loss from the natural catastrophes business in any year is capped below $75 million. This Risk Management section contains forward-looking statements. Please see the Caution Regarding Forward-Looking Statements.
Provisions for Credit Losses (PCL) (Canadian $ in millions, except as noted) Q3-2010 Q2-2010 Q3-2009 YTD-2010 YTD-2009 New specific provisions 316 358 415 1,077 1,317Reversals of previously established allowances (57) (69) (23) (149) (57)Recoveries of loans previously written-off (45) (40) (35) (131) (103) Specific provision for credit losses 214 249 357 796 1,157Increase in the general allowance - - 60 - 60 Provision for credit losses 214 249 417 796 1,217 Specific PCL as a % of average net loans and acceptances (annualized) 0.50% 0.59% 0.81% 0.62% 0.83%PCL as a % of average net loans and acceptances (annualized) 0.50% 0.59% 0.94% 0.62% 0.88%
Changes in Gross Impaired Loans and Acceptances (GIL) (Canadian $ in millions, except as noted)
GIL, Beginning of Period 3,405 3,134 2,972 3,297 2,387Additions to impaired loans & acceptances 242 366 549 1,064 1,955Additions (reductions) to impaired loans due to acquisitions (110) 437 - 327 -Reductions in impaired loans & acceptances (2) (129) (242) (233) (636) (272)Write-offs (280) (290) (375) (924) (1,157)
GIL, End of Period (1) 3,128 3,405 2,913 3,128 2,913
GIL as a % of gross loans & acceptances (excluding acquisitions) 1.61% 1.73% 1.66% 1.61% 1.66%GIL as a % of gross loans & acceptances (including acquisitions) 1.78% 1.98% 1.66% 1.78% 1.66%GIL as a % of equity and allowance for credit losses (excluding acquisitions) 11.47% 12.50% 12.74% 11.47% 12.74%GIL as a % of equity and allowances for credit losses (including acquisitions) 12.81% 14.34% 12.74% 12.81% 12.74%
(1) GIL for Q3-2010 include $327 million, (Q2-2010 $437 million) relating to the U.S. portfolio acquired in Q2-2010 that were recorded at market value. All loans in this portfolio are covered by a loss sharing agreement, with the FDIC absorbing 80% of loan losses.
(2) Includes impaired amounts returned to performing status, loan sales, repayments, the impact of foreign exchange fluctuations and offsets for consumer write-offs which have not been recognized as formations (Q3-10 $187 million; Q2-10 $204 million; and Q3-09 $187 million).
12 • BMO Financial Group Third Quarter Report 2010
Total Trading and Underwriting Market Value Exposure (MVE) Summary ($ millions)* For the quarter ended July 31, 2010 As at April 30, 2010 As at October 31, 2009
(Pre-tax Canadian equivalent) Quarter-end Average High Low Quarter-end Quarter-end
Commodities Risk (0.2) (0.3) (0.4) (0.2) (0.2) (0.7)Equity Risk (6.0) (6.6) (10.1) (5.2) (5.3) (10.2)Foreign Exchange Risk (2.3) (2.6) (5.1) (0.7) (3.4) (0.8)Interest Rate Risk (Mark-to-Market) (1) (7.0) (8.6) (14.3) (6.6) (11.0) (18.4)Diversification 5.6 6.5 nm nm 7.5 11.4
Comprehensive Risk (9.9) (11.6) (14.9) (8.7) (12.4) (18.7)Interest Rate Risk (accrual) (2.8) (4.1) (4.9) (2.8) (4.9) (7.3)Issuer Risk (2.7) (3.1) (4.4) (1.9) (3.4) (1.9)
Total MVE (15.4) (18.8) (22.7) (15.2) (20.7) (27.9)
nm- not meaningful
* One-day measure using a 99% confidence interval. Losses are in brackets and benefits are presented as positive numbers. (1) Measures exclude securities in the available-for-sale portfolio.
Structural Balance Sheet Market Value Exposure and Earnings Volatility ($ millions)*
(Canadian equivalent) July 31 2010 April 30 2010 Oct 31 2009
Market value exposure (MVE) (pre-tax) (553.1) (560.2) (543.2)12-month earnings volatility (EV) (after-tax) (55.3) (54.2) (69.0)
* Losses are in brackets. Measured at a 99% confidence interval.
Structural Balance Sheet Earnings and Value Sensitivity to Changes in Interest Rates ($ millions)* **
(Canadian equivalent) Economic value sensitivity
(Pre-tax) Earnings sensitivity over the next 12 months (After-tax)
Jul. 31 2010 Apr. 30 2010 Oct. 31 2009 Jul. 31 2010 Apr. 30 2010 Oct. 31 2009
100 basis point increase (415.7) (381.6) (353.2) 14.3 32.9 11.0100 basis point decrease 311.8 309.0 254.2 (25.8) 3.1 (75.6) 200 basis point increase (876.2) (816.1) (779.2) 8.3 29.6 (10.6)200 basis point decrease 710.2 550.7 392.8 (17.2) (6.5) (62.9)
* Losses are in brackets and benefits are presented as positive numbers. ** For the bank’s Insurance businesses, a 100 basis point increase in interest rates results in an increase in earnings after tax of $75 million and an increase in before tax economic value of $254 million ($82 million
and $240 million, respectively, at Apr. 30, 2010). A 100 basis point decrease in interest rates results in a decrease in earnings after tax of $68 million and a decrease in before tax economic value of $260 million ($68 million and $237 million, respectively, at Apr. 30, 2010). These impacts are not reflected in the table above.
Income Taxes
As explained in the Revenue section, management assesses BMO’s consolidated results and associated provisions for income taxes on a GAAP basis. We assess the performance of the operating groups and associated income taxes on a teb and report accordingly. The provision for income taxes decreased $5 million from the third quarter of 2009 and $100 million from the second quarter of 2010, to $107 million. The effective tax rate for the quarter was 13.4%, compared with 16.4% in the third quarter of 2009 and 21.4% in the second quarter of 2010. The lower effective tax rate in the current quarter was primarily due to proportionately higher tax-exempt income and recoveries of prior periods’ income taxes. The income tax provision for the current year to date increased $432 million from a year ago to $491 million, resulting in an effective rate of 18.8% year to date, compared with an effective tax rate of 4.7% for the same period last year. The higher effective tax rate for the year to date relative to 2009 was primarily due to proportionately lower income from lower tax-rate jurisdictions, and lower tax-exempt income.
BMO hedges the foreign exchange risk arising from its investments in U.S. operations by funding the investments in U.S. dollars. Under this program, the gain or loss from hedging and the unrealized gain or loss from translation of the investments in U.S. operations are charged or credited to shareholders’ equity. For income tax purposes, the gain or loss on the hedging activities attracts an income tax charge or credit in the current period, which is charged or credited to shareholders’ equity, while the associated unrealized gain or loss on the investments in U.S. operations does not attract income taxes until the investments are liquidated. The income tax charge/benefit arising from a hedging gain/loss is a function of the fluctuation in U.S. rates from period to period. Hedging of the investments in U.S. operations has given rise to an income tax recovery in shareholders’ equity of $45 million for the quarter and an income tax charge of $175 million for the year to date. Refer to the Consolidated Statement of Changes in Shareholders’ Equity included in the unaudited consolidated financial statements for further details.
BMO Financial Group Third Quarter Report 2010 • 13
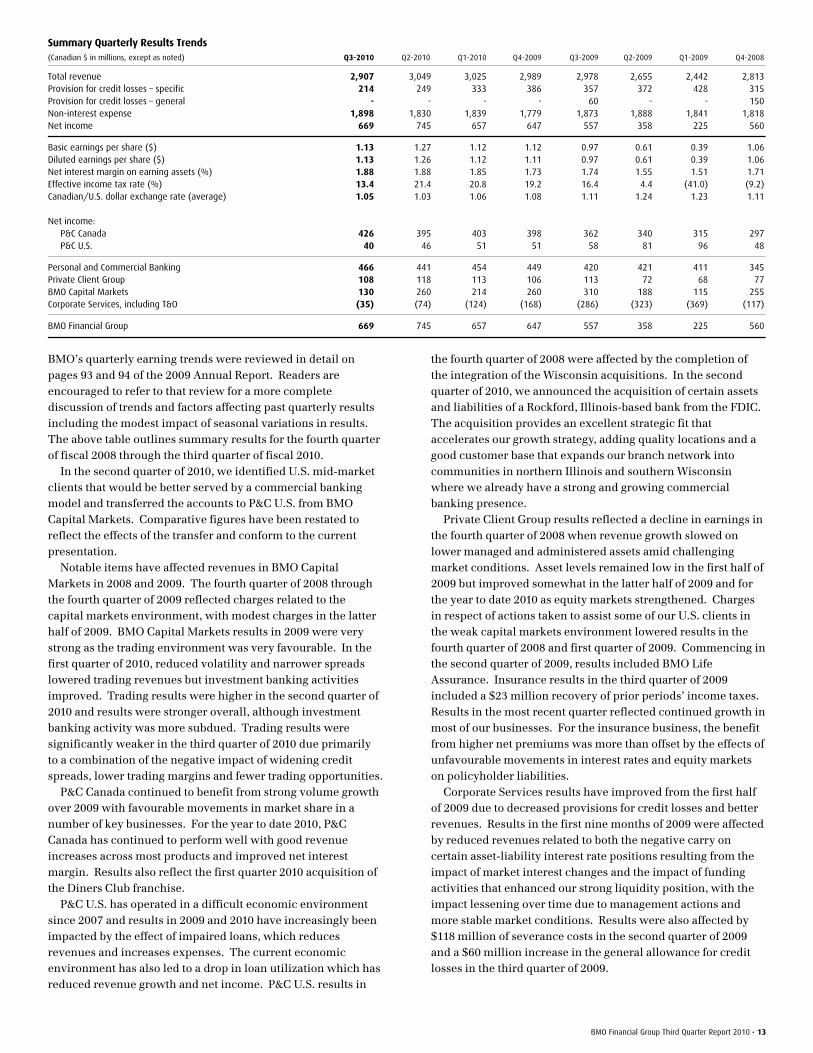
Summary Quarterly Results Trends (Canadian $ in millions, except as noted) Q3-2010 Q2-2010 Q1-2010 Q4-2009 Q3-2009 Q2-2009 Q1-2009 Q4-2008
Total revenue 2,907 3,049 3,025 2,989 2,978 2,655 2,442 2,813Provision for credit losses – specific 214 249 333 386 357 372 428 315Provision for credit losses – general - - - - 60 - - 150Non-interest expense 1,898 1,830 1,839 1,779 1,873 1,888 1,841 1,818Net income 669 745 657 647 557 358 225 560
Basic earnings per share ($) 1.13 1.27 1.12 1.12 0.97 0.61 0.39 1.06Diluted earnings per share ($) 1.13 1.26 1.12 1.11 0.97 0.61 0.39 1.06Net interest margin on earning assets (%) 1.88 1.88 1.85 1.73 1.74 1.55 1.51 1.71Effective income tax rate (%) 13.4 21.4 20.8 19.2 16.4 4.4 (41.0) (9.2)Canadian/U.S. dollar exchange rate (average) 1.05 1.03 1.06 1.08 1.11 1.24 1.23 1.11 Net income: P&C Canada 426 395 403 398 362 340 315 297 P&C U.S. 40 46 51 51 58 81 96 48
Personal and Commercial Banking 466 441 454 449 420 421 411 345Private Client Group 108 118 113 106 113 72 68 77BMO Capital Markets 130 260 214 260 310 188 115 255Corporate Services, including T&O (35) (74) (124) (168) (286) (323) (369) (117)
BMO Financial Group 669 745 657 647 557 358 225 560
BMO’s quarterly earning trends were reviewed in detail on pages 93 and 94 of the 2009 Annual Report. Readers are encouraged to refer to that review for a more complete discussion of trends and factors affecting past quarterly results including the modest impact of seasonal variations in results. The above table outlines summary results for the fourth quarter of fiscal 2008 through the third quarter of fiscal 2010. In the second quarter of 2010, we identified U.S. mid-market clients that would be better served by a commercial banking model and transferred the accounts to P&C U.S. from BMO Capital Markets. Comparative figures have been restated to reflect the effects of the transfer and conform to the current presentation. Notable items have affected revenues in BMO Capital Markets in 2008 and 2009. The fourth quarter of 2008 through the fourth quarter of 2009 reflected charges related to the capital markets environment, with modest charges in the latter half of 2009. BMO Capital Markets results in 2009 were very strong as the trading environment was very favourable. In the first quarter of 2010, reduced volatility and narrower spreads lowered trading revenues but investment banking activities improved. Trading results were higher in the second quarter of 2010 and results were stronger overall, although investment banking activity was more subdued. Trading results were significantly weaker in the third quarter of 2010 due primarily to a combination of the negative impact of widening credit spreads, lower trading margins and fewer trading opportunities. P&C Canada continued to benefit from strong volume growth over 2009 with favourable movements in market share in a number of key businesses. For the year to date 2010, P&C Canada has continued to perform well with good revenue increases across most products and improved net interest margin. Results also reflect the first quarter 2010 acquisition of the Diners Club franchise. P&C U.S. has operated in a difficult economic environment since 2007 and results in 2009 and 2010 have increasingly been impacted by the effect of impaired loans, which reduces revenues and increases expenses. The current economic environment has also led to a drop in loan utilization which has reduced revenue growth and net income. P&C U.S. results in
the fourth quarter of 2008 were affected by the completion of the integration of the Wisconsin acquisitions. In the second quarter of 2010, we announced the acquisition of certain assets and liabilities of a Rockford, Illinois-based bank from the FDIC. The acquisition provides an excellent strategic fit that accelerates our growth strategy, adding quality locations and a good customer base that expands our branch network into communities in northern Illinois and southern Wisconsin where we already have a strong and growing commercial banking presence. Private Client Group results reflected a decline in earnings in the fourth quarter of 2008 when revenue growth slowed on lower managed and administered assets amid challenging market conditions. Asset levels remained low in the first half of 2009 but improved somewhat in the latter half of 2009 and for the year to date 2010 as equity markets strengthened. Charges in respect of actions taken to assist some of our U.S. clients in the weak capital markets environment lowered results in the fourth quarter of 2008 and first quarter of 2009. Commencing in the second quarter of 2009, results included BMO Life Assurance. Insurance results in the third quarter of 2009 included a $23 million recovery of prior periods’ income taxes. Results in the most recent quarter reflected continued growth in most of our businesses. For the insurance business, the benefit from higher net premiums was more than offset by the effects of unfavourable movements in interest rates and equity markets on policyholder liabilities. Corporate Services results have improved from the first half of 2009 due to decreased provisions for credit losses and better revenues. Results in the first nine months of 2009 were affected by reduced revenues related to both the negative carry on certain asset-liability interest rate positions resulting from the impact of market interest changes and the impact of funding activities that enhanced our strong liquidity position, with the impact lessening over time due to management actions and more stable market conditions. Results were also affected by $118 million of severance costs in the second quarter of 2009 and a $60 million increase in the general allowance for credit losses in the third quarter of 2009.

14 • BMO Financial Group Third Quarter Report 2010
The U.S. dollar weakened in the latter half of 2009 and in the first half of 2010, but strengthened in the current quarter. A weaker U.S. dollar lowers the translated values of BMO’s U.S.-dollar-denominated revenues and expenses. Balance Sheet Total assets of $397.4 billion increased $8.9 billion from October 31, 2009. The weaker U.S. dollar decreased the translated value of U.S.-dollar-denominated assets by $4.7 billion. The $8.9 billion increase reflects increases in securities of $8.5 billion, net loans and acceptances of $5.7 billion, cash and cash equivalents and interest bearing deposits with banks of $4.9 billion and other assets of $1.5 billion. These items were partially offset by a decrease in securities borrowed or purchased under resale agreements of $11.7 billion. The $8.5 billion increase in securities was primarily due to a $7.2 billion increase in trading securities and a $1.6 billion increase in available-for-sale securities. The increase in trading securities reflects higher activity related to the issuances of equity-linked notes and total return swaps, which increased holdings in underlying equity positions and in government and government guaranteed securities. The increase in net loans and acceptances of $5.7 billion was due to an increase in consumer loans of $4.6 billion and higher residential mortgages of $1.6 billion. The growth in the above loans, which includes $1.5 billion in balances as a result of the Rockford, Illinois-based bank transaction and $1.0 billion in loans due to the Diners Club acquisition, was partially offset by lower loans and acceptances to businesses and governments of $0.5 billion. The decrease in loans to businesses and governments was mainly due to decreased corporate loans in both Canada and the United States as borrowers have reduced utilization of loan facilities. The $4.9 billion increase in cash and cash equivalents and interest bearing deposits with banks was attributable to growth in cash invested on a short-term basis with the U.S. Federal Reserve owing to deposit growth and lower loan balances. The $11.7 billion decrease in securities borrowed or purchased under resale agreements was due to lower trading activity. The decrease in activity is a result of reduced leverage in the market and the rolling off of various large client positions. Liabilities and shareholders’ equity increased $8.9 billion from October 31, 2009. The weaker U.S. dollar decreased the translated value of U.S.-dollar-denominated liabilities by $4.7 billion. The $8.9 billion increase primarily reflects growth in deposits of $6.6 billion, securities sold but not yet purchased of $6.4 billion and shareholders’ equity of $1.0 billion. These factors were partially offset by a decrease in securities lent or sold under repurchase agreements of $4.1 billion, lower subordinated debt of $0.5 billion and lower capital trust securities of $0.3 billion. Deposits by individuals, which account for 41% or $99.6 billion of total deposits, increased by $0.2 billion or $1.2 billion in source currency and reflect the addition of $1.6 billion as a result of the Rockford, Illinois-based bank transaction. Deposits by businesses and governments, which account for 51% or $123.9 billion of total deposits, increased $10.1 billion, largely to fund growth in trading securities and to replace maturing deposits by banks. Deposits by banks, which account for the remaining 8% or $19.3 billion of total deposits, decreased $3.7 billion.
The net increase in securities sold but not yet purchased was due to higher client-driven trading activities related to market opportunities. The decrease in subordinated debt was due to the redemption of all of our outstanding 4.0% Series C Medium-Term Notes First Tranche during the first quarter. The decrease in the Capital Trust securities was due to the redemption of all of the outstanding BMO BOaTS – series A during the current quarter. The increase in shareholders’ equity of $1.0 billion largely reflects an increase in retained earnings and the issuance of common shares through our dividend reinvestment program and the exercise of stock options, partially offset by a higher accumulated other comprehensive loss. Contractual obligations by year of maturity were outlined in Table 20 on page 106 of BMO's 2009 Annual Report. There have been no material changes to contractual obligations that are outside the ordinary course of our business.

BMO Financial Group Third Quarter Report 2010 • 15
Capital Management
At July 31, 2010, BMO’s Tier 1 Capital Ratio was 13.55%, with Tier 1 capital of $21.2 billion and risk-weighted assets (RWA) of $156.6 billion. The ratio remains strong, increasing 28 basis points from 13.27% at April 30, 2010, and 131 basis points from 12.24% at October 31, 2009. The increase from the fiscal 2009 year end was due to both growth in capital and lower RWA. Our strong capital position provides flexibility in the execution of our business growth strategies and positions us well for potential regulatory changes and the adoption of International Financial Reporting Standards in the coming years (see Transition to International Financial Reporting Standards in the Accounting Changes section for further information). Global regulators have proposed changes in regulatory capital requirements in press releases issued in December 2009 and July 2010. Banks will be required to hold more capital than is currently required by regulators to comply with these new requirements. It is anticipated that final requirements and the related transition plan will be determined by regulators later this year. Tier 1 capital increased $749 million from October 31, 2009, primarily due to higher retained earnings and the issuance of common shares through the Shareholder Dividend Reinvestment and Share Purchase Plan and the exercise of stock options. These factors were partially offset by the $350 million redemption of Trust Capital Securities - Series A (“BMO BOaTS”) in June. RWA decreased $10.6 billion from October 31, 2009, primarily due to the impact of a weaker U.S. dollar and lower corporate and commercial RWA, partially offset by an increase in retail loan RWA. Relative to the second quarter, RWA decreased $2.5 billion primarily due to lower corporate and commercial RWA and lower other credit risk assets. BMO’s Total Capital Ratio was 16.10% at July 31, 2010. The ratio increased 123 basis points from 14.87% at October 31, 2009. Total capital increased $343 million to $25.2 billion primarily due to growth in Tier 1 capital, as outlined above, partially offset by a $500 million subordinated debt redemption in January. Our Tangible Common Equity to RWA ratio was 10.39%, up 118 basis points from 9.21% at the end of fiscal 2009. During the quarter, 2,745,000 common shares were issued through the Shareholder Dividend Reinvestment and Share Purchase Plan and the exercise of stock options. We did not repurchase any Bank of Montreal common shares under our common share repurchase program during the quarter. On August 24, 2010, we announced that BMO’s Board of Directors had declared a quarterly dividend payable to common shareholders of $0.70 per share, unchanged from a year ago and from the preceding quarter. The dividend is payable November 26, 2010, to shareholders of record on November 1, 2010. Common shareholders can, in lieu of cash, elect to have this dividend reinvested in additional common shares under BMO’s Shareholder Dividend Reinvestment and Share Purchase Plan. At this time, the common shares purchased under the Plan will be issued from treasury without discount from the average market price of the common shares (as defined in the Plan). This Capital Management section contains forward-looking statements. Please see the Caution Regarding Forward-Looking Statements.
Qualifying Regulatory Capital Basel II Regulatory Capital and Risk-Weighted Assets
(Canadian $ in millions) Q3-2010 Q4-2009
Common shareholders’ equity 18,270 17,132Non-cumulative preferred shares 2,571 2,571Innovative Tier 1 Capital Instruments 2,543 2,907Non-controlling interest in subsidiaries 23 26Goodwill and excess intangible assets (1,627) (1,569)Accumulated net after-tax unrealized losses on available-for-
sale equity securities - (2)Net Tier 1 Capital 21,780 21,065Securitization-related deductions (169) (168)Expected loss in excess of allowance – AIRB approach - (61)Substantial investments (400) (374)Adjusted Tier 1 Capital 21,211 20,462Subordinated debt 3,747 4,236Trust subordinated notes 800 800Accumulated net after-tax unrealized gains on available-for-
sale equity securities 9 -Eligible general allowance for credit losses 385 296Total Tier 2 Capital 4,941 5,332Securitization-related deductions (26) (7)Expected loss in excess of allowance – AIRB approach - (60)Substantial Investments/Investment in insurance subsidiaries (924) (868)Adjusted Tier 2 Capital 3,991 4,397Total Capital 25,202 24,859
Risk-Weighted Assets
(Canadian $ in millions) Q3-2010 Q4-2009
Credit risk 132,031 143,098Market risk 5,514 6,578Operational risk 19,034 17,525Total risk-weighted assets 156,579 167,201
Outstanding Shares and Securities Convertible into Common Shares
As at August 18, 2010
Number of shares or
dollar amount
Common shares 562,898,000Class B Preferred Shares Series 5 $ 200,000,000 Series 13 $ 350,000,000 Series 14 $ 250,000,000
Series 15 $ 250,000,000Series 16 $ 300,000,000
Series 18 $ 150,000,000Series 21 $ 275,000,000Series 23 $ 400,000,000
Convertible into common shares: Class B Preferred Shares (1) Series 10 US$ 300,000,000Stock options – vested 8,273,000 – non-vested 7,714,000
(1) Convertible preferred shares may be exchanged for common shares on specific dates on a pro-rata basis based on 95% of the average trading price of common shares for the 20 days ending four days prior to the exchange date.
Details on share capital are outlined in the 2009 Annual Report in Note 21 to the audited financial statements on pages 144 to 145.
Eligible Dividends Designation
For the purposes of the Income Tax Act (Canada) and any similar provincial and territorial legislation, BMO designates all dividends paid or deemed to be paid on both its common and preferred shares after December 31, 2005, as “eligible dividends”
unless indicated otherwise.

16 • BMO Financial Group Third Quarter Report 2010
Credit Rating
The credit ratings assigned to BMO’s senior debt securities by external rating agencies are important in raising of both capital and funding to support our business operations. Maintaining strong credit ratings allows us to access the capital markets at competitive pricing levels. Should our credit ratings materially decrease, our cost of funds would likely increase significantly and our access to funding and capital through the capital markets could be reduced. A material downgrade of our rating could have additional consequences, including those set out in Note 10 to our annual consolidated financial statements. BMO’s senior debt credit ratings were unchanged in the quarter and have a stable outlook. All four ratings are indicative of high-grade, high-quality issues. The ratings are as follows: DBRS (AA); Fitch (AA-); Moody’s (Aa2); and Standard & Poor’s (A+). These credit ratings are also disclosed in the Financial Highlights section located near the beginning of this document. Transactions with Related Parties
In the ordinary course of business, we provide certain banking services to our directors and executives and their affiliated entities, joint ventures and equity-accounted investees on the same terms that we offer our customers for these services. A select suite of customer loan and mortgage products is offered to our employees at rates normally accorded to our preferred customers. We also offer employees a fee-based subsidy on annual credit card fees. Stock options and deferred share units granted to directors and preferred rate loan agreements for executives, relating to transfers we initiate, are both discussed in Note 28 to the audited consolidated financial statements on page 156 of the 2009 Annual Report. Off-Balance-Sheet Arrangements
BMO enters into a number of off-balance-sheet arrangements in the normal course of operations. The most significant of these are credit instruments and VIEs, which are described on page 70 of the 2009 Annual Report and in Notes 4 and 6 to the attached unaudited interim consolidated financial statements. See the Select Financial Instruments section for comments on any significant changes to our off-balance-sheet arrangements during the quarter ended July 31, 2010. Accounting Policies and Critical Accounting Estimates
The notes to BMO’s October 31, 2009 audited consolidated financial statements outline our significant accounting policies. Pages 71 to 73 of the 2009 Annual Report contain a discussion of certain accounting estimates that are considered particularly important as they require management to make significant judgments, some of which relate to matters that are inherently uncertain. Readers are encouraged to review that discussion.
Select Financial Instruments
Pages 65 to 69 of BMO’s 2009 Annual Report provide enhanced disclosure relating to select financial instruments that, commencing in 2008, markets had come to regard as carrying higher risk. Readers are encouraged to review that disclosure to assist in understanding the nature and extent of BMO’s exposures. BMO’s consumer loans, including our limited exposure to subprime mortgage loans and Alt-A first mortgage loans, were outlined in the annual report. While arrears on our U.S. mortgage loans have increased, the changes are not significant relative to our asset base and the risk in these portfolios is only modestly higher than at October 31, 2009 and April 30, 2010. There have been no significant changes to our exposure to leveraged finance loans, monoline insurers, credit derivative product companies and other select financial instruments, including CDOs, or to associated risk levels in the quarter and for the year to date. The Annual Report and Note 4 to the attached unaudited consolidated financial statements outline our exposure to BMO-sponsored securitization vehicles including bank securitization vehicles, Canadian customer securitization vehicles, a U.S. customer securitization vehicle and a Canadian credit protection vehicle. They also outline our exposure to two BMO-managed structured investment vehicles (SIVs). Except as noted below, during the quarter and for the year to date, there were no significant changes to our exposure to the foregoing vehicles or associated risk levels. BMO has provided undrawn committed liquidity support facilities of US$4.0 billion to the U.S. customer securitization vehicle, down from US$5.7 billion at October 31, 2009. The reduction was primarily due to loan repayments, the termination of certain of the vehicle’s lending facilities and, in the first half of the year, BMO’s direct funding of certain of the vehicle’s commercial accounts. The amount drawn on the liquidity facilities BMO provides to the SIVs fell to US$4.8 billion and €513 million at the end of the quarter, down from US$5.8 billion and €597 million at the end of fiscal 2009. The decrease was attributable to asset sales and asset maturities. U.S. Legislative Developments
On July 21, 2010, President Obama signed into law the U.S. Dodd-Frank Wall Street Reform and Consumer Protection Act. The Dodd-Frank Act is broad in scope and we are assessing the impact of the legislation on us. Many aspects of the Dodd-Frank Act are subject to rulemaking and will take effect over several years, making it difficult to anticipate at this time the overall financial impact on us or the financial industry more generally. We anticipate an increase in regulatory costs, and will be focused on managing the complexity and breadth of the regulatory changes. The Financial Crisis Responsibility Fee that the Obama Administration has proposed levying on U.S. financial institutions that have assets exceeding a certain threshold was not included in the Dodd-Frank Act. As currently proposed, this levy may apply to some or all of our U.S. operations. It is unclear whether the responsibility fee will be passed into law in its current form, if at all.

BMO Financial Group Third Quarter Report 2010 • 17
Accounting Changes Transition to International Financial Reporting Standards
Canadian public companies will be required to prepare their financial statements in accordance with International Financial Reporting Standards (IFRS), as issued by the International Accounting Standards Board (IASB), for fiscal years beginning on or after January 1, 2011. Effective November 1, 2011, we will adopt IFRS as the basis for preparing our consolidated financial statements. We will report our financial results for the quarter ended January 31, 2012, prepared on an IFRS basis. We will also provide comparative data on an IFRS basis, including an opening balance sheet as at November 1, 2010. IFRS Transition Plan & Current Status
In order to meet the requirement to transition to IFRS, we have established an enterprise-wide project and formed an Executive Steering Committee. The transition plan is comprised of three phases: a diagnostic review and assessment to identify potential IFRS differences relative to current policies; implementation and education, which includes confirming actual IFRS differences relative to current policies; and completion of all integration requirements for actual differences identified. Phase I: Diagnostic Review & Assessment
The primary objective of Phase I was to complete a comprehensive review of the IFRS requirements relative to the bank’s current accounting policies in order to identify potential IFRS differences. This analysis identified the scope of the work required, allowing for the completion of a detailed implementation plan including timelines and resource requirements. Current status
A detailed implementation plan was developed and approved by the IFRS Executive Steering Committee in 2009. Potential IFRS differences relative to the bank’s current accounting policies have been fully documented. Phase II: Implementation and Education
The key elements of Phase II include: confirming actual IFRS differences relative to current policies and selecting policy options permitted under IFRS; identifying and implementing the necessary changes within our existing financial reporting and data collection processes and technology; assessing the impact on internal controls over financial reporting and disclosure; designing and implementing a technology-based solution to track and record IFRS-based financial information for the 2011 reporting year for comparative purposes; and developing and executing internal training and awareness programs to ensure sufficient financial reporting expertise and governance. Substantial completion of Phase II activities is planned for the first quarter of 2011. Current status
Confirmation of actual differences and implementation requirements
The implementation activities have been organized by individual work streams (25 in total). We have substantially completed nine work streams: capital assets, leases, stock-based compensation, intangible assets, revenue recognition, foreign currency translation, earnings per share, borrowing costs and investment properties. The work streams completed to date have not
revealed any material differences relative to current BMO accounting practices. Progress on the work streams related to the main accounting changes is outlined in the following section. The transition plan contemplates substantial completion of all work streams by the first quarter of 2011; however, we continue to closely monitor the work of the IASB on changes to existing IFRS and adjust our project plan to reflect these developments. Page 73 of our 2009 Annual Report contains a discussion of the IASB’s future plans to make revisions to certain existing IFRS standards, some of which relate to the areas that we have identified as potentially requiring accounting changes. Readers are encouraged to review that discussion for more details. Identification of differences between the bank’s current accounting policies and the requirements under IFRS
Based on our analysis to date, the main accounting changes due to adopting IFRS are expected to be in the areas of asset securitization, consolidation, and pension and other employee future benefits. The underlying IFRS associated with these areas differ from current BMO accounting policies such that there will likely be impacts to the bank’s balance sheets and statements of income. These impacts will also extend to our capital ratios. OSFI has issued an IFRS advisory that permits a five-quarter phase-in of the adjustment to retained earnings arising from the first time adoption of certain IFRS changes for purposes of calculating certain ratios. Transitional relief for the impact to the Assets-to-Capital Multiple (ACM) will also be provided in the form of excluding the effect of any on-balance sheet recognition of mortgages that were sold through CMHC programs up to March 31, 2010, that under current practice are not reported on the bank’s balance sheet. Other significant differences may be identified prior to our transition to IFRS. Asset securitization
The derecognition criteria contained within the IFRS financial instruments standard (IAS 39) may require the recognition on our balance sheet of loans that we sold to off-balance sheet entities or trusts (securitization vehicles). Our current practice is to remove loans from our balance sheet when the loans are considered sold for accounting purposes and recognize gains in securitization revenues at the time of sale of these loans. On transition, any loans sold to off-balance sheet entities or trusts that require on-balance sheet recognition under IFRS will result in an increase in both assets and liabilities on the balance sheet and a potential decrease in retained earnings, representing the reversal of the gain on sale previously recognized in earnings. In place of the gain on sale, the interest and fees collected from customers, net of the yield paid to investors in the securitization vehicle, will be recorded in net interest income using the effective interest rate method over the term of the securitization. Credit losses will be recorded in the provision for credit losses. Any effect on our capital ratios from the potential decrease in retained earnings would be partially mitigated by the transitional relief provided under OSFI’s IFRS advisory. We had anticipated that new accounting requirements impacting asset securitization would be effective at transition to IFRS and were completing our analysis based on those requirements. During the quarter, the IASB announced that its project to make revisions to the existing derecognition criteria is temporarily on hold. Accordingly, subject to the IASB restarting this project in the near term, the

18 • BMO Financial Group Third Quarter Report 2010
existing derecognition criteria within IAS 39 will remain in effect when we transition to IFRS. As a result, we are now performing our analysis based on existing IFRS requirements and expect to finalize our conclusions in the fourth quarter of 2010. Consolidation
The requirements contained within the IFRS consolidated and separate financial statements standard (IAS 27) may impact the accounting for certain variable interest entities (VIEs) that the bank sponsors. Under IFRS, a VIE is consolidated by an entity if the entity is deemed to control it, as determined under the criteria contained within IAS 27. Our current practice is to consolidate VIEs if the investments we hold in these entities and/or the relationships we have with them result in us being exposed to the majority of their expected losses, being able to benefit from a majority of their expected residual returns, or both. We are currently assessing all our VIEs to determine whether to consolidate based on IFRS requirements. To the extent we determine that any of our VIEs require consolidation, this will result in an increase in both assets and liabilities, and a decrease in retained earnings to the extent that liabilities exceed assets at November 1, 2010. The effects on our capital ratios would be partially mitigated by the transitional relief provided under OSFI’s IFRS advisory. We had anticipated that new accounting requirements impacting consolidation would be effective at transition to IFRS and were completing our analysis based on those requirements. However, as a result of changes to the IASB work plan, we are now performing our analysis based on existing IFRS requirements and expect to finalize our conclusions in the fourth quarter of 2010. The IASB is scheduled to release a revised consolidation standard between the fourth quarter of calendar 2010 and the first quarter of 2011. It is unclear when adoption will be required; however, it is likely that the existing consolidation standard will remain in effect when the Bank transitions to IFRS in 2012.
Pension and Other Employee Future Benefits
Under IFRS employee benefits standard (IAS 19), we will continue to record in pension expense the cost of benefits earned in the year plus the interest cost on the obligation net of the expected return on assets. IFRS then provides two alternatives for how to account for the unrealized market-related gains or losses on pension fund assets and the impact of changes in discount rates on pension obligations (“market-related amounts”). We can either record these market-related amounts directly in equity or defer them on our balance sheet and amortize amounts in excess of 10% of our plan assets or benefit liability balances to pension expense over a period of approximately 12 years, as we do currently. On transition to IFRS, we will also be required to either recalculate expense back to inception of the plans as though we had always applied IAS 19 or record any market-related amounts on November 1, 2010 directly in retained earnings (“fresh start”). We have not yet finalized our decision on which alternative we will choose. If we elect to record deferred market-related gains or losses in retained earnings on transition, the adjustment will be based on the actuarial valuation as at November 1, 2010. The effect on our capital ratios would be partially mitigated by the transitional relief provided under OSFI’s IFRS advisory.
IFRS 1 – First Time Adoption of IFRS
IFRS 1 is a financial reporting standard that provides the framework for the transition to IFRS. The general principle under IFRS 1 is retroactive application such that the opening balance sheet for the comparative year financial statements is restated as though the bank had always applied IFRS. However, IFRS 1 does contain certain mandatory exceptions as well as permit certain optional exceptions from full retroactive application. The mandatory exceptions include hedge accounting. We will not look back in time to determine whether we complied with IFRS hedge accounting requirements prior to transition. As long as we comply with IFRS on November 1, 2010, we can continue our hedge accounting without interruption. We are currently evaluating the optional exemptions under IFRS 1, the most significant of which include:
Business combinations
IFRS business combinations standard (IFRS 3), which provides guidance on the measurement and recognition of business acquisitions, differs from the guidance under Canadian GAAP. IFRS requires all acquisition and restructuring related costs to be expensed. Canadian GAAP permits the capitalization of certain of these costs. In addition, when consideration is paid to the seller in the form of shares issued by the buyer, the consideration is valued based on the market price of shares at the closing date unlike under Canadian GAAP which uses the market price of shares over a reasonable period before and after the date the terms of the acquisition are agreed to and announced. These differences would impact the purchase price allocation, including the amount of goodwill recorded. IFRS 1 permits the application of the requirements in IFRS 3 to business acquisitions that are completed after the transition to IFRS (i.e. November 1, 2010) or retroactively from a date of our choosing. Should we choose to adopt and apply IFRS 3 retroactively, we would need to restate all past acquisitions from the date chosen up to our transition date.
Pension and Other Employee Future Benefits
As noted in the previous section, IFRS 1 permits the recording of any unrealized gains or losses that exist as at the transition date, as determined under Canadian GAAP, directly in retained earnings. The alternative is the full retroactive application of the IFRS requirements.
Cumulative Translation differences
IFRS 1 permits the accumulated other comprehensive loss on translation of net foreign operations to be charged to retained earnings. The alternative, i.e. retroactive restatement, would require detailed historical analysis to recalculate translation differences on an IFRS basis. We have not yet finalized our decisions on the IFRS 1 optional exemptions from retroactive application.
BMO Financial Group Third Quarter Report 2010 • 19
Internal Controls over Financial Reporting and Disclosure
We have determined that our internal controls over financial reporting and our disclosure controls and procedures will be largely unaffected by the transition to IFRS. Effects will be limited primarily to the development of internal controls over tracking and communicating IFRS-based information for the IFRS comparative year, possible changes in the accounting treatment of the bank’s VIEs and securitized loans, and certain additional disclosure requirements in the notes to the financial statements. Changes relating to such effects will be a key area of focus in the third and final phase of the transition, beginning in the first quarter of 2011. Business Activities
We continually assess whether there will be any impact to our business activities as we progress through our implementation activities. These would include addressing loan agreements and related loan covenant ratios in situations where our loan customers are also adopting IFRS. To date, we have not identified any significant impacts to existing business activities as a result of adopting IFRS. Information Technology
We have completed a detailed assessment of our existing financial information technology architecture and determined that there are no significant changes required as a result of our transition to IFRS. We have developed a technology-based solution in the form of a comparative reporting tool that will track IFRS-based financial information during the comparative year. This will not require any significant modification to our existing financial reporting systems. The comparative reporting tool is currently undergoing testing and will be operational by the first quarter of 2011. Adjustments related to IFRS for the 2011 comparative year will be reflected in our primary financial systems during the quarter ended January 31, 2012. Financial Reporting Expertise and Governance
An internal IFRS educational program was launched in 2009 to ensure appropriate financial reporting expertise and governance when the bank begins to report on an IFRS basis. During 2009, detailed technical sessions relating to our findings from Phase I were presented to all our accounting and finance staff as well as certain other functional groups across the enterprise that may be affected by the transition to IFRS. We also launched, in 2009, training and awareness programs for our credit personnel having a need to understand the impact of IFRS on the affairs of our borrowing customers that may also be adopting IFRS. Updated technical sessions were provided to the majority of the bank’s accounting and finance staff in the second and third quarters of 2010. Additional sessions are scheduled for the fourth quarter of 2010 for the remaining finance and accounting staff. Quarterly educational sessions on specific IFRS topics were presented to the bank’s audit committee in 2009, and have continued over the first three quarters of 2010. Phase III: Completion of integration changes
We are developing a detailed plan for the third and final phase of the transition, which is the completion of all integration changes, scheduled to commence in 2011. This will include the development of controls and procedures necessary to restate our
2011 opening balance sheet and financial results on an IFRS basis in preparation for the transition to IFRS in fiscal 2012, finalizing decisions on policy options available under IFRS including available exemptions from applying certain IFRS on a retroactive basis, developing communication plans for our internal and external stakeholders and addressing impacts to the bank’s internal management reporting processes including planning and forecasting. Quantification of key impacts
The differences between the bank’s accounting policies and IFRS requirements, combined with our decisions on the optional IFRS 1 exemptions from retroactive application of IFRS, will result in measurement and recognition differences when we transition to IFRS. These differences will be recorded in retained earnings, impacting shareholders’ equity. The quantum of this impact to shareholders’ equity will be subject to the prevailing market conditions and economic circumstances at the time of transition as well as the policy selections that we make at transition. Accordingly, we are not in a position to provide quantification of the transitional impact at this time. In anticipation of substantially completing certain of our significant work stream activities by the fourth quarter of 2010, we expect to provide quantification of certain of the impacts of adopting existing IFRS reporting in our 2010 Annual Report.
Caution
The foregoing sections contain forward-looking statements. Please see the Caution Regarding Forward-Looking Statements.

20 • BMO Financial Group Third Quarter Report 2010
Review of Operating Groups’ Performance
Operating Groups’ Summary Income Statements and Statistics for Q3-2010 Q3-2010 YTD-2010
(Canadian $ in millions, except as noted) P&C PCG BMO CM
Corporate
including T&O Total BMO P&C PCG BMO CM
Corporate
including T&O Total BMO
Net interest income (teb) (1) 1,340 92 355 (216) 1,571 3,872 266 1,095 (608) 4,625Non-interest revenue 511 452 326 47 1,336 1,483 1,386 1,350 137 4,356
Total revenue (teb) (1) 1,851 544 681 (169) 2,907 5,355 1,652 2,445 (471) 8,981Provision for credit losses 160 1 66 (13) 214 463 5 198 130 796Non-interest expense 1,031 402 421 44 1,898 2,937 1,198 1,359 73 5,567
Income before income taxes and non- controlling interest in subsidiaries 660 141 194 (200) 795 1,955 449 888 (674) 2,618Income taxes (recovery) (teb) (1) 194 33 64 (184) 107 594 110 284 (497) 491Non-controlling interest in subsidiaries - - - 19 19 - - - 56 56
Net income Q3-2010 466 108 130 (35) 669 1,361 339 604 (233) 2,071
Net income Q2-2010 441 118 260 (74) 745 895 231 474 (198) 1,402
Net income Q3-2009 420 113 310 (286) 557 1,252 253 613 (978) 1,140
Other statistics
Net economic profit 292 83 14 (231) 158 836 265 248 (756) 593Return on equity 28.3% 34.9% 11.8% nm 13.7% 27.6% 35.9% 18.4% nm 14.8%Cash return on equity 28.8% 35.4% 11.8% nm 13.9% 28.0% 36.4% 18.4% nm 14.9%Operating leverage 2.7% 4.3% (16.3)% nm (3.8)% 4.1% 9.8% 6.0% nm 11.8%Cash operating leverage 2.4% 4.5% (16.3)% nm (3.9)% 3.8% 9.9% 6.0% nm 11.7%Productivity ratio (teb) 55.7% 73.8% 61.9% nm 65.3% 54.8% 72.5% 55.6% nm 62.0%Cash productivity ratio (teb) 55.3% 73.5% 61.9% nm 65.0% 54.5% 72.2% 55.6% nm 61.7%Net interest margin on earning assets (teb) 3.08% 2.77% 0.95% nm 1.88% 3.05% 2.79% 0.96% nm 1.87%Average common equity 6,337 1,203 4,057 6,789 18,386 6,394 1,245 4,191 5,984 17,814Average earning assets ($ billions) 172.5 13.3 148.3 (3.2) 330.9 170.0 12.8 152.0 (4.4) 330.4Full-time equivalent staff 21,073 4,868 2,265 9,981 38,187
nm – not meaningful (1) Operating group revenues, income taxes and net interest margin are stated on a taxable equivalent basis (teb). The group teb adjustments are offset in Corporate, and Total BMO revenue, income taxes and net
interest margin are stated on a GAAP basis.
The following sections review the financial results of each of our operating segments and operating groups for the third quarter of 2010. Periodically, certain business lines and units within the business lines are transferred between client groups to more closely align BMO’s organizational structure with its strategic priorities. In the first quarter, we changed the manner in which we report securitized assets in our segmented disclosure. Previously, certain securitized mortgage assets were not reported in P&C Canada’s balance sheet. We now report all securitized mortgage assets in P&C Canada with offsetting amounts in Corporate, and net interest income earned on all securitized mortgage assets is included in P&C Canada net interest income. Previously, net interest income earned on certain securitized mortgage assets was included in P&C Canada non-interest revenue. These changes do not have a meaningful impact on the earnings of P&C Canada. Results for prior periods were restated to conform to the current presentation.
In the second quarter, we identified U.S. mid-market clients that would be better served by a commercial banking model and transferred the accounts to P&C U.S. from BMO Capital Markets. Comparative figures were restated to reflect the effects of the transfer and conform to the current presentation. In the current quarter, we determined that certain BMO Capital Markets transactions should be reported on a basis that reflects their teb. Similar transactions have been recorded in prior periods and amounts reflected in respect of those transactions in prior periods have been restated to reflect the current basis of reporting, resulting in increases in net interest income, net interest margin and income taxes in BMO Capital Markets with offsetting amounts reflected in Corporate Services. Note 15 to the attached unaudited interim consolidated financial statements outlines how income statement items requiring allocation are distributed among the operating groups, including the allocation of the provision for credit losses. Corporate Services is generally charged (or credited) with differences between the periodic provisions for credit losses charged to the client groups under our expected loss provisioning methodology and the periodic provisions required under GAAP.

BMO Financial Group Third Quarter Report 2010 • 21
Personal and Commercial Banking (P&C)
(Canadian $ in millions, except as noted) Q3-2010
Increase (Decrease)
vs. Q3-2009
Increase (Decrease)
vs. Q2-2010 YTD-2010
Increase (Decrease)
vs. YTD-2009
Net interest income (teb) 1,340 89 7% 92 7% 3,872 97 3%Non-interest revenue 511 37 8% 15 3% 1,483 136 10%
Total revenue (teb) 1,851 126 7% 107 6% 5,355 233 5%Provision for credit losses 160 40 32% 8 5% 463 109 30%Non-interest expense 1,031 45 5% 76 8% 2,937 14 1%
Income before income taxes and non-controlling interest in subsidiaries 660 41 7% 23 3% 1,955 110 6%Income taxes (teb) 194 (5) (2%) (2) (1%) 594 1 -Non-controlling interest in subsidiaries - - - - - - - -
Net income 466 46 11% 25 6% 1,361 109 9%
Amortization of acquisition-related intangible assets (after tax) 7 (3) (16%) 1 25% 18 (8) (28%)
Cash net income 473 43 10% 26 6% 1,379 101 8%
Return on equity 28.3% 4.2% 0.7% 27.6% 4.8%Cash return on equity 28.8% 4.2% 0.8% 28.0% 4.8%Operating leverage 2.7% nm nm 4.1% nmCash operating leverage 2.4% nm nm 3.8% nmProductivity ratio (teb) 55.7% (1.4%) 1.0% 54.8% (2.3%)Cash productivity ratio (teb) 55.3% (1.3%) 1.0% 54.5% (2.0%)Net interest margin on earning assets (teb) 3.08% 0.17% 0.05% 3.05% 0.18%Average earning assets ($ billions) 173 2 1% 3 2% 170 (6) (3%)
nm – not meaningful
Personal and Commercial Banking (P&C) represents the sum of our two retail and business banking operating segments, Personal and Commercial Banking Canada (P&C Canada) and Personal and Commercial Banking U.S. (P&C U.S.). These operating segments are reviewed separately in the sections that follow.
Personal and Commercial Banking Canada (P&C Canada)
(Canadian $ in millions, except as noted) Q3-2010
Increase (Decrease)
vs. Q3-2009
Increase (Decrease)
vs. Q2-2010 YTD-2010
Increase (Decrease)
vs. YTD-2009
Net interest income (teb) 1,065 90 9% 76 8% 3,073 254 9%Non-interest revenue 425 38 10% 6 2% 1,236 151 14%
Total revenue (teb) 1,490 128 9% 82 6% 4,309 405 10%Provision for credit losses 129 32 31% 8 6% 370 85 30%Non-interest expense 763 28 4% 43 6% 2,192 61 3%
Income before income taxes and non-controlling interest in subsidiaries 598 68 13% 31 5% 1,747 259 17%Income taxes (teb) 172 4 3% - - 523 52 11%Non-controlling interest in subsidiaries - - - - - - - -
Net income 426 64 17% 31 8% 1,224 207 20%
Amortization of acquisition-related intangible assets (after tax) 2 (1) (69%) - - 5 1 35%
Cash net income 428 63 17% 31 8% 1,229 208 20%
Personal revenue 706 49 7% 42 6% 2,043 162 9%Commercial revenue 420 28 7% 28 7% 1,215 111 10%Cards revenue 364 51 17% 12 4% 1,051 132 15%Operating leverage 5.4% nm nm 7.5% nmCash operating leverage 5.5% nm nm 7.6% nmProductivity ratio (teb) 51.2% (2.7%) 0.1% 50.9% (3.7%)Cash productivity ratio (teb) 51.1% (2.7%) 0.1% 50.8% (3.7%)Net interest margin on earning assets (teb) 2.96% 0.09% 0.05% 2.94% 0.14%Average earning assets ($ billions) 143 8 6% 3 2% 140 5 4%
nm – not meaningful

22 • BMO Financial Group Third Quarter Report 2010
Q3 2010 vs Q3 2009
Net income was a strong $426 million, up $64 million or 17% from a year ago. Revenue rose $128 million or 9.3%, driven by volume growth across most products, the inclusion of Diners Club revenues in our financial results and an improved net interest margin. Net interest margin increased by 9 basis points, driven primarily by an increase in spreads on deposit products from unusually low levels a year ago. In the personal banking segment, revenue increased $49 million or 7.1%, driven by volume growth in loans and an increase in spreads on deposit products from unusually low levels a year ago. Homeowner ReadiLine growth drove personal loan growth of 16% year over year as market share increased from the prior year. Mortgage loan balances increased 0.5% as we are successfully replacing the runoff of our broker-channel loans with our branch originated balances and, as expected, mortgage market share decreased from a year ago. We had a successful spring campaign and we continue to be pleased with the success of our new 5-year low fixed-rate mortgage product. Our goal is to grow market share and we remain focused on improving this business through investment in the sales force and achieving productivity gains while continuing to be prudently attentive to the credit quality of the portfolio. Personal deposits balances decreased 0.5% year over year as a result of investor preferences. Market share also decreased in the highly competitive environment. In the commercial banking segment, revenue increased $28 million or 7.2% year over year due to volume growth in loans and deposits. Loan balances grew 4.0% as our market share increased from a year ago and we continued to rank second in Canadian business banking market share of small and mid-size business loans. Deposit balances grew 10%, reflecting our focus on meeting all of our customers’ banking needs. We continue to invest in the size and capabilities of our commercial workforce to provide more and better advice to our customers. Cards and Payment Services revenue increased $51 million or 17% due to the inclusion of Diners Club revenues in our financial results, loan balance growth and spread improvement, partially offset by lower card fees. Provisions for credit losses, on an expected loss basis, increased $32 million due to growth in the portfolio and the impact of credit migration. Non-interest expense increased $28 million or 3.9%, due to the inclusion of Diners Club in our results as well as higher initiatives expense. Employee costs were relatively flat as higher salaries
and benefits due to increased staff levels were offset by the impact of severance costs related to simplifying our management structure that were recorded in the prior year. The group’s cash operating leverage was a strong 5.5%. We continue to invest strategically to improve our competitive position while managing our operating expenses prudently. Results in the current quarter included a modest recovery of prior periods’ income taxes. Average current loans and acceptances, including securitized loans, increased $8.0 billion or 5.9% from a year ago and personal and commercial deposits grew $2.5 billion or 2.6%. Q3 2010 vs Q2 2010
Net income increased $31 million or 7.7% due largely to three more days in the current quarter as well as the recovery of prior periods’ income taxes. Revenue increased $82 million or 5.7%, driven by three more calendar days in the quarter and volume growth across most products. Net interest margin increased 5 basis points due primarily to higher volumes in more profitable products and higher mortgage refinancing fees. Non-interest expense increased $43 million or 6.1% primarily due to increases in initiative and employee-related costs. Employee costs increased due to the effects of more calendar days in the current quarter, higher staff levels and increased performance-based compensation. Average current loans and acceptances, including securitized loans, increased $3.2 billion or 2.3% from the preceding quarter while personal and commercial deposits increased $1.7 billion or 1.7%. Q3 YTD 2010 vs Q3 YTD 2009
Net income increased $207 million or 20%. Revenue increased $405 million or 10%, driven by volume growth across most products, an improved net interest margin and the inclusion of seven months of Diners Club financial results in the current year. Net interest margin increased 14 basis points, driven primarily by actions taken in 2009 to mitigate the impact of rising long-term funding costs and higher volume in more profitable products. Non-interest expense increased $61 million or 2.9% due to the inclusion of seven months of Diners Club financial results in the current year and higher initiatives costs, partially offset by the impact of severance costs related to simplifying our management structure recorded in the prior year.

BMO Financial Group Third Quarter Report 2010 • 23
Personal and Commercial Banking U.S. (P&C U.S.)
(Canadian $ in millions, except as noted) Q3-2010
Increase (Decrease)
vs. Q3-2009
Increase (Decrease)
vs. Q2-2010 YTD-2010
Increase (Decrease)
vs. YTD-2009
Net interest income (teb) 275 (1) - 16 7% 799 (157) (16%)Non-interest revenue 86 (1) (1%) 9 11% 247 (15) (5%)
Total revenue (teb) 361 (2) - 25 8% 1,046 (172) (14%)Provision for credit losses 31 8 35% - - 93 24 34%Non-interest expense 268 17 7% 33 14% 745 (47) (6%)
Income before income taxes and non-controlling interest in subsidiaries 62 (27) (29%) (8)
(11%) 208 (149) (41%)
Income taxes (teb) 22 (9) (26%) (2) (7%) 71 (51) (41%)Non-controlling interest in subsidiaries - - - - - - - -
Net income 40 (18) (31%) (6) (14%) 137 (98) (42%)
Amortization of acquisition-related intangible assets (after tax) 5 (2) (27%) 1 23% 13 (9) (37%)
Cash net income 45 (20) (30%) (5) (10%) 150 (107) (41%)
Operating leverage (7.0%) nm nm (8.1%) nmCash operating leverage (8.3%) nm nm (9.2%) nmProductivity ratio (teb) 74.3% 4.9% 4.4% 71.2% 6.1%Cash productivity ratio (teb) 72.6% 5.6% 4.2% 69.6% 6.7%Net interest margin on earning assets (teb) 3.70% 0.59% 0.15% 3.53% 0.41%Average earning assets ($ billions) 30 (6) (16%) - - 30 (11) (26%)
U.S. Select Financial Data (US$ in millions, except as noted)
Net interest income (teb) 263 15 6% 11 5% 765 (34) (4%)Non-interest revenue 82 3 5% 7 10% 237 17 8%
Total revenue (teb) 345 18 6% 18 6% 1,002 (17) (2%)Non-interest expense 257 31 13% 29 12% 714 50 7%Net Income 38 (14) (27%) (7) (15%) 131 (64) (33%)Average earning assets (US$ billions) 29 (3) (11%) - - 29 (5) (16%)
nm – not meaningful
Q3 2010 vs Q3 2009
Net income decreased Cdn$18 million or 31% to Cdn$40 million. Amounts in the rest of this section are outlined in U.S. dollars. On a U.S. dollar basis, net income was $38 million, down $14 million or 27% from a year ago. Lower earnings were primarily driven by higher credit losses on an expected loss basis, the impact of impaired loans and a valuation adjustment on our serviced mortgage portfolio due to lower long-term interest rates. The second quarter Rockford, Illinois-based bank transaction increased revenue by $18 million, expenses by $16 million, excluding acquisition costs, and net income by $1 million. On a basis that adjusts for the impact of impaired loans, a reduction in the Visa litigation accrual and acquisition integration costs, net income was $54 million, down $11 million or 17% from results of a year ago on a comparably-adjusted basis. Adjusted on this basis, the cash productivity ratio was 66.2%. Revenue of $345 million increased $18 million or 5.9%, primarily due to our Rockford, Illinois-based bank transaction. Revenue from loan spread improvement and deposit balance growth were offset by a decrease in commercial loan balances due to lower client loan utilization and deposit spread compression.
Non-interest expense was $31 million or 13% higher, primarily driven by our Rockford, Illinois-based bank transaction, increases in impaired loans and the valuation adjustment on our serviced mortgage portfolio related to lower long-term interest rates, partially offset by a reduction to our Visa litigation accrual.
Q3 2010 vs Q2 2010
Net income decreased Cdn$6 million or 14% from the second quarter. On a U.S. dollar basis, net income fell $7 million or 15% to $38 million. Amounts in the rest of this section are outlined in U.S. dollars. Revenue increased $18 million or 5.8%, primarily due to our Rockford, Illinois-based bank transaction. Non-interest expense increased $29 million or 12%, primarily driven by our Rockford, Illinois-based bank transaction, increases in impaired loan costs and the valuation adjustment on our serviced mortgage portfolio related to lower long-term interest rates, partially offset by a reduction to our Visa litigation accrual. Our continued focus on the customer experience is reflected in our high loyalty scores. Our retail net promoter score was 41 for the third quarter of 2010, compared with 39 in the second quarter. Our retail net promoter score remains very strong compared to the scores of the major banks with which we compete.
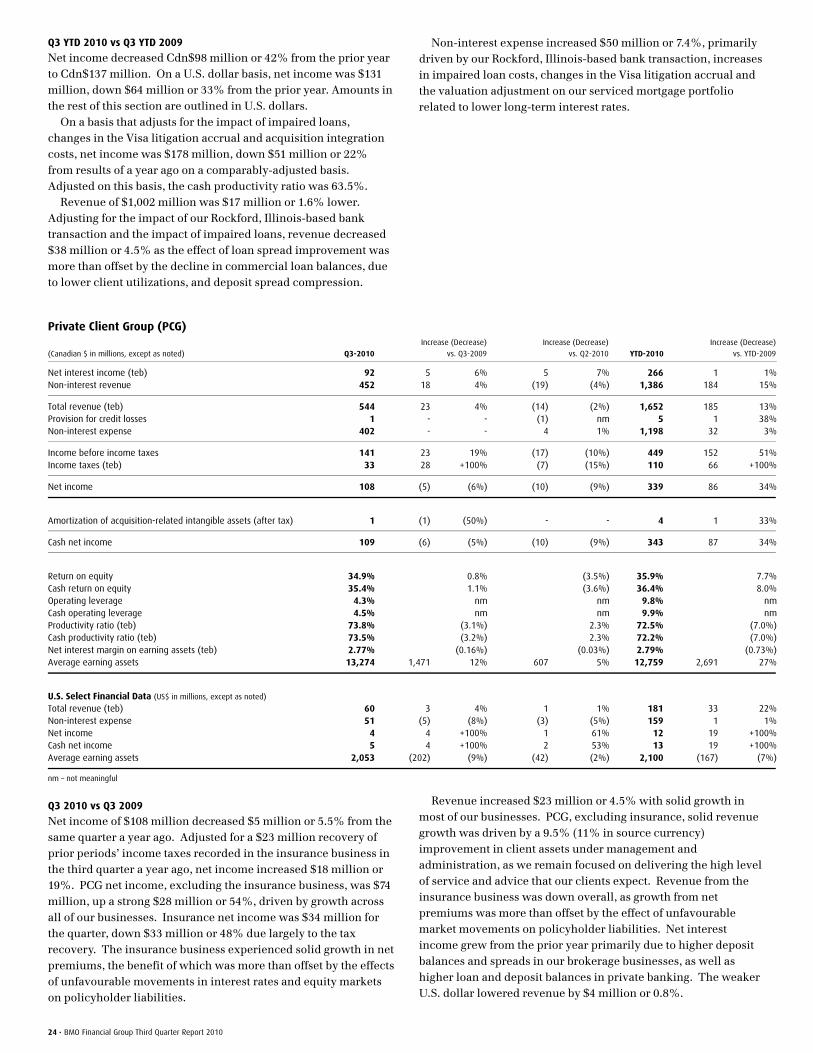
24 • BMO Financial Group Third Quarter Report 2010
Q3 YTD 2010 vs Q3 YTD 2009
Net income decreased Cdn$98 million or 42% from the prior year to Cdn$137 million. On a U.S. dollar basis, net income was $131 million, down $64 million or 33% from the prior year. Amounts in the rest of this section are outlined in U.S. dollars. On a basis that adjusts for the impact of impaired loans, changes in the Visa litigation accrual and acquisition integration costs, net income was $178 million, down $51 million or 22% from results of a year ago on a comparably-adjusted basis. Adjusted on this basis, the cash productivity ratio was 63.5%. Revenue of $1,002 million was $17 million or 1.6% lower. Adjusting for the impact of our Rockford, Illinois-based bank transaction and the impact of impaired loans, revenue decreased $38 million or 4.5% as the effect of loan spread improvement was more than offset by the decline in commercial loan balances, due to lower client utilizations, and deposit spread compression.
Non-interest expense increased $50 million or 7.4%, primarily driven by our Rockford, Illinois-based bank transaction, increases in impaired loan costs, changes in the Visa litigation accrual and the valuation adjustment on our serviced mortgage portfolio related to lower long-term interest rates.
Private Client Group (PCG)
(Canadian $ in millions, except as noted) Q3-2010
Increase (Decrease)
vs. Q3-2009
Increase (Decrease)
vs. Q2-2010 YTD-2010
Increase (Decrease)
vs. YTD-2009
Net interest income (teb) 92 5 6% 5 7% 266 1 1%Non-interest revenue 452 18 4% (19) (4%) 1,386 184 15%
Total revenue (teb) 544 23 4% (14) (2%) 1,652 185 13%Provision for credit losses 1 - - (1) nm 5 1 38%Non-interest expense 402 - - 4 1% 1,198 32 3%
Income before income taxes 141 23 19% (17) (10%) 449 152 51%Income taxes (teb) 33 28 +100% (7) (15%) 110 66 +100%
Net income 108 (5) (6%) (10) (9%) 339 86 34%
Amortization of acquisition-related intangible assets (after tax) 1 (1) (50%) - - 4 1 33%
Cash net income 109 (6) (5%) (10) (9%) 343 87 34%
Return on equity 34.9% 0.8% (3.5%) 35.9% 7.7%Cash return on equity 35.4% 1.1% (3.6%) 36.4% 8.0%Operating leverage 4.3% nm nm 9.8% nmCash operating leverage 4.5% nm nm 9.9% nmProductivity ratio (teb) 73.8% (3.1%) 2.3% 72.5% (7.0%)Cash productivity ratio (teb) 73.5% (3.2%) 2.3% 72.2% (7.0%)Net interest margin on earning assets (teb) 2.77% (0.16%) (0.03%) 2.79% (0.73%)Average earning assets 13,274 1,471 12% 607 5% 12,759 2,691 27%
U.S. Select Financial Data (US$ in millions, except as noted) Total revenue (teb) 60 3 4% 1 1% 181 33 22%Non-interest expense 51 (5) (8%) (3) (5%) 159 1 1%Net income 4 4 +100% 1 61% 12 19 +100%Cash net income 5 4 +100% 2 53% 13 19 +100%Average earning assets 2,053 (202) (9%) (42) (2%) 2,100 (167) (7%)
nm – not meaningful
Q3 2010 vs Q3 2009
Net income of $108 million decreased $5 million or 5.5% from the same quarter a year ago. Adjusted for a $23 million recovery of prior periods’ income taxes recorded in the insurance business in the third quarter a year ago, net income increased $18 million or 19%. PCG net income, excluding the insurance business, was $74 million, up a strong $28 million or 54%, driven by growth across all of our businesses. Insurance net income was $34 million for the quarter, down $33 million or 48% due largely to the tax recovery. The insurance business experienced solid growth in net premiums, the benefit of which was more than offset by the effects of unfavourable movements in interest rates and equity markets on policyholder liabilities.
Revenue increased $23 million or 4.5% with solid growth in most of our businesses. PCG, excluding insurance, solid revenue growth was driven by a 9.5% (11% in source currency) improvement in client assets under management and administration, as we remain focused on delivering the high level of service and advice that our clients expect. Revenue from the insurance business was down overall, as growth from net premiums was more than offset by the effect of unfavourable market movements on policyholder liabilities. Net interest income grew from the prior year primarily due to higher deposit balances and spreads in our brokerage businesses, as well as higher loan and deposit balances in private banking. The weaker U.S. dollar lowered revenue by $4 million or 0.8%.

BMO Financial Group Third Quarter Report 2010 • 25
Non-interest expense was relatively unchanged, as higher revenue-based costs associated with our strong revenue growth in PCG, excluding insurance, were offset by the benefits of active expense management. The weaker U.S. dollar reduced expenses by $3 million or 0.8%. The cash productivity ratio of 73.5% improved 320 basis points from the prior year. After adjusting to exclude the impact of the weaker U.S. dollar, assets under management and administration grew $26 billion or 11%, benefiting from PCG attracting net new client assets and improved equity market conditions. Q3 2010 vs Q2 2010
Net income decreased $10 million or 8.8% from the second quarter. The modest $1 million growth in net income of PCG, excluding insurance, was more than offset by $11 million lower insurance net income due to the effects of adverse market movements on policyholder liabilities. Revenue decreased $14 million or 2.3% as higher mutual fund revenue was more than offset by lower commission revenue in the brokerage businesses and lower insurance revenue. Insurance revenue declined overall, as revenue growth from higher net premiums was more than offset by the effects of unfavourable movements in interest rates and equity markets on policyholder liabilities. Net interest income grew primarily due to higher loan and deposit balances in private banking and higher deposit spreads in the brokerage businesses, which benefited from the rising short-term interest rate environment. Non-interest expense was $4 million or 0.8% higher primarily due to our sales force expansion as we continue to invest for future revenue growth. This contributed to the cash productivity ratio of 73.5% increasing 230 basis points from the prior quarter. Assets under management and administration decreased by $2 billion or 0.9% primarily due to weaker equity markets.
Q3 YTD 2010 vs Q3 YTD 2009
Net income increased by a strong $86 million or 34% from the prior year. PCG net income, excluding the insurance business, was $217 million, up a strong $93 million or 74%. Insurance net income was $122 million, down $7 million or 5.2% from a year ago. Results a year ago included a charge of $17 million ($11 million after tax) related to the decision to assist some of our U.S. clients by purchasing auction-rate securities from their accounts in the weak capital markets environment and a $23 million recovery of prior periods’ income taxes recorded in our insurance business. Revenue improved by $185 million or 13% due to revenue growth across all of our businesses. Insurance revenue increased from higher net premiums, including the benefit of the BMO Life Assurance acquisition late in the second quarter of 2009, partially offset by the effects of unfavourable movements in interest rates and equity markets on policyholder liabilities. Net interest income increased marginally as deposit and loan growth in our private banking and brokerage businesses was largely offset by spread compression in our brokerage businesses. The weaker U.S. dollar lowered revenue by $30 million. Non-interest expense increased $32 million or 2.8%, primarily as a result of higher revenue-based costs, in line with improved performance. The BMO Life Assurance acquisition increased expenses by $32 million. The Group continues to focus actively on expense management. The weaker U.S. dollar reduced expenses by $23 million. The cash productivity ratio of 72.2% improved 700 basis points from the same period last year.
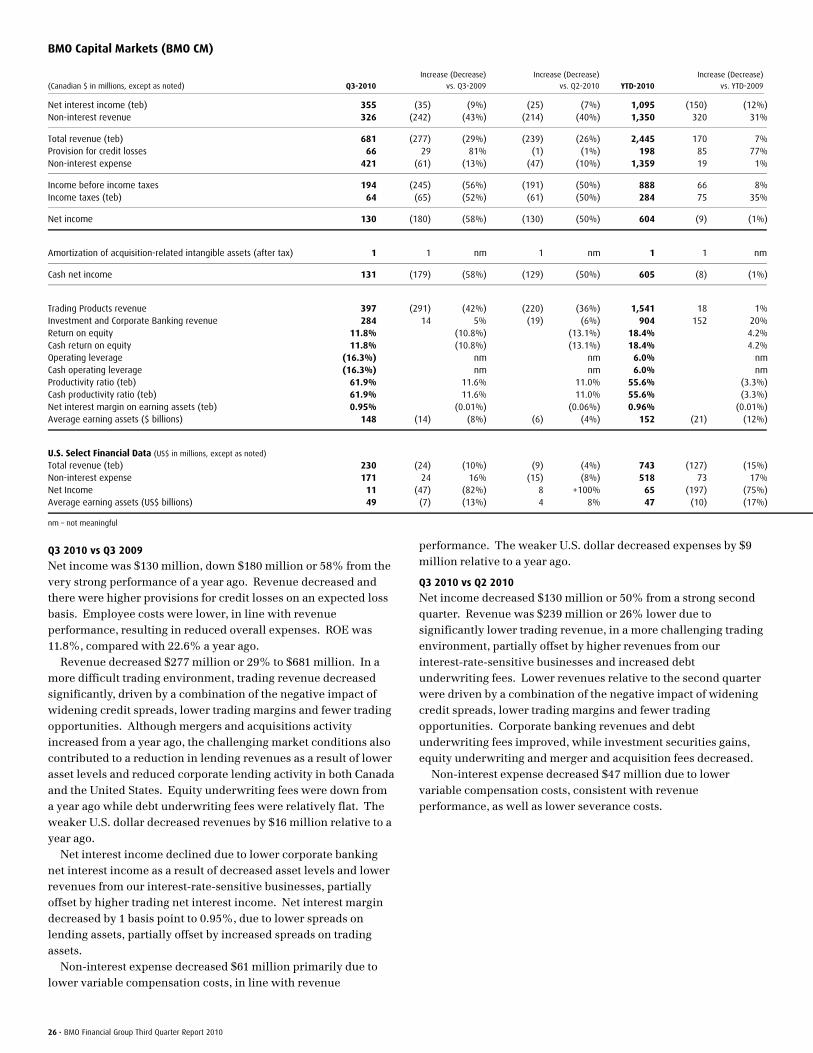
26 • BMO Financial Group Third Quarter Report 2010
BMO Capital Markets (BMO CM)
(Canadian $ in millions, except as noted) Q3-2010
Increase (Decrease)
vs. Q3-2009
Increase (Decrease)
vs. Q2-2010 YTD-2010
Increase (Decrease)
vs. YTD-2009
Net interest income (teb) 355 (35) (9%) (25) (7%) 1,095 (150) (12%)Non-interest revenue 326 (242) (43%) (214) (40%) 1,350 320 31%
Total revenue (teb) 681 (277) (29%) (239) (26%) 2,445 170 7%Provision for credit losses 66 29 81% (1) (1%) 198 85 77%Non-interest expense 421 (61) (13%) (47) (10%) 1,359 19 1%
Income before income taxes 194 (245) (56%) (191) (50%) 888 66 8%Income taxes (teb) 64 (65) (52%) (61) (50%) 284 75 35%
Net income 130 (180) (58%) (130) (50%) 604 (9) (1%)
Amortization of acquisition-related intangible assets (after tax) 1 1 nm 1 nm 1 1 nm
Cash net income 131 (179) (58%) (129) (50%) 605 (8) (1%)
Trading Products revenue 397 (291) (42%) (220) (36%) 1,541 18 1%Investment and Corporate Banking revenue 284 14 5% (19) (6%) 904 152 20%Return on equity 11.8% (10.8%) (13.1%) 18.4% 4.2%Cash return on equity 11.8% (10.8%) (13.1%) 18.4% 4.2%Operating leverage (16.3%) nm nm 6.0% nmCash operating leverage (16.3%) nm nm 6.0% nmProductivity ratio (teb) 61.9% 11.6% 11.0% 55.6% (3.3%)Cash productivity ratio (teb) 61.9% 11.6% 11.0% 55.6% (3.3%)Net interest margin on earning assets (teb) 0.95% (0.01%) (0.06%) 0.96% (0.01%)Average earning assets ($ billions) 148 (14) (8%) (6) (4%) 152 (21) (12%)
U.S. Select Financial Data (US$ in millions, except as noted) Total revenue (teb) 230 (24) (10%) (9) (4%) 743 (127) (15%)Non-interest expense 171 24 16% (15) (8%) 518 73 17%Net Income 11 (47) (82%) 8 +100% 65 (197) (75%)Average earning assets (US$ billions) 49 (7) (13%) 4 8% 47 (10) (17%)
nm – not meaningful
Q3 2010 vs Q3 2009
Net income was $130 million, down $180 million or 58% from the very strong performance of a year ago. Revenue decreased and there were higher provisions for credit losses on an expected loss basis. Employee costs were lower, in line with revenue performance, resulting in reduced overall expenses. ROE was 11.8%, compared with 22.6% a year ago. Revenue decreased $277 million or 29% to $681 million. In a more difficult trading environment, trading revenue decreased significantly, driven by a combination of the negative impact of widening credit spreads, lower trading margins and fewer trading opportunities. Although mergers and acquisitions activity increased from a year ago, the challenging market conditions also contributed to a reduction in lending revenues as a result of lower asset levels and reduced corporate lending activity in both Canada and the United States. Equity underwriting fees were down from a year ago while debt underwriting fees were relatively flat. The weaker U.S. dollar decreased revenues by $16 million relative to a year ago. Net interest income declined due to lower corporate banking net interest income as a result of decreased asset levels and lower revenues from our interest-rate-sensitive businesses, partially offset by higher trading net interest income. Net interest margin decreased by 1 basis point to 0.95%, due to lower spreads on lending assets, partially offset by increased spreads on trading assets. Non-interest expense decreased $61 million primarily due to lower variable compensation costs, in line with revenue
performance. The weaker U.S. dollar decreased expenses by $9 million relative to a year ago.
Q3 2010 vs Q2 2010
Net income decreased $130 million or 50% from a strong second quarter. Revenue was $239 million or 26% lower due to significantly lower trading revenue, in a more challenging trading environment, partially offset by higher revenues from our interest-rate-sensitive businesses and increased debt underwriting fees. Lower revenues relative to the second quarter were driven by a combination of the negative impact of widening credit spreads, lower trading margins and fewer trading opportunities. Corporate banking revenues and debt underwriting fees improved, while investment securities gains, equity underwriting and merger and acquisition fees decreased. Non-interest expense decreased $47 million due to lower variable compensation costs, consistent with revenue performance, as well as lower severance costs.
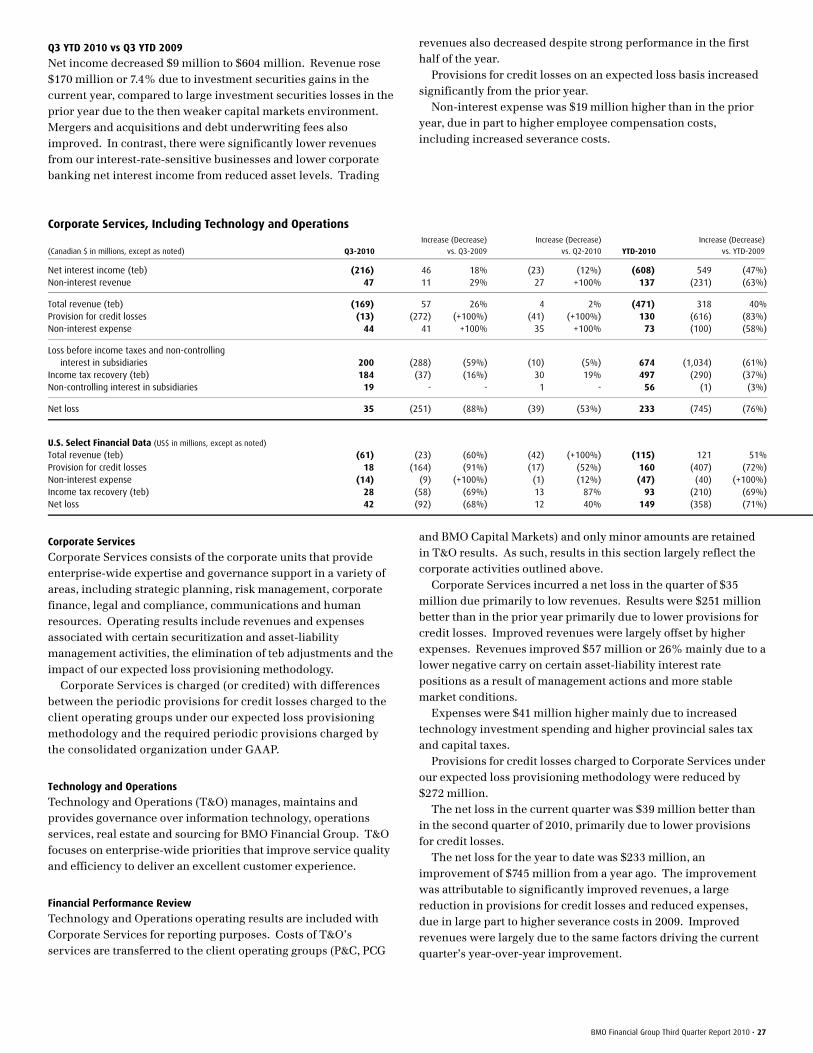
BMO Financial Group Third Quarter Report 2010 • 27
Q3 YTD 2010 vs Q3 YTD 2009
Net income decreased $9 million to $604 million. Revenue rose $170 million or 7.4% due to investment securities gains in the current year, compared to large investment securities losses in the prior year due to the then weaker capital markets environment. Mergers and acquisitions and debt underwriting fees also improved. In contrast, there were significantly lower revenues from our interest-rate-sensitive businesses and lower corporate banking net interest income from reduced asset levels. Trading
revenues also decreased despite strong performance in the first half of the year. Provisions for credit losses on an expected loss basis increased significantly from the prior year. Non-interest expense was $19 million higher than in the prior year, due in part to higher employee compensation costs, including increased severance costs.
Corporate Services, Including Technology and Operations
(Canadian $ in millions, except as noted) Q3-2010
Increase (Decrease)
vs. Q3-2009
Increase (Decrease)
vs. Q2-2010 YTD-2010
Increase (Decrease)
vs. YTD-2009
Net interest income (teb) (216) 46 18% (23) (12%) (608) 549 (47%)Non-interest revenue 47 11 29% 27 +100% 137 (231) (63%)
Total revenue (teb) (169) 57 26% 4 2% (471) 318 40%Provision for credit losses (13) (272) (+100%) (41) (+100%) 130 (616) (83%)Non-interest expense 44 41 +100% 35 +100% 73 (100) (58%)
Loss before income taxes and non-controlling interest in subsidiaries 200 (288) (59%) (10) (5%) 674 (1,034) (61%)
Income tax recovery (teb) 184 (37) (16%) 30 19% 497 (290) (37%)Non-controlling interest in subsidiaries 19 - - 1 - 56 (1) (3%)
Net loss 35 (251) (88%) (39) (53%) 233 (745) (76%)
U.S. Select Financial Data (US$ in millions, except as noted) Total revenue (teb) (61) (23) (60%) (42) (+100%) (115) 121 51%Provision for credit losses 18 (164) (91%) (17) (52%) 160 (407) (72%)Non-interest expense (14) (9) (+100%) (1) (12%) (47) (40) (+100%)Income tax recovery (teb) 28 (58) (69%) 13 87% 93 (210) (69%)Net loss 42 (92) (68%) 12 40% 149 (358) (71%)
Corporate Services
Corporate Services consists of the corporate units that provide enterprise-wide expertise and governance support in a variety of areas, including strategic planning, risk management, corporate finance, legal and compliance, communications and human resources. Operating results include revenues and expenses associated with certain securitization and asset-liability management activities, the elimination of teb adjustments and the impact of our expected loss provisioning methodology. Corporate Services is charged (or credited) with differences between the periodic provisions for credit losses charged to the client operating groups under our expected loss provisioning methodology and the required periodic provisions charged by the consolidated organization under GAAP.
Technology and Operations
Technology and Operations (T&O) manages, maintains and provides governance over information technology, operations services, real estate and sourcing for BMO Financial Group. T&O focuses on enterprise-wide priorities that improve service quality and efficiency to deliver an excellent customer experience.
Financial Performance Review
Technology and Operations operating results are included with Corporate Services for reporting purposes. Costs of T&O’s services are transferred to the client operating groups (P&C, PCG
and BMO Capital Markets) and only minor amounts are retained in T&O results. As such, results in this section largely reflect the corporate activities outlined above. Corporate Services incurred a net loss in the quarter of $35 million due primarily to low revenues. Results were $251 million better than in the prior year primarily due to lower provisions for credit losses. Improved revenues were largely offset by higher expenses. Revenues improved $57 million or 26% mainly due to a lower negative carry on certain asset-liability interest rate positions as a result of management actions and more stable market conditions. Expenses were $41 million higher mainly due to increased technology investment spending and higher provincial sales tax and capital taxes. Provisions for credit losses charged to Corporate Services under our expected loss provisioning methodology were reduced by $272 million. The net loss in the current quarter was $39 million better than in the second quarter of 2010, primarily due to lower provisions for credit losses. The net loss for the year to date was $233 million, an improvement of $745 million from a year ago. The improvement was attributable to significantly improved revenues, a large reduction in provisions for credit losses and reduced expenses, due in large part to higher severance costs in 2009. Improved revenues were largely due to the same factors driving the current quarter’s year-over-year improvement.

28 • BMO Financial Group Third Quarter Report 2010
Notable items (Canadian $ in millions, except as noted) Q3-2010 Q2-2010 Q3-2009 YTD-2010 YTD-2009
Charges related to deterioration in capital markets environment - - 8 - 471
Related income taxes - - 3 - 150
Net impact of charges related to the deterioration in capital markets environment (a) - - 5 - 321
Severance charges - - - - 118
Related income taxes - - - - 38
Net impact of severance charges (b) - - - - 80
Increase in general allowance - - 60 - 60Related income taxes - - 21 - 21
Net impact of increase of general allowance (c) - - 39 - 39
Net impact of notable items (a+b+c) - - 44 - 440
Notable Items
As noted in the Annual Report, we chose to redefine notable items for fiscal 2009. Notable items identified for prior quarters align accordingly.
Q3 2010
No charges in respect of the capital markets environment have been designated as notable items this quarter in light of the relative insignificance of the amounts.
Q2 2010
No charges in respect of the capital markets environment were designated as notable items this quarter in light of the relative insignificance of the amounts.
Q3 2009
Net income for the third quarter of 2009 was lowered by charges of $68 million ($44 million after tax and $0.08 per share) comprised of: $8 million related to a Canadian credit protection vehicle ($5 million after tax) and a $60 million ($39 million after tax) increase in the general allowance for credit losses recorded in Corporate Services. YTD 2010
No charges in respect of the capital markets environment have been designated as notable items in 2010 in light of the relative insignificance of the amounts.
YTD 2009
Net income for the year-to-date 2009 was affected by a total of $649 million ($440 million after tax and $0.82 per share) in respect of capital markets environment charges, severance costs and an increase in the general allowance for credit losses. BMO recorded capital markets environment charges related to a Canadian credit protection vehicle of $471 million ($321 million after tax). In Corporate Services, there were severance costs of $118 million ($80 million after tax) and a $60 million ($39 million after tax) increase in the general allowance for credit losses. Non-interest revenue for year-to-date 2009 was affected by the $471 million of charges outlined above. There were reductions in trading non-interest revenue ($294 million) and investment securities gains ($177 million).
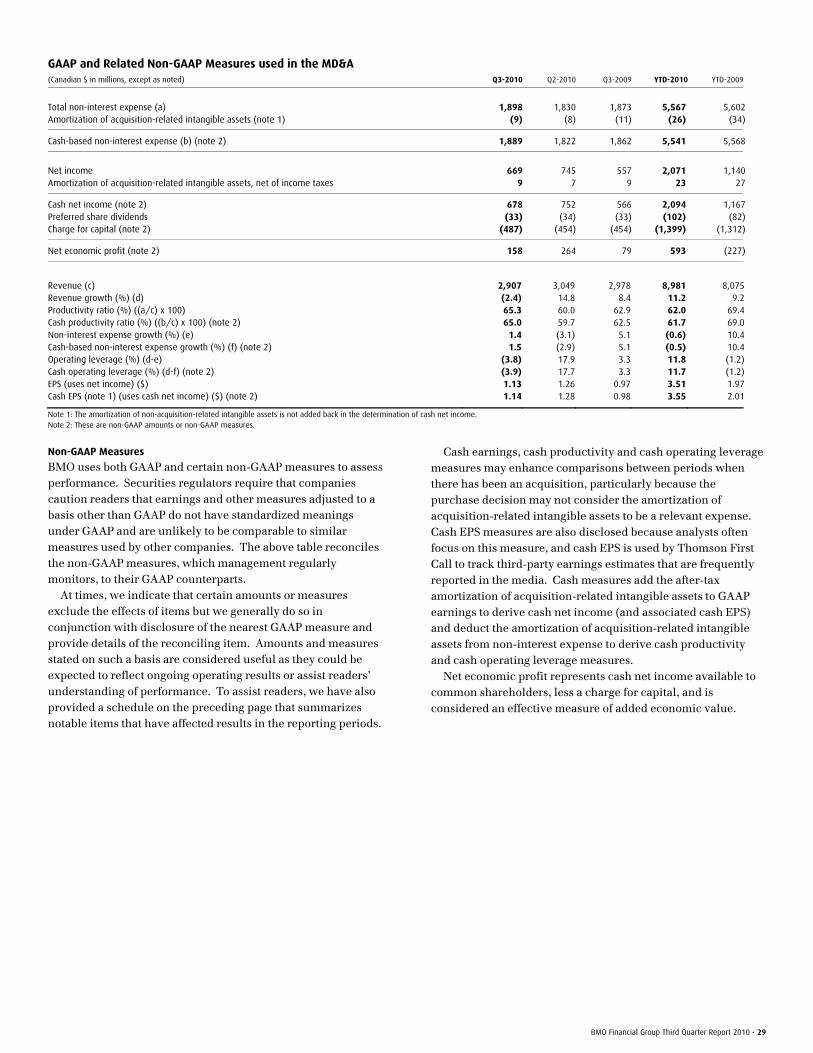
BMO Financial Group Third Quarter Report 2010 • 29
GAAP and Related Non-GAAP Measures used in the MD&A (Canadian $ in millions, except as noted) Q3-2010 Q2-2010 Q3-2009 YTD-2010 YTD-2009
Total non-interest expense (a) 1,898 1,830 1,873 5,567 5,602Amortization of acquisition-related intangible assets (note 1) (9) (8) (11) (26) (34)
Cash-based non-interest expense (b) (note 2) 1,889 1,822 1,862 5,541 5,568
Net income 669 745 557 2,071 1,140Amortization of acquisition-related intangible assets, net of income taxes 9 7 9 23 27
Cash net income (note 2) 678 752 566 2,094 1,167Preferred share dividends (33) (34) (33) (102) (82)Charge for capital (note 2) (487) (454) (454) (1,399) (1,312)
Net economic profit (note 2) 158 264 79 593 (227)
Revenue (c) 2,907 3,049 2,978 8,981 8,075Revenue growth (%) (d) (2.4) 14.8 8.4 11.2 9.2Productivity ratio (%) ((a/c) x 100) 65.3 60.0 62.9 62.0 69.4Cash productivity ratio (%) ((b/c) x 100) (note 2) 65.0 59.7 62.5 61.7 69.0Non-interest expense growth (%) (e) 1.4 (3.1) 5.1 (0.6) 10.4Cash-based non-interest expense growth (%) (f) (note 2) 1.5 (2.9) 5.1 (0.5) 10.4Operating leverage (%) (d-e) (3.8) 17.9 3.3 11.8 (1.2)Cash operating leverage (%) (d-f) (note 2) (3.9) 17.7 3.3 11.7 (1.2)EPS (uses net income) ($) 1.13 1.26 0.97 3.51 1.97Cash EPS (note 1) (uses cash net income) ($) (note 2) 1.14 1.28 0.98 3.55 2.01 Note 1: The amortization of non-acquisition-related intangible assets is not added back in the determination of cash net income. Note 2: These are non-GAAP amounts or non-GAAP measures.
Non-GAAP Measures
BMO uses both GAAP and certain non-GAAP measures to assess performance. Securities regulators require that companies caution readers that earnings and other measures adjusted to a basis other than GAAP do not have standardized meanings under GAAP and are unlikely to be comparable to similar measures used by other companies. The above table reconciles the non-GAAP measures, which management regularly monitors, to their GAAP counterparts. At times, we indicate that certain amounts or measures exclude the effects of items but we generally do so in conjunction with disclosure of the nearest GAAP measure and provide details of the reconciling item. Amounts and measures stated on such a basis are considered useful as they could be expected to reflect ongoing operating results or assist readers’ understanding of performance. To assist readers, we have also provided a schedule on the preceding page that summarizes notable items that have affected results in the reporting periods.
Cash earnings, cash productivity and cash operating leverage measures may enhance comparisons between periods when there has been an acquisition, particularly because the purchase decision may not consider the amortization of acquisition-related intangible assets to be a relevant expense. Cash EPS measures are also disclosed because analysts often focus on this measure, and cash EPS is used by Thomson First Call to track third-party earnings estimates that are frequently reported in the media. Cash measures add the after-tax amortization of acquisition-related intangible assets to GAAP earnings to derive cash net income (and associated cash EPS) and deduct the amortization of acquisition-related intangible assets from non-interest expense to derive cash productivity and cash operating leverage measures. Net economic profit represents cash net income available to common shareholders, less a charge for capital, and is considered an effective measure of added economic value.

30 • BMO Financial Group Third Quarter Report 2010
Interim Consolidated Financial Statements
Consolidated Statement of Income
(Unaudited) (Canadian $ in millions, except as noted) For the three months ended For the nine months ended
July 31,2010
April 30,
2010
January 31,
2010
October 31,
2009
July 31,
2009
July 31,2010
July 31,
2009
Interest, Dividend and Fee Income
Loans $ 1,845 $ 1,737 $ 1,763 $ 1,835 $ 1,920 $ 5,345 $ 6,125 Securities 543 510 518 448 494 1,571 1,979 Deposits with banks 18 16 17 19 23 51 167
2,406 2,263 2,298 2,302 2,437 6,967 8,271
Interest Expense Deposits 610 527 559 672 789 1,696 3,369 Subordinated debt 30 28 29 32 24 87 103 Capital trust securities and preferred shares 18 19 20 20 20 57 60 Other liabilities 177 167 158 136 138 502 611
835 741 766 860 971 2,342 4,143
Net Interest Income 1,571 1,522 1,532 1,442 1,466 4,625 4,128 Provision for credit losses (Note 2) 214 249 333 386 417 796 1,217
Net Interest Income After Provision for Credit Losses 1,357 1,273 1,199 1,056 1,049 3,829 2,911
Non-Interest Revenue Securities, commissions and fees 258 261 263 250 240 782 723 Deposit and payment service charges 206 197 200 205 206 603 615 Trading revenues (losses) (1) 213 126 163 273 338 560 Lending fees 148 138 142 149 140 428 407 Card fees 67 66 35 29 35 168 92 Investment management and custodial fees 90 86 88 87 85 264 257 Mutual fund revenues 139 134 133 128 119 406 339 Securitization revenues 167 151 172 201 202 490 728 Underwriting and advisory fees 91 97 122 116 101 310 281 Securities gains (losses), other than trading 9 54 47 14 (12) 110 (368)Foreign exchange, other than trading 22 28 21 14 1 71 39 Insurance income 70 86 82 86 85 238 209 Other 70 16 62 105 37 148 65
1,336 1,527 1,493 1,547 1,512 4,356 3,947
Net Interest Income and Non-Interest Revenue 2,693 2,800 2,692 2,603 2,561 8,185 6,858
Non-Interest Expense Employee compensation (Note 8) 1,062 1,071 1,111 1,047 1,122 3,244 3,338 Premises and equipment 337 319 308 302 313 964 979 Amortization of intangible assets 52 55 50 50 48 157 153 Travel and business development 85 77 72 81 73 234 228 Communications 61 58 50 58 55 169 163 Business and capital taxes 19 12 11 (3) 19 42 47 Professional fees 98 79 77 97 91 254 265 Other 184 159 160 147 162 503 439
1,898 1,830 1,839 1,779 1,883 5,567 5,612
Restructuring Reversal - - - - (10) - (10)
Income Before Provision for Income Taxes and Non-Controlling Interest in Subsidiaries 795 970 853 824 688 2,618 1,256 Provision for income taxes 107 207 177 158 112 491 59
688 763 676 666 576 2,127 1,197 Non-controlling interest in subsidiaries 19 18 19 19 19 56 57
Net Income $ 669 $ 745 $ 657 $ 647 $ 557 $ 2,071 $ 1,140
Preferred share dividends $ 33 $ 34 $ 35 $ 38 $ 33 $ 102 $ 82 Net income available to common shareholders $ 636 $ 711 $ 622 $ 609 $ 524 $ 1,969 $ 1,058 Average common shares (in thousands) 561,839 558,320 553,992 550,495 547,134 558,047 536,855 Average diluted common shares (in thousands) 565,196 561,868 557,311 554,151 549,968 561,454 538,332
Earnings Per Share (Canadian $) (Note 12) Basic $ 1.13 $ 1.27 $ 1.12 $ 1.12 $ 0.97 $ 3.53 $ 1.97 Diluted 1.13 1.26 1.12 1.11 0.97 3.51 1.97
Dividends Declared Per Common Share 0.70 0.70 0.70 0.70 0.70 2.10 2.10
The accompanying notes are an integral part of these interim consolidated financial statements.
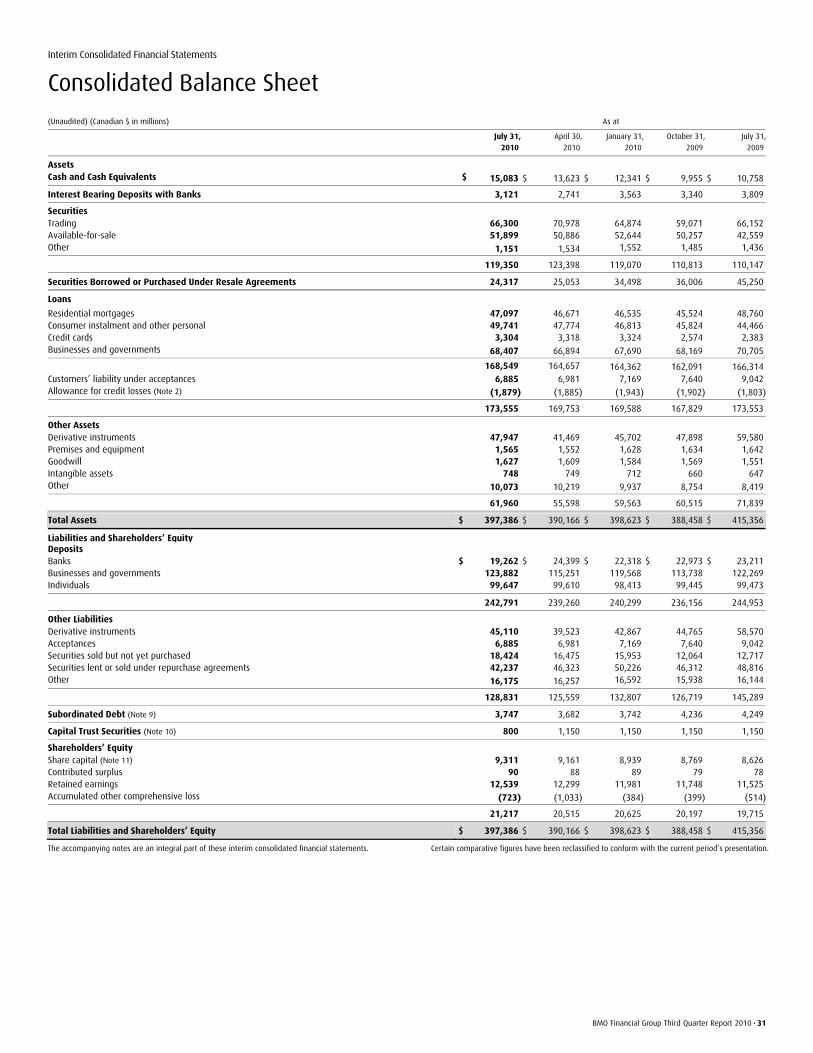
BMO Financial Group Third Quarter Report 2010 • 31
Interim Consolidated Financial Statements
Consolidated Balance Sheet
(Unaudited) (Canadian $ in millions) As at
July 31,2010
April 30,
2010
January 31,
2010
October 31,
2009
July 31,
2009
Assets Cash and Cash Equivalents $ 15,083 $ 13,623 $ 12,341 $ 9,955 $ 10,758
Interest Bearing Deposits with Banks 3,121 2,741 3,563 3,340 3,809
Securities Trading 66,300 70,978 64,874 59,071 66,152 Available-for-sale 51,899 50,886 52,644 50,257 42,559 Other 1,151 1,534 1,552 1,485 1,436
119,350 123,398 119,070 110,813 110,147
Securities Borrowed or Purchased Under Resale Agreements 24,317 25,053 34,498 36,006 45,250
Loans
Residential mortgages 47,097 46,671 46,535 45,524 48,760 Consumer instalment and other personal 49,741 47,774 46,813 45,824 44,466 Credit cards 3,304 3,318 3,324 2,574 2,383 Businesses and governments 68,407 66,894 67,690 68,169 70,705
168,549 164,657 164,362 162,091 166,314 Customers’ liability under acceptances 6,885 6,981 7,169 7,640 9,042 Allowance for credit losses (Note 2) (1,879) (1,885) (1,943) (1,902) (1,803)
173,555 169,753 169,588 167,829 173,553
Other Assets Derivative instruments 47,947 41,469 45,702 47,898 59,580 Premises and equipment 1,565 1,552 1,628 1,634 1,642 Goodwill 1,627 1,609 1,584 1,569 1,551 Intangible assets 748 749 712 660 647 Other 10,073 10,219 9,937 8,754 8,419
61,960 55,598 59,563 60,515 71,839
Total Assets $ 397,386 $ 390,166 $ 398,623 $ 388,458 $ 415,356
Liabilities and Shareholders’ Equity Deposits Banks $ 19,262 $ 24,399 $ 22,318 $ 22,973 $ 23,211 Businesses and governments 123,882 115,251 119,568 113,738 122,269 Individuals 99,647 99,610 98,413 99,445 99,473
242,791 239,260 240,299 236,156 244,953
Other Liabilities Derivative instruments 45,110 39,523 42,867 44,765 58,570 Acceptances 6,885 6,981 7,169 7,640 9,042 Securities sold but not yet purchased 18,424 16,475 15,953 12,064 12,717 Securities lent or sold under repurchase agreements 42,237 46,323 50,226 46,312 48,816 Other 16,175 16,257 16,592 15,938 16,144
128,831 125,559 132,807 126,719 145,289
Subordinated Debt (Note 9) 3,747 3,682 3,742 4,236 4,249
Capital Trust Securities (Note 10) 800 1,150 1,150 1,150 1,150
Shareholders’ Equity Share capital (Note 11) 9,311 9,161 8,939 8,769 8,626 Contributed surplus 90 88 89 79 78 Retained earnings 12,539 12,299 11,981 11,748 11,525 Accumulated other comprehensive loss (723) (1,033) (384) (399) (514)
21,217 20,515 20,625 20,197 19,715
Total Liabilities and Shareholders’ Equity $ 397,386 $ 390,166 $ 398,623 $ 388,458 $ 415,356
The accompanying notes are an integral part of these interim consolidated financial statements. Certain comparative figures have been reclassified to conform with the current period’s presentation.
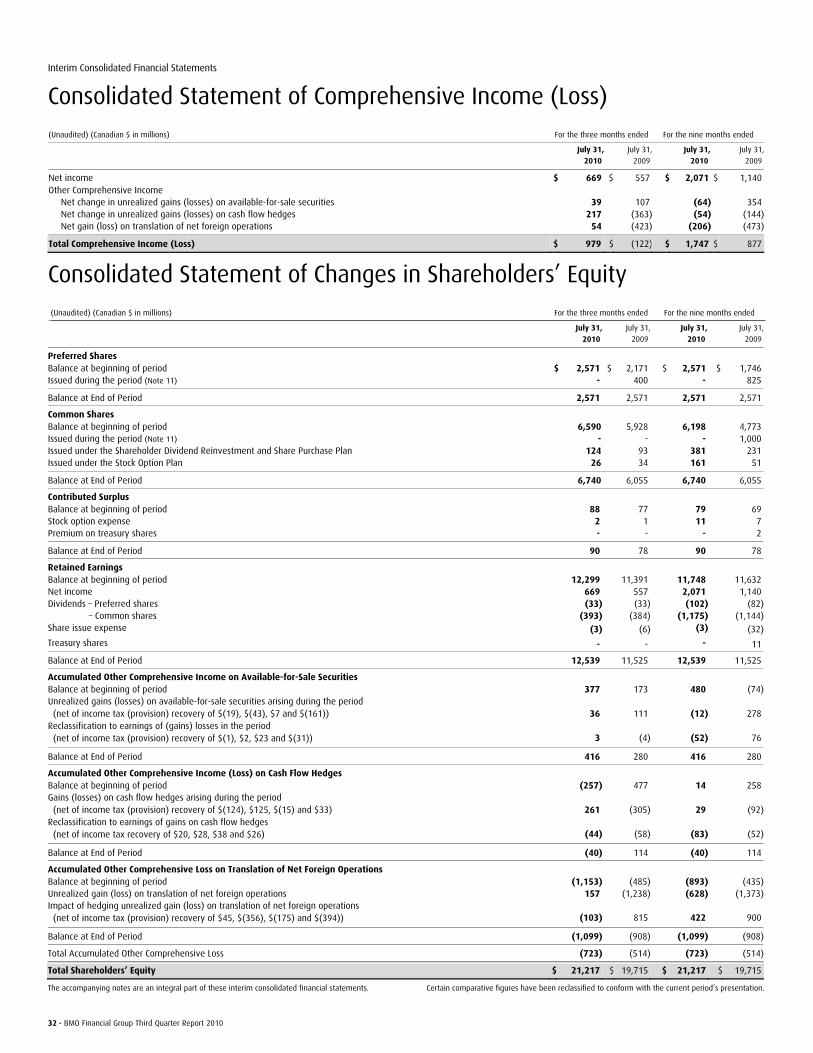
32 • BMO Financial Group Third Quarter Report 2010
Interim Consolidated Financial Statements
Consolidated Statement of Comprehensive Income (Loss)
(Unaudited) (Canadian $ in millions) For the three months ended For the nine months ended
July 31, 2010
July 31,
2009
July 31, 2010
July 31,
2009
Net income $ 669 $ 557 $ 2,071 $ 1,140 Other Comprehensive Income Net change in unrealized gains (losses) on available-for-sale securities 39 107 (64) 354 Net change in unrealized gains (losses) on cash flow hedges 217 (363) (54) (144) Net gain (loss) on translation of net foreign operations 54 (423) (206) (473)
Total Comprehensive Income (Loss) $ 979 $ (122) $ 1,747 $ 877
Consolidated Statement of Changes in Shareholders’ Equity
(Unaudited) (Canadian $ in millions) For the three months ended For the nine months ended
July 31,2010
July 31,
2009
July 31, 2010
July 31,
2009
Preferred Shares Balance at beginning of period $ 2,571 $ 2,171 $ 2,571 $ 1,746 Issued during the period (Note 11) - 400 - 825
Balance at End of Period 2,571 2,571 2,571 2,571
Common Shares Balance at beginning of period 6,590 5,928 6,198 4,773 Issued during the period (Note 11) - - - 1,000 Issued under the Shareholder Dividend Reinvestment and Share Purchase Plan 124 93 381 231 Issued under the Stock Option Plan 26 34 161 51
Balance at End of Period 6,740 6,055 6,740 6,055
Contributed Surplus Balance at beginning of period 88 77 79 69 Stock option expense 2 1 11 7 Premium on treasury shares - - - 2
Balance at End of Period 90 78 90 78
Retained Earnings Balance at beginning of period 12,299 11,391 11,748 11,632 Net income 669 557 2,071 1,140 Dividends – Preferred shares (33) (33) (102) (82) – Common shares (393) (384) (1,175) (1,144)Share issue expense (3) (6) (3) (32)
Treasury shares - - - 11
Balance at End of Period 12,539 11,525 12,539 11,525
Accumulated Other Comprehensive Income on Available-for-Sale Securities Balance at beginning of period 377 173 480 (74)Unrealized gains (losses) on available-for-sale securities arising during the period (net of income tax (provision) recovery of $(19), $(43), $7 and $(161)) 36 111 (12) 278 Reclassification to earnings of (gains) losses in the period (net of income tax (provision) recovery of $(1), $2, $23 and $(31)) 3 (4) (52) 76
Balance at End of Period 416 280 416 280
Accumulated Other Comprehensive Income (Loss) on Cash Flow Hedges Balance at beginning of period (257) 477 14 258 Gains (losses) on cash flow hedges arising during the period (net of income tax (provision) recovery of $(124), $125, $(15) and $33) 261 (305) 29 (92)Reclassification to earnings of gains on cash flow hedges (net of income tax recovery of $20, $28, $38 and $26) (44) (58) (83) (52)
Balance at End of Period (40) 114 (40) 114
Accumulated Other Comprehensive Loss on Translation of Net Foreign Operations Balance at beginning of period (1,153) (485) (893) (435)Unrealized gain (loss) on translation of net foreign operations 157 (1,238) (628) (1,373)Impact of hedging unrealized gain (loss) on translation of net foreign operations (net of income tax (provision) recovery of $45, $(356), $(175) and $(394)) (103) 815 422 900
Balance at End of Period (1,099) (908) (1,099) (908)
Total Accumulated Other Comprehensive Loss (723) (514) (723) (514)
Total Shareholders’ Equity $ 21,217 $ 19,715 $ 21,217 $ 19,715
The accompanying notes are an integral part of these interim consolidated financial statements. Certain comparative figures have been reclassified to conform with the current period’s presentation.
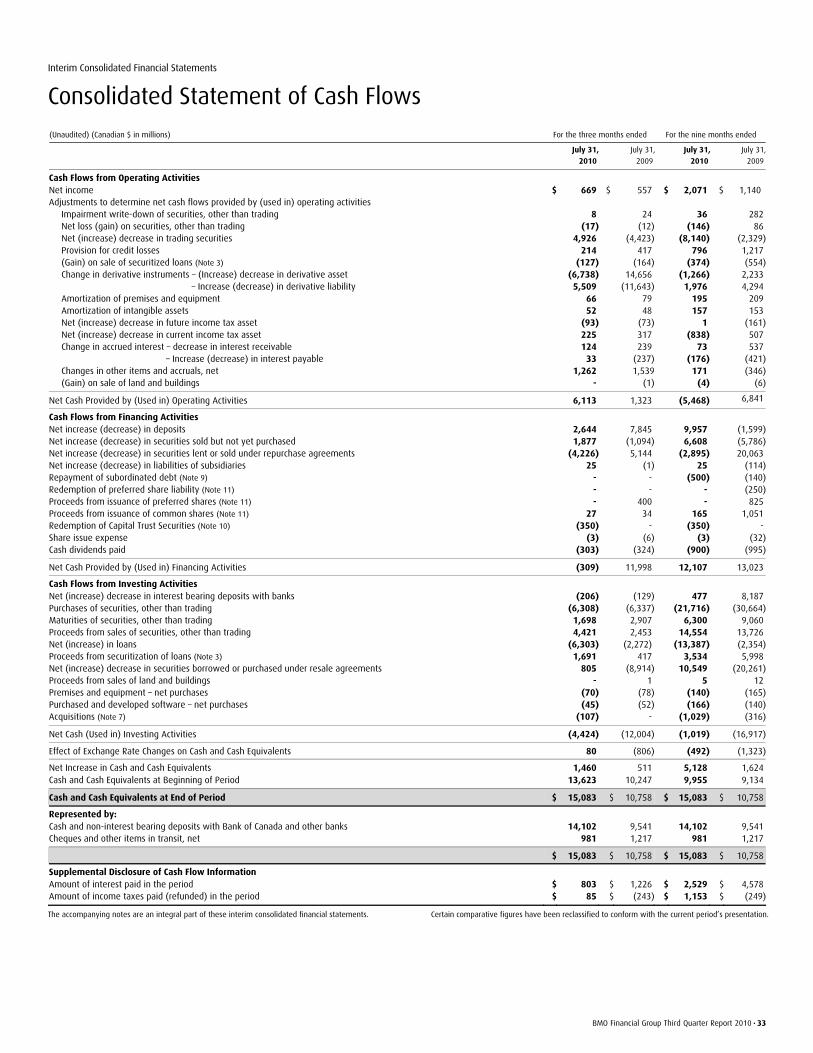
BMO Financial Group Third Quarter Report 2010 • 33
Interim Consolidated Financial Statements
Consolidated Statement of Cash Flows
(Unaudited) (Canadian $ in millions) For the three months ended For the nine months ended
July 31, 2010
July 31,
2009
July 31, 2010
July 31,
2009
Cash Flows from Operating Activities Net income $ 669 $ 557 $ 2,071 $ 1,140 Adjustments to determine net cash flows provided by (used in) operating activities Impairment write-down of securities, other than trading 8 24 36 282 Net loss (gain) on securities, other than trading (17) (12) (146) 86 Net (increase) decrease in trading securities 4,926 (4,423) (8,140) (2,329) Provision for credit losses 214 417 796 1,217 (Gain) on sale of securitized loans (Note 3) (127) (164) (374) (554) Change in derivative instruments – (Increase) decrease in derivative asset (6,738) 14,656 (1,266) 2,233 – Increase (decrease) in derivative liability 5,509 (11,643) 1,976 4,294 Amortization of premises and equipment 66 79 195 209 Amortization of intangible assets 52 48 157 153 Net (increase) decrease in future income tax asset (93) (73) 1 (161) Net (increase) decrease in current income tax asset 225 317 (838) 507 Change in accrued interest – decrease in interest receivable 124 239 73 537 – Increase (decrease) in interest payable 33 (237) (176) (421) Changes in other items and accruals, net 1,262 1,539 171 (346) (Gain) on sale of land and buildings - (1) (4) (6)
Net Cash Provided by (Used in) Operating Activities 6,113 1,323 (5,468) 6,841
Cash Flows from Financing Activities Net increase (decrease) in deposits 2,644 7,845 9,957 (1,599)Net increase (decrease) in securities sold but not yet purchased 1,877 (1,094) 6,608 (5,786)Net increase (decrease) in securities lent or sold under repurchase agreements (4,226) 5,144 (2,895) 20,063 Net increase (decrease) in liabilities of subsidiaries 25 (1) 25 (114)Repayment of subordinated debt (Note 9) - - (500) (140)Redemption of preferred share liability (Note 11) - - - (250)Proceeds from issuance of preferred shares (Note 11) - 400 - 825 Proceeds from issuance of common shares (Note 11) 27 34 165 1,051 Redemption of Capital Trust Securities (Note 10) (350) - (350) - Share issue expense (3) (6) (3) (32)Cash dividends paid (303) (324) (900) (995)
Net Cash Provided by (Used in) Financing Activities (309) 11,998 12,107 13,023
Cash Flows from Investing Activities Net (increase) decrease in interest bearing deposits with banks (206) (129) 477 8,187 Purchases of securities, other than trading (6,308) (6,337) (21,716) (30,664)Maturities of securities, other than trading 1,698 2,907 6,300 9,060 Proceeds from sales of securities, other than trading 4,421 2,453 14,554 13,726 Net (increase) in loans (6,303) (2,272) (13,387) (2,354)Proceeds from securitization of loans (Note 3) 1,691 417 3,534 5,998 Net (increase) decrease in securities borrowed or purchased under resale agreements 805 (8,914) 10,549 (20,261)Proceeds from sales of land and buildings - 1 5 12 Premises and equipment – net purchases (70) (78) (140) (165)Purchased and developed software – net purchases (45) (52) (166) (140)Acquisitions (Note 7) (107) - (1,029) (316)
Net Cash (Used in) Investing Activities (4,424) (12,004) (1,019) (16,917)
Effect of Exchange Rate Changes on Cash and Cash Equivalents 80 (806) (492) (1,323)
Net Increase in Cash and Cash Equivalents 1,460 511 5,128 1,624 Cash and Cash Equivalents at Beginning of Period 13,623 10,247 9,955 9,134
Cash and Cash Equivalents at End of Period $ 15,083 $ 10,758 $ 15,083 $ 10,758
Represented by: Cash and non-interest bearing deposits with Bank of Canada and other banks 14,102 9,541 14,102 9,541 Cheques and other items in transit, net 981 1,217 981 1,217
$ 15,083 $ 10,758 $ 15,083 $ 10,758
Supplemental Disclosure of Cash Flow Information Amount of interest paid in the period $ 803 $ 1,226 $ 2,529 $ 4,578 Amount of income taxes paid (refunded) in the period $ 85 $ (243) $ 1,153 $ (249)
The accompanying notes are an integral part of these interim consolidated financial statements. Certain comparative figures have been reclassified to conform with the current period’s presentation.

34 • BMO Financial Group Third Quarter Report 2010
Notes to Consolidated Financial Statements July 31, 2010 (Unaudited)
Note 1: Basis of Presentation These interim consolidated financial statements should be read in conjunction with the notes to our annual consolidated financial statements for the year ended October 31, 2009 as set out on pages 114 to 164 of our 2009 Annual Report. These interim consolidated financial statements have been prepared in accordance with Canadian generally accepted accounting
principles (“GAAP”) using the same accounting policies and methods of computation as were used for our annual consolidated financial statements for the year ended October 31, 2009 and include all normal recurring adjustments which, in the opinion of management, are necessary for a fair presentation of the results for the periods presented.
Note 2: Allowance for Credit Losses The allowance for credit losses recorded in our Consolidated Balance Sheet is maintained at a level which we consider adequate to absorb credit-related losses on our loans, customers’ liability under acceptances and other credit instruments. The portion related to other credit instruments is
recorded in other liabilities in our Consolidated Balance Sheet. As at July 31, 2010 and July 31, 2009, there was no allowance for credit losses related to other credit instruments included in other liabilities.
A continuity of our allowance for credit losses is as follows:
(Canadian $ in millions)
Residential mortgages
Credit card, consumer instalment and other
personal loans (1)
Business and
government loans (1)
Customers’ liability
under acceptances Total
For the three months ended
July 31, 2010
July 31,
2009
July 31, 2010
July 31,
2009
July 31, 2010
July 31,
2009
July 31, 2010
July 31,
2009
July 31, 2010
July 31,
2009
Specific Allowance at beginning of period 39 21 54 43 491 447 10 - 594 511 Provision for credit losses 2 8 144 163 68 181 - 5 214 357 Recoveries - - 33 27 12 8 - - 45 35 Write-offs (3) - (184) (188) (93) (187) - - (280) (375)Foreign exchange and other - - - - 4 (28) - - 4 (28)
Specific Allowance at end of period 38 29 47 45 482 421 10 5 577 500
General Allowance at beginning of period 20 21 314 236 912 1,009 45 48 1,291 1,314 Provision for credit losses 2 (2) 24 11 (21) 45 (5) 6 - 60 Foreign exchange and other - - - - 11 (71) - - 11 (71)
General Allowance at end of period 22 19 338 247 902 983 40 54 1,302 1,303
Total Allowance 60 48 385 292 1,384 1,404 50 59 1,879 1,803
Residential mortgages
Credit card, consumer instalment and other
personal loans (1)
Business and
government loans (1)
Customers’ liability
under acceptances Total
For the nine months ended
July 31, 2010
July 31,
2009
July 31, 2010
July 31,
2009
July 31, 2010
July 31,
2009
July 31, 2010
July 31,
2009
July 31, 2010
July 31,
2009
Specific Allowance at beginning of period 33 13 51 2 507 411 5 - 596 426 Provision for credit losses 12 17 473 461 306 674 5 5 796 1,157 Recoveries - - 96 77 35 26 - - 131 103 Write-offs (7) (1) (573) (495) (344) (661) - - (924) (1,157)Foreign exchange and other - - - - (22) (29) - - (22) (29)
Specific Allowance at end of period 38 29 47 45 482 421 10 5 577 500
General Allowance at beginning of period 18 8 266 242 968 1,030 54 41 1,306 1,321 Provision for credit losses 4 11 48 5 (38) 31 (14) 13 - 60 Foreign exchange and other - - 24 - (28) (78) - - (4) (78)
General Allowance at end of period 22 19 338 247 902 983 40 54 1,302 1,303
Total Allowance 60 48 385 292 1,384 1,404 50 59 1,879 1,803
(1) Included in the credit cards, consumer instalment and other personal loans and the business and government loans categories as at July 31, 2010 are $23 million and $9 million, respectively, related to the acquisition of the net cardholder receivables of the Diners Club North American franchise (see Note 7).
Certain comparative figures have been reclassified to conform with the current period’s presentation.

BMO Financial Group Third Quarter Report 2010 • 35
Note 3: Securitization The following tables summarize our securitization activity related to our assets and its impact on our Consolidated Statement of Income for the three and nine months ended July 31, 2010 and 2009:
(Canadian $ in millions)
Residential mortgages Credit card loans Total
For the three months ended
July 31, 2010
July 31,
2009
July 31, 2010
July 31,
2009
July 31, 2010
July 31,
2009
Net cash proceeds (1) 1,677 417 - - 1,677 417
Deferred purchase price 51 14 - - 51 14 Servicing liability (11) (1) - - (11) (1)
1,717 430 - - 1,717 430 Loans sold 1,697 415 - - 1,697 415
Gain on sale of loans from new securitizations 20 15 - - 20 15
Gain on sale of loans sold to revolving securitization vehicles 14 33 93 116 107 149
Residential mortgages Credit card loans Total
For the nine months ended
July 31, 2010
July 31,
2009
July 31, 2010
July 31,
2009
July 31, 2010
July 31,
2009
Net cash proceeds (1) 3,500 5,966 - - 3,500 5,966
Deferred purchase price 135 161 - - 135 161 Servicing liability (25) (25) - - (25) (25)
3,610 6,102 - - 3,610 6,102 Loans sold 3,554 6,025 - - 3,554 6,025
Gain on sale of loans from new securitizations 56 77 - - 56 77
Gain on sale of loans sold to revolving securitization vehicles 44 124 274 353 318 477
(1) Net cash proceeds represent cash proceeds less issuance costs.
The key weighted-average assumptions used to value the deferred purchase price for securitizations were as follows:
Residential mortgages Credit card loans (1)
For the three months ended
July 31, 2010
July 31,
2009
July 31, 2010
July 31,
2009
Weighted-average life (years) 4.16 3.48 1.00 0.99 Prepayment rate (%) 18.70 14.60 35.58 35.63 Interest rate (%) 3.85 4.60 21.39 21.85 Expected credit losses (%) (2) - - 4.40 4.44 Discount rate (%) 2.42 6.35 9.49 9.22
Residential mortgages Credit card loans (1)
For the nine months ended
July 31, 2010
July 31,
2009
July 31, 2010
July 31,
2009
Weighted-average life (years) 4.47 3.41 1.00 1.00 Prepayment rate (%) 17.21 21.45 35.42 36.32 Interest rate (%) 4.01 4.44 21.35 21.64 Expected credit losses (%) (2) - - 4.40 4.44 Discount rate (%) 2.61 4.15 9.27 9.94
(1) There were no credit card securitization transactions in the three and nine months ended July 31, 2010 and 2009.
(2) As the residential mortgages are fully insured, there are no expected credit losses.
Certain comparative figures have been reclassified to conform with the current period’s presentation.

36 • BMO Financial Group Third Quarter Report 2010
Note 4: Variable Interest Entities Total assets in our Variable Interest Entities (“VIEs”) and our exposure to losses are summarized in the following table. For
additional information on our VIEs, refer to Note 9 on pages 127 to 129 of our 2009 Annual Report.
(Canadian $ in millions) July 31, 2010 October 31, 2009
Exposure to loss Total
assets Exposure to loss
Total
assets
Undrawn facilities (1)
Drawn facilities
and loans provided (2)
Securities held
Derivative assets Total
Undrawn
facilities (1)
Drawn
facilities
and loans
provided (2)
Securities
held
Derivative
assets Total
Unconsolidated VIEs in which we have a significant variable interest Canadian customer securitization vehicles (3) 3,848 - 186 21 4,055 3,983 5,819 - 328 44 6,191 5,674 U.S. customer securitization vehicle 4,143 301 - 7 4,451 4,227 6,214 158 - 2 6,374 4,943 Bank securitization vehicles (3) 5,100 - 584 86 5,770 9,469 5,100 - 625 94 5,819 9,719 Credit protection vehicle – Apex (4)(5) 1,030 - 1,020 786 2,836 2,204 918 112 833 1,236 3,099 2,322 Structured investment vehicles (6) 194 5,631 - 22 5,847 5,607 247 7,230 - 12 7,489 6,968 Structured finance vehicles n/a n/a 3,048 - 3,048 4,002 n/a n/a 1,762 - 1,762 2,451 Capital and funding trusts 43 12 2 - 57 1,265 43 12 2 - 57 1,270
Total 14,358 5,944 4,840 922 26,064 30,757 18,341 7,512 3,550 1,388 30,791 33,347
Consolidated VIEs Canadian customer securitization vehicles (3)(7) 334 - 328 - 662 328 733 - 719 - 1,452 719 Structured finance vehicles n/a n/a 34 - 34 34 n/a n/a 54 - 54 54 Capital and funding trusts 6,009 4,991 740 56 11,796 7,625 9,013 1,987 880 45 11,925 5,190
Total 6,343 4,991 1,102 56 12,492 7,987 9,746 1,987 1,653 45 13,431 5,963
(1) These facilities include senior funding facilities provided to our credit protection vehicle and
structured investment vehicles as well as backstop liquidity facilities provided to our Canadian
customer securitization vehicles and our U.S. customer securitization vehicle. None of the
backstop liquidity facilities to our Canadian customer securitization vehicles related to credit
support as at July 31, 2010 and October 31, 2009. Backstop liquidity facilities to our U.S.
customer securitization vehicle include credit support and are discussed below.
(2) Amounts outstanding from backstop liquidity facilities and senior funding facilities are
classified as Loans - Businesses and governments.
(3) Securities held in our bank securitization vehicles are comprised of $40 million of commercial
paper classified as trading securities ($55 million in 2009), and $272 million of deferred
purchase price ($293 million in 2009) and $272 million of asset-backed securities ($277 million
in 2009) classified as available-for-sale securities. Securities held in our Canadian customer
securitization vehicles are comprised of commercial paper and are classified as trading
securities. Assets held by all these vehicles relate to assets in Canada.
(4) Derivatives held with this vehicle are classified as trading instruments. Changes in the fair value
of these derivatives are offset by derivatives held with third-party counterparties which are also
classified as trading instruments.
(5) Securities held are classified as trading securities and have a face value of $1,415 million. Our
exposure to these securities has been hedged through derivatives.
(6) Securities held are comprised of capital notes, classified as available-for-sale securities. These
notes were written down to $nil over the years ending October 31, 2007 and 2008.
(7) Total assets held as at July 31, 2010 are comprised of a loan of $227 million ($560 million as
at October 31, 2009) and $101 million of other assets ($159 million in 2009).
n/a - not applicable
U.S. Customer Securitization Vehicle
Our exposure to our U.S. customer securitization vehicle is summarized in the preceding table. Included in our exposure are backstop liquidity facilities that we provide. We use our credit adjudication process in deciding whether to extend the
backstop liquidity facility just as we do when extending credit in the form of a loan. US$304 million was advanced during the nine months ended July 31, 2010 in accordance with the terms of these liquidity facilities, of which US$213 million ($219 million) remains outstanding. This amount is included in the preceding table.

BMO Financial Group Third Quarter Report 2010 • 37
Note 5: Financial Instruments Change in Accounting Policy
On August 1, 2008, we elected to transfer from trading to available-for-sale those securities for which we had a change in
intent to hold the securities for the foreseeable future rather than to exit or trade them in the short term due to market circumstances at that time.
A continuity of the transferred securities is as follows:
(Canadian $ in millions)
For the three months ended July 31, 2010 April 30, 2010 January 31, 2010 October 31, 2009 July 31, 2009
Fair value of securities at beginning of period 791 1,038 1,378 1,493 1,732 Net (sales/maturities) purchases (183) (227) (343) (162) (175)Fair value change recorded in Other Comprehensive Income (5) 24 38 46 62 Other than temporary impairment recorded in income - (8) (9) (18) (23) Impact of foreign exchange 3 (36) (26) 19 (103)
Fair value of securities at end of period 606 791 1,038 1,378 1,493
For the nine months ended July 31, 2010 July 31, 2009
Fair value of securities at beginning of period 1,378 1,955 Net (sales/maturities) purchases (753) (451)Fair value change recorded in Other Comprehensive Income 57 186 Other than temporary impairment recorded in income (17) (81)Impact of foreign exchange (59) (116)
Fair value of securities at end of period 606 1,493
Book Value and Fair Value of Financial Instruments
Set out in the following table are the amounts that would be reported if all of our financial instruments assets and liabilities were reported at their fair values. Refer to the notes to our annual consolidated financial statements on pages 116 and 157 to 158 in our 2009 Annual Report for further discussion on the determination of fair value. (Canadian $ in millions)
July 31,
2010 October 31,
2009
Book value
Fair
value
Fair value over (under)
book value
Book value
Fair
value
Fair value over (under)
book value
Assets Cash and cash equivalents 15,083 15,083 - 9,955 9,955 - Interest bearing deposits with banks 3,121 3,121 - 3,340 3,340 - Securities 119,350 119,350 - 110,813 110,813 - Securities borrowed or purchased under resale agreements 24,317 24,317 - 36,006 36,006 - Loans Residential mortgages 47,097 47,577 480 45,524 46,067 543 Consumer instalment and other personal 49,741 49,766 25 45,824 45,913 89 Credit cards 3,304 3,304 - 2,574 2,574 - Business and governments 68,407 68,125 (282) 68,169 67,895 (274) 168,549 168,772 223 162,091 162,449 358 Customers’ liability under acceptances 6,885 6,897 12 7,640 7,642 2 Allowance for credit losses (1,879) (1,879) - (1,902) (1,902) - Total loans and customers’ liability under acceptances, net of allowance for credit losses 173,555
173,790
235
167,829 168,189
360
Derivative instruments 47,947 47,947 - 47,898 47,898 - Premises and equipment 1,565 1,565 - 1,634 1,634 - Goodwill 1,627 1,627 - 1,569 1,569 - Intangible assets 748 748 - 660 660 - Other assets 10,073 10,073 - 8,754 8,754 -
397,386 397,621 235 388,458 388,818 360
Liabilities Deposits 242,791 243,284 493 236,156 237,046 890 Derivative instruments 45,110 45,110 - 44,765 44,765 - Acceptances 6,885 6,885 - 7,640 7,640 - Securities sold but not yet purchased 18,424 18,424 - 12,064 12,064 - Securities lent or sold under repurchase agreements 42,237 42,237 - 46,312 46,312 - Other liabilities 16,175 16,236 61 15,938 15,976 38 Subordinated debt 3,747 4,072 325 4,236 4,591 355 Capital trust securities 800 830 30 1,150 1,218 68 Shareholders’ equity 21,217 21,217 - 20,197 20,197 -
397,386 398,295 909 388,458 389,809 1,351
Total fair value adjustment (674) (991)
Certain comparative figures have been reclassified to conform with the current period’s presentation.

38 • BMO Financial Group Third Quarter Report 2010
Fair Value Measurement
We use a fair value hierarchy to categorize the inputs we use in valuation techniques to measure fair value. Our use of quoted market prices (Level 1), internal models using observable
market information as inputs (Level 2) and internal models without observable market information as inputs (Level 3) in the valuation of securities, fair value liabilities, derivative assets and derivative liabilities was as follows:
(Canadian $ in millions) July 31, 2010 October 31, 2009
Valued using quoted market prices
Valued using models (with
observable inputs)
Valued using
models (without observable inputs)
Valued using quoted market prices
Valued using models (with
observable inputs)
Valued using
models (without observable inputs)
Trading Securities
Issued or guaranteed by:
Canadian federal government 13,933 - - 16,607 - - Canadian provincial and municipal governments 3,795 - - 2,882 - - U.S. federal government 6,333 - - 3,021 - - U.S. states, municipalities and agencies 864 154 32 54 653 49 Other governments 2,119 - - 1,712 - - Mortgage-backed securities and collateralized mortgage obligations 875 - 205 584 238 204 Corporate debt 9,477 2,287 330 8,368 2,293 421 Corporate equity 25,896 - - 21,985 - - 63,292 2,441 567 55,213 3,184 674
Available-for-Sale Securities Issued or guaranteed by: Canadian federal government 14,336 - - 17,359 - - Canadian provincial and municipal governments 1,510 - - 1,688 - -
U.S. federal government 5,196 - - 1,111 - -
U.S. states, municipalities and agencies 2,310 2,207 47 4,584 1,418 86
Other governments 10,984 9 - 8,220 9 -
Mortgage-backed securities and collateralized mortgage obligations 717 9,052 23 826 9,530 39
Corporate debt 1,968 1,166 1,664 1,499 1,078 1,960
Corporate equity 191 178 341 303 236 311
37,212 12,612 2,075 35,590 12,271 2,396
Fair Value Liabilities
Securities sold but not yet purchased 18,424 - - 12,064 - -
Structured note liabilities - 3,836 - - 3,073 -
18,424 3,836 - 12,064 3,073 -
Derivative Assets Interest rate contracts 24 30,840 261 42 30,062 1
Foreign exchange contracts 62 10,559 - 61 9,323 -
Commodity contracts 2,004 369 - 1,160 2,330 -
Equity contracts 1,473 715 9 618 1,353 11
Credit default swaps - 1,473 158 - 2,370 567
3,563 43,956 428 1,881 45,438 579
Derivative Liabilities Interest rate contracts 43 30,293 39 61 28,781 73
Foreign exchange contracts 22 9,686 - 8 9,161 -
Commodity contracts 1,919 512 - 744 2,201 -
Equity contracts 48 1,266 66 - 1,480 97
Credit default swaps - 1,213 3 - 2,156 3
2,032 42,970 108 813 43,779 173
Certain comparative figures have been reclassified to conform with the current period’s presentation.
Sensitivity analysis for the most significant items valued using internal models without observable inputs is provided below. As at July 31, 2010, within trading securities, mortgage-backed securities and collateralized mortgage obligations were $205 million of commercial mortgage-backed securities designated as trading under the fair value option. We have determined the valuation of these securities based on expected discounted cash flows. The determination of the market yields used in the discounted cash flow model has the most significant impact on the valuation of the securities. The impact of assuming a 50 basis points increase or decrease in the market yield would result in a change in fair value of $(4) million and $5 million, respectively.
Within available-for-sale corporate debt securities is deferred purchase price of $653 million related to our off-balance sheet securitization activities. We have determined the valuation of the deferred purchase price (excess spread) based on expected future cash flows that are driven by prepayment rate and interest rate assumptions. The determination of the interest rate used in the discounted cash flow model has the most significant impact on the valuation of the deferred purchase price. The impact of assuming a 10 percent increase or decrease in the interest rate would result in a change in fair value of $92 million and $(92) million, respectively.

BMO Financial Group Third Quarter Report 2010 • 39
Within derivative assets and derivative liabilities as at July 31, 2010 was $419 million and $42 million, respectively, related to the mark-to-market of credit default swaps and total return swaps on structured products. We have determined the valuation of these derivatives based on estimates of current market spreads for similar structured products. The impact of assuming a 10 basis point increase or decrease in that spread would result in a change in fair value of $(4) million and $4 million, respectively.
Financial Instruments Designated as Held for Trading
A portion of our structured note liabilities have been designated as trading under the fair value option and are accounted for at fair value, which better aligns the accounting result with the way the portfolio is managed. The change in fair value of these structured notes was a decrease in non-interest revenue, trading revenues (losses) of $74 million for the quarter ended July 31, 2010 ($70 million for the nine months ended July 31, 2010). This includes an increase of $4 million for the quarter ended July 31, 2010 ($15 million for the nine months ended July 31, 2010) attributable to changes in our credit spread (an increase in non-interest revenue, trading revenues of $53 million and a charge of $158 million, respectively, for the twelve months ended October 31, 2009). We recognized offsetting amounts on derivatives and other financial instrument contracts that are held to hedge changes in the fair value of these structured notes. The change in fair value related to changes in our credit spread that has been recognized since they were designated as held for trading to July 31, 2010 was an unrealized loss of $28 million. Starting in 2009, we hedged the exposure to changes in our credit spreads. The fair value and amount due at contractual maturity of structured notes accounted for as held for trading as at July 31, 2010 were $3,836 million and $4,007 million, respectively ($3,073 million and $3,377 million, respectively, as at October 31, 2009).
We designate certain insurance investments as trading under the fair value option since the actuarial calculation of insurance liabilities is based on the fair value of the investments supporting them. Electing the fair value option for these investments better aligns the accounting result with the way the portfolio is managed. The fair value of these securities as at July 31, 2010 was $3,864 million ($3,167 million as at October 31, 2009). The impact of recording these as trading securities was an increase in non-interest revenue, insurance income of $46 million for the quarter ended July 31, 2010 ($174 million for the nine months ended July 31, 2010 and $415 million for the twelve months ended October 31, 2009). Significant Transfers
Transfers are made between the various fair value hierarchy levels due to changes in the availability of quoted market prices or observable market inputs due to changing market conditions. The following is a discussion of the significant transfers between Level 1, Level 2, and Level 3 balances for the nine months ended July 31, 2010. During the quarter ended January 31, 2010, a portion of the asset-backed commercial paper issued by the conduits known as Montreal Accord were transferred from Level 3 to Level 2 as we are now valuing based on broker quotes rather than internal models as there was improved liquidity in the notes due to increased broker/dealer trading of the securities. During the quarter ended July 31, 2010, a number of our mortgage-backed securities issued by various companies were transferred from Level 2 to Level 1 as the volume of quoted market prices has increased. Changes in Level 3 Fair Value Measurements
The tables on the following page present a reconciliation of all Level 3 financial instruments during the three and nine months ended July 31, 2010, including realized and unrealized gains (losses) included in earnings and other comprehensive income.

40 • BMO Financial Group Third Quarter Report 2010
(Canadian $ in millions) Change in Fair Value
For the three months ended July 31, 2010
Balance, April 30,
2010 Included in
earnings
Included in other
comprehensive income Purchases Sales Maturities (1)
Fair Value as at
July 31, 2010
Unrealized Gains
(losses) (2)
Trading Securities Issued or guaranteed by: U.S. states, municipalities and agencies 41 (8) - - (1) - 32 3 Mortgage-backed securities and collateralized
mortgage obligations 199 2 - 6 (1) (1) 205 - Corporate debt 263 6 - 62 - (1) 330 6
Total Trading Securities 503 - - 68 (2) (2) 567 9
Available-for-Sale Securities Issued or guaranteed by: U.S. states, municipalities and agencies 66 1 (11) - (9) - 47 - Mortgage-backed securities and collateralized
mortgage obligations 23 - - - - - 23 - Corporate debt 1,724 (68) (30) 86 (7) (41) 1,664 (68) Corporate equity 308 (1) 3 31 - - 341 -
Total Available-for-Sale Securities 2,121 (68) (38) 117 (16) (41) 2,075 (68)
Derivative Assets Interest rate contracts 233 28 - - - - 261 261 Equity contracts 6 3 - - - - 9 9 Credit default swaps 140 18 - - - - 158 158
Total Derivative Assets 379 49 - - - - 428 428
Derivative Liabilities Interest rate contracts 36 - - - - 3 39 (39) Equity contracts 145 (79) - - - - 66 (66) Credit default swaps 3 - - - - - 3 (3)
Total Derivative Liabilities 184 (79) - - - 3 108 (108)
(1) Includes cash settlement of derivative assets and derivative liabilities.
Certain comparative figures have been reclassified to conform with the current period’s presentation.
(2) Represents the unrealized gains or losses included in income arising in the three month period related to assets and liabilities still held at July 31, 2010.
(Canadian $ in millions) Change in Fair Value
For the nine months ended July, 31, 2010
Balance, October 31,
2009 Included in
earnings
Included in other
comprehensive income Purchases Sales Maturities (1)
Transfers into
Level 3
Transfers out of Level 3
Fair Value as at
July 31, 2010
Unrealized Gains
(losses) (2)
Trading Securities Issued or guaranteed by: U.S. states, municipalities and
agencies 49 (16) - - (1) - - - 32 6 Mortgage-backed securities and
collateralized mortgage obligations 204 24 - 8 (2) (29) - - 205 7
Corporate debt 421 (15) - 72 - (2) 14 (160) 330 1
Total Trading Securities 674 (7) - 80 (3) (31) 14 (160) 567 14
Available-for-Sale Securities Issued or guaranteed by: U.S. states, municipalities and
agencies 86 3 (23) - (19) - - - 47 - Mortgage-backed securities and
collateralized mortgage obligations 39 - - 1 - (17) - - 23 -
Corporate debt 1,960 (214) 7 205 (156) (138) - - 1,664 (227) Corporate equity 311 (4) (16) 46 (1) (1) 6 - 341 -
Total Available-for-Sale Securities 2,396 (215) (32) 252 (176) (156) 6 - 2,075 (227)
Derivative Assets Interest rate contracts 1 21 - - - 239 - - 261 261 Equity contracts 11 (33) - - - 31 - - 9 9 Credit default swaps 567 (52) - - - (357) - - 158 158 Total Derivative Assets 579 (64) - - - (87) - - 428 428
Derivative Liabilities Interest rate contracts 73 - - - - (34) - - 39 (39) Equity contracts 97 (63) - - - 32 - - 66 (66) Credit default swaps 3 - - - - - - - 3 (3)
Total Derivative Liabilities 173 (63) - - - (2) - - 108 (108)
(1) Includes cash settlement of derivative assets and derivative liabilities.
Certain comparative figures have been reclassified to conform with the current period’s presentation.
(2) Represents the unrealized gains or losses included in income arising in the nine month period related to assets and liabilities still held at July 31, 2010.

BMO Financial Group Third Quarter Report 2010 • 41
Other Items Measured at Fair Value
Certain assets such as foreclosed assets are measured at fair value at initial recognition but are not required to be measured at fair value on an ongoing basis.
As at July 31, 2010, the bank held $175 million of foreclosed assets measured at fair value at inception, all of which were classified as Level 2. For the nine months ended July 31, 2010, we recorded write-downs of $79 million on these assets.
Note 6: Guarantees
In the normal course of business we enter into a variety of guarantees. The most significant guarantees are as follows: Standby Letters of Credit and Guarantees
Standby letters of credit and guarantees represent our obligation to make payments to third parties on behalf of another party if that party is unable to make the required payments or meet other contractual requirements. The maximum amount payable under standby letters of credit and guarantees totalled $10,533 million as at July 31, 2010 ($11,384 million as at October 31, 2009). None of the standby letters of credit or guarantees had an investment rating as at July 31, 2010 or October 31, 2009.
Collateral requirements for standby letters of credit and guarantees are consistent with our collateral requirements for loans. A large majority of these commitments expire without being drawn upon. As a result, the total contractual amounts may not be representative of the funding likely to be required for these commitments. No amount was included in our Consolidated Balance Sheet as at July 31, 2010 and October 31, 2009 related to these standby letters of credit and guarantees. Backstop and Other Liquidity Facilities
Backstop liquidity facilities are provided to asset-backed commercial paper (“ABCP”) programs administered by either us or third parties as an alternative source of financing in the event that such programs are unable to access ABCP markets or when predetermined performance measures of the financial assets owned by these programs are not met. The terms of the backstop liquidity facilities do not require us to advance money to these programs in the event of bankruptcy of the borrower. The facilities’ terms are generally no longer than one year, but can be several years. The maximum amount payable under these backstop and other liquidity facilities totalled $15,191 million as at July 31, 2010 ($19,108 million as at October 31, 2009), of which $11,855 million relates to facilities that are investment grade, $860 million are non-investment grade and $2,476 million are not rated ($15,405 million, $649 million and $3,054 million, respectively, as at October 31, 2009). As at July 31, 2010, $350 million was outstanding from facilities drawn in accordance with the terms of the backstop liquidity facilities ($185 million as at October 31, 2009), of which $301 million (US$293 million) ($158 million or US$146 million as at October 31, 2009) related to the U.S. customer securitization vehicle discussed in Note 4. Credit Enhancement Facilities
Where warranted, we provide partial credit enhancement facilities to transactions within ABCP programs administered by either us or third parties. Credit enhancement facilities are included in backstop liquidity facilities. These facilities include amounts that relate to our U.S. customer securitization vehicle discussed in Note 4.
Senior Funding Facilities
We provide senior funding support to our structured investment vehicles (“SIVs”) and our credit protection vehicle. The majority of these facilities support the repayment of senior note obligations of the SIVs. As at July 31, 2010, $5,631 million was drawn ($7,342 million as at October 31, 2009), in accordance with the terms of the funding facilities related to the SIVs and credit protection vehicle discussed in Note 4. In addition to our investment in the notes subject to the Montreal Accord, we have provided a senior loan facility of $300 million. No amounts were drawn as at July 31, 2010 and October 31, 2009. Derivatives
Certain of our derivative instruments meet the accounting definition of a guarantee when we believe they are related to an asset, liability or equity security held by the guaranteed party at the inception of a contract. In order to reduce our exposure to these derivatives, we enter into contracts that hedge the related risks. Written credit default swaps require us to compensate a counterparty following the occurrence of a credit event in relation to a specified reference obligation, such as a bond or a loan. The maximum amount payable under credit default swaps is equal to their notional amount of $41,927 million as at July 31, 2010 ($51,072 million as at October 31, 2009), of which $38,656 million relates to swaps that are investment grade, $2,851 million are non-investment grade swaps and $420 million are not rated ($45,843 million, $5,034 million and $195 million, respectively, as at October 31, 2009). The terms of these contracts range from one day to 10 years. The fair value of the related derivative liabilities included in derivative instruments in our Consolidated Balance Sheet was $1,216 million as at July 31, 2010 ($2,159 million as at October 31, 2009). Written options include contractual agreements that convey to the purchaser the right, but not the obligation, to require us to buy a specific amount of a currency, commodity, debt or equity instrument at a fixed price, either at a fixed future date or at any time within a fixed future period. The maximum amount payable under these written options cannot be reasonably estimated due to the nature of these contracts. The terms of these contracts range from less than one month to 12 years. The fair value of the related derivative liabilities included in derivative instruments in our Consolidated Balance Sheet was $601 million as at July 31, 2010 ($667 million as at October 31, 2009), none of which are rated ($667 million were not rated as at October 31, 2009). Written options also include contractual agreements where we agree to pay the purchaser, based on a specified notional amount, the difference between a market price or rate and the strike price or rate of the underlying instrument. The maximum amount payable under these contracts is not determinable due to their nature. The terms of these contracts range from 11 months to 25 years. The fair value of the related derivative liabilities included in derivative instruments in our

42 • BMO Financial Group Third Quarter Report 2010
Consolidated Balance Sheet was $120 million as at July 31, 2010 ($118 million as at October 31, 2009) and none of the
instruments had an investment rating at either date.
Note 7: Acquisitions We account for acquisitions of businesses using the purchase method. This involves allocating the purchase price paid for a business to the assets acquired, including identifiable intangible assets and the liabilities assumed based on their fair values at the date of acquisition. Any excess is then recorded as goodwill. The results of operations of acquired businesses are included in our consolidated financial statements beginning on the date of acquisition. AMCORE Bank N.A. (“AMCORE”) On April 23, 2010, we completed the acquisition of certain assets and liabilities of AMCORE from the Federal Deposit Insurance Corporation (“FDIC”) for total consideration of $253 million, subject to a post-closing adjustment based on net assets. During the quarter ended July 31, 2010, we reduced the purchase price by $28 million to $225 million based on a revaluation of the net assets acquired. Under the terms of the acquisition, the FDIC absorbs 80% of the losses on the acquired loans. The acquisition accelerates our growth strategy and reinforces our already strong position in the U.S. Midwest by expanding our presence in Illinois and Wisconsin. As part of this acquisition, we acquired a core deposit intangible asset that is being amortized on an accelerated basis over a period not to exceed 10 years. Goodwill related to this acquisition is deductible for tax purposes. The acquired assets and liabilities are included in our Personal and Commercial Banking U.S. reporting segment. Diners Club
On December 31, 2009, we completed the acquisition of the net cardholder receivables of the Diners Club North American franchise from Citigroup for total cash consideration of $882 million, subject to a post-closing adjustment based on net assets. Based on a post-closing adjustment of $44 million, the final purchase price was reduced to $838 million during the quarter ended April 30, 2010. The acquisition of the net cardholder receivables of Diners Club gives us the right to issue Diners Club cards to corporate and professional clients in the United States and Canada and will accelerate our initiative to expand in the travel and entertainment card sector for commercial customers across North America. As part of this acquisition, we acquired a customer relationship intangible asset which is being amortized on an accelerated basis over 15 years and a computer software intangible asset that is being amortized on a straight-line basis over five years.
Goodwill related to this acquisition is deductible for tax purposes. Diners Club is part of our Personal and Commercial Banking Canada reporting segment. Paloma Securities L.L.C. (“Paloma”)
On December 23, 2009, we completed the acquisition of selected assets used in the securities lending business of Paloma for cash consideration of $7 million and hired their global securities lending team. The acquisition provides us with the opportunity to expand our securities lending operation. Goodwill related to this acquisition is deductible for tax purposes. This acquisition is part of our BMO Capital Markets reporting segment. Integra GRS (“Integra”)
On November 23, 2009, we completed the acquisition of the record keeping business of Integra, a wholly owned subsidiary of Integra Capital Management Corporation for cash consideration of $16 million, including a post-closing adjustment of $3 million reflecting additional consideration owing for other client contracts assigned to the bank since the closing date. The acquisition of Integra extends our existing wealth management offering. As part of this acquisition, we acquired a customer relationship intangible asset which is being amortized on a straight-line basis over five years and a computer software intangible asset that is being amortized on a straight-line basis over three years. Goodwill related to this acquisition is deductible for tax purposes. Integra is part of our Private Client Group reporting segment. AIG Life Insurance Company of Canada (“BMO Life Assurance”)
On April 1, 2009, we completed the acquisition of all outstanding voting shares of AIG Life Insurance Company of Canada for cash consideration of $330 million, subject to a post-closing adjustment based on net assets. The post-closing adjustment has now been finalized and the purchase price has been reduced to $278 million.

BMO Financial Group Third Quarter Report 2010 • 43
The estimated fair values of the assets acquired and the liabilities assumed at the date of acquisition are as follows:
(Canadian $ in millions)
AMCORE
Diners Club Paloma Integra
Cash resources (1) 420 - - - Securities 10 - - - Loans 1,551 873 - - Premises and equipment - - - - Goodwill 86 5 7 7 Intangible assets 24 63 - 9 Other assets 494 9 - -
Total assets 2,585 950 7 16
Deposits 2,207 - - -
Other liabilities 153 112 - -
Total liabilities 2,360 112 - -
Purchase price 225 838 7 16
The allocation of the purchase price for AMCORE, Diners Club, Paloma and Integra is subject to refinement as we complete the valuation of the assets acquired and liabilities assumed.
(1) Cash resources, acquired through the AMCORE acquisition include cash and cash equivalents and interest bearing deposits.
Note 8: Employee Compensation Stock Options
During the nine months ended July 31, 2010, we granted a total of 1,737,204 stock options. The weighted-average fair value of options granted during the nine months ended July 31, 2010 was
$9.97 per option. The following weighted-average assumptions were used to determine the fair value of options on the date of grant:
For stock options granted during the nine months ended July 31, 2010
Expected dividend yield 6.6% Expected share price volatility 27.5% Risk-free rate of return 2.9% Expected period until exercise (in years) 6.5
Changes to the input assumptions can result in different fair value estimates.
Pension and Other Employee Future Benefit Expenses
Pension and other employee future benefit expenses are determined as follows:
(Canadian $ in millions)
Pension benefit plans Other employee future benefit plans
For the three months ended
July 31, 2010
July 31,
2009
July 31, 2010
July 31,
2009
Benefits earned by employees 32 29 5 3 Interest cost on accrued benefit liability 63 64 15 12
Actuarial loss recognized in expense 18 18 - -
Amortization of plan amendment costs 4 4 (2) (1)
Expected return on plan assets (73) (60) (2) (1)
Benefits expense 44 55 16 13 Canada and Quebec pension plan expense 17 16 - -
Defined contribution expense 2 1 - -
Total pension and other employee future benefit expenses 63 72 16 13
Pension benefit plans Other employee future benefit plans
For the nine months ended
July 31, 2010
July 31,
2009
July 31, 2010
July 31,
2009
Benefits earned by employees 96 97 15 9 Interest cost on accrued benefit liability 191 195 43 38
Actuarial loss recognized in expense 55 56 2 -
Amortization of plan amendment costs 12 10 (5) (5)
Expected return on plan assets (218) (183) (4) (4)
Benefits expense 136 175 51 38 Canada and Quebec pension plan expense 49 49 - -
Defined contribution expense 7 5 - -
Total pension and other employee future benefit expenses 192 229 51 38

44 • BMO Financial Group Third Quarter Report 2010
Note 9: Subordinated Debt During the quarter ended January 31, 2010, we redeemed all of our 4.00% Series C Medium-Term Notes, First Tranche, due 2015, totalling $500 million. The notes were redeemed at a redemption price of 100 percent of the principal amount plus unpaid accrued interest to the redemption date.
During the quarter ended January 31, 2009, our $140 million 10.85% Debentures, Series 12 matured.
Note 10: Capital Trust SecuritiesDuring the quarter ended July 31, 2010, we redeemed all of our Capital Trust Securities – Series A (“BMO BOaTS”) at a redemption amount equal to $1,000 plus unpaid indicated
distributions, representing an aggregate redemption of $350 million.
Note 11: Share CapitalDuring the quarter ended July 31, 2010, we did not issue or redeem any preferred shares. During the quarter ended July 31, 2009, we issued 16,000,000 5.4% Non-Cumulative 5-year Rate Reset Class B Preferred shares, Series 23, at a price of $25.00 per share, representing an aggregate issue price of $400 million. During the quarter ended April 30, 2009, we issued 11,000,000 6.5% Non-Cumulative 5-year Rate Reset Class B Preferred shares, Series 21, at a price of $25.00 per share, representing an aggregate issue price of $275 million. During the quarter ended January 31, 2009, we issued 33,340,000 common shares at a price of $30.00 per share, representing an aggregate issue price of $1.0 billion. During the quarter ended January 31, 2009, we issued 6,000,000 6.5% Non-Cumulative 5-year Rate Reset Class B Preferred shares, Series 18, at a price of $25.00 per share, representing an aggregate issue price of $150 million. During the quarter ended January 31, 2009, we redeemed all of our 10,000,000 Non-Cumulative Class B Preferred shares, Series 6 that were classified as preferred share liabilities, at a price of $25.00 per share plus any declared and unpaid dividends to the date of redemption. This represents an aggregate redemption price of approximately $253 million.
On November 19, 2009, we renewed our normal course issuer bid allowing us to repurchase up to 15,000,000 of our common shares during the period from December 2, 2009 to December 1, 2010.
We did not repurchase any common shares under our normal course issuer bid.
Treasury Shares
When we purchase our common shares as part of our trading business, we record the cost of those shares as a reduction in shareholders’ equity. If those shares are resold at a value higher than their cost, the premium is recorded as an increase in contributed surplus. If those shares are resold at a value below their cost, the discount is recorded as a reduction first to contributed surplus and then to retained earnings for any amounts in excess of total contributed surplus related to treasury shares.
Share Capital Outstanding (a)
(a) For additional information refer to Notes 21 and 23 to our consolidated financial statements for the year ended October 31, 2009 on pages 144 to 148 of our 2009 Annual Report.
(b) The number of shares issuable on conversion is not determinable until the date of conversion. (c) Face value is US$300 million. n/a – not applicable
(Canadian $ in millions, except as noted) July 31, 2010
Number of shares Amount Convertible into...
Preferred Shares – Classified as Equity Class B – Series 5 8,000,000 200 – Class B – Series 10 (c) 12,000,000 396 common shares (b) Class B – Series 13 14,000,000 350 – Class B – Series 14 10,000,000 250 – Class B – Series 15 10,000,000 250 – Class B – Series 16 12,000,000 300 – Class B – Series 18 6,000,000 150 – Class B – Series 21 11,000,000 275 – Class B – Series 23 16,000,000 400 –
2,571 Common Shares 562,858,261 6,740
Share Capital 9,311
Stock options issued under stock option plan n/a 16,027,785 common shares

BMO Financial Group Third Quarter Report 2010 • 45
Note 12: Earnings Per Share The following tables present the bank’s basic and diluted earnings per share:
Basic earnings per share
(Canadian $ in millions, except as noted) For the three months ended For the nine months ended
July 31, 2010
July 31,
2009
July 31, 2010
July 31,
2009
Net income 669 557 2,071 1,140
Dividends on preferred shares (33) (33) (102) (82)
Net income available to common shareholders 636 524 1,969 1,058
Average number of common shares outstanding (in thousands) 561,839 547,134 558,047 536,855
Basic earnings per share (Canadian $) 1.13 0.97 3.53 1.97
Diluted earnings per share
(Canadian $ in millions, except as noted) For the three months ended For the nine months ended
July 31,2010
July 31,
2009
July 31, 2010
July 31,
2009
Net income available to common shareholders adjusted for dilution effect 636 524 1,970 1,059
Average number of common shares outstanding (in thousands) 561,839 547,138 558,047 536,864
Convertible shares 252 253 252 253
Stock options potentially exercisable (1) 11,073 12,488 11,060 6,360 Common shares potentially repurchased (7,968) (9,911) (7,905) (5,145)
Average diluted number of common shares outstanding (in thousands) 565,196 549,968 561,454 538,332
Diluted earnings per share (Canadian $) 1.13 0.97 3.51 1.97
(1) In computing diluted earnings per share we excluded average stock options outstanding of 1,207,385 and 2,484,804 with weighted-average exercise prices of $65.80 and $60.93, respectively, for the three and nine months ended July 31, 2010 (3,318,064 and 10,345,987 with weighted-average exercise prices of $59.86 and $44.50, respectively, for the three and nine months ended July 31, 2009) as the average share price for the period did not exceed the exercise price.
Note 13: Capital Management Our objective is to maintain a strong capital position in a cost-effective structure that: meets our target regulatory capital ratios and internal assessment of risk-based capital; is consistent with our targeted credit ratings; underpins our operating groups’ business strategies; and builds depositor confidence and long-term shareholder value.
We have met our capital targets as at July 31, 2010. Our capital position as at July 31, 2010 is detailed in the Capital Management section on page 15 of Management’s Discussion and Analysis of the Third Quarter Report to Shareholders.
Note 14: Risk Management We have an enterprise-wide approach to the identification, measurement, monitoring and management of risks faced across the organization. The key financial instrument risks are classified as credit and counterparty, market, liquidity and funding risk. Credit and Counterparty Risk
We are exposed to credit risk from the possibility that counterparties may default on their financial obligations to us. Credit risk arises predominantly with respect to loans, over-the-counter derivatives and other credit instruments. This is the most significant measurable risk that we face. Market Risk
Market risk is the potential for a negative impact on the balance sheet and/or statement of income resulting from adverse changes in the value of financial instruments as a result of changes in certain market variables. These variables include interest rates, foreign exchange rates, equity and commodity prices and their implied volatilities, as well as credit spreads, credit migration and
default. We incur market risk in our trading and underwriting activities and structural banking activities. Liquidity and Funding Risk
Liquidity and funding risk is the potential for loss if we are unable to meet financial commitments in a timely manner at reasonable prices as they fall due. It is our policy to ensure that sufficient liquid assets and funding capacity are available to meet financial commitments, including liabilities to depositors and suppliers, and lending, investment and pledging commitments, even in times of stress. Managing liquidity and funding risk is essential to maintaining both depositor confidence and stability in earnings. Key measures as at July 31, 2010 are outlined in the Risk Management section on pages 10 to 12 of Management’s Discussion and Analysis of the Third Quarter Report to Shareholders.
46 • BMO Financial Group Third Quarter Report 2010
Note 15: Operating and Geographic SegmentationOperating Groups
We conduct our business through operating groups, each of which has a distinct mandate. We determine our operating groups based on our management structure and therefore these groups, and results attributed to them, may not be comparable with those of other financial services companies. We evaluate the performance of our groups using measures such as net income, revenue growth, return on equity, net economic profit and non-interest expense-to-revenue (productivity) ratio, as well as cash operating leverage. Personal and Commercial Banking
Personal and Commercial Banking (“P&C”) is comprised of two operating segments: Personal and Commercial Banking Canada and Personal and Commercial Banking U.S. Personal and Commercial Banking Canada
Personal and Commercial Banking Canada (“P&C Canada”) offers a full range of consumer and business products and services, including: everyday banking, financing, investing and credit cards, as well as a full suite of commercial and capital market products and financial advisory services, through a network of branches, telephone banking, online banking, mortgage specialists and automated banking machines. Effective in the third quarter of 2009, the results of our term deposits business are included in P&C Canada rather than Private Client Group, where the business is now better aligned with P&C Canada’s retail product strategy. Prior periods have been restated to reflect this reclassification. Personal and Commercial Banking U.S.
Personal and Commercial Banking U.S. (“P&C U.S.”) offers a full range of products and services to personal and business clients in select U.S. Midwest markets through branches and direct banking channels such as telephone banking, online banking and a network of automated banking machines. Effective in the second quarter of 2010, we identified U.S. mid-market clients that would be better served by a commercial banking model and transferred the accounts to P&C U.S. from BMO Capital Markets. Prior periods have been restated to reflect this reclassification. Private Client Group
Private Client Group (“PCG”) brings together all of our wealth management businesses. Operating under the BMO brand in Canada and Harris in the United States, PCG serves a full range of client segments, from mainstream to ultra-high net worth, as well as select institutional market segments. We offer our clients a broad range of wealth management products and solutions, including full-service, online brokerage and insurance in Canada and private banking and investment products in Canada and the United States. Effective in the third quarter of 2009, all of our insurance operations are included within PCG, bringing our insurance capabilities and skill sets together as part of our wealth management offering. Prior periods have been restated to reflect this reclassification. BMO Capital Markets
BMO Capital Markets (“BMO CM”) combines all of our businesses serving corporate, institutional and government clients. In Canada and the United States, these clients span a
broad range of industry sectors. BMO CM also serves clients in the United Kingdom, Europe, Asia and Australia. It offers clients complete financial solutions, including equity and debt underwriting, corporate lending and project financing, mergers and acquisitions, advisory services, merchant banking, securitization, treasury and market risk management, debt and equity research and institutional sales and trading. Effective in the second quarter of 2010, we identified U.S. mid-market clients that would be better served by a commercial banking model and transferred the accounts to P&C U.S. from BMO CM. Prior periods have been restated to reflect this reclassification. Corporate Services
Corporate Services includes the corporate units that provide expertise and governance support in areas such as strategic planning, law, finance, internal audit, risk management, corporate communications, economics, corporate marketing, human resources and learning. Operating results include revenues and expenses associated with certain securitization activities, the hedging of foreign-source earnings, and activities related to the management of certain balance sheet positions and our overall asset liability structure. Technology and Operations (“T&O”) manages, maintains and provides governance over our information technology, operations services, real estate and sourcing. T&O focuses on enterprise-wide priorities that improve quality and efficiency to deliver an excellent customer experience. Operating results for T&O are included with Corporate Services for reporting purposes. However, costs of T&O services are transferred to the three operating groups. As such, results for Corporate Services largely reflect the activities outlined above. Corporate Services also includes residual revenues and expenses representing the differences between actual amounts earned or incurred and the amounts allocated to operating groups. Basis of Presentation
The results of these operating segments are based on our internal financial reporting systems. The accounting policies used in these segments are generally consistent with those followed in the preparation of our consolidated financial statements as disclosed in Note 1. Notable accounting measurement differences are the taxable equivalent basis adjustment and the provision for credit losses, as described below.
Taxable Equivalent Basis
We analyze net interest income on a taxable equivalent basis (“teb”) at the operating group level. This basis includes an adjustment which increases GAAP revenues and the GAAP provision for income taxes by an amount that would raise revenues on certain tax-exempt items to a level that incurs tax at the statutory rate. The operating groups’ teb adjustments are eliminated in Corporate Services. In the current quarter, we have now accounted for certain BMO CM transactions on a basis that reflects their teb. We believe these adjustments are useful and reflect how BMO CM manages its business, since it enhances the comparability of taxable revenues and tax-advantaged revenues. The change

BMO Financial Group Third Quarter Report 2010 • 47
results in increases in net interest income and income taxes in BMO CM with offsetting amounts reflected in Corporate Services. There was no overall net income change in either of the two groups. Prior periods have been restated to reflect this reclassification.
Provisions for Credit Losses
Provisions for credit losses are generally allocated to each group based on expected losses for that group. Differences between expected loss provisions and provisions required under GAAP are included in Corporate Services. Securitization Accounting
During the quarter ended January 31, 2010, we changed the manner in which we report securitized assets in our segmented disclosure. Previously, certain securitized mortgage assets were not reported in P&C Canada’s balance sheet. We now report all securitized mortgage assets in P&C Canada with offsetting amounts in Corporate and net interest income earned on all securitized mortgage assets are included in P&C Canada net interest income. Previously net interest income earned on certain securitized mortgage assets was included in P&C Canada non-interest revenue. Periods prior to January 31, 2010 have been restated to conform to this new presentation.
Inter-Group Allocations
Various estimates and allocation methodologies are used in the preparation of the operating groups’ financial information. We allocate expenses directly related to earning revenue to the groups that earned the related revenue. Expenses not directly related to earning revenue, such as overhead expenses, are allocated to operating groups using allocation formulas applied on a consistent basis. Operating group net interest income reflects internal funding charges and credits on the groups’ assets, liabilities and capital, at market rates, taking into account relevant terms and currency considerations. The offset of the net impact of these charges and credits is reflected in Corporate Services. Geographic Information
We operate primarily in Canada and the United States but we also have operations in the United Kingdom, Europe, the Caribbean and Asia, which are grouped in Other countries. We allocated our results by geographic region based on the location of the unit responsible for managing the related assets, liabilities, revenues and expenses, except for the consolidated provision for credit losses, which is allocated based upon the country of ultimate risk.
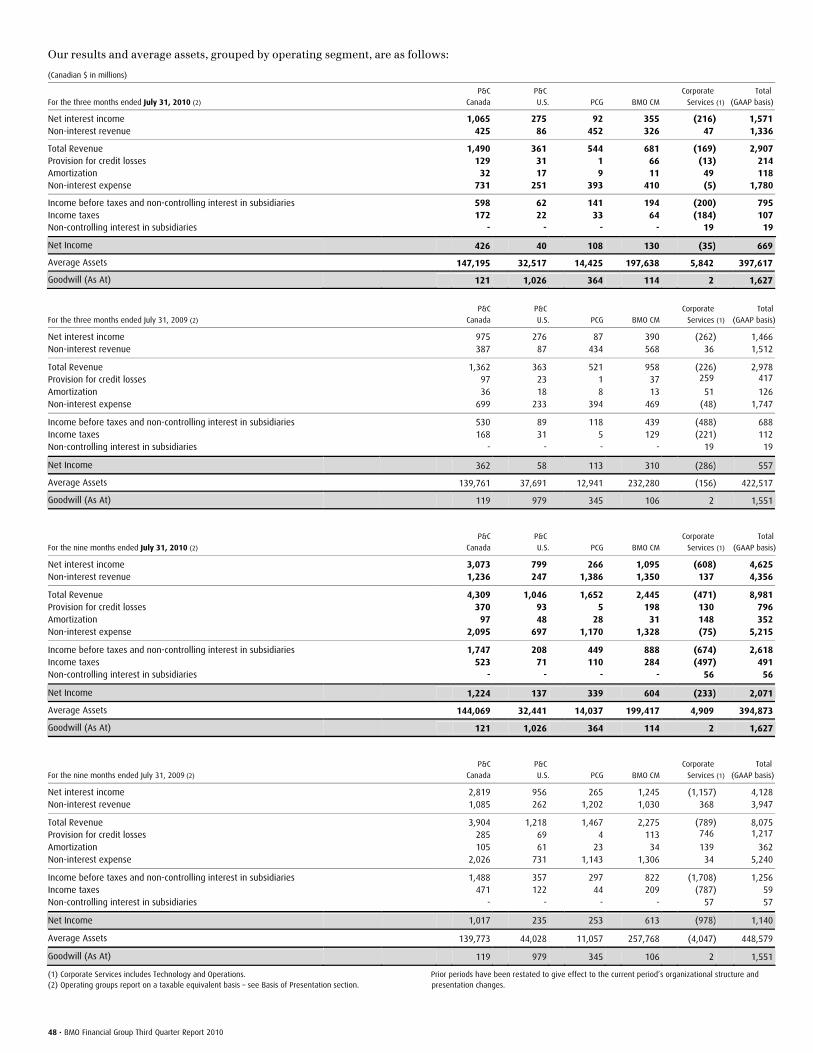
48 • BMO Financial Group Third Quarter Report 2010
Our results and average assets, grouped by operating segment, are as follows:
(Canadian $ in millions)
For the three months ended July 31, 2010 (2)
P&C
Canada
P&C
U.S. PCG BMO CM
Corporate
Services (1)
Total
(GAAP basis)
Net interest income 1,065 275 92 355 (216) 1,571 Non-interest revenue 425 86 452 326 47 1,336
Total Revenue 1,490 361 544 681 (169) 2,907 Provision for credit losses 129 31 1 66 (13) 214 Amortization 32 17 9 11 49 118 Non-interest expense 731 251 393 410 (5) 1,780
Income before taxes and non-controlling interest in subsidiaries 598 62 141 194 (200) 795 Income taxes 172 22 33 64 (184) 107 Non-controlling interest in subsidiaries - - - - 19 19
Net Income 426 40 108 130 (35) 669
Average Assets 147,195 32,517 14,425 197,638 5,842 397,617
Goodwill (As At) 121 1,026 364 114 2 1,627
For the three months ended July 31, 2009 (2)
P&C
Canada
P&C
U.S. PCG BMO CM
Corporate
Services (1)
Total
(GAAP basis)
Net interest income 975 276 87 390 (262) 1,466 Non-interest revenue 387 87 434 568 36 1,512
Total Revenue 1,362 363 521 958 (226) 2,978 Provision for credit losses 97 23 1 37 259 417
Amortization 36 18 8 13 51 126 Non-interest expense 699 233 394 469 (48) 1,747
Income before taxes and non-controlling interest in subsidiaries 530 89 118 439 (488) 688 Income taxes 168 31 5 129 (221) 112 Non-controlling interest in subsidiaries - - - - 19 19
Net Income 362 58 113 310 (286) 557
Average Assets 139,761 37,691 12,941 232,280 (156) 422,517
Goodwill (As At) 119 979 345 106 2 1,551
For the nine months ended July 31, 2010 (2)
P&C
Canada
P&C
U.S. PCG BMO CM
Corporate
Services (1)
Total
(GAAP basis)
Net interest income 3,073 799 266 1,095 (608) 4,625 Non-interest revenue 1,236 247 1,386 1,350 137 4,356
Total Revenue 4,309 1,046 1,652 2,445 (471) 8,981 Provision for credit losses 370 93 5 198 130 796 Amortization 97 48 28 31 148 352 Non-interest expense 2,095 697 1,170 1,328 (75) 5,215
Income before taxes and non-controlling interest in subsidiaries 1,747 208 449 888 (674) 2,618 Income taxes 523 71 110 284 (497) 491 Non-controlling interest in subsidiaries - - - - 56 56
Net Income 1,224 137 339 604 (233) 2,071
Average Assets 144,069 32,441 14,037 199,417 4,909 394,873
Goodwill (As At) 121 1,026 364 114 2 1,627
For the nine months ended July 31, 2009 (2)
P&C
Canada
P&C
U.S. PCG BMO CM
Corporate
Services (1)
Total
(GAAP basis)
Net interest income 2,819 956 265 1,245 (1,157) 4,128 Non-interest revenue 1,085 262 1,202 1,030 368 3,947
Total Revenue 3,904 1,218 1,467 2,275 (789) 8,075 Provision for credit losses 285 69 4 113 746 1,217
Amortization 105 61 23 34 139 362 Non-interest expense 2,026 731 1,143 1,306 34 5,240
Income before taxes and non-controlling interest in subsidiaries 1,488 357 297 822 (1,708) 1,256 Income taxes 471 122 44 209 (787) 59 Non-controlling interest in subsidiaries - - - - 57 57
Net Income 1,017 235 253 613 (978) 1,140
Average Assets 139,773 44,028 11,057 257,768 (4,047) 448,579
Goodwill (As At) 119 979 345 106 2 1,551
(1) Corporate Services includes Technology and Operations. (2) Operating groups report on a taxable equivalent basis – see Basis of Presentation section.
Prior periods have been restated to give effect to the current period’s organizational structure and presentation changes.

BMO Financial Group Third Quarter Report 2010 • 49
Our results and average assets, allocated by geographic region, are as follows: (Canadian $ in millions)
For the three months ended July 31, 2010 Canada United States
Other
countries Total
Net interest income 1,198 346 27 1,571 Non-interest revenue 1,004 281 51 1,336
Total Revenue 2,202 627 78 2,907 Provision for credit losses 110 104 - 214 Amortization 88 29 1 118 Non-interest expense 1,270 467 43 1,780
Income before taxes and non-controlling interest in subsidiaries 734 27 34 795 Income taxes 102 8 (3) 107 Non-controlling interest in subsidiaries 15 4 - 19
Net Income 617 15 37 669
Average Assets 252,642 116,854 28,121 397,617
Goodwill (As At) 448 1,158 21 1,627
For the three months ended July 31, 2009 Canada United States
Other
countries Total
Net interest income 1,020 380 66 1,466 Non-interest revenue 1,083 287 142 1,512
Total Revenue 2,103 667 208 2,978 Provision for credit losses 154 243 20 417 Amortization 93 32 1 126 Non-interest expense 1,268 439 40 1,747
Income before taxes and non-controlling interest in subsidiaries 588 (47) 147 688 Income taxes 135 (26) 3 112 Non-controlling interest in subsidiaries 13 6 - 19
Net Income 440 (27) 144 557
Average Assets 262,875 130,315 29,327 422,517
Goodwill (As At) 436 1,091 24 1,551
For the nine months ended July 31, 2010 Canada United States
Other
countries Total
Net interest income 3,521 1,012 92 4,625 Non-interest revenue 3,238 944 174 4,356
Total Revenue 6,759 1,956 266 8,981 Provision for credit losses 387 417 (8) 796 Amortization 264 85 3 352 Non-interest expense 3,747 1,341 127 5,215
Income before taxes and non-controlling interest in subsidiaries 2,361 113 144 2,618 Income taxes 462 26 3 491 Non-controlling interest in subsidiaries 42 14 - 56
Net Income 1,857 73 141 2,071
Average Assets 256,020 111,248 27,605 394,873
Goodwill (As At) 448 1,158 21 1,627
For the nine months ended July 31, 2009 Canada United States
Other
countries Total
Net interest income 2,636 1,230 262 4,128 Non-interest revenue 2,896 919 132 3,947
Total Revenue 5,532 2,149 394 8,075 Provision for credit losses 392 805 20 1,217 Amortization 256 103 3 362 Non-interest expense 3,721 1,401 118 5,240
Income before taxes and non-controlling interest in subsidiaries 1,163 (160) 253 1,256 Income taxes 174 (112) (3) 59 Non-controlling interest in subsidiaries 40 17 - 57
Net Income 949 (65) 256 1,140
Average Assets 269,085 149,384 30,110 448,579
Goodwill (As At) 436 1,091 24 1,551
Prior periods have been restated to give effect to the current period’s organizational structure and presentation changes.

INVESTOR AND MEDIA PRESENTATION
Investor Presentation Materials Interested parties are invited to visit our website at www.bmo.com/investorrelations to review our 2009 Annual Report, this quarterly news release, presentation materials and a supplementary financial information package online.
Quarterly Conference Call and Webcast Presentations Interested parties are also invited to listen to our quarterly conference call on Tuesday, August 24, 2010, at 2:00 p.m. (EDT). At that time, senior BMO executives will comment on results for the quarter and respond to questions from the investor community. The call may be accessed by telephone at 416-695-9753 (from within Toronto) or 1-888-789-0089 (toll-free outside Toronto). A replay of the conference call can be accessed until Monday, December 6, 2010, by calling 416-695-5800 (from within Toronto) or 1-800-408-3053 (toll-free outside Toronto) and entering passcode 7878814. A live webcast of the call can be accessed on our website at www.bmo.com/investorrelations. A replay can be accessed on the site until Monday, December 6, 2010.
Media Relations Contacts Ralph Marranca, Toronto, [email protected], 416-867-3996 Ronald Monet, Montreal, [email protected], 514-877-1873
Investor Relations Contacts Viki Lazaris, Senior Vice-President, [email protected], 416-867-6656 Steven Bonin, Director, [email protected], 416-867-5452 Andrew Chin, Senior Manager, [email protected], 416-867-7019
Chief Financial Officer Russel Robertson, Chief Financial Officer [email protected], 416-867-7360
Corporate Secretary Blair Morrison, Senior Vice-President, Deputy General Counsel, Corporate Affairs and Corporate Secretary [email protected], 416-867-6785
Shareholder Dividend Reinvestment and Share Purchase Plan Average market price May 2010 $60.53 ($59.32*) June 2010 $59.81 July 2010 $62.69 * reflects 2% discount for dividend reinvestment For dividend information, change in shareholder address or to advise of duplicate mailings, please contact Computershare Trust Company of Canada 100 University Avenue, 9th Floor Toronto, Ontario M5J 2Y1 Telephone: 1-800-340-5021 (Canada and the United States) Telephone: (514) 982-7800 (international) Fax: 1-888-453-0330 (Canada and the United States) Fax: (416) 263-9394 (international) E-mail: [email protected]
For other shareholder information, please contact Bank of Montreal Shareholder Services Corporate Secretary’s Department One First Canadian Place, 21st Floor Toronto, Ontario M5X 1A1 Telephone: (416) 867-6785 Fax: (416) 867-6793 E-mail: [email protected] For further information on this report, please contact Bank of Montreal Investor Relations Department P.O. Box 1, One First Canadian Place, 18th Floor Toronto, Ontario M5X 1A1 To review financial results online, please visit our website at www.bmo.com
® Registered trademark of Bank of Montreal Annual Meeting 2011
The next Annual Meeting of Shareholders will be held on
Tuesday, March 22, 2011, in Vancouver, British Columbia.