Thioflavin T Binding to Amyloid Fibrils Lauren Riggs North … · 2 amyloid fibril accumulation and...
21
1 Thioflavin T Binding to Amyloid Fibrils Lauren Riggs North Carolina State University University of Florida REU Summer 2006 Abstract Treatment of Alzheimer’s disease (AD) is hampered by the fact that the disease progression cannot be tracked in vivo at this time. Understanding the properties of Aβ amyloid fibrils associated with AD is imperative to finding a way to track the progression of the disease. Recently, fluorescent markers, derived from thioflavin T have been developed as markers of AD. This project examines the intrinsic fluorescence of thioflavin T as well as the fluorescence of thioflavin T bound to Aβ(1-40) amyloid fibrils with two distinct morphologies. The two fibril polymorphs produced different fluorescence emission intensities. The goal is to better understand the structural and binding properties of these amyloid fibrils in an attempt to provide earlier diagnosis of amyloid disorders, specifically AD. Introduction Amyloid is a type of insoluble fibrous protein aggregate. Amyloid fibrils play a role in some normal processes in the body, such as melanin formation. Amyloid, however, can accumulate in such a manner as to inhibit or degrade normal cellular function. Abnormal amyloid accumulations are frequently present in some neurodegenerative diseases, such as Alzheimer’s disease (AD). The study of amyloid peptide aggregation and accumulation as amyloid plaques has become a priority in research that spans a multitude of academic disciplines. The connection between
Transcript of Thioflavin T Binding to Amyloid Fibrils Lauren Riggs North … · 2 amyloid fibril accumulation and...
1
Thioflavin T Binding to Amyloid Fibrils Lauren Riggs
North Carolina State University University of Florida REU Summer 2006
Abstract
Treatment of Alzheimer’s disease (AD) is hampered by the fact that the disease
progression cannot be tracked in vivo at this time. Understanding the properties of Aβ
amyloid fibrils associated with AD is imperative to finding a way to track the progression
of the disease. Recently, fluorescent markers, derived from thioflavin T have been
developed as markers of AD. This project examines the intrinsic fluorescence of
thioflavin T as well as the fluorescence of thioflavin T bound to Aβ(1-40) amyloid fibrils
with two distinct morphologies. The two fibril polymorphs produced different
fluorescence emission intensities. The goal is to better understand the structural and
binding properties of these amyloid fibrils in an attempt to provide earlier diagnosis of
amyloid disorders, specifically AD.
Introduction
Amyloid is a type of insoluble fibrous protein aggregate. Amyloid fibrils play a
role in some normal processes in the body, such as melanin formation. Amyloid,
however, can accumulate in such a manner as to inhibit or degrade normal cellular
function. Abnormal amyloid accumulations are frequently present in some
neurodegenerative diseases, such as Alzheimer’s disease (AD). The study of amyloid
peptide aggregation and accumulation as amyloid plaques has become a priority in
research that spans a multitude of academic disciplines. The connection between
2
amyloid fibril accumulation and AD is a primary driving force behind much of this
scientific interest. Congo red and thioflavin T (ThT), the dye used in our research, are
the two dyes used most extensively for identification and localization of amyloid fibrils.
The fluorescent dye, ThT, is known to show increased fluorescence upon binding to
amyloid fibrils. Although much is known about amyloid fibrils, ThT, and the fact that
ThT binds to amyloid fibrils, very little is known about the actual mechanism of the
binding of ThT to amyloid fibrils. Research conducted in this laboratory will attempt to
address some of these fundamental questions and further enhance our understanding of
the mechanism of ThT binding to amyloid fibrils.
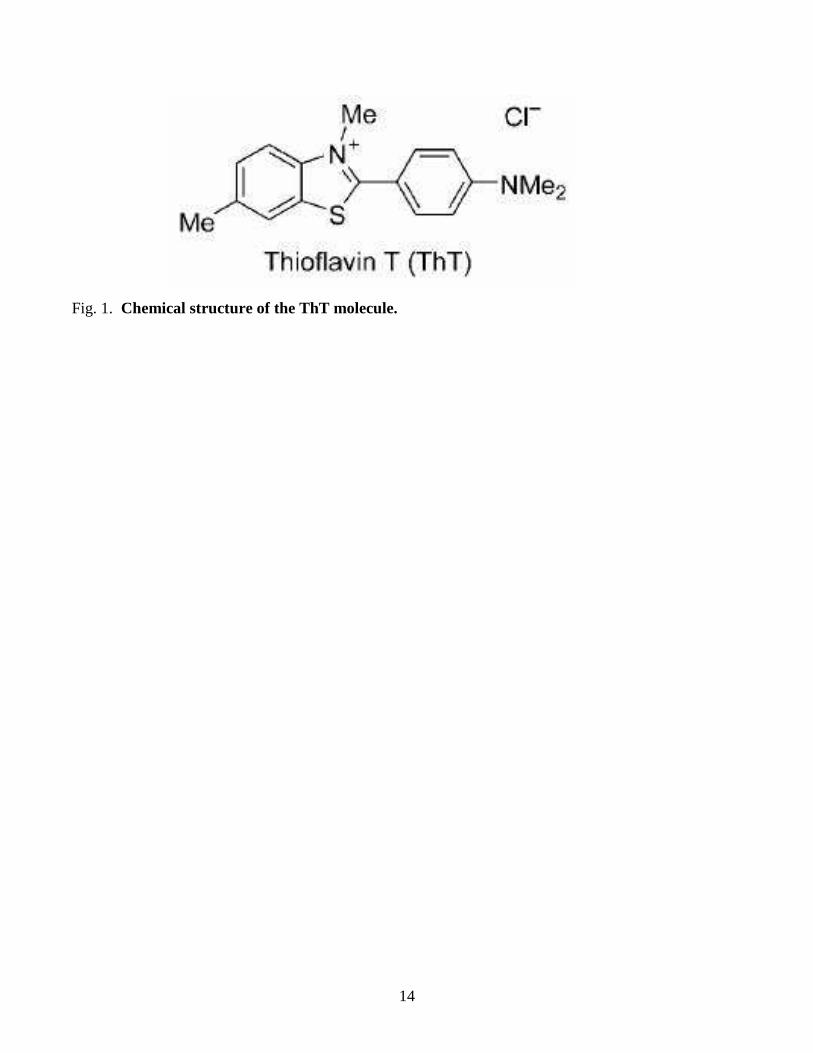
ThT, a cationic benzothiazole dye (see Figure 1 for chemical structure), has been
used to identify amyloid fibrils since it was first shown (by Vassar and Culling in 1959
[1]) to demonstrate increased fluorescence upon binding to amyloid. Upon binding with
amyloid, ThT experiences changes in both fluorescence emission and excitation spectra
[2]. Subsequent studies of ThT binding to amyloid have shown that ThT is one of the
most effective dyes used for this purpose. Recent research has offered several possible
explanations for binding mechanisms. For example, ThT micelle formation was
suggested by Khurana et al. [3]. Based upon increases in specific conductance as well as
increases in fluorescence emission and excitation, Khurana and colleagues concluded that
ThT molecules were forming micelles at concentrations above 4 µM ThT in aqueous
solvents. Atomic force microscopy was used to visually reaffirm the presence of ThT
micelles both alone and bound to amyloid fibrils [3].
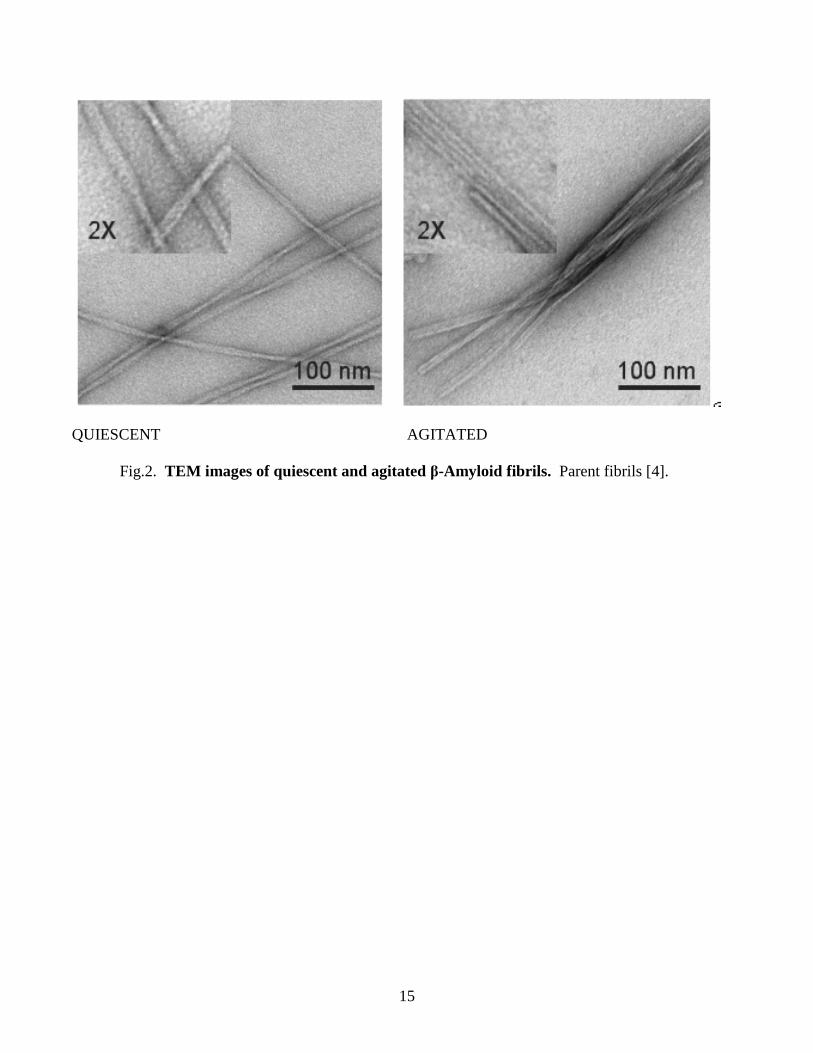
Preliminary studies by Petkova et al. [4] involved two fibril morphologies of
amyloid β peptide, residues 1 to 40, referred to henceforth as Aβ(1-40). A difference in
3
fluorescence emission was observed between quiescent and agitated fibrils, the two fibril
types studied. Transmission electron microscopy (TEM) images of quiescent and
agitated parent fibrils are seen in Figure 2. The two morphologies Petkova et al. studied
[4] are similar to amyloid morphologies found in the human body. It is important to learn
more about this difference in fluorescence for more accurate diagnosis of amyloid
disorder. Determining the relationship between amount of fibril present and fluorescence
would also help to establish a quantitative measure of amyloid deposition. Currently, the
process of dye binding to amyloid is ill-understood and has previously only been
examined in in vitro studies or in ex vivo studies. One goal of amyloid research is to be
able to use fluorescent dye, specifically derivatives of ThT, in in vivo studies (Positron
Emission Tomography, PET, imaging) in an attempt to track progression of amyloid-
associated diseases at early stages. Because there is no cure or treatment for AD,
delaying the progression of the disease if caught early on is currently the only hope for
AD patients. Thus, early diagnosis is imperative at this point. With better understanding
of the mechanism of binding, the usefulness of the dyes in early diagnosis of amyloid
diseases such as AD will be increased.
Fluorescence microscopy will be used for observing changes in fluorescence of
ThT and ThT bound to β amyloid. Solid-state NMR experiments will be used in the
future to attempt to locate the actual binding sites using specific residue labeled fibril
samples. While the overall goal of this research is to discover the mechanism by which
ThT binds to amyloid fibrils, some more specific and shorter term goals include
identifying or verifying the binding ratio and locating the actual binding sites, both on the
dye and on the amyloid fibrils.
4
Pre-Investigation
Since I became involved with this project in its very early stages, I was able to
observe and participate in the planning of the project. I spent several weeks conducting
background literature research, determining what was known with regards to the
questions Dr. Petkova’s research hopes to address. Once a plan of action was identified, I
began conducting research in the laboratory facilities of Dr. Stephen Hagen in the Physics
Department. I also briefly used the laboratory facilities of Dr. Joanna Long at the
McKnight Brain Institute.
I was involved in some of the groundwork for what will become one of Dr.
Petkova’s research projects at the University of Florida. The first step was to attempt to
reproduce results from previous studies and decide where to proceed from there.
Investigation
The ThT used in this experiment was obtained from ICN Biomedicals Inc.
Amyloid fibril samples were parent and daughter amyloid β residues 1 to 40, Aβ(1-40),
samples from a previous experiment [4]. Parent fibrils were grown by incubating fresh
Aβ1-40 solutions and daughter fibrils were grown by seeding fresh solutions with
sonicated fragments [4]. Fluorescence measurements for this project were taken using a
Jasco FP 750 Spectrofluorometer, using a xenon arc lamp to generate light. A 4 ml
quartz cuvette was filled with approximately 3.3 – 3.5 ml of solution for each
fluorescence measurement. In accordance with Meredith’s assay [5], fluorescence
emission spectra were taken from 465 to 550 nm with the excitation wavelength set at
5
446 nm and fluorescence excitation spectra were taken from 350 to 475 nm with emission
observed at 490 nm. An emission spectrum displays the fluorescence over a range of
wavelengths when the sample is excited by light of a constant wavelength. An excitation
spectrum displays the fluorescence at a constant wavelength when the wavelength of the
light used to excite the sample varies. The temperature at which the data were taken
ranged from approximately 20 to 24 ºC (slightly different temperatures for different sets
of measurements).
Buffer Preparation
Glycine hydrochloride (from Aldrich Chemical Company, Inc) was dissolved in
deionized water to create a 0.5 L stock of 50 mM glycine buffer. To increase the pH
from 1.94 to the desired pH of 8.5, approximately 6 ml of 3.0 N sodium hydroxide
solution with 9 sodium hydroxide pellets was added to the buffer. Glycine buffer was
also prepared following Meredith’s assay [5].
A second supply of buffer was created to study the effects, if any existed, of aged
chemicals. Using glycine obtained from Fisher Scientific, a 0.2 L stock of 50 mM
glycine buffer was mixed. This time the pH was raised from 5.16 to 8.49 by adding
approximately 1.5 ml of a sodium hydroxide solution made by dissolving 2 pellets of
solid sodium hydroxide in 10 ml of deionized water.
ThT Fluorescence
Concentration dependence of the intensity of ThT fluorescence was examined in
an attempt to recognize micelle formation and to determine appropriate ThT
6
concentrations to use for fibril fluorescence measurements. Samples of 0.05, 0.1, 0.2,
0.5, 1, 2, 4, 7, 10, 20, 50, 75, 100, 125, 150, 175, 200, 225, and 250 µM ThT
concentrations were prepared. Amounts of ThT ranging from 2 to 4 mg were dissolved
in a milliliter of ethanol. ThT stock was then diluted to the specified concentrations in
glycine buffer of pH 8.5. Fluorescence emission and fluorescence excitation
measurements were taken for each concentration of ThT. Several other ThT fluorescence
characterization tests were run including determination of the effects of aging of ThT and
the effects of the amount of ethanol present in ThT. These additional tests were done in
order to improve the experimental protocol.
ThT + Aβ Fluorescence
Quiescent (incubated under dialysis conditions) and agitated (incubated under
shaken conditions) amyloid β fibril samples were made of parent and daughter fibrils
from a previous project [4]. The original stocks used for both quiescent and agitated
fibrils were at 210 µM concentrations. Quiescent daughter fibrils were diluted to
0.00105, 0.0105, 0.07, 0.525, 2.1, and 5.25 µM concentrations. Agitated daughter fibrils
were diluted to 0.0105, 0.525, 2.1, and 5.25 µM concentrations. Quiescent parent fibrils
were diluted to 0.0105 µM concentration. ThT was added at a concentration of 0.1 µM
to each of the concentrations of amyloid fibril. The combined ThT and amyloid fibril
samples incubated for at least 30 minutes and then fluorescence emission and excitation
measurements were taken. A second round of fibril fluorescence measurements was
taken on some of the amyloid fibrils after placing the samples in a sonicating bath
7
(Laboratory Supplies Co., Inc, Hicksville, NY, S4 model G112SP1T, 600V 80KC 0.5
amps) in order to break up any fibril clumps that might have been present.
After fresh supplies of ThT, glycine, and sodium hydroxide arrived, additional
measurements were taken so as to eliminate the possible effects of aging in the chemicals
used for the majority of the testing. Using the new chemicals, fluorescence emission and
excitation measurements were taken with 0.0105 µM quiescent and agitated daughter
fibrils with 0.1 µM ThT.
In attempt to confirm previous measurements, another protocol from Petkova et
al. [4] was followed for binding of ThT to amyloid fibrils. For this procedure, quiescent
and agitated daughter amyloid fibrils were diluted to 0.945 µM and combined with
~0.008 µM ThT. Fluorescence emission and excitation measurements were taken once
without being sonicated, and a different set of measurements was taken on a second
sample after sonication.
Results
ThT Fluorescence
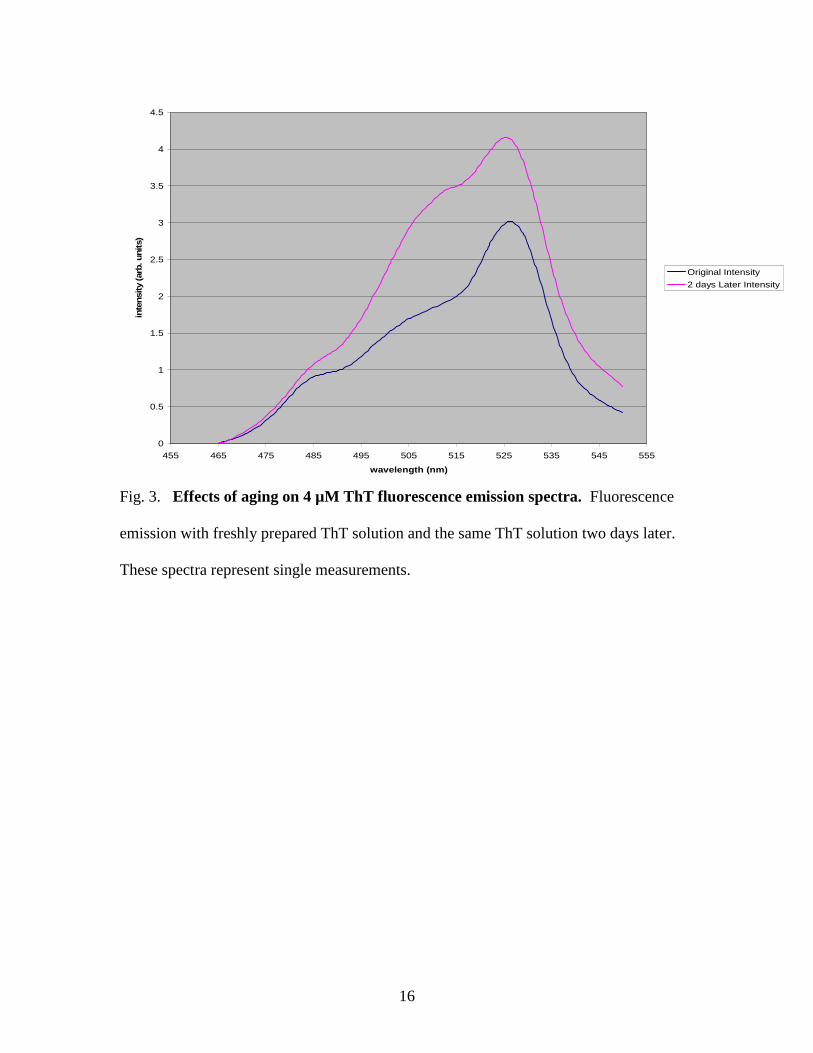
When effects of ThT aging were analyzed, an increase in fluorescence was
measured two days later when compared to the immediate fluorescence measurement, as
seen on a 4 µM ThT sample in Figure 3. For this reason, fresh solutions of ThT were
prepared to be used each day that fluorescence measurements were taken.
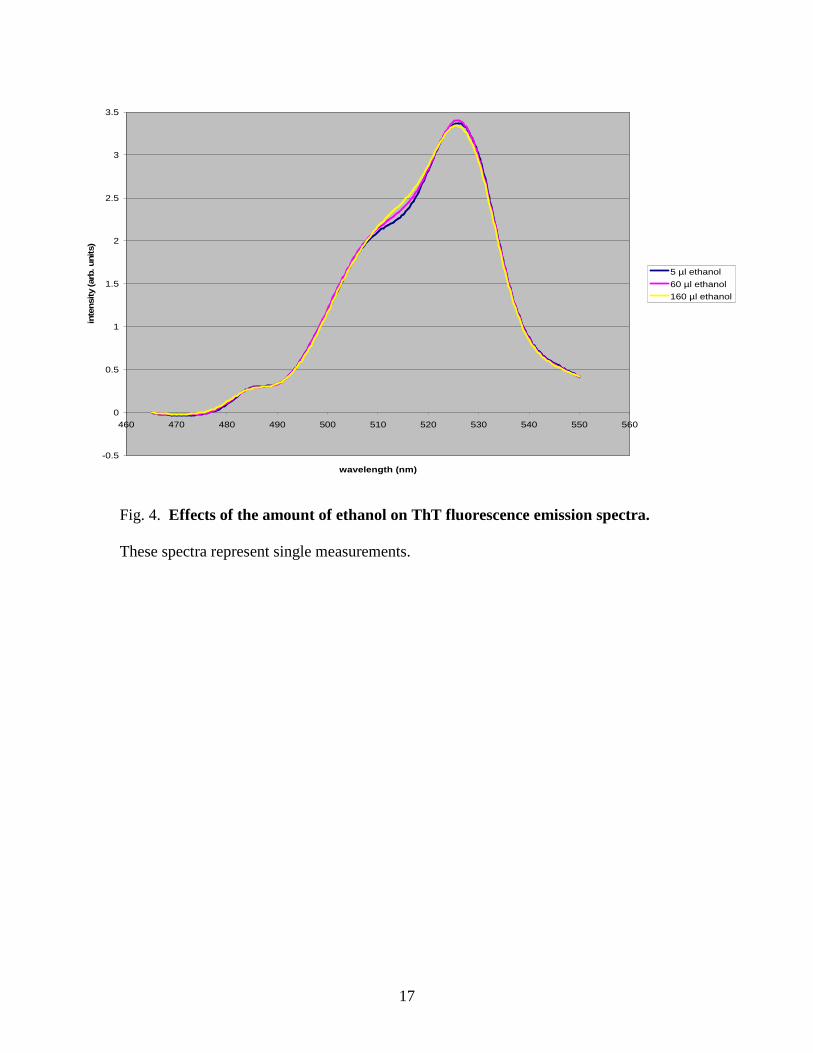
Comparison of fluorescence emission spectra of a constant concentration of ThT
containing different amounts of ethanol showed essentially no difference, as seen in
8
Figure 4. This result led us to conclude that the amount of ethanol present did not have
an effect on the ThT fluorescence measurements.
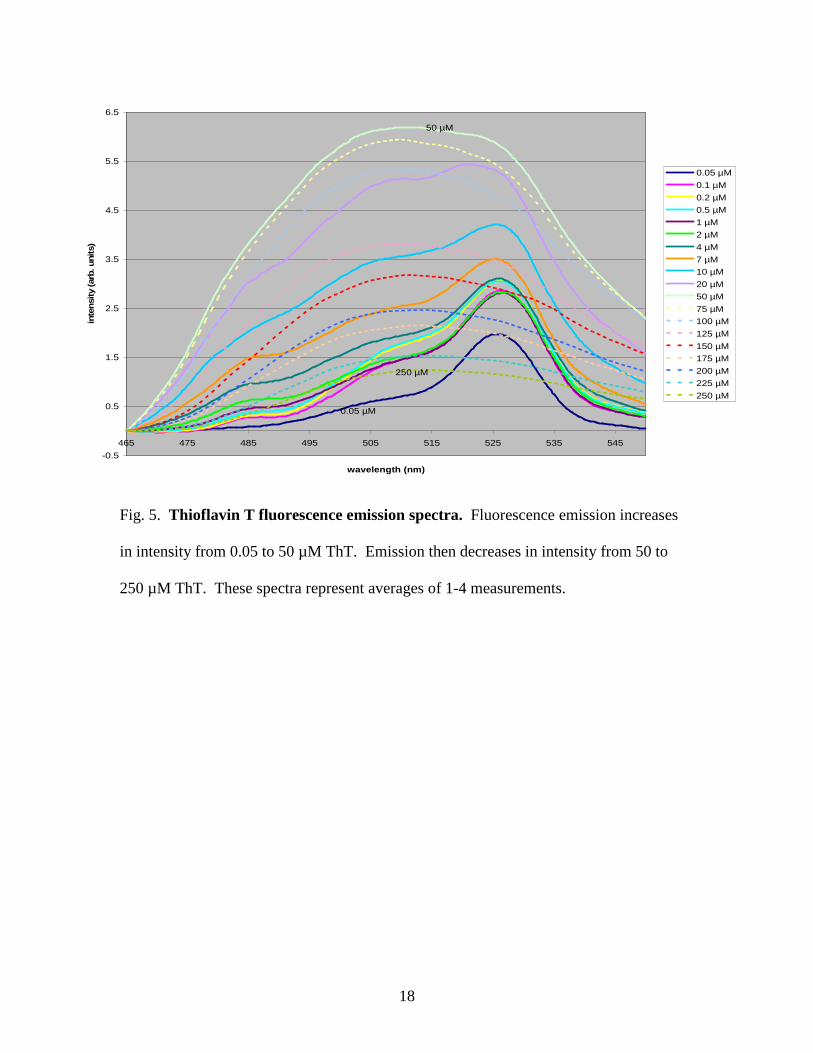
Full emission spectra of all ThT concentrations are shown in Figure 5. ThT
fluorescence emission measurements showed a relatively steady increase in intensity up
through 50 µM ThT. Above the 50 µM ThT concentration, the intensity decreased again
relatively steadily through the remaining high ThT concentrations.
Excitation spectra also showed differences with changes in ThT concentrations
(results not shown).
ThT + Aβ Fluorescence
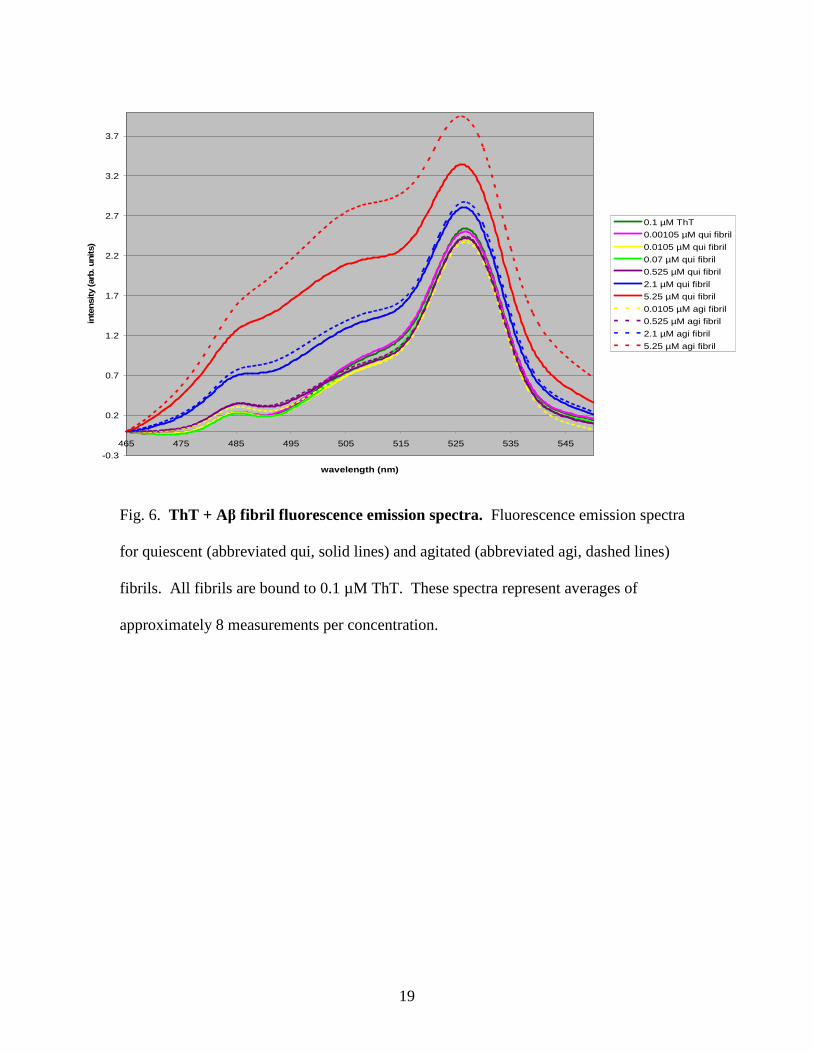
Full emission spectra for the fluorescence of fibrils bound to 0.1 µM ThT are
displayed in Figure 6. As a general trend, as fibril concentration increased, the intensity
of the fluorescence emissions also increased. An unexpected result was the initial drop in
intensity upon adding very low (0.00105 µM) amyloid fibril concentrations to the ThT.
At the higher concentrations it is also evident that the agitated amyloid fibril samples
produced more intense fluorescence emission spectra. This difference was much less
apparent at low amyloid fibril concentrations.
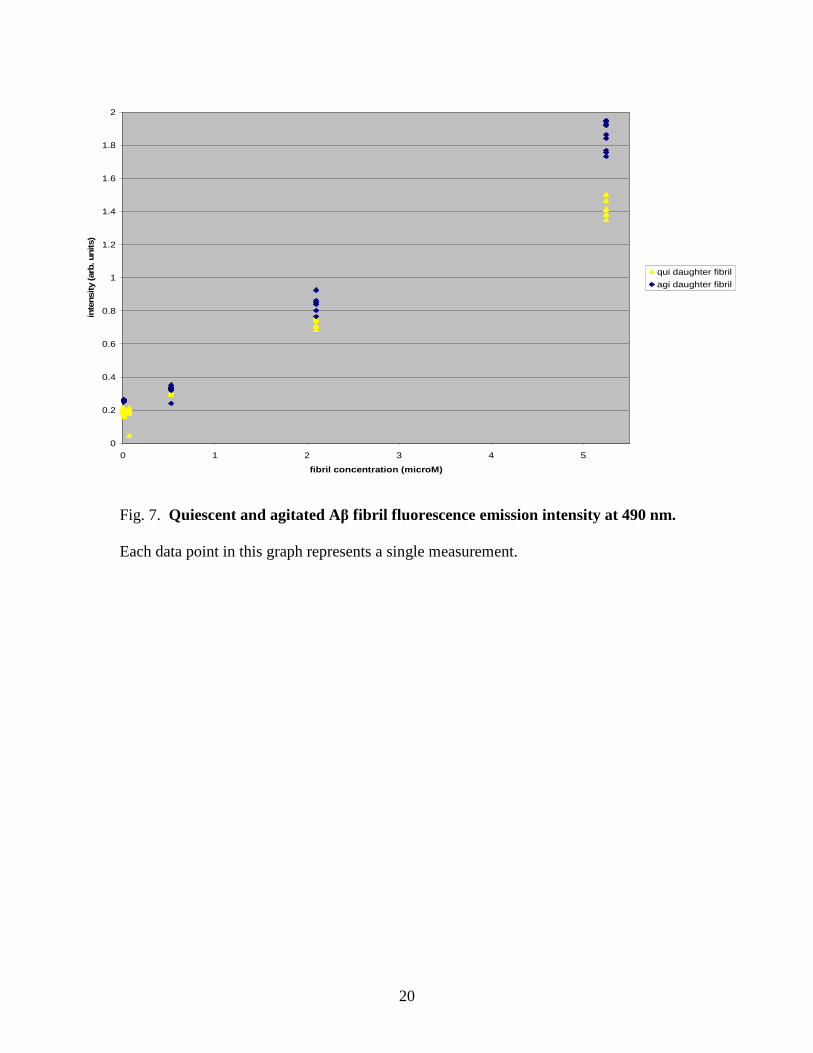
The majority of amyloid research has been done measuring emission at 490 nm.
Likewise, we analyzed the fluorescence emission at 490 nm. Figure 7 shows the
fluorescence emission intensity at 490 nm of both fibril types in 0.1 µM ThT at varying
fibril concentrations. Several measurements were taken (including both stirred and
unstirred samples) at each concentration and are shown in Figure 7. Clearly fluorescence
9
emission intensity increases as fibril concentration increases, and fluorescence emission
intensity of agitated fibrils tends to be higher than the intensity of quiescent fibrils.
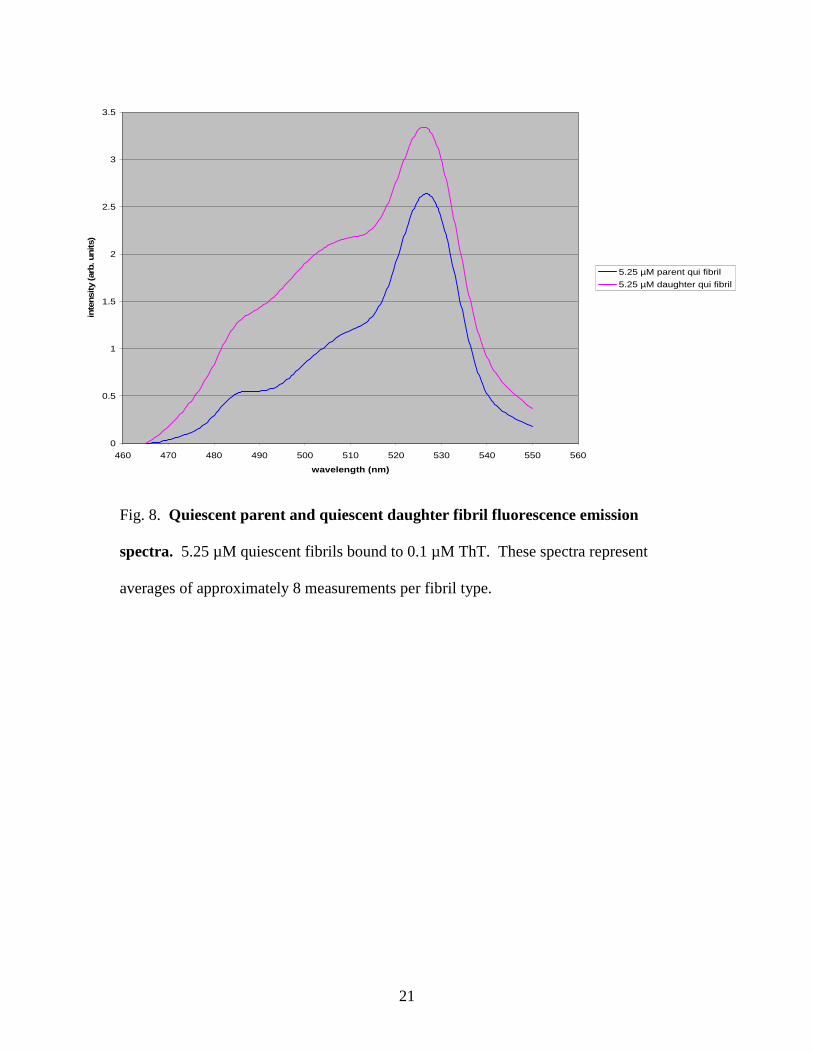
A difference was also present in the emission spectra of parent and daughter
fibrils. The quiescent parent fibrils showed significantly lower intensity than the
quiescent daughter fibrils. Figure 8 displays the emission spectra of the quiescent parent
and quiescent daughter fibrils.
Again, changes were observed in the excitation spectra of ThT bound to β
amyloid (results not shown).
Discussion
The ThT fluorescence results showing a decrease in fluorescence above 50 µM
ThT concentrations do not agree with the results of work of others, such as Khurana et al.
[3], who claim that a sharp increase in fluorescence above 4 µM ThT concentrations is
due to the formation of micelles at 4 µM, the critical micellar concentration. It is unclear
why the results of our study differed from those performed by Khurana et al. Further
testing would be required in order to confirm or dispute their results. In an article
discussing accuracy and reproducibility of ThT assays, one of the main points noted is
that fluorescence enhancement was greatest when ThT was present in a 15-fold molar
excess [6]. Another suggested procedure was to prepare new working solutions of the
dye daily and to cover buffer stock (newly prepared on a weekly basis) in foil and store at
4 ºC [6]. In our assay, we used ThT at an excess of about 10-fold molar concentrations
(0.0105 µM fibril and 0.1 µM ThT). The low ThT concentration was used in order to
keep our ThT well below the critical micelle concentration. The plan was to also take the
10
same fluorescence measurements using a concentration of ThT well above the critical
micelle concentration. The suggested procedure for preparing ThT solution was followed
by preparing new working solutions daily; however, the buffer was not prepared weekly
and was only sometimes stored at the 4 ºC temperature. The buffer was prepared initially
in a large enough volume to last throughout the experimentation phase and was left
capped but uncovered by foil at room temperature most of the time. While this should
have no effect on the results (in fact, pH was measured to have remained at 8.5), in order
to rule out any possible effects of the aging of the buffer, more measurements should be
taken in the future with buffers of different ages and the pH of the buffer re-measured to
make sure it is remaining fairly constant.
Decreases in fluorescence emissions of the fibril samples after sonication were
also unexpected. These results do suggest a possible explanation, that is, sonication may
have been too intense, so it not only broke up the fibrils, but it also dissolved some
portion of the fibrils. The sonicating bath used was unfamiliar to the researchers, and
therefore appropriate duration for sonication could have been misjudged. In order to
determine whether the fibrils were simply sonicated for too long, additional experiments
will need to be conducted. In these experiments, different times for sonication, as well as
different fibril concentrations, should be tested.
Differences in emission spectra of quiescent and agitated fibrils were expected,
based on the preliminary results of Petkova et al. [4]. In this study, significant
differences in fluorescence were observed in the quiescent and agitated samples, which
also displayed different morphologies and molecular structure. In agreement with the
findings of Petkova et al. [4], we found that agitated fibrils showed higher emission
11
intensity than quiescent fibrils. The fluorescence differences noted in the quiescent
parent and daughter fibrils can possibly be explained by a few physical differences in the
two generations of fibrils. Parent fibrils usually consist of larger clumps; therefore, the
ThT binding would be less efficient because the dye may not penetrate the clumped
fibrils as well as isolated fibrils. Once proper sonication techniques have been
established, parent and daughter fibril fluorescence should be reanalyzed after being
sonicated to see if the results change or remain the same.
In addition to providing a more thorough investigation and analysis of the
differences in fluorescence of quiescent and agitated fibrils, many aspects of the
experimental protocol were investigated, so that future experimentation can be as exact
and time-efficient as possible.
Several issues that need to be addressed in the longer term have been identified.
Preliminary work by Lockhart et al. has identified three binding sites on amyloid fibrils
with three different binding ratios [7]. Using information such as the known positive
charge of ThT, structural models of Aβ fibrils, and the known charges of the amino acid
residues that make up Aβ(1-40) amyloid fibrils, we propose a possible binding site
involving the benzyl group of ThT interacting with residue F20 and the charge of ThT
interacting with residue E22 on the agitated fibrils. Using labeled fibril samples and
solid-state NMR techniques, the possible binding of the dye at these sites should be able
to be observed or not observed, as changes or lack of changes in the fibril chemical
structure which are caused by changes in the electronic environment of the fibril at these
locations. Other possible binding sites will also be considered and analyzed through
similar techniques.
12
Summary
The experimental protocol for analyzing fluorescence of ThT bound to Aβ(1-40)
fibrils was analyzed and improved. ThT fluorescence dependence on both fibril
concentration and fibril type was examined. Fluorescence was shown to increase as fibril
concentration increases and agitated fibrils showed greater fluorescence than quiescent
fibrils. This information, and the future plans of this experiment, will be important in
designing a better PET-imaging marker for early identification of fibril formation
associated with AD.
Acknowledgments
I would like to thank my mentor Dr. Aneta Petkova for her guidance and insight
throughout the project and Dr. Stephen Hagen and the rest of his research team who
generously shared their time, supplies, and patience with me. Thanks to the UF REU
staff: Dr. Kevin Ingersent, Dr. Selman Hershfield, Kristin Nichola, and Ethan Seigel.
Finally, I would like to thank the NSF and UF for their support of the REU program and
also for giving me the opportunity to participate in the program.
13
References
[1] P.S. Vassar and C.F.A. Culling, “Fluorescent stains with special reference to amyloid
and connective tissues,” Arch. Pathol. 68, 487-494 (1959).
[2] H. Levine III, Multiple ligand binding sites in Aβ(1-40) fibrils. Amyloid. 12, 5-14
(2005).
[3] R. Khurana, C. Coleman, C. Ionescu-Zanetti, S. A. Carter, V. Krishna, R. K. Grover,
R. Roy, and S. Singh, “Mechanism of thioflavin T binding to amyloid fibrils,” J.
Struct. Biol. 151, 229-238 (2005).
[4] A.T. Petkova, R.D. Leapman, Z. Guo, W. Yau, M.P. Mattson, and R. Tycko, “Self-
Propagating, Molecular-Level Polymorphism in Alzheimer’s β-Amyloid Fibrils,”
Science. 307, 262-265 (2005).
[5] D.J. Gordon and S.C. Meredith, “Probing the Role of Backbone Hydrogen Bonding in
β-Amyloid Fibrils with Inhibitor Peptides Containing Ester Bonds at Alternate
Positions,” Biochem. 42, 475-485 (2003).
[6] R. Eisert, L. Felau, and L.R. Brown, “Methods for enhancing the accuracy and
reproducibility of Congo red and thioflavin T assays,” Anal. Biochem. 353, 144-
146 (2006).
[7] A. Lockhart, L. Ye, D.B. Judd, A.T. Merritt, P.N. Lowe, J.L. Morgenstern, G. Hong,
A.D. Gee, and J. Brown, “Evidence for the Presence of Three Distinct Binding
Sites for the Thioflavin T Class of Alzheimer’s Disease PET Imaging Agents on
β-Amyloid Peptide Fibrils,” J. of Biol. Chem. 280, 7677-7684 (2005).
14
Fig. 1. Chemical structure of the ThT molecule.
15
QUIESCENT AGITATED
Fig.2. TEM images of quiescent and agitated β-Amyloid fibrils. Parent fibrils [4].
16
0
0.5
1
1.5
2
2.5
3
3.5
4
4.5
455 465 475 485 495 505 515 525 535 545 555
wavelength (nm)
inte
nsi
ty (ar
b. u
nits)
Original Intensity
2 days Later Intensity
Fig. 3. Effects of aging on 4 µM ThT fluorescence emission spectra. Fluorescence
emission with freshly prepared ThT solution and the same ThT solution two days later.
These spectra represent single measurements.
17
-0.5
0
0.5
1
1.5
2
2.5
3
3.5
460 470 480 490 500 510 520 530 540 550 560
wavelength (nm)
inte
nsi
ty (ar
b. u
nits)
5 µl ethanol
60 µl ethanol
160 µl ethanol
Fig. 4. Effects of the amount of ethanol on ThT fluorescence emission spectra.
These spectra represent single measurements.
18
0.05 µM
50 µM
250 µM
-0.5
0.5
1.5
2.5
3.5
4.5
5.5
6.5
465 475 485 495 505 515 525 535 545
wavelength (nm)
inte
nsi
ty (ar
b. u
nits)
0.05 µM
0.1 µM
0.2 µM
0.5 µM
1 µM
2 µM
4 µM
7 µM
10 µM
20 µM
50 µM
75 µM
100 µM
125 µM
150 µM
175 µM
200 µM
225 µM
250 µM
Fig. 5. Thioflavin T fluorescence emission spectra. Fluorescence emission increases
in intensity from 0.05 to 50 µM ThT. Emission then decreases in intensity from 50 to
250 µM ThT. These spectra represent averages of 1-4 measurements.
19
-0.3
0.2
0.7
1.2
1.7
2.2
2.7
3.2
3.7
465 475 485 495 505 515 525 535 545
wavelength (nm)
inte
nsi
ty (ar
b. u
nits)
0.1 µM ThT
0.00105 µM qui fibril
0.0105 µM qui fibril
0.07 µM qui fibril
0.525 µM qui fibril
2.1 µM qui fibril
5.25 µM qui fibril
0.0105 µM agi fibril
0.525 µM agi fibril
2.1 µM agi fibril
5.25 µM agi fibril
Fig. 6. ThT + Aβ fibril fluorescence emission spectra. Fluorescence emission spectra
for quiescent (abbreviated qui, solid lines) and agitated (abbreviated agi, dashed lines)
fibrils. All fibrils are bound to 0.1 µM ThT. These spectra represent averages of
approximately 8 measurements per concentration.
20
0
0.2
0.4
0.6
0.8
1
1.2
1.4
1.6
1.8
2
0 1 2 3 4 5
fibril concentration (microM)
inte
nsi
ty (ar
b. u
nits)
qui daughter fibril
agi daughter fibril
Fig. 7. Quiescent and agitated Aβ fibril fluorescence emission intensity at 490 nm.
Each data point in this graph represents a single measurement.
21
0
0.5
1
1.5
2
2.5
3
3.5
460 470 480 490 500 510 520 530 540 550 560
wavelength (nm)
inte
nsi
ty (ar
b. u
nits)
5.25 µM parent qui fibril
5.25 µM daughter qui fibril
Fig. 8. Quiescent parent and quiescent daughter fibril fluorescence emission
spectra. 5.25 µM quiescent fibrils bound to 0.1 µM ThT. These spectra represent
averages of approximately 8 measurements per fibril type.