
Things I wish someone had told me about IDAA two years · PDF fileThings I wish someone had...
65
Things I wish someone had told me about IDAA two years ago Robert Vargo Dustin Ratliff Progressive Insurance
Transcript of Things I wish someone had told me about IDAA two years · PDF fileThings I wish someone had...
Things I wish someone had told me about IDAA two years ago
Robert VargoDustin RatliffProgressive Insurance
What are we going to cover?
• Progressive’s DB2 Configuration
• Initial setup and implementation
• Challenges
• Monitoring
• Migration
• Our user’s experience and our next steps
2

Progressives background (how our environment looks)
3
• 11 data
sharing
groups (3
warehouse)
• 5 way data
sharing group
in PROD
Progressive’s DB2 Configuration
• In order to allow IDAA to communicate with all members, we had to make some changes for DDF• We disabled DDF in the past on one of our PROD members which we needed IDAA to communicate
with
• In order to keep this setup, and allow IDAA to communicate with that member we did a few things
• New static alias on members where we wanted to allow DDF to run
• Update db2dsdriver.cfg on all clients to point to new alias
• Turn on DDF on that member
4
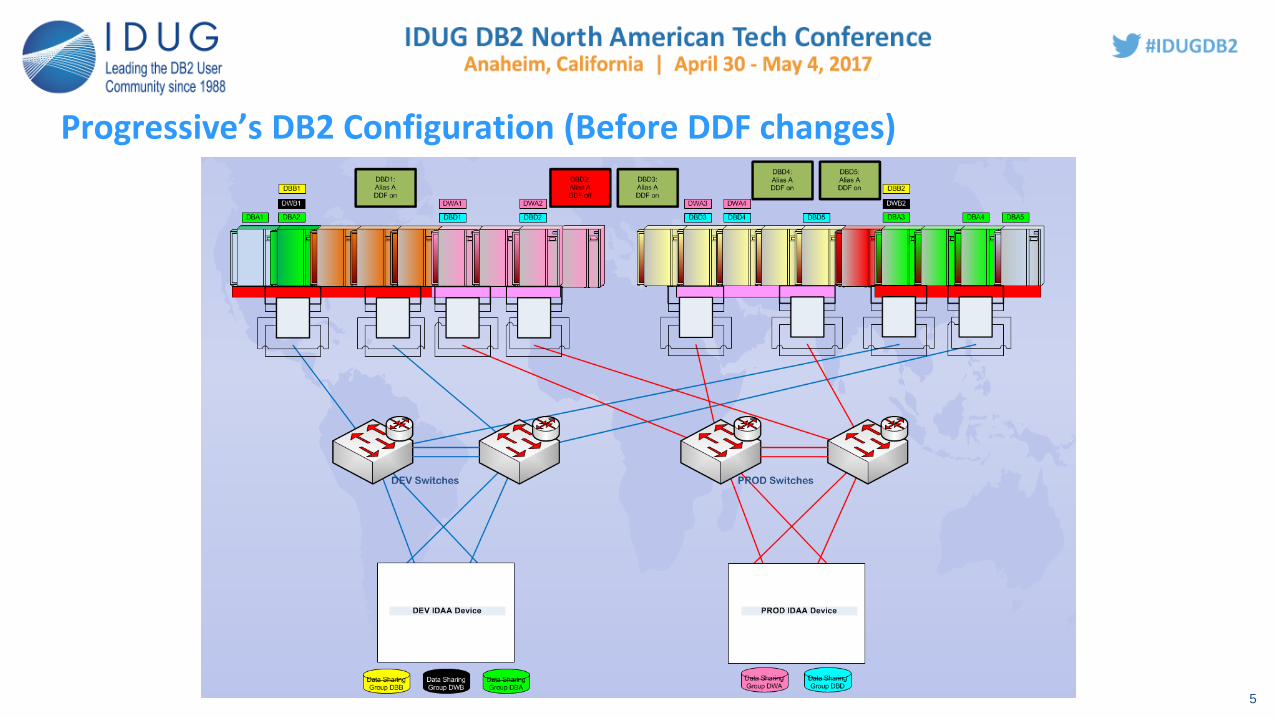
Progressive’s DB2 Configuration (Before DDF changes)
5
DBD1

Progressive’s DB2 Configuration (After DDF changes)
6

IDAA at Progressive
• Why did we implement IDAA ?
• The main goal: reduce monthly software costs
• All other benefits were considered ‘soft’ and did not play a roll in the justification
• Is cost reduction a good reason to implement IDAA ?
• You have to consider your second, third , . . . Other peaks
7

IDAA Implementation Project Goals
• Try to ensure that the implementation would be transparent to our end users
• This implies no (or limited) changes for any user queries or jobs
• In some ways, this turned out to less important than we expected
• Limit Application Development hours
• Thus limited change to existing warehouse batch cycles, jobs, processes . . .
8

Implementation - Group Involvement
• DB2 Systems Team • Install, Configure and Troubleshoot
• DB2 DBAs• Work with each application to determine how to copy the data to IDAA
• Application Development• Help determine copy method and, potentially, support the copy process for their application
• Tiered Support • Operational Support
9

Initial Setup
• Install and configure • z/OS side IDAA software
• Data Studio Plugin
• DB2 maintenance for IDAA
• Connect IDAA to DB2
• Other installs • CDC (Change Data Capture)
• Fast Loader
10
Initial setup
What I wish I had learned 2 years ago:
• Implementing IDAA may change your DB2 maintenance strategy
• We have relied on an RSU* and HIPER approach for over a decade
• Including IDAA recommended DB2 maintenance may bring in newer fixes
• Each IDAA PTF level has corresponding DB2 PTFs
• Sourceid: IBM.DB2.AnalyticsAccelerator.V5R1
11
Initial setup – DB2 ZPARMs
• We implemented with:• ACCEL=AUTO
• Auto start the accelerator(s) at DB2 start
• ACCELMODEL=NO
• A value of YES can help determine workload that can benefit from IDAA
• GET_ACCEL_ARCHIVE=YES
• We do not use this at this time
• QUERY_ACCEL_OPTIONS=NONE
• NONE = offload standard SQL statements, use other settings with care
• QUERY_ACCELERATION=ENABLE_WITH_FAILBACK
• So what does failback mean? Queries that fail on IDAA during bind will fall back to DB2, other failures will result in query failure with no fall back to DB2
12

Initial setup
What I wish I had learned 2 years ago:
• A combination of ACCEL=COMMAND or AUTO and QUERY_ACCELERATION=NONE can be used to test query acceleration
• You can use various methods to set the CURRENT QUERY ACCELERATION special register to ALL to force queries to run in IDAA
Note: we did not utilize this (for the most part)
13
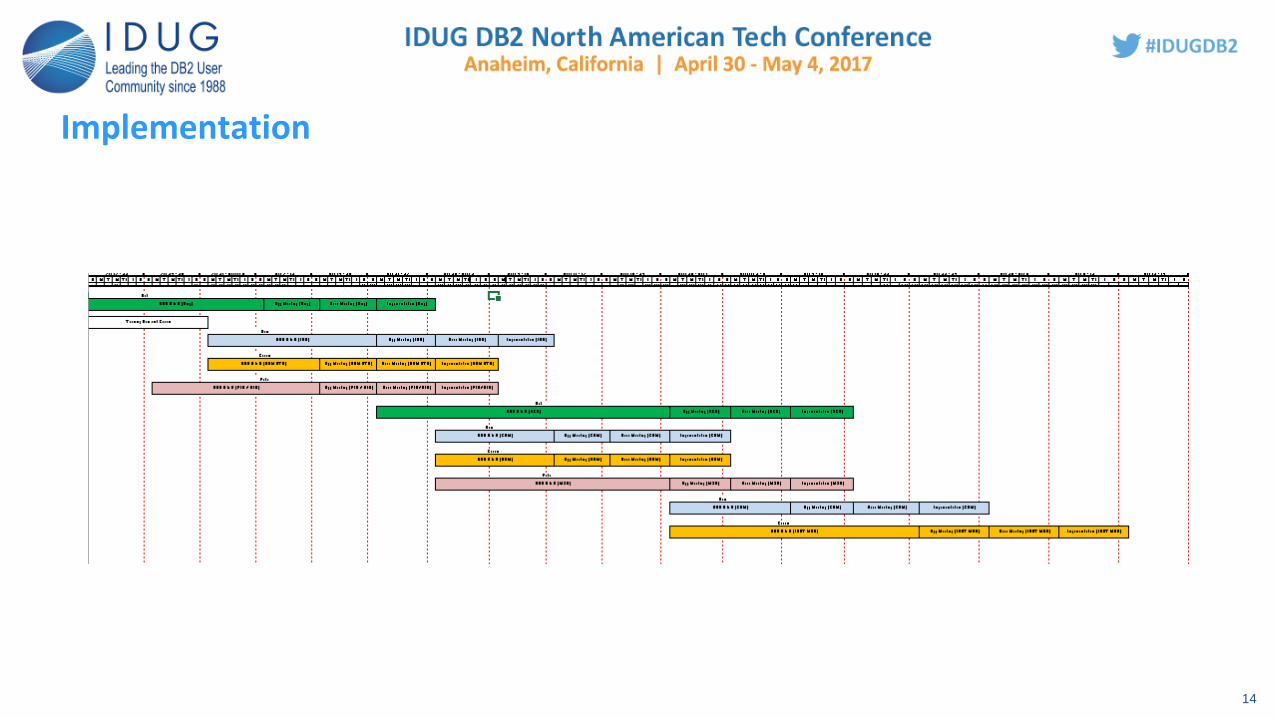
Implementation
14

Implementation - Copying data to IDAA
• There are three methods to copy data to IDAA
• The IDAA supplied stored procedures
• CDC – Change Data Capture
• Fast Loader
15
IDAA supplied stored procedures
• The IDAA supplied store procedures fit into three broad categories:
• IDAA maintenance and control
• Query IDAA information
• Table related
The Data Studio plugin uses all of these. However, you probably can’t manage your environment with Data Studio. The stored procedures also use XML.
16

Copying data to IDAA
What I wish I had learned 2 years ago:
• Regardless of the method that you use to copy data to IDAA always remember that it is a copy!
• May not be a huge concern if you use CDC
• How will you ensure that the data is in sync with DB2 ?
17

Progressive’s IDAA REXX Wrapper
• Our DBAs wrote a REXX wrapper in order to isolate the application developers from the stored procedure calls, to speed up our implementation and to automate certain administrative functions. The wrapper calls these stored procedures:• SYSPROC.ACCEL_ADD_TABLES
• SYSPROC.ACCEL_ALTER_TABLES
• SYSPROC.ACCEL_CONTROL_ACCELERATOR
• SYSPROC.ACCEL_GET_TABLES_DETAILS
• SYSPROC.ACCEL_GET_TABLES_INFO
• SYSPROC.ACCEL_LOAD_TABLES
• SYSPROC.ACCEL_REMOVE_TABLES
• SYSPROC.ACCEL_SET_TABLES_ACCELERATION
18

Progressive’s IDAA REXX Wrapper
• The wrapper uses the IDAA stored procedures to automate these functions:• LOAD
• LOAD_IF_CHG
• The most popular load option
• ENABLE
• DISABLE
• DETAIL
• REINIT
• Remove, Add and Load (preserves keys)
• REMOVE
• ADD
The wrapper supports wildcarding. Some options can be used in combination.19

Progressive’s IDAA REXX Wrapper
//JSTP001 EXEC PGM=IKJEFT01,DYNAMNBR=30,REGION=0M,
// PARM='DB2WRPR'
//SYSPROC DD DISP=SHR,DSN=OUR.REXXLIB
//BATCHIN DD *
ACCELNAME=IDAA
DB2=DB0Z
DISPLAY_XML_MSG
DISPLAY_INPUT=YES
SCHEMA=DB2PMB10
LOAD=DB2PMB10.%
ENABLE=DB2PMB10.%
END
20

IDAA and our Warehouse batch cycles
• We have approximately fifteen applications that copy data to IDAA
• Most of the applications use this approach to copy data to IDAA:
• Use the wrapper to Disable all their tables at the start of their cycle
• Combine LOAD_IF_CHG with Enable at the end of the cycle
• Some applications do not Disable, they just Load to IDAA at the end of their cycle
21

What I wish I had learned/considered 2 years ago:
• Do any of your applications use dynamic SQL, which may go to IDAA, as a part of their batch cycle ?
• Are you prepared for application batch cycle reruns or fixes ?
• How will you handle an extended IDAA outage ?
22

Challenges
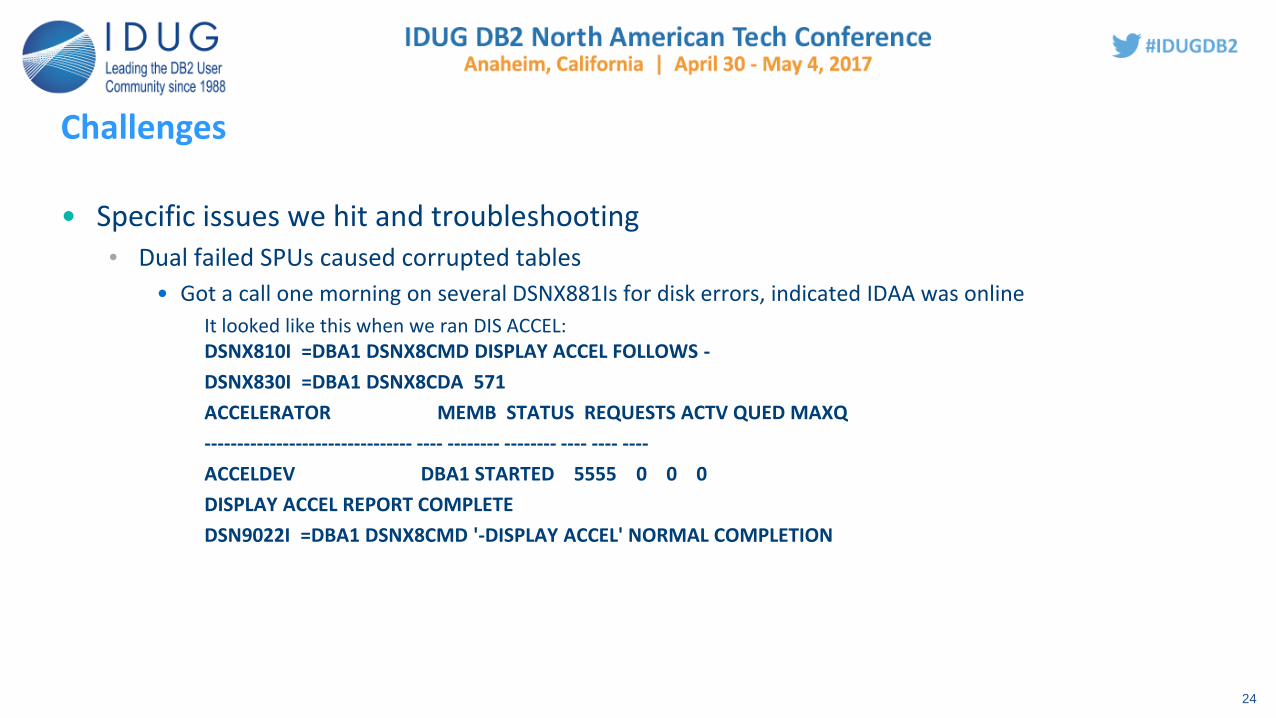
• Specific issues we hit and troubleshooting
• Challenges
23
Challenges
• Specific issues we hit and troubleshooting• Dual failed SPUs caused corrupted tables
• Got a call one morning on several DSNX881Is for disk errors, indicated IDAA was online
It looked like this when we ran DIS ACCEL:DSNX810I =DBA1 DSNX8CMD DISPLAY ACCEL FOLLOWS -
DSNX830I =DBA1 DSNX8CDA 571
ACCELERATOR MEMB STATUS REQUESTS ACTV QUED MAXQ
-------------------------------- ---- -------- -------- ---- ---- ----
ACCELDEV DBA1 STARTED 5555 0 0 0
DISPLAY ACCEL REPORT COMPLETE
DSN9022I =DBA1 DSNX8CMD '-DISPLAY ACCEL' NORMAL COMPLETION
24
Challenges (specific issues and troubleshooting)
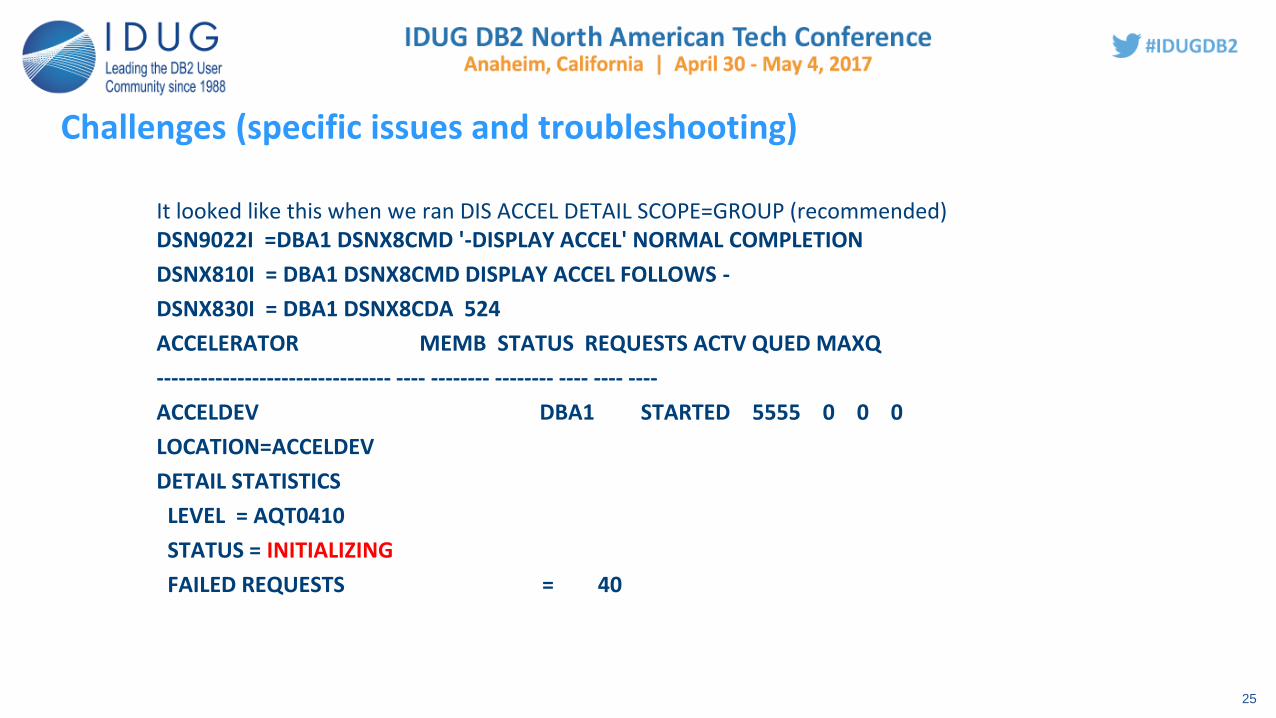
It looked like this when we ran DIS ACCEL DETAIL SCOPE=GROUP (recommended)DSN9022I =DBA1 DSNX8CMD '-DISPLAY ACCEL' NORMAL COMPLETION
DSNX810I = DBA1 DSNX8CMD DISPLAY ACCEL FOLLOWS -
DSNX830I = DBA1 DSNX8CDA 524
ACCELERATOR MEMB STATUS REQUESTS ACTV QUED MAXQ
-------------------------------- ---- -------- -------- ---- ---- ----
ACCELDEV DBA1 STARTED 5555 0 0 0
LOCATION=ACCELDEV
DETAIL STATISTICS
LEVEL = AQT0410
STATUS = INITIALIZING
FAILED REQUESTS = 40
25
Challenges (specific issues and troubleshooting)
• Caused entire accelerator to go down, into ‘initializing state’
• Failover did not work as multiple SPUs were hit
• Had to drop and re-add all affected tables within IDAA
• This issue only happened one other time as far as IBM knows
26

Challenges
• What I wish I had learned 2 years ago:
Make sure and document to do the display detail every time
27
Challenges (specific issues and troubleshooting)
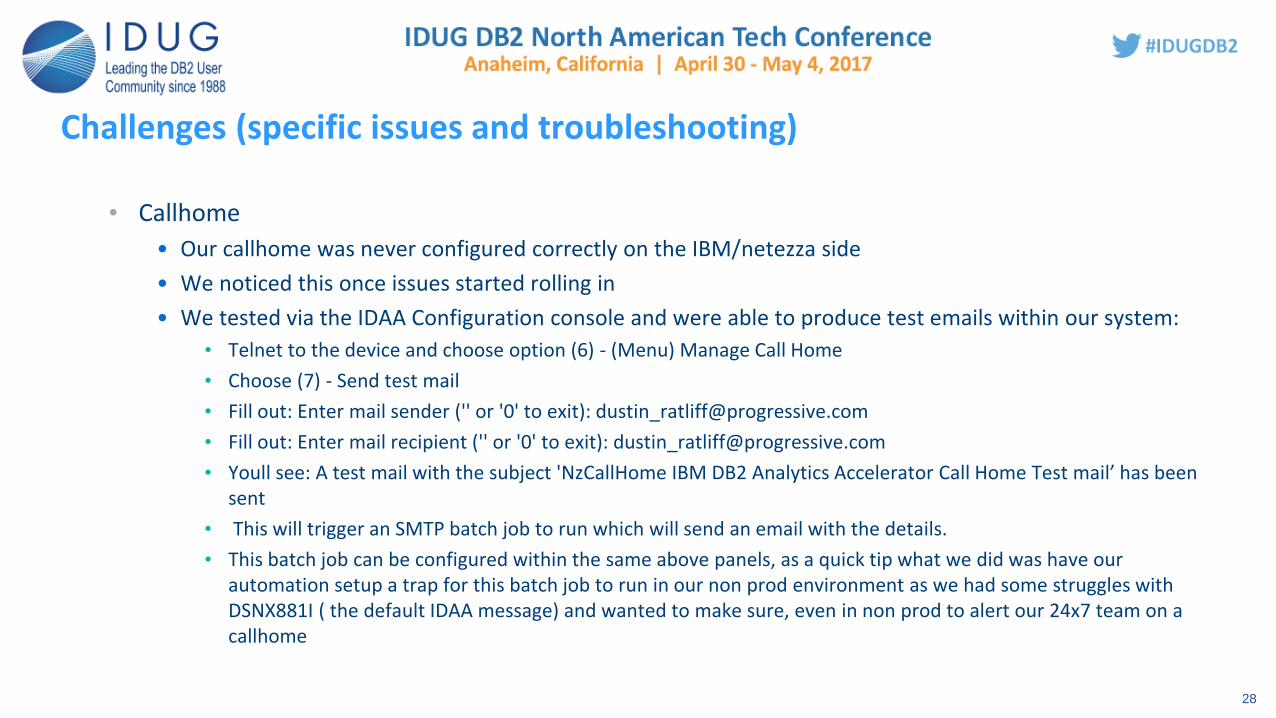
• Callhome
• Our callhome was never configured correctly on the IBM/netezza side
• We noticed this once issues started rolling in
• We tested via the IDAA Configuration console and were able to produce test emails within our system:
• Telnet to the device and choose option (6) - (Menu) Manage Call Home
• Choose (7) - Send test mail
• Fill out: Enter mail sender ('' or '0' to exit): [email protected]
• Fill out: Enter mail recipient ('' or '0' to exit): [email protected]
• Youll see: A test mail with the subject 'NzCallHome IBM DB2 Analytics Accelerator Call Home Test mail’ has been sent
• This will trigger an SMTP batch job to run which will send an email with the details.
• This batch job can be configured within the same above panels, as a quick tip what we did was have our automation setup a trap for this batch job to run in our non prod environment as we had some struggles with DSNX881I ( the default IDAA message) and wanted to make sure, even in non prod to alert our 24x7 team on a callhome
28

Challenges (specific issues and troubleshooting)
• In the end, we worked with IBM to resolve, need to do a ‘real’ test, not just the panel option as even though our test emails would work, when an issue happened IBM never got a PMR.
• Follow on HW problems
• Replaced 4 different disks
• Reseated 2 RPCs
• Replaced 2 DACs
29
Challenges
• What I wish I had learned 2 years ago:
Make sure and do a real test with the callhome functionality from the beginning
30
Challenges (specific issues and troubleshooting)
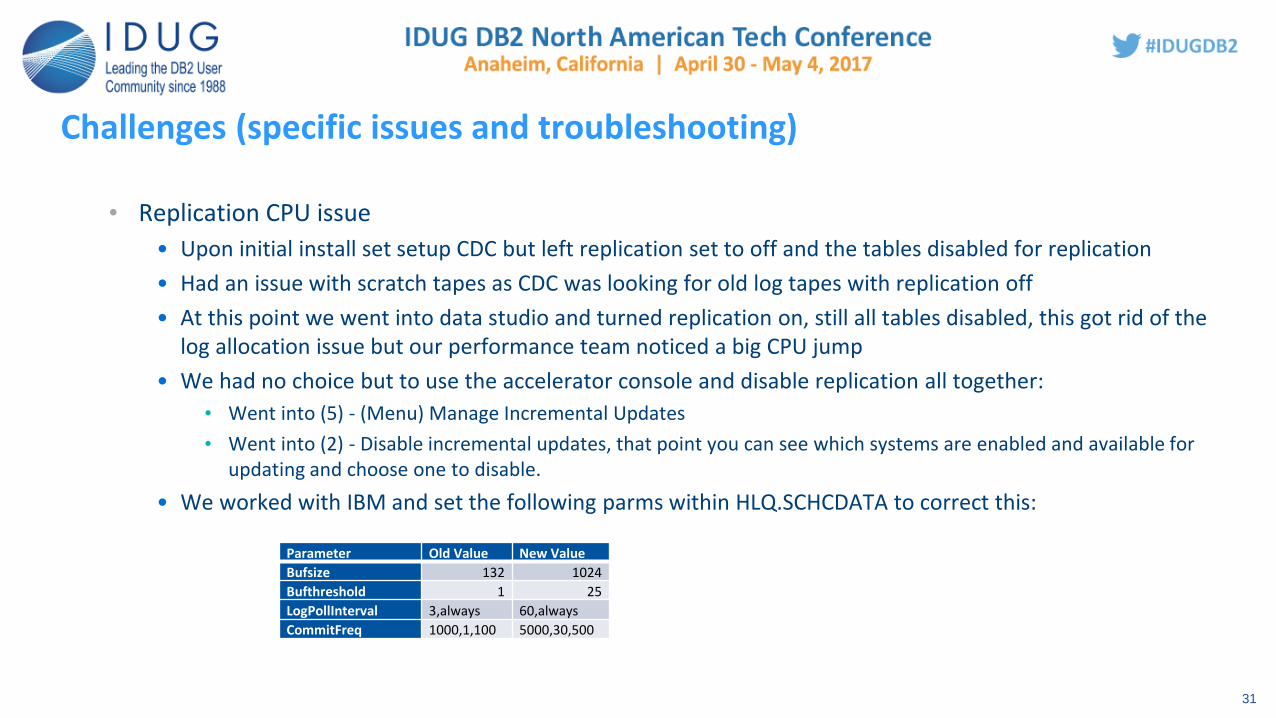
• Replication CPU issue
• Upon initial install set setup CDC but left replication set to off and the tables disabled for replication
• Had an issue with scratch tapes as CDC was looking for old log tapes with replication off
• At this point we went into data studio and turned replication on, still all tables disabled, this got rid of the log allocation issue but our performance team noticed a big CPU jump
• We had no choice but to use the accelerator console and disable replication all together:
• Went into (5) - (Menu) Manage Incremental Updates
• Went into (2) - Disable incremental updates, that point you can see which systems are enabled and available for updating and choose one to disable.
• We worked with IBM and set the following parms within HLQ.SCHCDATA to correct this:
31
Parameter Old Value New Value
Bufsize 132 1024
Bufthreshold 1 25
LogPollInterval 3,always 60,always
CommitFreq 1000,1,100 5000,30,500

Challenges
• What I wish I had learned 2 years ago:
The parms for replication.
32
Challenges (specific issues and troubleshooting)
• Run away queries
• We saw queries stacking up in the appliance, not running
• We ended up disabling all tables in IDAA until we found out what was happening
• Found out original big query took up all the temp space within IDAA, hence none after were running
• DSNX870I/DSNX871I (online, offline) during the day
• We saw these messages come out repeatedly during random times
• IBM recommended an upgrade to v5.1 to fix and in short term add a new table to IDAA to update its catalog
• Neither worked, still addressing this today
• Queries that get 904s and no diagnostic info
• We saw several queries getting 904s but would return no diagnostic information in the messages from IDAA
• Found eventually they were getting S04E, 00E70005
• Applied PI55807/UI37812 to resolve
33

Challenges
• What I wish I had learned 2 years ago:
A single set of queries can take the accelerator down.
Apply PI55807/UI37812
34
Challenges (specific issues and troubleshooting)
• Handful of queries that failed
• We also hit a handful of queries that failed in IDAA for various reasons due to lack of testing on our part
• Time sync not working
• We got these messages repeatedly (about once a day) from our non prod accelerator:DSNX881I ^DBA1 2000 W 42010 (2017-02-03 11:54:46 UTC) DEVIDAA(1.1.1.1.) Current reference times are not available and system time cannot by synchronized
• We found that since IDAA sits on a private network, that until a query is ran on it, the times cannot be synced.
• Within our non prod accelerator, we do not run queries every day so we had to think of a solution for this
• We ended up switching the time sync system from the IDAA config console by going to (3) - (Menu) Run Accelerator Functions
• Then go into (6) - Set the DB2 subsystem for time synchronization
• From there you can choose which system to use
• On the system we chose, we scheduled a query to run to fetch a small amount of data and keep the time in sync.
35
Challenges
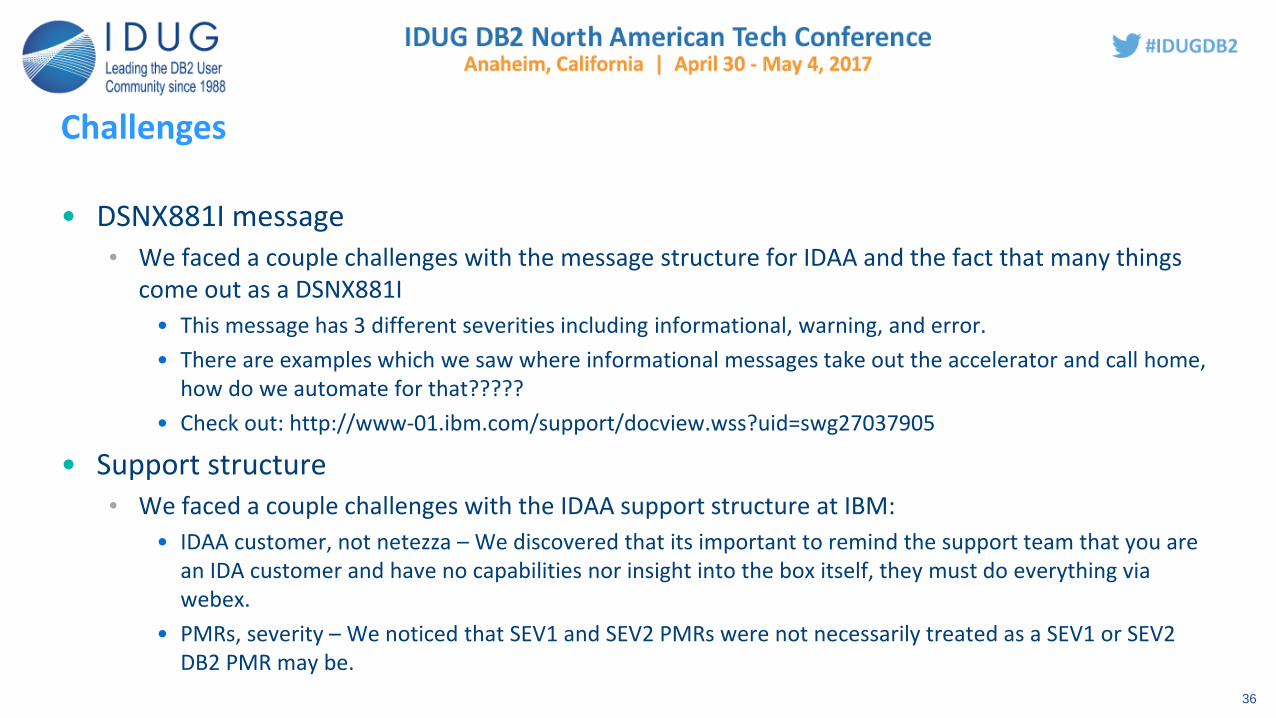
• DSNX881I message• We faced a couple challenges with the message structure for IDAA and the fact that many things
come out as a DSNX881I
• This message has 3 different severities including informational, warning, and error.
• There are examples which we saw where informational messages take out the accelerator and call home, how do we automate for that?????
• Check out: http://www-01.ibm.com/support/docview.wss?uid=swg27037905
• Support structure• We faced a couple challenges with the IDAA support structure at IBM:
• IDAA customer, not netezza – We discovered that its important to remind the support team that you are an IDA customer and have no capabilities nor insight into the box itself, they must do everything via webex.
• PMRs, severity – We noticed that SEV1 and SEV2 PMRs were not necessarily treated as a SEV1 or SEV2 DB2 PMR may be.
36
Challenges
• We also noticed that many times issues had to be looked at/resolved by the netezza teams rather than the L2 IDAA folks. The IDAA folks are the first to take a PMR.
• Our callhome – Through all of this our callhome was not functioning as mentioned before, we believe this added to our struggles as the support team wasn’t used to ‘manual’ PMRs being opened.
37
Challenges
• What I wish I had learned 2 years ago:
You really need to watch the DSNX881I message and how you automate around it (parse it out)
When engaging IBM, make sure they understand you are an IDAA customer and if necessary, there is some severity around the PMR.
38

Challenges
• Data capturing
• We found that we ran into a crossroads with digging into root cause analysis for the accelerator, due to a lack of default automatic data capturing, many times if we wanted to find RCA during an issue we had to leave IDAA offline until a netezza tech could webex in and gather the data needed.
• IDAA by default does capture data, it just does not save it
• There is a script which can be enabled which will store snapshots every couple minutes so you have some history of what was going on
• It is no additional overhead as again the data is being captured, but not saved
• The script automatically deletes old files
• Check out: https://developer.ibm.com/answers/questions/307363/what-is-monitorsh-script-in-pda-netezza/?sort=votes
39
Challenges
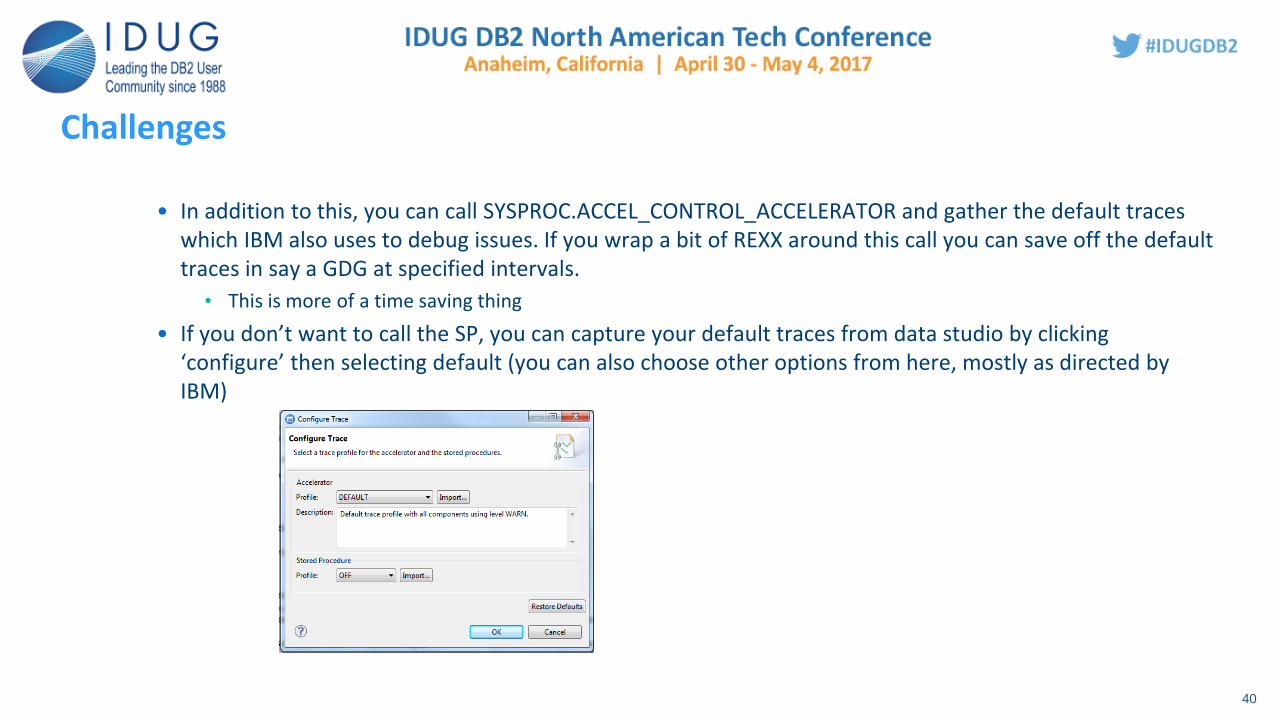
• In addition to this, you can call SYSPROC.ACCEL_CONTROL_ACCELERATOR and gather the default traces which IBM also uses to debug issues. If you wrap a bit of REXX around this call you can save off the default traces in say a GDG at specified intervals.
• This is more of a time saving thing
• If you don’t want to call the SP, you can capture your default traces from data studio by clicking ‘configure’ then selecting default (you can also choose other options from here, mostly as directed by IBM)
40

Challenges
• Once done, go back and click ‘save’
• Then select the options you want (we select them all)
• The output files tend to be big >1 GIG
• I save them to a network drive rather than local
• When I upload, I use IBM ECuREP from a virtual machine to upload
41

Challenges
• What I wish I had learned 2 years ago:
IDAA doesn’t save RCA data as a default
You can configure and save default traces in an automated way
42
Challenges
• Lack of visibility – Being an IDAA customer we have little to no capabilities within the box itself, IBM must do everything via webex.
• This stinks before, during, and after issues
• Cannot update parms
• Makes troubleshooting very hard
43
Monitoring
• DSNX881I
• We create incidents for all errors and most warnings
• Internal messages created by IFI READS of DB2 statistics
• Our in house monitor uses IFCID 2 to check the status of IDAA
• Incidents are created when IDAA is not available or has a bad status
• This can also be used to check on CDC
44

Monitoring
• After implementation, we wanted to have a “one stop shop” for non DBA interested parties to view information within IDAA.
• Also wanted to have a place to view query history (past however much you keep in IDAA)
• We developed our own “IDAA Dashboard”• A web interface open to all users where they can come and view information such as:
• Last load times of tables
• Any discrepancies in loads and data between IDAA versus DB2
• Query history (detailed and non detailed)
• This allowed us to keep the data studio install counts down and have an easy to use interface for application developers, etc.
• It also allowed us to keep the security tight on the IDAA stored procedures 45

Monitoring
46

Monitoring
• What I wish I had learned 2 years ago:
Its nice to have a dashboard which end users can go to for data
47
Monitoring
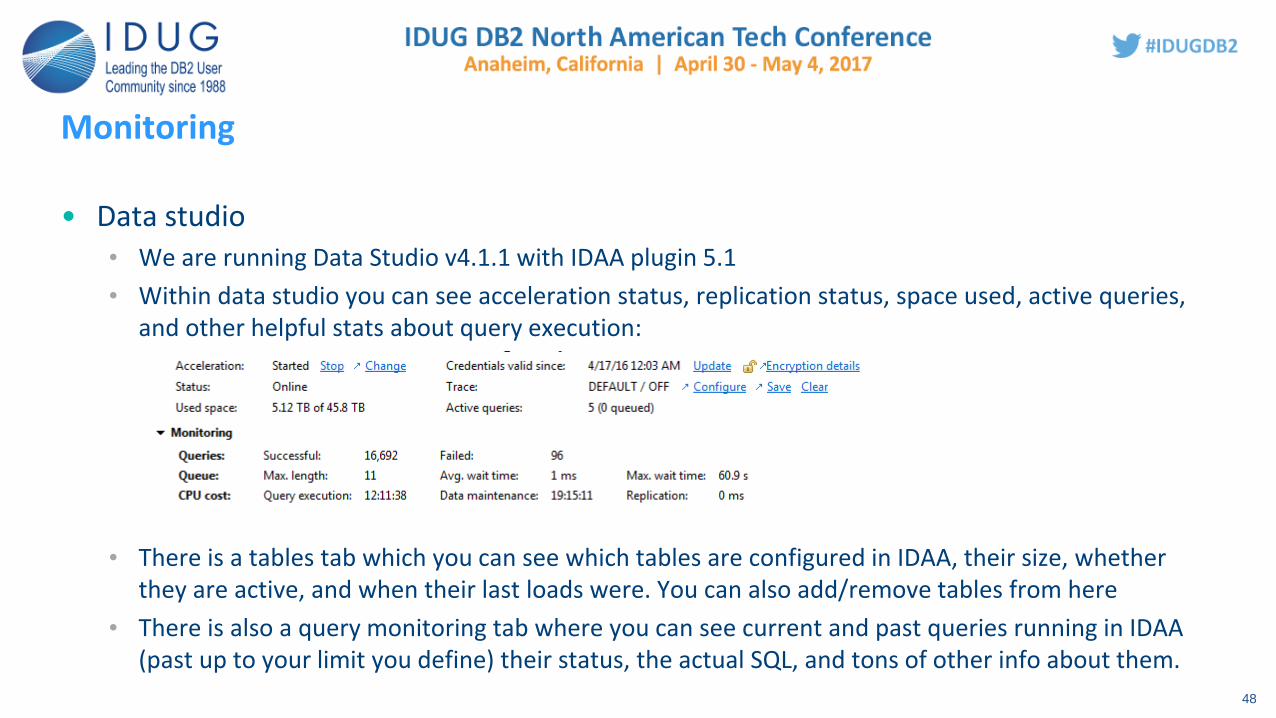
• Data studio• We are running Data Studio v4.1.1 with IDAA plugin 5.1
• Within data studio you can see acceleration status, replication status, space used, active queries, and other helpful stats about query execution:
• There is a tables tab which you can see which tables are configured in IDAA, their size, whether they are active, and when their last loads were. You can also add/remove tables from here
• There is also a query monitoring tab where you can see current and past queries running in IDAA (past up to your limit you define) their status, the actual SQL, and tons of other info about them.
48

Monitoring
• When you first connect to your data studio data source and click the accelerators folder, there is a button ‘monitor’ which appears:
• If you click this a message will appear indicating this is a tool in experimental stage
49
Monitoring
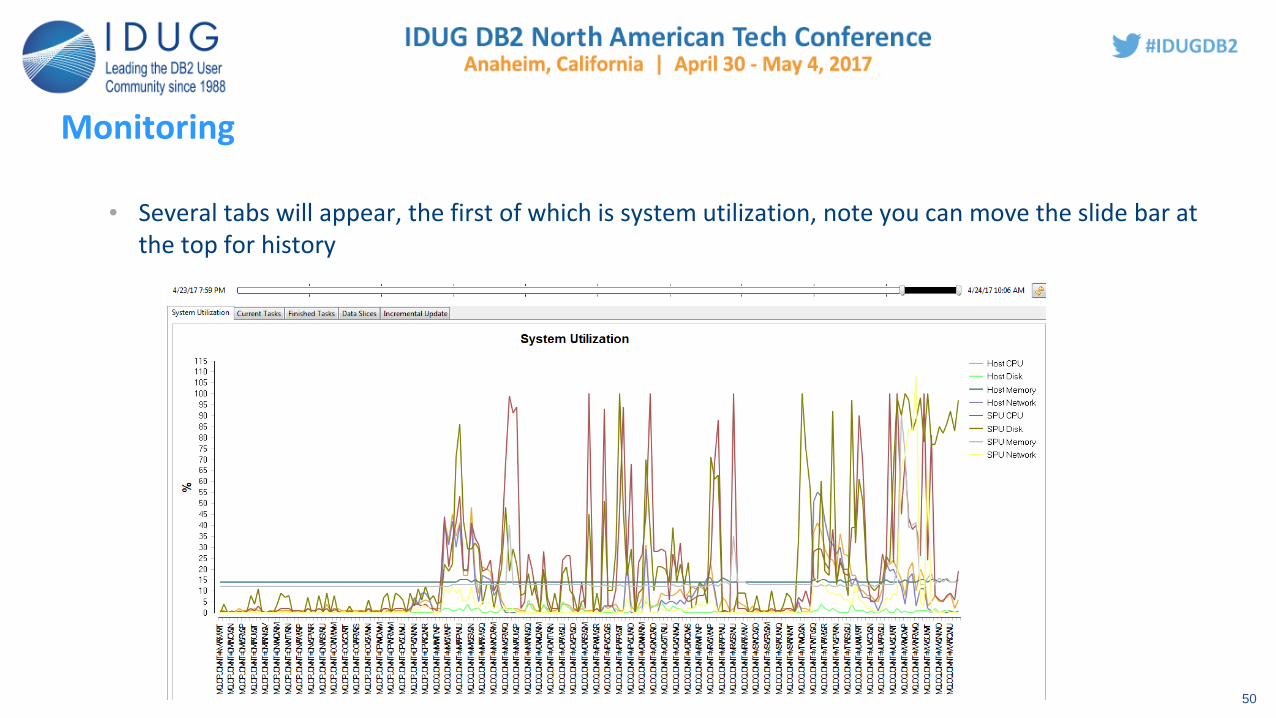
• Several tabs will appear, the first of which is system utilization, note you can move the slide bar at the top for history
50
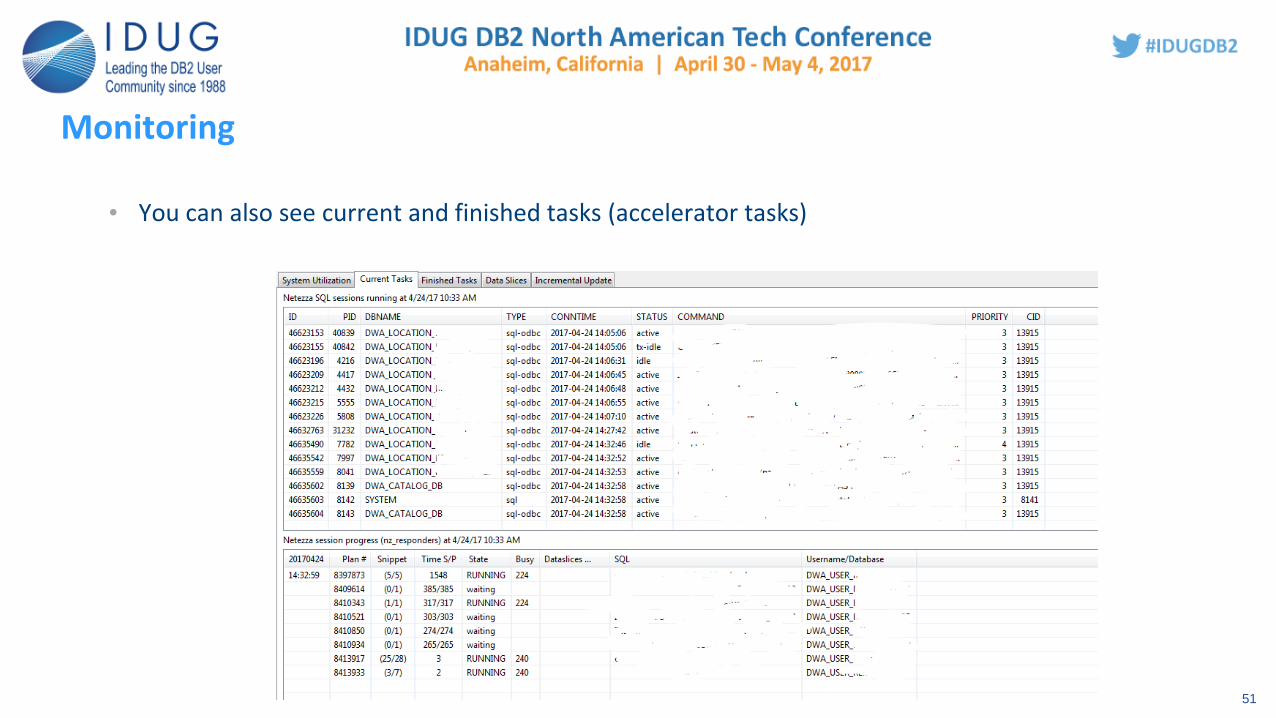
Monitoring
• You can also see current and finished tasks (accelerator tasks)
51

Monitoring
• Space used:
52

Monitoring
• What I wish I had learned 2 years ago:
There was this really cool monitoring interface from data studio!
53

Monitoring
• Default trace • You can actually break down the default trace .zip file
• From the windows side, once you have the zip file collected, start your zip software
• The first level within the zip file contains several files, the one you are interested in will be called accel-trace-datetime.tgz its also the biggest, drill into that one
54
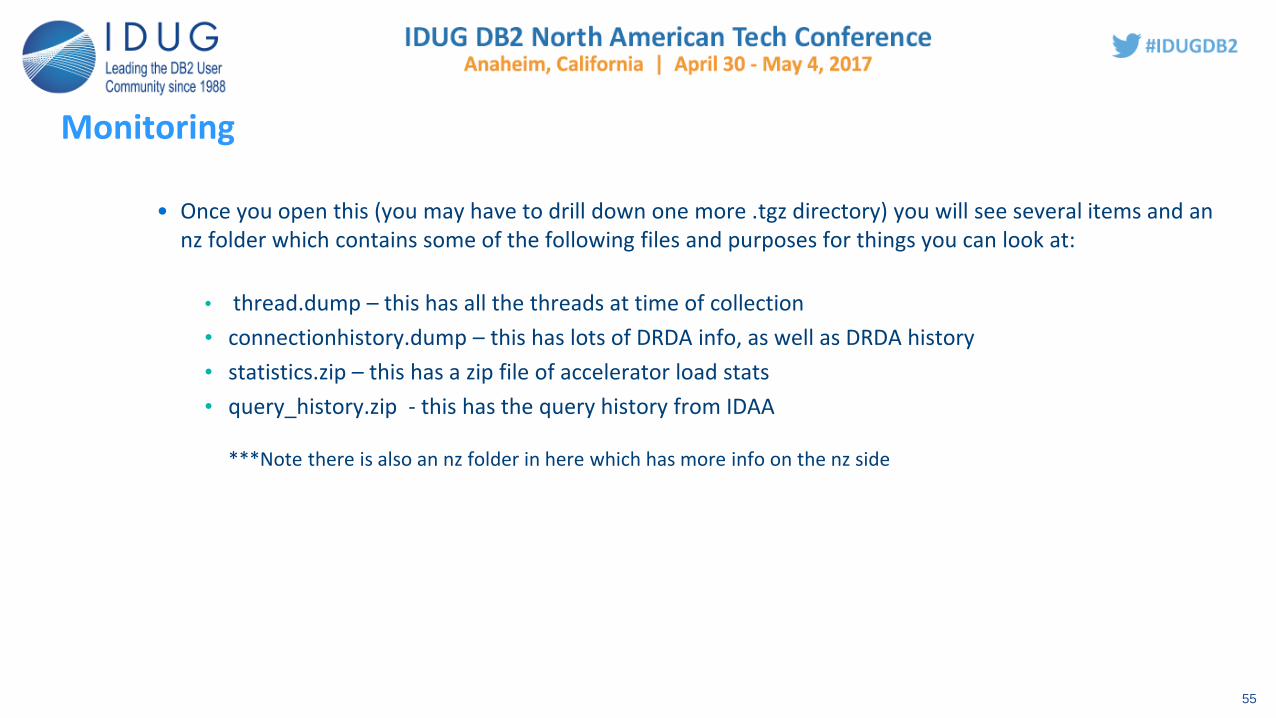
Monitoring
• Once you open this (you may have to drill down one more .tgz directory) you will see several items and an nz folder which contains some of the following files and purposes for things you can look at:
• thread.dump – this has all the threads at time of collection
• connectionhistory.dump – this has lots of DRDA info, as well as DRDA history
• statistics.zip – this has a zip file of accelerator load stats
• query_history.zip - this has the query history from IDAA
***Note there is also an nz folder in here which has more info on the nz side
55
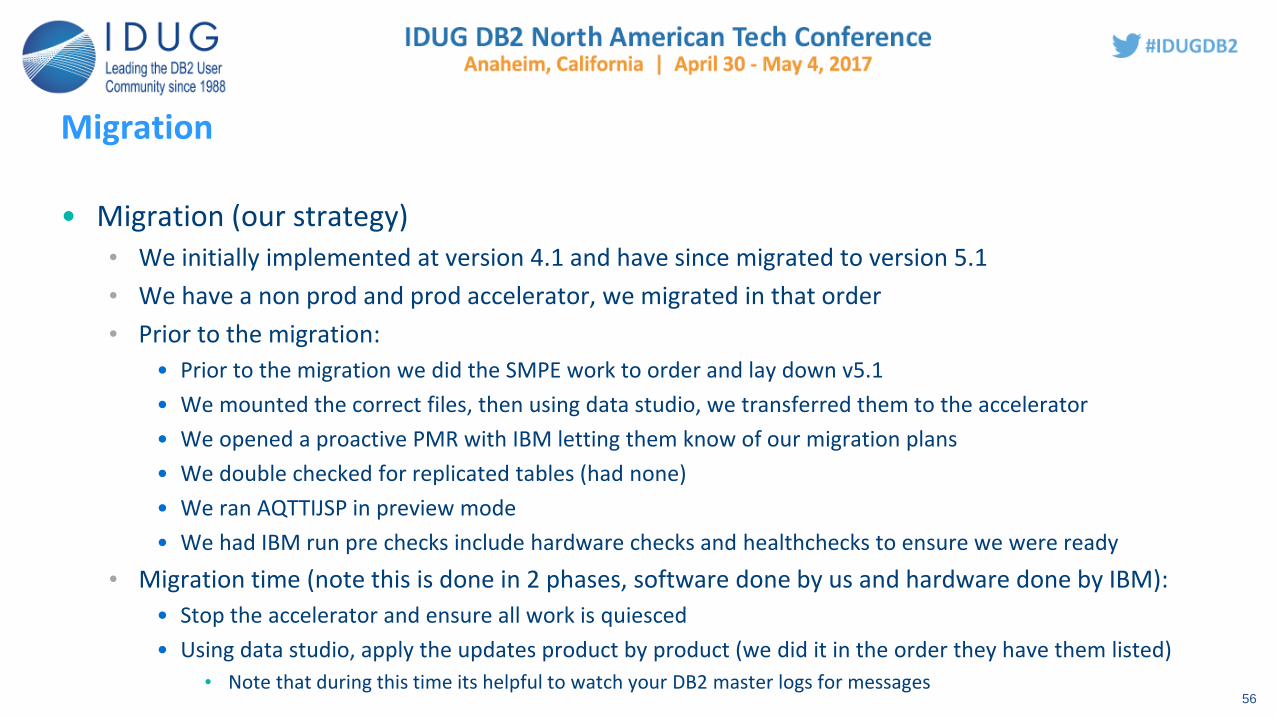
Migration
• Migration (our strategy)• We initially implemented at version 4.1 and have since migrated to version 5.1
• We have a non prod and prod accelerator, we migrated in that order
• Prior to the migration:
• Prior to the migration we did the SMPE work to order and lay down v5.1
• We mounted the correct files, then using data studio, we transferred them to the accelerator
• We opened a proactive PMR with IBM letting them know of our migration plans
• We double checked for replicated tables (had none)
• We ran AQTTIJSP in preview mode
• We had IBM run pre checks include hardware checks and healthchecks to ensure we were ready
• Migration time (note this is done in 2 phases, software done by us and hardware done by IBM):
• Stop the accelerator and ensure all work is quiesced
• Using data studio, apply the updates product by product (we did it in the order they have them listed)
• Note that during this time its helpful to watch your DB2 master logs for messages56

Migration
• Copy in the new IDAA loadlibs on z/OS
• Run AQTTIJSP
• Run binds/grants
• Restart IDAA
• Hardware upgrade:
• Have IBM run the nzhealthcheck before you get started
• Stop IDAA
• Allow IBM via webex to migrate both the HPF (one hour) and FDT (four hours)
• Start IDAA
• After the migration was over:
• Do what testing you can, add/remove tables, run queries, etc.
• Watch performance and monitor queries
57

Migration
• Migration timings we used:
• Began the SMPE work in early November 2016
• Gave IBM our timelines in early November (they need a 2 week lead time before you do a migration)
• Had IBM do pre-migration checks a week before both upgrades
• Did the non prod migration in late November
• Did the PROD migration in mid December (note we did the software and hardware upgrades in the same night)
58
Our users experience and our next steps
• user experience (our end users)
• ‘We love it!’
59
Enhancements
• There are a few things about IDAA that we would like to see changed
• The support interface
• We need more visibility into IDAA
• Streamline the IDAA maintenance process
60

What do we wish someone would have told us 2 years ago?
• Make sure and document to do the display detail every time
• Make sure and do a real test with the callhome functionality from the beginning
• The parms for replication.
• A single set of queries can take the accelerator down.
• Apply PI55807/UI37812
• You really need to watch the DSNX881I message and how you automate around it (parse it out)
• When engaging IBM, make sure they understand you are an IDAA customer and if necessary, there is some severity around the PMR.
• IDAA doesn’t save RCA data as a default
• You can configure and save default traces in an automated way61

What do we wish someone would have told us 2 years ago?
• Its nice to have a dashboard which end users can go to for data
• There was this really cool monitoring interface from data studio!
• Implementing IDAA may change your DB2 maintenance strategy
• A combination of ACCEL=COMMAND or AUTO and QUERY_ACCELERATION=NONE can be used to test query acceleration
• Regardless of the method that you use to copy data to IDAA always remember that it is a copy!
• Do any of your applications use dynamic SQL, which may go to IDAA, as a part of their batch cycle ?
• Are you prepared for application batch cycle reruns or fixes ?
• How will you handle an extended IDAA outage ?62
What did we cover?
• Progressive’s DB2 Configuration
• Initial setup and implementation
• Challenges
• Monitoring
• Migration
• Our user’s experience and our next steps
63
Questions?
• ?
64

Robert VargoDustin RatliffProgressive [email protected][email protected]
Things I wish someone had told me about IDAA two years ago
Please fill out your session
evaluation before leaving!


![[infographic] Top 28 things i wish someone had told me when i was an ad words beginner](https://static.fdocuments.us/doc/165x107/55c4b29dbb61eb322c8b4773/infographic-top-28-things-i-wish-someone-had-told-me-when-i-was-an-ad-words.jpg)