Thiel Logistik AG - logwin-logistics.com · 2 Company Profile Business: As an external partner,...
25
Thiel Logistik AG Investor Meetings Frankfurt – August 31, 2007
-
Upload
hoangxuyen -
Category
Documents
-
view
222 -
download
0
Transcript of Thiel Logistik AG - logwin-logistics.com · 2 Company Profile Business: As an external partner,...

Thiel Logistik AGInvestor Meetings Frankfurt –August 31, 2007

1
Agenda
New Management Structure
Market and Business Profile
Financial Review and Outlook –Half-Year Results 2007

2
Company ProfileBusiness: As an external partner, Thiel Logistik AG, develops holistic logistics and service solutions for
trade and industry. Its business segments are Solutions (customer-orientated contract logisticssolutions), Air & Ocean (global air and ocean freight forwarding activities) and Road & Rail(land and special transportation activities in Central, Western and Eastern Europe).
Founded: 1985 in Luxembourg
Revenue: 1,891.4 mn. €in 2006 (+2.8% vs. 2005)
Employees: 8,500 worldwide at more than 350 sites in 43 countries
Listing: Frankfurt Stock Exchange (ISIN: LU0106198319, German SIN: 931705, TGH)
Major Shareholder: DELTON AG, Bad Homburg (50.26%)
MarketCap: Approx. 300 mn. €
Key Developments 2007§ Increase of net sales in all three business segments
§ Further improvement in operating earnings
§ With the start of the new management structure on July 1, Thiel Logistik has become an integrated logistics group
§ Targets for management teams: to enlarge strengths, resolve weaknesses, improve efficiency
3
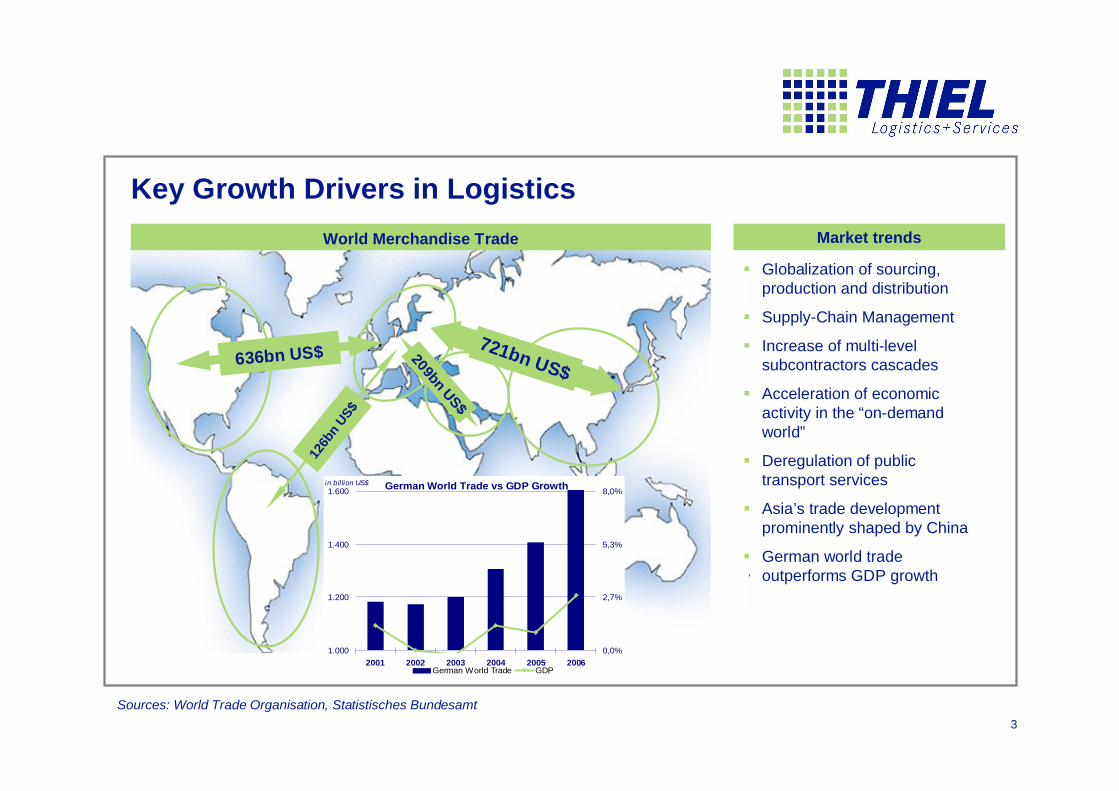
126b
n U
S$721bn US$
209bn US$
Key Growth Drivers in Logistics
Sources: World Trade Organisation, Statistisches Bundesamt
German World Trade vs GDP Growth
1.000
1.200
1.400
1.600
2001 2002 2003 2004 2005 2006
in bil lion US$
0,0%
2,7%
5,3%
8,0%
German World Trade GDP
636bn US$
World Merchandise Trade
§ Globalization of sourcing, production and distribution
§ Supply-Chain Management
§ Increase of multi-level subcontractors cascades
§ Acceleration of economic activity in the “on-demand world”
§ Deregulation of public transport services
§ Asia’s trade development prominently shaped by China
§ German world trade outperforms GDP growth
Market trends

4
Focus on Air & Ocean Expansion of Network and Growth
Key Trends Thiel Market Position
§ Organization of inter-continental air and ocean transports combined with value-added services and freight management solutions generates operating margins above 3 percent
§ Global network with 88 offices plus partner-ships
§ Member of purchasing alliances to bundle purchasing power (FUTURE, Group 99)
§ Globalization of sourcing activities continues and will increasingly be supplemented by increasing demand from emerging markets
§ Importance of and demand for intercontinental management of supply chains will increase and generate significant efficiency gains
§ High importance of container shipping for international cargo and increasing importance of air-freight market due to specific performance characteristics (e.g. short lead-times)
Thiel Strengths
§ Highly advanced IT solutions allow integrated handling of processes
§ Long-standing presence in East Asia has been developed in a lasting competitive advantage
§ Focus on medium-sized business customers mirrors own strong corporate culture with high degree of loyalty

5
Focus on SolutionsExtension and Growth
Key Trends Thiel Market Position
§ Strong market positions and expertise in selected industries based on special networks (Media, Fashion, Steel, Food)
§ Range of customer-specific solutions with highly innovative solutions (Red Bull, Subway, ZF etc.)
§ High share of asset-light business models with high level of integration into customer processes and conceptual logic
§ Specialized demand for logistics services resulting from individualization of customer needs
§ Complex solutions require high degree of reliability, reactivity and also cost efficiency
§ Co-ordination activities across the supply chains of market participants will generate significant benefits
§ Long-standing customer relations, partially resulting from successful spin-offs
§ High level of industry-specific knowledge and tools which allow back-/forward-integration in supply chains of customers
§ Special equipment and infrastructure creating additional barriers of entry (e.g. garment on hanger transportation)
§ Global link via Air & Ocean network
Seed
Raw materialTransport optimization
to manufacturerQuality control
Transport optimization
Combination of components
Deliveryto POS
Disposal
• Broker of Supply Chain• Quality control, compliance, fashion logistics• Inventory control system, POTrack, SC simulation
Manufacturer/ Producer
Processedmaterials
Thiel Strengths

6
ThielHome
regions
Sales Orientation
§ Shift of production towards Eastern Europe will continue
§ Economic growth in emerging markets will outpace Western
European growth rates
§ Demand for sophisticated logistics services and
transport connection will rise significantly
§ Thiel general network activities in Eastern Europe with unique standards and wide coverage (Top 3)
§ Long-standing Eastern European expertise with 57 sites in 14 countries
§ Establishment of an Intra-Eastern Europe network
Focus on Road & RailIntegration of Network based on strength in Eastern Europe
Key Trends Thiel Market Position
Thiel Strengths
§ Network activities serve as platform for solutions currently performed in Western Europe mainly
§ Entering new markets in former GUS
§ Cost leadership by standardization
§ Activities provide strong link in East-West traffic (road and inter-modal)

7
Agenda
New Management Structure
Market and Business Profile
Financial Review and Outlook –Half-Year Results 2007

8
Evolution of Management and Organizational Structure
until 2002 2003-2005 starting July 2007
Numerous
acquisitions in
contract logistics
and freight
forwarding
Formation of
segments based
on legal entities
Re-Organization of
segments based on
business
processes
Addition of
Centers of
Competence and
shared services
2006
9
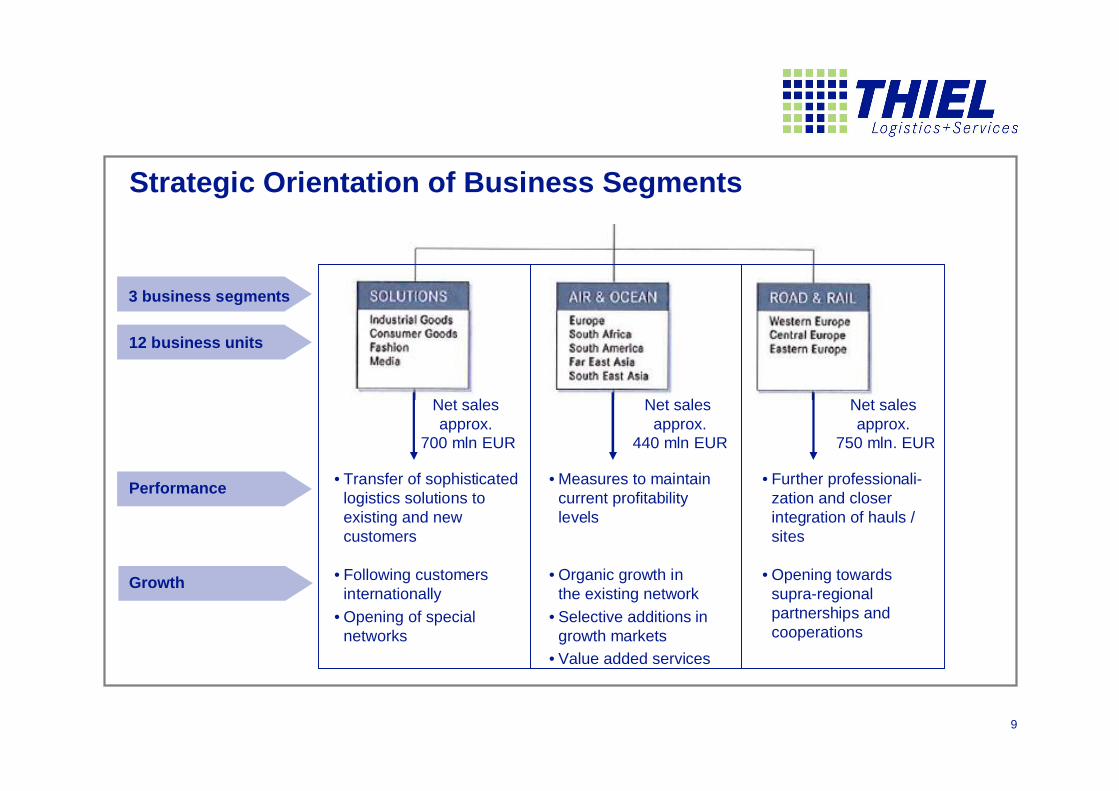
Strategic Orientation of Business Segments
•Transfer of sophisticated logistics solutions to existing and new customers
•Following customers internationally
•Opening of special networks
•Further professionali-zation and closer integration of hauls / sites
•Opening towards supra-regional partnerships and cooperations
•Measures to maintain current profitability levels
•Organic growth inthe existing network
•Selective additions ingrowth markets
•Value added services
Performance
Growth
Net sales approx.
700 mln EUR
Net sales approx.
440 mln EUR
Net sales approx.
750 mln. EUR
12 business units
3 business segments

10
Efficient and Effective Division of Tasks and Responsibilities
Responsibility to manage the Thiel Group
•Bundling of similar business processesin business segments
•Integration of alike regional and industry-oriented logistics, IT and pur-chasing processes in the business segments
Logistics services provision, innovation and professional approach towards customer solutions and land transportation
Bundling of administrative functions

11
Thiel Executive Committee
*1954
Chairman of Thiel Board of Directors since 2002;CEO of DELTON AG since 1999
Previously:Managing Director atLafarge Group and Mast-Jägermeister AG
Berndt-Michael Winter
CEO
Dr. Antonius Wagner
CFO
* 1961
Vice-Chairman of ThielBoard of Directors since 2002;CFO of DELTON AGsince 2002
Previously:Management Positions atBosch Group and LafargeGroup
Klaus Hrazdira
COO Solutions
* 1963
Executive Member ofThiel Board of Directorssince 2006;CEO of QuehenbergerGroup since 2003;
Previously:Managing Director at US Logistics GroupExpeditors
*1965
CEO of Birkart Globistics air + ocean since 2007
Previously:Regional Director Kühne + Nagel;Executive Vice President Oceanfreight Schenker
Helmut Kaspers
COO Air & Ocean
*1961
CEO of Thiel FashionLifestyle since 2006
Previously:Managing Director Birkart Globistics;Managing Director System Alliance
Detlef Kükenshöner
COO Road & Rail
12
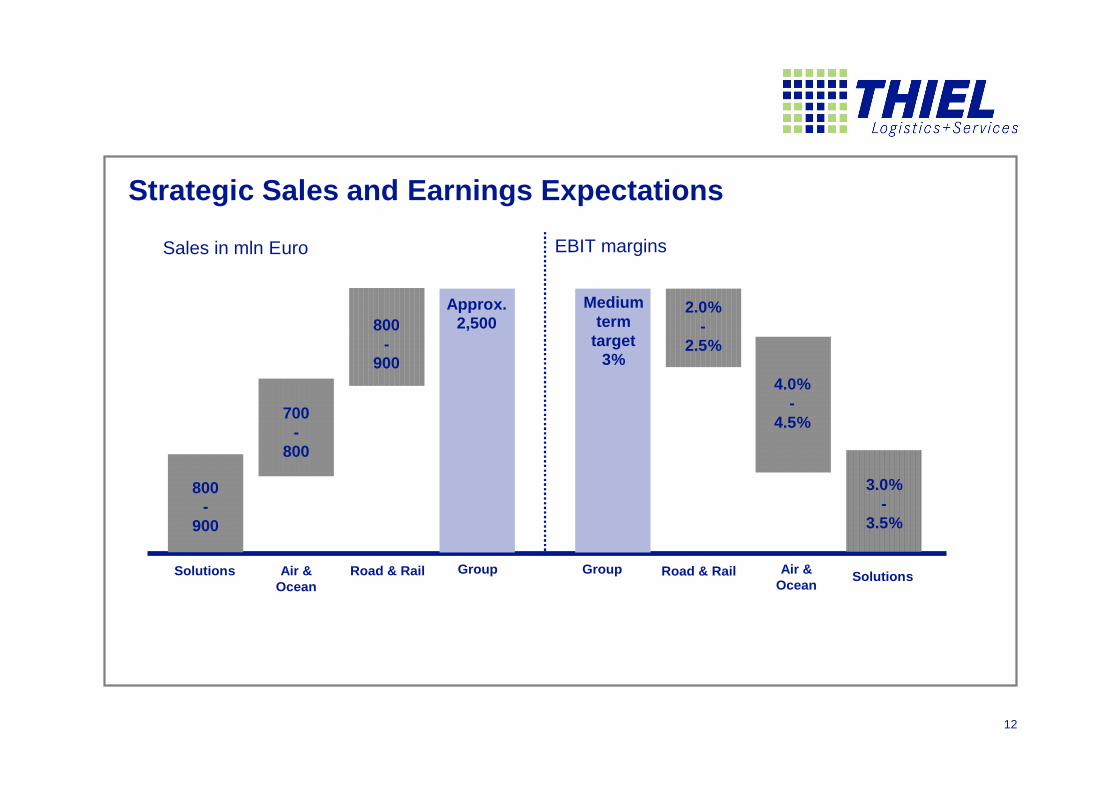
Strategic Sales and Earnings Expectations
Solutions Air & Ocean
Road & Rail Group
700-
800
Sales in mln Euro
SolutionsAir &
OceanRoad & RailGroup
4.0%-
4.5%
2.0%-
2.5%
3.0%-3.5%
EBIT margins
800-
900
800-
900
Approx.2,500
Medium term
target 3%
3.0%-
3.5%
13
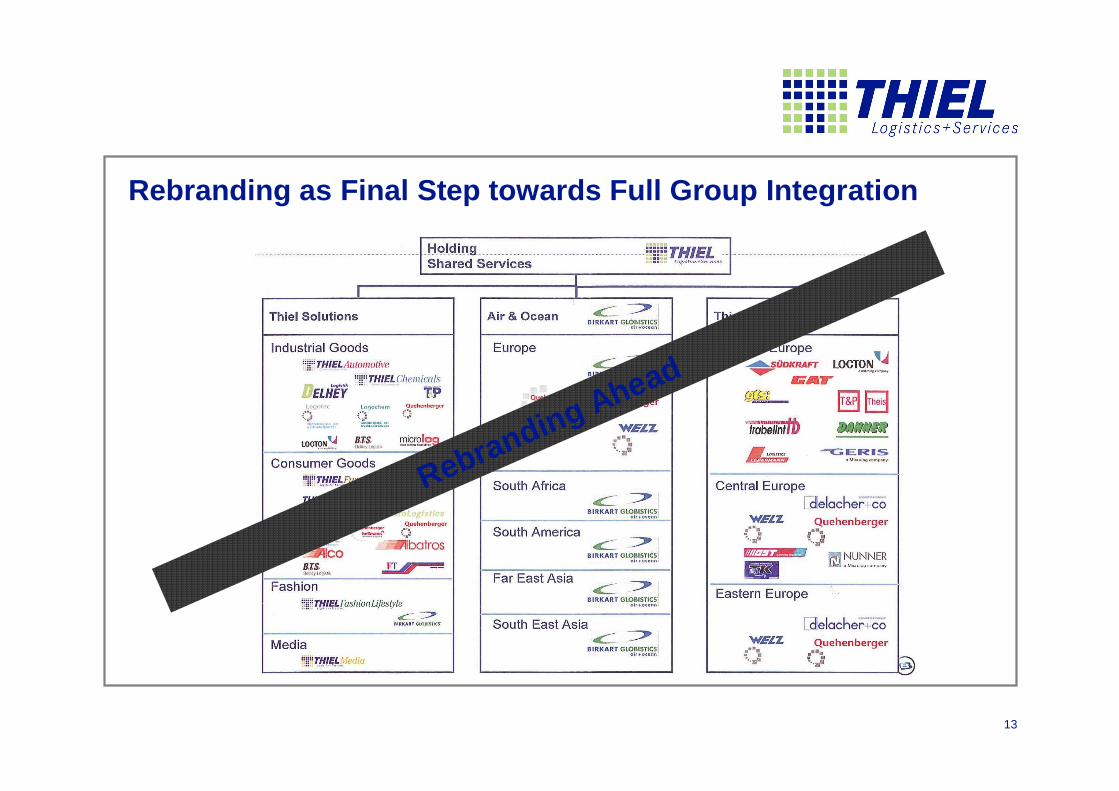
Rebranding as Final Step towards Full Group Integration
Rebranding Ahead
14
Agenda
Financial Review and Outlook –Half-Year Results 2007
Market and Business Profile
New Management Structure

15
HY 2007 –Key Financials
(EUR in million)
n/a2.7-5.1n/a6.0-9.7Operating Cash Flow
2.7
0.9
6.0
6.0 1.4%
445.1
2006
n/a-8.2n/a2.5-22.8Net Cash Flow
Cash Flow
n/a0.012.1%4.24.7Net Result
-26.3%4.5-0.1%16.416.4EBIT
-17.9%5.01.0%
9.4%16.41.8%
18.01.8%
EBIT before Restructuring CostsEBIT-Margin
Earnings
10.8%493.48.5%922.51,000.9Net Sales
Δin %2007
Δin % 20062007
Half-Year 2nd Quarter

16
HY 2007 –Sales Analysis
(EUR in million)
Net salesHY 2006
SignificantCustomer
Project Lossese.g. FAG/INA
AcquisitionsConsolidations
Additional Growth
Net salesHY 2007
-20.3
1,000.9
17.2
85.0
-3.5
Exchange Rate Effects
~~
922.5
9.2 %
17
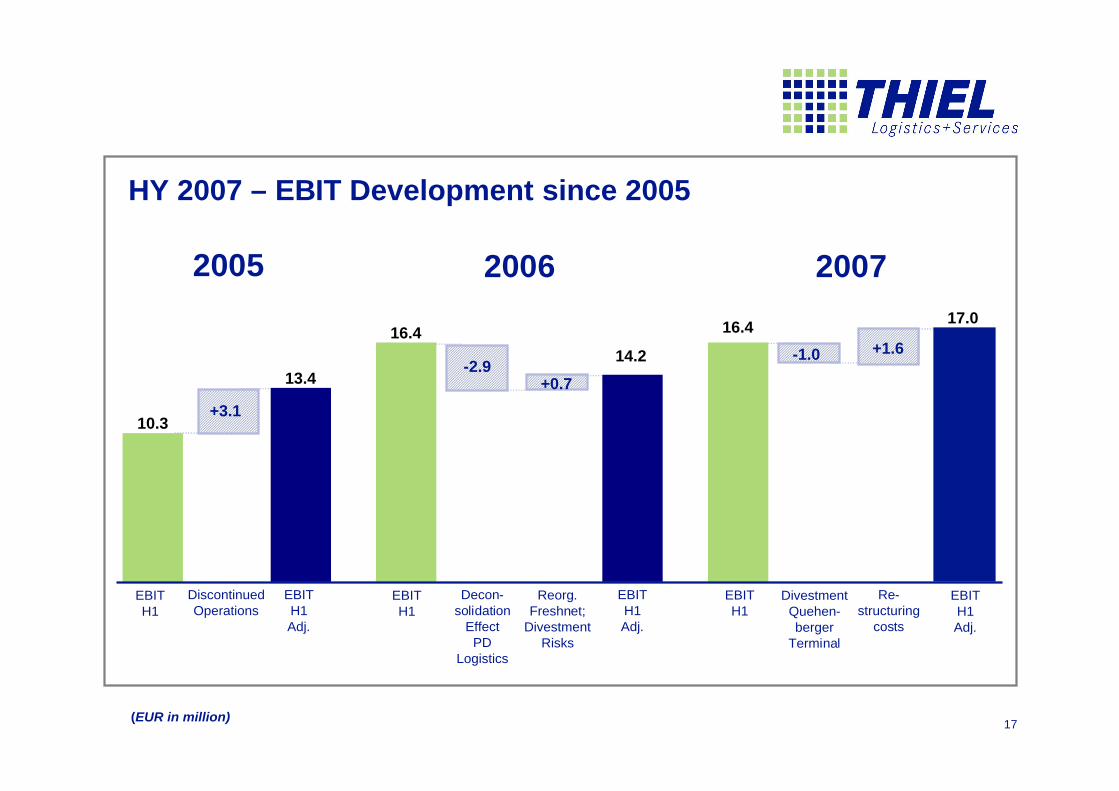
HY 2007 –EBIT Development since 2005
(EUR in million)
2005 2006 2007
EBIT H1
Decon-solidation
EffectPD
Logistics
EBIT H1 Adj.
16.4
EBIT H1
DivestmentQuehen-berger
Terminal
EBIT H1 Adj.
16.417.0
EBIT H1
EBIT H1 Adj.
10.3
DiscontinuedOperations
13.4
+3.1
-2.9+0.7
14.2
Reorg. Freshnet;
DivestmentRisks
Re-structuring
costs
-1.0 +1.6

18
HY 2007 –Segment ReportingIndustry
Solutions Air & Ocean Regional Logistics Services
(EUR in million) Proceeds from the disposal of PD Logistics (3.1 million euros)
Sales
203.7197.3
206.9
178.7
589.9546.5
500
12
10
8
6
4
Segment Result
2006 2007
4.42.5
8.06.4
8.9
11.6
2006 2007 2006 2007
20072006 2007 2006 20072006
400
300
200
100
2
600
+3.3%+15.7%
+7.9%
195.1159.5
528.8
2.34.3
9.4
2005 2005 2005
2005 2005 2005

19
HY 2007 –Income Statement
(EUR in million)
10.3%-3.9-4.38.9%-7.9-8.6Interest Expenses, net
-87.4%-1.2-0.2-26.2%-4.2-3.1Income Taxes
n/a--0.5n/a--1.6Restructuring Costs
0.9
6.01.4%
-30.2
34.2
-109.4
-301.567.7%
445.1
2006
n/a0.012.1%4.24.7Net Result
-17.9%5.01.0%
9.4%16.41.8%
18.01.8%
EBIT before Restructuring Costs% of Net Sales
7.9%-32.63.7%-61.4-63.6SG&A
6.3%36.46.6%73.878.7Gross Profit
2.8%-112.5-3.8%-233.9-224.9Other Cost of Sales
14.3%-344.569.8%
13.4%-614.866.6%
-697.369.7%
Purchased Services% of Net Sales
10.8%493.48.5%922.51,000.9Net Sales
Δin %2007
Δin % 20062007
Half-Year 2nd Quarter

20
HY 2007 –Balance Sheet
76.883.7Other Assets
278.5285.7Goodwill
223.9220.4Intangible and Fixed Assets
913.1939.2Total
270.1310.4Trade Accounts Receivable
63.839.0Cash and Cash Equivalents
FY
2006
HY
2007Assets
126.1126.3Bonds Payable
321.1325.6Shareholders’Equity
138.8149.2Other Liabilities, Provisions
238.5248.6Trade Accounts Payable
43.7
44.9
47.0
42.5
Financial LiabilitiesLeasing Liabilities
913.1939.2Total
FY
2006
HY
2007
Liabilities and
Shareholders’Equity
(EUR in million)

21
HY 2007 –Working Capital Development*
(EUR in million)
27.3
Change in Accounts
Receivable
40.3
Change in Accounts Payable
Change inInventories
Change in Other Assets
Change in Working Capital
-10.1
-6.33.4
Growth Effects
- Change in IT-Systems- Invoicing Backlogs- Reorganization
(Early Payments)
Change in Customer
Projects and in Supplier Base
* as against December 31, 2006

22
HY 2007 –Cashflow Statement
-2.4%-6.6-6.42.9%-7.1-7.3Interest Payments
-2.8
-7.9
-3.7
2.5
-3.4
-0.2
3.6
-8.7
6.0
-11.3
-4.5
33.2
2006
n/a
-73.8%
n/a
n/a
n/a
n/a
-52.7%
16.1%
n/a
n/a
29.7%
-0.6%
Δin %
-7.9
-1.5
1.7
-8.2
-3.1
-1.3
1.3
-2.8
-5.1
-7.6
-4.1
12.5
2007
-2.0
-2.1
0.1
2.7
0.0
1.1
2.6
-4.7
2.7
-0.7
-2.2
14.4
2006
n/a-22.8Net Cash Flow1)
n/a-19.9Free Cash Flow2)
-25.2%-2.1Cash Flow from Financing Activities
n/a2.8Changes in Bank Borrowings
n/a-13.1Cash Flow from Investing Activities
-4.5
1.7
-10.2
-9.7
-27.9
-5.8
33.0
2007
n/aAcquisitions
n/aOperating Cash Flow
n/aChanges in Working Capital
-50.5%Divestments
-39.6%Capital Expenditure
-89.2%Income Tax Payments
-13.2%EBITDA
Δin %
1) Net Cash Flow = Operating Cash Flow –Cash Flow from Investing Activities2) Free Cash Flow = Operating Cash Flow –Capital Expenditure
(EUR in million)
Half-Year 2nd Quarter

23
Outlook
n Continued growth trend strengthened by organic revenue increase
n Continuous EBIT improvement targeted with margin goal of three percent:
n Elimination of remaining weaknesses / restructuring (mainly Road & Rail)
n Efficient organisation and lean processes
n Shift of sales mix towards Solutions and Air & Ocean business
n Main risk to improvement in net result 2007 is the insolvency of Thiel Furniture‘s main customer Schieder Group

Thiel Logistik AGInvestor Meetings –August 31, 2007