Thickener performance variability: underflow solids concentration … · The reliability of the...
12
Paste 2017, Beijing, China 29 Thickener performance variability: underflow solids concentration and flowrate Behnam Pirouz ATC Williams, Australia Sadegh Javadi ATC Williams, Australia Keith Seddon ATC Williams, Australia Abstract The operational fluctuations of tailings thickeners have the potential to cause significant impacts on the tailings transport system and the tailings deposition at a tailings storage facility (TSF). The statistical analysis of actual recorded data of underflow solids concentration and flowrate of different thickeners is presented in this paper. The collected data are from the operation of four different mines; one Zinc-lead, two Copper and one Gold mine. The variability in these two important parameters can be related to process fluctuations, design or construction defects including instrumentation and controls, the variability in mine orebody during the life of the project or operation of the thickener. The analysis of the data shows that the actual performance of the thickener can be significantly different from what is usually considered at the design stage. An example is presented to show the impacts of thickener performance variability on tailings transport system and thickened tailings beach slope quantitatively. 1 Introduction Almost all mineral processing plants utilize some type of tailings thickener for water recovery from tailings before disposal into the TSF. Thickening improves the site overall water management, may improve the utilization of the TSF storage, and in some of the cases reduces the overall tailings transport costs due to a reduction in volumetric slurry flowrate. The decision about the type, size and location of tailings thickener is usually taken during the early stages of study and design of the project based on the site requirements. The size and number of the thickeners are usually determined by laboratory test work and based on cost analysis. The laboratory tests work for thickener sizing which is usually undertaken by the thickener supplier also provides other important information such as expected achievable (design) underflow solids concentration, optimum flocculant type and dosage, feedwell dilution etc. The expected underflow solids concentration is probably one of the most important parameters in the design of the thickener. If this is not achieved during the actual operation of the thickener, it can have a significant adverse impact on the entire tailings and water management system of the mine. The sample(s) selected for the laboratory testing and thickener design should preferably be representative https://papers.acg.uwa.edu.au/p/1752_04_Pirouz/
Transcript of Thickener performance variability: underflow solids concentration … · The reliability of the...

Paste 2017, Beijing, China 29
Thickener performance variability: underflow solids
concentration and flowrate
Behnam Pirouz ATC Williams, Australia
Sadegh Javadi ATC Williams, Australia
Keith Seddon ATC Williams, Australia
Abstract
The operational fluctuations of tailings thickeners have the potential to cause significant impacts on the
tailings transport system and the tailings deposition at a tailings storage facility (TSF).
The statistical analysis of actual recorded data of underflow solids concentration and flowrate of different
thickeners is presented in this paper. The collected data are from the operation of four different mines; one
Zinc-lead, two Copper and one Gold mine.
The variability in these two important parameters can be related to process fluctuations, design or
construction defects including instrumentation and controls, the variability in mine orebody during the life of
the project or operation of the thickener.
The analysis of the data shows that the actual performance of the thickener can be significantly different from
what is usually considered at the design stage.
An example is presented to show the impacts of thickener performance variability on tailings transport system
and thickened tailings beach slope quantitatively.
1 Introduction
Almost all mineral processing plants utilize some type of tailings thickener for water recovery from tailings
before disposal into the TSF. Thickening improves the site overall water management, may improve the
utilization of the TSF storage, and in some of the cases reduces the overall tailings transport costs due to a
reduction in volumetric slurry flowrate.
The decision about the type, size and location of tailings thickener is usually taken during the early stages of
study and design of the project based on the site requirements. The size and number of the thickeners are
usually determined by laboratory test work and based on cost analysis.
The laboratory tests work for thickener sizing which is usually undertaken by the thickener supplier also
provides other important information such as expected achievable (design) underflow solids concentration,
optimum flocculant type and dosage, feedwell dilution etc.
The expected underflow solids concentration is probably one of the most important parameters in the design
of the thickener. If this is not achieved during the actual operation of the thickener, it can have a significant
adverse impact on the entire tailings and water management system of the mine.
The sample(s) selected for the laboratory testing and thickener design should preferably be representative
https://papers.acg.uwa.edu.au/p/1752_04_Pirouz/
30 Paste 2017, Beijing, China
of different zones of the orebody throughput the life of the mine. Special care and caution needs to be taken
in selecting the sample for thickening testing to make sure that the mining plan for the life of the project is
considered.
The reliability of the thickener design is heavily dependent on the previous experience of the thickener
designer/supplier.
Thickeners that are designed properly with sufficient contingencies and conservatism should be able to
deliver the design target underflow solids concentration as an average figure over time, but nevertheless
fluctuations of the thickener underflow solids and flowrate are inevitable.
The fluctuations of these two important parameters can be attributed to reasons including:
The variability in mine orebody during the life of the project not being considered adequately in the
design.
Design or construction defects.
Thickener control instrumentation not being adequate or not working properly.
Poor or varied operation of the thickener.
For one or more than one of the above listed reasons the fluctuations of the thickeners’ underflow solids
concentration and flowrate are observed in the actual operation of the thickeners. The impacts of this must
be adequately addressed in the design of the mine tailings disposal system.
Two areas of the TSF system which are directly affected by the thickener underperformance are:
Slurry transport system.
Tailings beach slope.
Failure to address the variability of thickener performance at the design stage can result in reduction of
overall water recovery of the mine, failure of the tailings transport system which creates a bottleneck in the
operation of mine tailings disposal system, and concavity in tailings beach at the TSF which reduces the
storage capacity at Down Valley Discharge (DVD) and Central Thickened Discharge (CTD) schemes.
2 Background
Seddon and Fitton (2011) first presented statistical data on the performance of thickeners in conjunction
with considerations of beach slope concavity. The application of thickener performance data in stochastic
modelling of tailings beach geometry (i.e. beach slope and concavity) was presented by Seddon et al. (2015).
Both of these papers include some proposals on how to quantify the variability of thicker underflow solids
concentration and flowrate, based on the limited available recorded data from thickeners performance.
A survey of thickener underflow and solids concentration variability was presented by Chryss (2014), also
using a statistical analysis method. Different statistical distributions fit were examined on the collected data
from different thickeners operation. The aim was to find similarities between thickener underflows based on
ore type, thickener type or diameters. The author concluded that this was not successful, either due to the
small number of thickeners examined or the stronger effect of the way sites operate thickeners.
More data from the operation of different type thickeners has become available since the previous studies.
The actual range of variations for solids concentration and flowrate for different type thickeners are analysed
and discussed in this paper and recommendations are provided for TSF design purposes.
However, this should not be confused with the necessary caution required in sampling and rigorous
laboratory thickening testing during the design, to ensure that the expected range of variation in orebody
during life of the mine is sufficiently covered.
Paste 2017, Beijing, China 31
3 Collected data and methodology for analysis
Tailings solids concentration and flowrate data are collected from four different mines with different ore
types and different thickening arrangements. Table 1 below presents information about the thickeners and
the mines where the data was collected. For purposes of comparison, data from a site where the tailings are
not thickened have been included.
Table 1 Mines and thickeners information
Mine
ID Ore type
Plant
throughput
(Mtpa)
SG Thickener
type
Thickener
diameter
(m)
Number of
thickeners
Design
U/F solids
(%)
Duration
of record
1 Zinc-lead 1 3.11 No
thickener N/A 0 30 12 Months
2 Gold 1 2.79 High-
Rate* 24 1 60 5 Months
3 Copper 14 2.80 High-Rate 45 2 45 5 Months
4 Copper 32.5 2.81 Paste 24 12 59 2 Months
*Note: High-Rate with modified feedwell
The collected data have been recorded with the following frequencies for each mine:
Mine 1 – One record every 12 hr – converted to average daily.
Mine 2 – One record every 1 hr – converted to average daily.
Mine 3 – One record every 2 hr – converted to average daily.
Mine 4 – One record every 1 min – converted to average daily.
The data from Mine 3 was collected from only one of the operating High-Rate thickeners. For Mine 4 the data
was collected from four different operating paste thickeners; thickeners No.2, 6, 8 and 11.
It should be noted that the original data were in the form of simultaneous records of flowrate and slurry
density which has been converted into the daily average mass flowrate (t/hr) (i.e. total daily tonnage/24 hr)
and average daily underflow solids concentration (%).
It is considered likely that if the data were to be analysed for the actual short sampling intervals of the original
records, that even greater variability would be observed. In this paper the data has been converted to
24 hours records to enable direct comparison with previous work (Seddon and Fitton, 2011). A future paper
is planned to consider the variability displayed by shorter term sampling intervals.
It should also be noted that Mine 2 in this paper is the same as one of the sites originally analysed by Seddon
and Fitton (2011). However the data relate to a different period of operation, and for the purposes of this
paper have been treated as separate records.
Depending on the mining plan and site operational conditions a certain level of variability is always expected
in process plant daily operation regardless of whether the plant uses a tailings thickener or not. This is due
to variability in daily throughput, the ore type and grade, the effort and time required in the grinding circuit,
differences between operators and shifts, and probably numerous other variables.
To analyze and evaluate these types of variations, the first mine listed in Table 1 does not use any type of
tailings thickener. The tailings come out the process plant as a 30% solids slurry which is pumped directly to
the TSF.
It is usually expected that the tailings thickener to have a buffering effect in damping the instantaneous
fluctuations from the process plant due to its reasonable storage capacity. This is further analyzed in this

32 Paste 2017, Beijing, China
paper.
The preliminary assessment of the recorded data indicates that the underflow solids concentration is
essentially independent of the tailings mass flowrate. This can be seen in plots presented in Figure 1 below.
Figure 1(a) is for a High-Rate thickener and Figure 1(b) is from a paste thickener. This supports similar
observations made by Seddon and Fitton (2011), and Seddon et al. (2015).
Figure 1 Thickener underflow solids concentration and mass flowrate plot; (a) Mine 3 High-Rate thickener; (b)
paste thickener
Statistical characteristics including Max, Min, Mean, Median, Standard Deviation (S.D.) and Coefficient of
Variability (C.V.) have been estimated for each of the recorded data sets. For comparing the spread or
variability over different distributions, the coefficient of variation (C.V.) is used, where C.V. = standard
deviation/mean. This is effectively a “normalised” parameter, which is independent of the magnitude of the
values which are incorporated in the mean and standard deviation terms.
The cumulative probability distribution for the collected underflow solids concentration and mass flowrate
data are estimated and compared to Gaussian (Normal) distribution function. Normal distributions are
formulated in terms of a mean and a standard deviation. The selection of normal distribution was due to the
simplicity of the formulation and use, although other distributions could be used.
To be able to compare the data from different mines, the recorded data from each site has been normalized
with respect to the mean value of the data series. By doing so, the recorded data series will be converted to
data series with an average value of one and Standard Deviation (S.D.) = Coefficient of Variability (C.V.).
The probability distributions of the collected data normalized by the above method are plotted for all of the
High-Rate thickeners and also all of the Paste thickeners in separate graphs for purposes of comparison.
4 Variability of process plant without tailings thickener
The data collected from Mine 1 have been statistically analysed to assess the variability of the solids
concentration and mass flowrate from a process plant without a thickener. The statistical properties of the
recorded data are presented in Table 2.
Paste 2017, Beijing, China 33
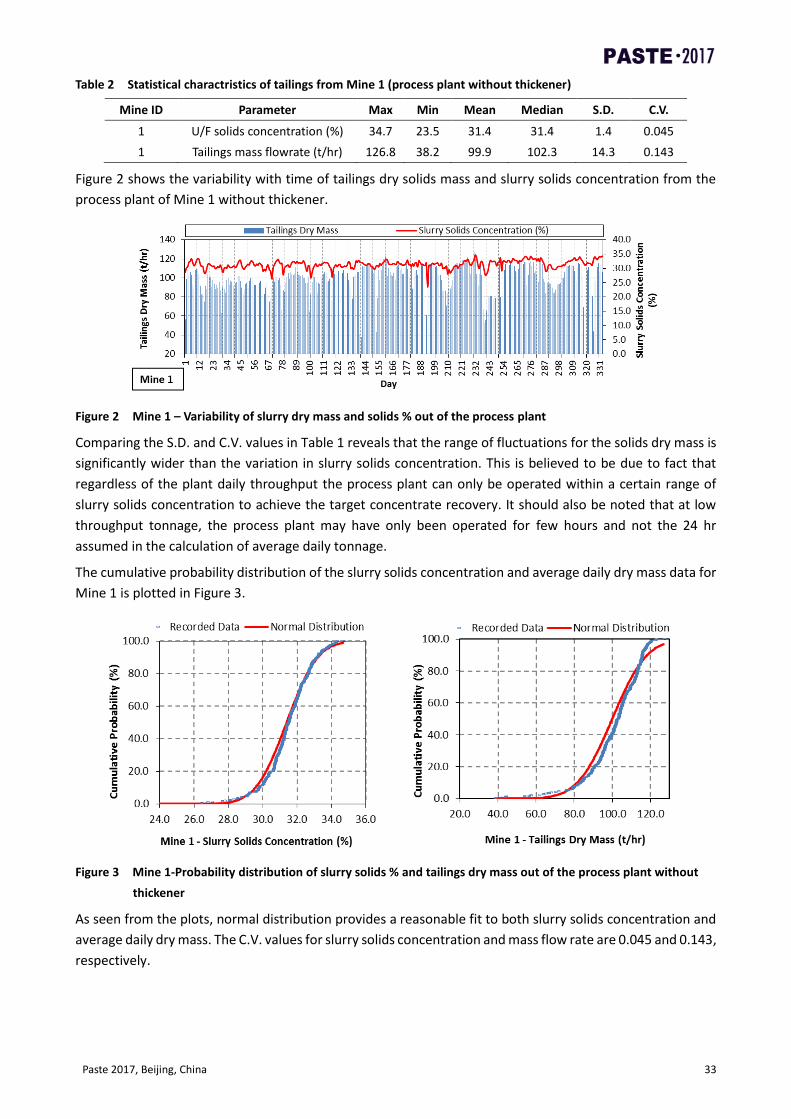
Table 2 Statistical charactristics of tailings from Mine 1 (process plant without thickener)
Mine ID Parameter Max Min Mean Median S.D. C.V.
1 U/F solids concentration (%) 34.7 23.5 31.4 31.4 1.4 0.045
1 Tailings mass flowrate (t/hr) 126.8 38.2 99.9 102.3 14.3 0.143
Figure 2 shows the variability with time of tailings dry solids mass and slurry solids concentration from the
process plant of Mine 1 without thickener.
Figure 2 Mine 1 – Variability of slurry dry mass and solids % out of the process plant
Comparing the S.D. and C.V. values in Table 1 reveals that the range of fluctuations for the solids dry mass is
significantly wider than the variation in slurry solids concentration. This is believed to be due to fact that
regardless of the plant daily throughput the process plant can only be operated within a certain range of
slurry solids concentration to achieve the target concentrate recovery. It should also be noted that at low
throughput tonnage, the process plant may have only been operated for few hours and not the 24 hr
assumed in the calculation of average daily tonnage.
The cumulative probability distribution of the slurry solids concentration and average daily dry mass data for
Mine 1 is plotted in Figure 3.
Figure 3 Mine 1-Probability distribution of slurry solids % and tailings dry mass out of the process plant without
thickener
As seen from the plots, normal distribution provides a reasonable fit to both slurry solids concentration and
average daily dry mass. The C.V. values for slurry solids concentration and mass flow rate are 0.045 and 0.143,
respectively.

34 Paste 2017, Beijing, China
5 High-Rate thickener performance variability
The recorded data from Mines 2 and 3 High-Rate thickeners are presented in Figure 4. As seen from the plots,
the fluctuations of the solids concentration and mass dry tonnage for Mine 2 which uses a modified High-
Rate thickener are lower in comparison to Mine 3 with a normal High-Rate thickener. The cause of these
differences could not be determined.
Figure 4 Mines 2 and 3-Variability of slurry dry mass and slurry solids % for High-Rate thickeners
The cumulative probability of the recorded data from the High-Rate thickeners of Mines 2 and 3 are
compared to normal distributions in Figures 5 and 6.
Figure 5 Mines 2-Probability distribution for slurry solids % and tailings dry mass for High-Rate thickeners
The normal distribution curves provides a reasonable fit for solids concentration data, but as it is recognized
the data for solids dry mass is asymmetrical, and the normal distribution does not provide a particularly good
fit. It is possible to try to fit a different mathematical distribution to these data (i.e. one incorporating a
skewed distribution). However for the purposes of this paper an approach based on a “two-tailed” normal
distribution has been adopted to improve the normal fit. This uses the same mean value for the upper and
lower distributions, but a larger standard deviation for the more skewed lower data.

Paste 2017, Beijing, China 35
Figure 6 Mines 3-Probability distribution for slurry solids % and tailings dry mass for High-Rate thickeners
The “two-tailed” normal distributions for dry mass data are also plotted in Figures 5 and 6. The statistical
properties of the recorded data and normal distribution fits parameters are presented in Table 3.
Table 3 Statistical charactristics of tailings from Mines 2 and 3 (High-Rate thickener)
Mine ID Parameter Max Min Mean Median S.D. C.V.
2 U/F solids concentration (%) 64.3 52.3 61.6 61.5 1.4 0.023
3 U/F solids concentration (%) 52.1 33.4 44.2 44.9 3.1 0.071
2 Tailings mass flowrate (t/hr) 499.6 402.1 471.7 476.6 20.2 (24, 14) 0.043 (0.051, 0.029)
3 Tailings mass flowrate (t/hr) 979.0 333.4 783.7 807.6 109.1(115, 90) 0.139 (0.146, 0.114)
In an attempt to find a unified normal distribution fit for underflow characteristics of High-Rate thickeners,
the data from Mines 2 and 3 are normalized with respect to the mean values of the data series and replotted
in Figure 7.
Figure 7 Replot of the normalized recorded data from Mines 2 and 3
As is observed from the plots, even after normalization, the distributions of the recorded data from the two
sites are so different that fitting one unified distribution to the data is not practical. For both mines the
normal distribution provides a reasonable fit to the underflow solids concentration data while the “two-tailed”
normal distribution better predicts the dry mass probability.
6 Paste thickener performance variability
The recorded data from four paste thickeners in Mine 4 are plotted in Figure 8.
0.0
20.0
40.0
60.0
80.0
100.0
400.0 500.0 600.0 700.0 800.0 900.0 1,000.0Cu
mu
lati
ve P
rob
abili
ty (
%)
Mine 3 - Tailings Dry Mass (t/hr)
Rec. Data Nor. Dist. T.T. Nor. Dist.

36 Paste 2017, Beijing, China
Figure 8 Mine 4 – Variability of slurry dry mass and solids concentration for paste thickeners
The statistical parameters for the data series of the four paste thickeners are presented in Table 4.
Table 4 Statistical charactristics of tailings from Mines 4 (paste thickener)
Mine ID Thickener No. Parameter Max Min Mean Median S.D. C.V.
Mine 4 Th.No2 U/F solids concentration (%) 64.3 52.3 61.3 61.3 1.87 0.031
Mine 4 Th.No6 U/F solids concentration (%) 62.9 56.8 59.5 59.0 1.49 0.025
Mine 4 Th.No8 U/F solids concentration (%) 62.6 55.6 58.7 58.6 1.52 0.026
Mine 4 Th.No11 U/F solids concentration (%) 64.5 55.7 59.4 55.4 1.78 0.030
Mine 4 Th.No2 Tailings mass flowrate (t/hr) 388.1 275.7 328.3 330.7 26.0 0.079
Mine 4 Th.No6 Tailings mass flowrate (t/hr) 383.5 242.9 318.2 322.6 26.9 0.085
Mine 4 Th.No8 Tailings mass flowrate (t/hr) 387.5 269.7 340.6 345.5 26.3 0.077
Mine 4 Th.No11 Tailings mass flowrate (t/hr) 350.6 191.7 295.9 304.2 42.75 0.144
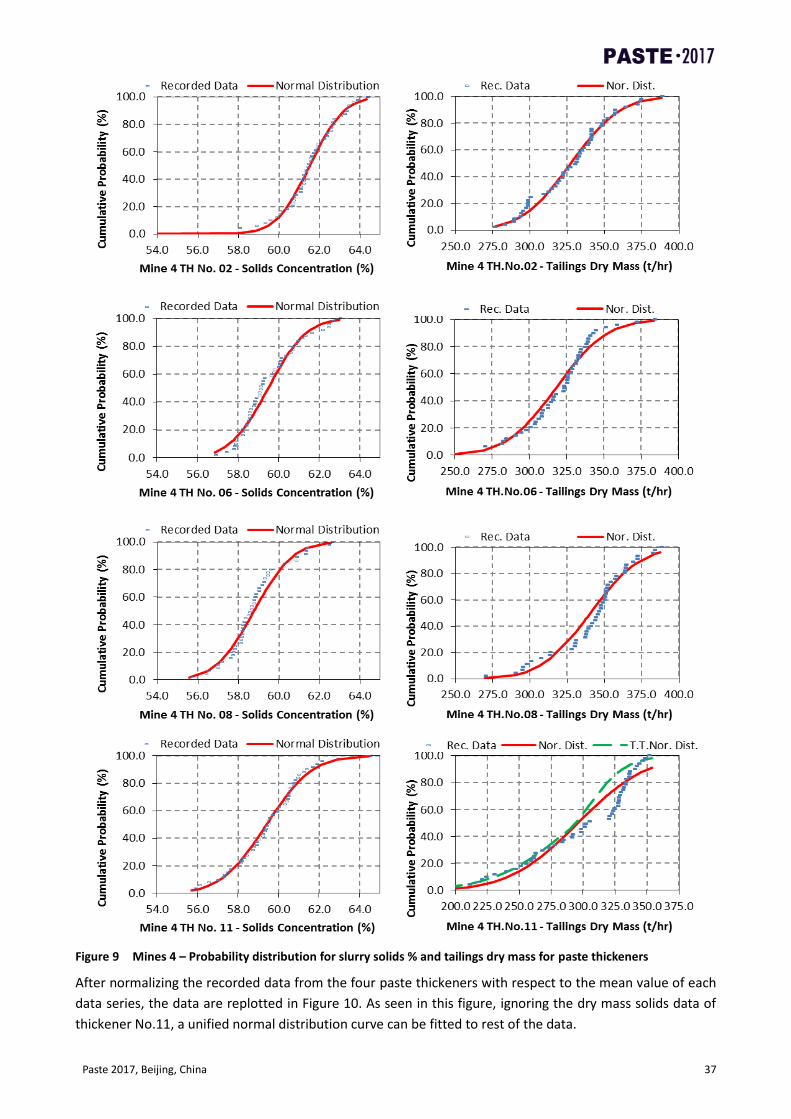
The cumulative probability distribution of the dry mass and thickener underflow solids concentration for the
paste thickeners are plotted in Figure 9. The results indicate similar performance from thickeners 2, 6 and 8,
but greater variability from thickener 11. The reason for this has not been established. The plots show that
normal distribution provides very good fit to underflow solids concentration data from all of the four
thickeners. The dry mass solids data also follow the normal distribution reasonably well except thickener
No.11 which a “two-tailed” normal distribution gives a better fit.
Paste 2017, Beijing, China 37
Figure 9 Mines 4 – Probability distribution for slurry solids % and tailings dry mass for paste thickeners
After normalizing the recorded data from the four paste thickeners with respect to the mean value of each
data series, the data are replotted in Figure 10. As seen in this figure, ignoring the dry mass solids data of
thickener No.11, a unified normal distribution curve can be fitted to rest of the data.

38 Paste 2017, Beijing, China
Figure 10 Mines 4 – Replot of the normalized recorded data from Mine 4
The unified normal distribution fit to underflow solids concentration has a C.V. value of 0.03 and a C.V. values
of 0.085 gives the best unified normal distribution fit to tailings dry mass data.
7 Discussion of results
The data presented in the previous sections is summarized in Tables 5 and 6 below, together with data
previously presented by Seddon and Fitton (2011). It is noted that some of the data presented the previous
paper was based on averages over longer durations (e.g. monthly, rather than 24 hours). Data from these
longer sampling intervals has not been included. Inspection of Table 5 indicates that for underflow solids
concentration the C.V. ranges between 0.02 and 0.07.
Table 5 Variability of underflow solids concentration
Site Thickener type C.V.
Site 2 High-Rate 0.023
Site 3 High-Rate 0.071
SDGM 1 High-Rate 0.026
EHM 1 High Density 0.056
Site 4 Paste 0.025~0.031
Miduk 1 Paste 0.20~0.026
Note: 1 Data from Seddon and Fitton (2011)
Table 6 also indicates that the C.V. for mass flowrate ranges between 0.04 and 0.19. On the basis of these
results, it is concluded that there is no single set of statistical parameters that can be applied to all thickeners,
or even one individual type of thickener. Seddon et al. (2015) discussed this variability and concluded that
for solids concentration a C.V. = 0.05 was a reasonable design value for a “well operated” thickener. For mass
flowrate they suggested use of an asymmetric (“two-tailed”) distribution, with values of C.V. = 0.07 for the
top, and C.V. = 0.12 for the bottom being representative of “good” thickener performance.

Paste 2017, Beijing, China 39
Table 6 Variability of mass flowrate
Site Thickener type C.V.2
Site 2 High-Rate 0.043
Site 3 High-Rate 0.139
SDGM 1 High-Rate 0.12
Century 1 High-Rate 0.14
Site 4 (Nos 2, 6, 8) Paste 0.077~0.085
Site 4 (No 11) Paste 0.144
Miduk 1 Paste 0.19
Note: 1 Data from Seddon and Fitton (2011), 2 Single parameter distribution
The new data presented in this paper in general supports these ranges. However there are indications that
paste thickeners may achieve lower variability than some High-Rate thickeners. It is suggested that this is
likely to be a reflection of the operating parameters set for the paste thickeners (e.g. need for consistent
good water recovery) rather than differences related directly to differences in design.
8 Assessment of thickener variability impact on TSF
8.1 Example
The variation of thickener performance can affect the mine TSF system. Two areas that are more affected
are the tailings transport system and tailings beach slope in CTD and DVD schemes. To demonstrate the
impact of thickener performance variability on these two important aspects of TSF system, four pair points
record of slurry flowrate and solids concentration from Mine 2 are selected for analysis. The selected
recorded data are presented in Table 7. The rheological characteristics at the recorded solids concentration
are also shown in this table.
Table 7 Simultanious record of thickener underflow solids concentration and flowrate from Mine 2
Case
No.
Slurry
flowrate
U/F solids
concentration
Rheology
Herschel Bulkley parameters
Head loss
slurry
Total head
loss
Predicted
beach slope
(l/s) (%) Ty (Pa) K n (m/km) (kPa) (%)
1 165.5 52.3 1.0 0.2466 0.5366 15.7 464 1.6
2 153.5 60.8 3.5 0.4924 0.5399 13.0 418 1.7
3 126.0 61.2 7.0 0.5346 0.5466 12.5 366 2.3
4 118.2 64.3 12.0 0.6975 0.6196 32.4 995* 3.1
*Note: Partial deposition of solids in the pipe
8.2 Impact on tailings transport system
Using the recorded slurry flowrates, solids concentration and rheological data presented in Table 7, the head
loss values are calculated for each case for transport of slurry in a HDPE DN400, PN 20, ID = 308 mm pipe
assuming a total pipe length of 2000 m. The calculated head loss values are also presented in Table 7. In Case
4, the head loss is calculated for a reduced pipe cross sectional area due to gradual deposition of slurry solids
particles in the pipeline. This will happen if the pipeline is operated for long enough time.
The estimated head loss values presented in Table 6 show that the maximum required pumping head can
potentially be increased to 2.7 times than the minimum pumping head if the thickener fluctuations are not
addressed properly in the design of the tailings transport system.
40 Paste 2017, Beijing, China
8.3 Impact on beach slope
The beach slopes prediction model presented by Pirouz et al. (2014) is utilized to estimate the achievable
beach slope for the tailings properties presented in the four cases of Table 7. It is assumed that a CTD scheme
is used and the total tailings flowrate is split between 5 spigots at discharged to the TSF. The estimated beach
slope values are also presented in this table. As can be seen from the table, the variability of the thickener
performance can result in beach slope values to vary from 1.6 to 3.1%. The day to day performance of the
thickeners is believed to be one of the main reasons for concavity of thickened tailings beach profile (Seddon
et al., 2015).
9 Conclusions
The following conclusions are derived from reviewing the statistical analysis of tailings solids concentration
and mass flowrate data from 4 different mines presented in this paper:
The design underflow solids concentrations values (indicated in Table 1) for the High-Rate and paste
thickeners are generally achieved on a time average basis, but a lot of the times the thickeners have
underperformed.
The C.V. values show that in all of the cases the variability of tailings mass flowrate out of the
thickeners is greater than the U/F solids concentration variability.
The comparison of the C.V. values for plant without a thickener to plants that use tailings thickener
suggests that a tailings thickener has a damping effect on the usual fluctuations of the process plant.
The impact of thickener performance variability on slurry transport and TSF system (beach slope) can
potentially be significant and needs to be adequately addressed in the design of the TSF.
For paste thickeners C.V. values of 0.030 and 0.085 are recommended to be used for simulation of
underflow solids concentration and mass flowrate variability respectively.
For High-Rate thickeners it is recommended to use a C.V. value of 0.05 for underflow solids
concentration and for simulation of slurry mass flowrate variation a “two-tailed” normal distribution
with C.V. values of 0.12 for the lower tail and 0.07 for upper tail as previously suggested by Seddon
and Fitton (2011).
More data are needed from the operation High-Rate, High Density and paste thickeners to further
refine and confirm the findings from the current research.
The variability of the thickeners U/F solids concentration strongly suggests that using a single value
target U/F solids concentration for thickener performance assessment and control is not reliable.
References
Chryss, A. 2014, ‘Tailings thickener underflow variation survey’, CSIRO AMIRA P1087-Integrated Tailings Management, Supplement
to Second Report.
Pirouz, B., Javadi, S., Seddon, K.D., and Williams, M.P.A. 2014, ‘Modified beach slope prediction model for non-segregating thickened
tailings’, in R.J. Jewell, A.B. Fourie, P.S. Wells and D. Van Zyl (eds), Proceedings of the 17th International Seminar on Paste and
Thickened Tailings, Australian Centre for Geomechanics, Perth, pp. 31–46.
Seddon, K.D. and Fitton, T.G. 2011, ‘Realistic beach slope prediction and design’, in R.J. Jewell and A.B. Fourie (eds), Proceedings of
the 14th International Seminar on Paste and Thickened Tailings, Australian Centre for Geomechanics, Perth.
Seddon, K.D., Pirouz, B. and Fitton, T.G. 2015, ‘Realistic beach slope prediction and design’, in R.J. Jewell and A.B. Fourie (eds),
Proceedings of the 18th International Seminar on Paste and Thickened Tailings, Australian Centre for Geomechanics, Perth.