
Clinical Case #6 By Chen, chun-Yu (Kim) Chen, I -chun (Afra) Chen, I -chun (Afra)

Advances in Intelligent Systems and Computing 744
Thi Thi Zin Jerry Chun-Wei Lin Editors
Big Data Analysis and Deep Learning ApplicationsProceedings of the First International Conference on Big Data Analysis and Deep Learning

Advances in Intelligent Systems and Computing
Volume 744
Series editor
Janusz Kacprzyk, Polish Academy of Sciences, Warsaw, Polande-mail: [email protected]

The series “Advances in Intelligent Systems and Computing” contains publications on theory,applications, and design methods of Intelligent Systems and Intelligent Computing. Virtually alldisciplines such as engineering, natural sciences, computer and information science, ICT, economics,business, e-commerce, environment, healthcare, life science are covered. The list of topics spans all theareas of modern intelligent systems and computing such as: computational intelligence, soft computingincluding neural networks, fuzzy systems, evolutionary computing and the fusion of these paradigms,social intelligence, ambient intelligence, computational neuroscience, artificial life, virtual worlds andsociety, cognitive science and systems, Perception and Vision, DNA and immune based systems,self-organizing and adaptive systems, e-Learning and teaching, human-centered and human-centriccomputing, recommender systems, intelligent control, robotics and mechatronics includinghuman-machine teaming, knowledge-based paradigms, learning paradigms, machine ethics, intelligentdata analysis, knowledge management, intelligent agents, intelligent decision making and support,intelligent network security, trustmanagement, interactive entertainment,Web intelligence andmultimedia.
The publications within “Advances in Intelligent Systems and Computing” are primarily proceedingsof important conferences, symposia and congresses. They cover significant recent developments in thefield, both of a foundational and applicable character. An important characteristic feature of the series isthe short publication time and world-wide distribution. This permits a rapid and broad dissemination ofresearch results.
Advisory Board
Chairman
Nikhil R. Pal, Indian Statistical Institute, Kolkata, Indiae-mail: [email protected]
Members
Rafael Bello Perez, Universidad Central “Marta Abreu” de Las Villas, Santa Clara, Cubae-mail: [email protected]
Emilio S. Corchado, University of Salamanca, Salamanca, Spaine-mail: [email protected]
Hani Hagras, University of Essex, Colchester, UKe-mail: [email protected]
László T. Kóczy, Széchenyi István University, Győr, Hungarye-mail: [email protected]
Vladik Kreinovich, University of Texas at El Paso, El Paso, USAe-mail: [email protected]
Chin-Teng Lin, National Chiao Tung University, Hsinchu, Taiwane-mail: [email protected]
Jie Lu, University of Technology, Sydney, Australiae-mail: [email protected]
Patricia Melin, Tijuana Institute of Technology, Tijuana, Mexicoe-mail: [email protected]
Nadia Nedjah, State University of Rio de Janeiro, Rio de Janeiro, Brazile-mail: [email protected]
Ngoc Thanh Nguyen, Wroclaw University of Technology, Wroclaw, Polande-mail: [email protected]
Jun Wang, The Chinese University of Hong Kong, Shatin, Hong Konge-mail: [email protected]
More information about this series at http://www.springer.com/series/11156
Thi Thi Zin • Jerry Chun-Wei LinEditors
Big Data Analysisand Deep LearningApplicationsProceedings of the First InternationalConference on Big Data Analysis andDeep Learning
123

EditorsThi Thi ZinFaculty of EngineeringUniversity of MiyazakiMiyazakiJapan
Jerry Chun-Wei LinDepartment of Computing, Mathematics,and Physics
Western Norway University of AppliedSciences (HVL)
BergenNorway
ISSN 2194-5357 ISSN 2194-5365 (electronic)Advances in Intelligent Systems and ComputingISBN 978-981-13-0868-0 ISBN 978-981-13-0869-7 (eBook)https://doi.org/10.1007/978-981-13-0869-7
Library of Congress Control Number: 2018944427
© Springer Nature Singapore Pte Ltd. 2019This work is subject to copyright. All rights are reserved by the Publisher, whether the whole or partof the material is concerned, specifically the rights of translation, reprinting, reuse of illustrations,recitation, broadcasting, reproduction on microfilms or in any other physical way, and transmissionor information storage and retrieval, electronic adaptation, computer software, or by similar or dissimilarmethodology now known or hereafter developed.The use of general descriptive names, registered names, trademarks, service marks, etc. in thispublication does not imply, even in the absence of a specific statement, that such names are exempt fromthe relevant protective laws and regulations and therefore free for general use.The publisher, the authors and the editors are safe to assume that the advice and information in thisbook are believed to be true and accurate at the date of publication. Neither the publisher nor theauthors or the editors give a warranty, express or implied, with respect to the material contained herein orfor any errors or omissions that may have been made. The publisher remains neutral with regard tojurisdictional claims in published maps and institutional affiliations.
Printed on acid-free paper
This Springer imprint is published by the registered company Springer Nature Singapore Pte Ltd.part of Springer NatureThe registered company address is: 152 Beach Road, #21-01/04 Gateway East, Singapore 189721,Singapore

Preface
This volume composes the proceedings of the first International Conference on BigData Analysis and Deep Learning (ICBDL 2018), which is jointly organized byUniversity of Miyazaki, Japan, and Myanmar Institute of Information Technology,Myanmar. ICBDL 2018 took place in Miyazaki, Japan, on May 14–15, 2018.ICBDL 2018 is technically co-sponsored by Springer; University of Miyazaki,Japan; Myanmar Institute of Information Technology, Myanmar; and HarbinInstitute of Technology, Shenzhen, China.
The focus of ICBDL 2018 is on the frontier topics in data science, engineering,and computer science subjects. Especially, big data analysis, deep learning, infor-mation communication, and imaging technologies are the main themes of theconference.
All submitted papers have gone through the peer review process. Forty-fiveexcellent papers were accepted for the final proceeding. We would like to expressour sincere appreciation to the reviewers and the International Technical ProgramCommittee members for making this conference successful. We also would like tothank all authors for their high-quality contributions.
We would like to express our sincere gratitude to Prof. Dr. Tsuyomu Ikenoue,the President of the University of Miyazaki who has made the conference possible.Finally, our sincere thanks must go to the host of the conference, the University ofMiyazaki, Japan.
March 2018 Thi Thi ZinConference Program Committee Chair
v

Organizing Committee
General Chair
Tsuyomu Ikenoue University of Miyazaki, Japan
General Co-chairs
Win Aye Myanmar Institute of Information Technology,Myanmar
Masahito Suiko University of Miyazaki, JapanToshiaki Itami University of Miyazaki, Japan
Advisory Committee Chairs
Mitsuhiro Yokota University of Miyazaki, JapanMasugi Maruyama University of Miyazaki, JapanKRV Raja Subramanian International Institute of Information Technology,
Bangalore, IndiaPyke Tin University of Miyazaki, JapanHiromitsu Hama Osaka City University, Japan
Program Committee Chair
Thi Thi Zin University of Miyazaki, Japan
vii

Program Committee Co-chair
Mie Mie Khin Myanmar Institute of Information Technology,Myanmar
Publication Chairs
Thi Thi Zin University of Miyazaki, JapanJerry Chun-Wei Lin Western Norway University of Applied Sciences
(HVL), Norway
Invited Session Chairs
Soe Soe Khaing University of Technology, Yatanarpon Cyber City,Myanmar
Myint Myint Sein University of Computer Studies, Yangon, Myanmar
International Technical Program Committee Members
Moe Pwint University of Computer Studies, Mandalay,Myanmar
Win Zaw Yangon Institute of Technology, MyanmarAung Win University of Technology, Yatanarbon Cyber City,
MyanmarThi Thi Soe Nyunt University of Computer Studies, Yangon, MyanmarKhin Thida Lynn University of Computer Studies, Mandalay,
MyanmarMyat Myat Min University of Computer Studies, Mandalay,
MyanmarThan Nwe Aung University of Computer Studies, Mandalay,
MyanmarMie Mie Tin Myanmar Institute of Information Technology,
MyanmarHnin Aye Thant University of Technology, Yatanarbon Cyber City,
MyanmarNaw Saw Kalayar Computer University (Taunggyi), MyanmarMyint Myint Khaing Computer University (Pinlon), MyanmarHiroshi Kamada Kanazawa Institute of Technology, JapanTomohiro Hase Ryukoku University, Japan
viii Organizing Committee

Takashi Toriu Osaka City University, JapanAtsushi Ueno Osaka City University, JapanShingo Yamaguchi Yamaguchi University, JapanChien-Ming Chen Harbin Institute of Technology (Shenzhen), ChinaTsu-Yang Wu Fujian University of Technology, China
Organizing Committee ix

Contents
Big Data Analysis
Data-Driven Constrained Evolutionary Scheme for PredictingPrice of Individual Stock in Dynamic Market Environment . . . . . . . . . . 3Henry S. Y. Tang and Jean Hok Yin Lai
Predictive Big Data Analytics Using Multiple LinearRegression Model . . . . . . . . . . . . . . . . . . . . . . . . . . . . . . . . . . . . . . . . . . 9Kyi Lai Lai Khine and Thi Thi Soe Nyunt
Evaluation for Teacher’s Ability and Forecasting Student’sCareer Based on Big Data . . . . . . . . . . . . . . . . . . . . . . . . . . . . . . . . . . . 20Zun Hlaing Moe, Thida San, Hlaing May Tin, Nan Yu Hlaing,and Mie Mie Tin
Tweets Sentiment Analysis for Healthcare on Big Data Processingand IoT Architecture Using Maximum Entropy Classifier . . . . . . . . . . . 28Hein Htet, Soe Soe Khaing, and Yi Yi Myint
A Survey on Influence and Information Diffusion in TwitterUsing Big Data Analytics . . . . . . . . . . . . . . . . . . . . . . . . . . . . . . . . . . . . 39Radia El Bacha and Thi Thi Zin
Real Time Semantic Events Detection from Social Media Stream . . . . . 48Phyu Phyu Khaing and Than Nwe Aung
Community and Outliers Detection in Social Network . . . . . . . . . . . . . . 58Htwe Nu Win and Khin Thidar Lynn
Analyzing Sentiment Level of Social Media Data Based on SVMand Naïve Bayes Algorithms . . . . . . . . . . . . . . . . . . . . . . . . . . . . . . . . . 68Hsu Wai Naing, Phyu Thwe, Aye Chan Mon, and Naw Naw
xi

Deep Learning and its Applications
Accuracy Improvement of Accelerometer-Based LocationEstimation Using Neural Network . . . . . . . . . . . . . . . . . . . . . . . . . . . . . 79Noritaka Shigei, Hiroki Urakawa, Yoshihiro Nakamura,Masahiro Teramura, and Hiromi Miyajima
Transparent Object Detection Using Convolutional Neural Network . . . 86May Phyo Khaing and Mukunoki Masayuki
Multi-label Land Cover Indices Classification of Satellite ImagesUsing Deep Learning . . . . . . . . . . . . . . . . . . . . . . . . . . . . . . . . . . . . . . . 94Su Wit Yi Aung, Soe Soe Khaing, and Shwe Thinzar Aung
Real-Time Hand Pose Recognition Using Faster Region-BasedConvolutional Neural Network . . . . . . . . . . . . . . . . . . . . . . . . . . . . . . . . 104Hsu Mon Soe and Tin Myint Naing
Data Mining and its Applications
School Mapping for Schools of Basic Education in Myanmar . . . . . . . . 115Myint Myint Sein, Saw Zay Maung Maung, Myat Thiri Khine,K-zin Phyo, Thida Aung, and Phyo Pa Pa Tun
GBSO-RSS: GPU-Based BSO for Rules Space Summarization . . . . . . . 123Youcef Djenouri, Jerry Chun-Wei Lin, Djamel Djenouri,Asma Belhadi, and Philippe Fournier-Viger
Machine Learning Based Live VM Migration for EfficientCloud Data Center . . . . . . . . . . . . . . . . . . . . . . . . . . . . . . . . . . . . . . . . . 130Ei Phyu Zaw
Dynamic Replication Management Scheme for DistributedFile System . . . . . . . . . . . . . . . . . . . . . . . . . . . . . . . . . . . . . . . . . . . . . . . 139May Phyo Thu, Khine Moe Nwe, and Kyar Nyo Aye
Frequent Pattern Mining for Dynamic Database by UsingHadoop GM-Tree and GTree . . . . . . . . . . . . . . . . . . . . . . . . . . . . . . . . . 149Than Htike Aung and Nang Saing Moon Kham
Investigation of the Use of Learning Management System (Moodle)in University of Computer Studies, Mandalay . . . . . . . . . . . . . . . . . . . . 160Thinzar Saw, Kyu Kyu Win, Zan Mo Mo Aung, and Myat Su Oo
User Preference Information Retrieval by Using MultiplicativeAdaptive Refinement Search Algorithm . . . . . . . . . . . . . . . . . . . . . . . . . 169Nan Yu Hlaing and Myintzu Phyo Aung
Proposed Framework for Stochastic Parsing of Myanmar Language . . . 179Myintzu Phyo Aung, Ohnmar Aung, and Nan Yu Hlaing
xii Contents

Information Communication Systems and Applications
FDTD Based Numerical Calculation of Electromagnetic WaveRadiation in Multi-layer Circular Cylindrical Human Head . . . . . . . . . 191Z. M. Lwin and M. Yokota
Improved Convergence in Eddy-Current Analysis by SingularValue Decomposition of Subdomain Problem . . . . . . . . . . . . . . . . . . . . . 199Takehito Mizuma and Amane Takei
Development and Validation of Parallel Acoustic Analysis Methodfor the Sound Field Design of a Large Space . . . . . . . . . . . . . . . . . . . . . 206Yuya Murakami, Kota Yamamoto, and Amane Takei
Secret Audio Messages Hiding in Images . . . . . . . . . . . . . . . . . . . . . . . . 215Saw Win Naing and Tin Myint Naing
Location Based Personal Task Reminder SystemUsing GPS Technology . . . . . . . . . . . . . . . . . . . . . . . . . . . . . . . . . . . . . . 224Thwet Hmue Nyein and Aye Mon Yi
Intelligent Systems
Front Caster Capable of Reducing Horizontal Forceson Step Climbing . . . . . . . . . . . . . . . . . . . . . . . . . . . . . . . . . . . . . . . . . . 233Geunho Lee, Masaki Shiraishi, Hiroki Tamura, and Kikuhito Kawasue
Mobile Location Based Indexing for Range Searching . . . . . . . . . . . . . . 240Thu Thu Zan and Sabai Phyu
Building Travel Speed Estimation Model for Yangon Cityfrom Public Transport Trajectory Data . . . . . . . . . . . . . . . . . . . . . . . . . 250Thura Kyaw, Nyein Nyein Oo, and Win Zaw
Comparison Between Block-Encoding and Quadtree CompressionMethods for Raster Maps . . . . . . . . . . . . . . . . . . . . . . . . . . . . . . . . . . . . 258Phyo Phyo Wai, Su Su Hlaing, Khin Lay Mon, Mie Mie Tin,and Mie Mie Khin
Video Monitoring System and Applications
A Study on Estrus Detection of Cattle Combining Video Imageand Sensor Information . . . . . . . . . . . . . . . . . . . . . . . . . . . . . . . . . . . . . 267Tetsuya Hirata, Thi Thi Zin, Ikuo Kobayashi, and Hiromitsu Hama
Behavior Analysis for Nursing Home Monitoring System . . . . . . . . . . . 274Pann Thinzar Seint and Thi Thi Zin
Contents xiii

A Study on Detection of Abnormal Behavior by a SurveillanceCamera Image . . . . . . . . . . . . . . . . . . . . . . . . . . . . . . . . . . . . . . . . . . . . 284Hiroaki Tsushita and Thi Thi Zin
A Study on Detection of Suspicious Persons for IntelligentMonitoring System . . . . . . . . . . . . . . . . . . . . . . . . . . . . . . . . . . . . . . . . . 292Tatsuya Ishikawa and Thi Thi Zin
A Study on Violence Behavior Detection System BetweenTwo Persons . . . . . . . . . . . . . . . . . . . . . . . . . . . . . . . . . . . . . . . . . . . . . . 302Atsuki Kawano and Thi Thi Zin
Image and Multimedia Processing
Object Detection and Recognition System for Pick and Place Robot . . . 315Aung Kaung Sat and Thuzar Tint
Myanmar Rice Grain Classification Using ImageProcessing Techniques . . . . . . . . . . . . . . . . . . . . . . . . . . . . . . . . . . . . . . 324Mie Mie Tin, Khin Lay Mon, Ei Phyu Win, and Su Su Hlaing
Color Segmentation Based on Human PerceptionUsing Fuzzy Logic . . . . . . . . . . . . . . . . . . . . . . . . . . . . . . . . . . . . . . . . . 333Tin Mar Kyi and Khin Chan Myae Zin
Key Frame Extraction Techniques . . . . . . . . . . . . . . . . . . . . . . . . . . . . . 342Mie Mie Khin, Zin Mar Win, Phyo Phyo Wai, and Khaing Thazin Min
A Study on Music Retrieval System Using Image Processing . . . . . . . . . 346Emi Takaoka and Thi Thi Zin
Analysis of Environmental Change Detection Using SatelliteImages (Case Study: Irrawaddy Delta, Myanmar) . . . . . . . . . . . . . . . . . 355Soe Soe Khaing, Su Wit Yi Aung, and Shwe Thinzar Aung
Analysis of Land Cover Change Detection Using Satellite Imagesin Patheingyi Township . . . . . . . . . . . . . . . . . . . . . . . . . . . . . . . . . . . . . 364Hnin Phyu Phyu Aung and Shwe Thinzar Aung
Environmental Change Detection Analysis in MagwayDivision, Myanmar . . . . . . . . . . . . . . . . . . . . . . . . . . . . . . . . . . . . . . . . . 374Ei Moh Moh Aung and Thu Zar Tint
Author Index . . . . . . . . . . . . . . . . . . . . . . . . . . . . . . . . . . . . . . . . . . . . . . . . 385
xiv Contents

Big Data Analysis

Data-Driven Constrained EvolutionaryScheme for Predicting Price of IndividualStock in Dynamic Market Environment
Henry S. Y. Tang(✉) and Jean Hok Yin Lai(✉)
Hong Kong Baptist University, Kowloon Tong, Hong [email protected], [email protected]
Abstract. Predicting stock price is a challenging problem as the market involvemulti-agent activities with constantly changing environment. We propose amethod of constrained evolutionary (CE) scheme that based on Genetic Algo‐rithm (GA) and Artificial Neural Network (ANN) for stock price prediction. Stockmarket continuously subject to influences from government policy, investoractivity, cooperation activity and many other hidden factors. Due to dynamic andnon-linear nature of the market, individual stock price movement are usually hardto predict. Investment strategies used by regular investor usually require constantmodification, remain secrecy and sometimes abandoned. One reason for suchbehavior is due to dynamic structure of the efficient market, where all revealedinformation will reflect upon the stock price, leads to dynamic behavior of themarket and unprofitability of the static strategies. The CE scheme contains mech‐anisms which are temporal and environmental sensitive that triggers evolutionarychanges of the model to create a dynamic response towards external factors.
Keywords: Genetic Algorithm · Artificial neural network · Data-drivenEvolutionary · Stock · Prediction
1 Introduction
Stock market is often seen as a dynamic structure with significant changes over time [1],this nature leads challenges in predicting the individual stock price within the market.
Due to the statistical basis and advancement of automatic trading, technical analysishas gained popularity over time. Attempts have been made using different approachesbased on human behavior to create a model in predicting the price movement of thestock [2]. Timeseries analysis and machine learning algorithms are commonly usedmodels for the task [3], however, most of the studies are not concerning the dynamicnature of the market where the parameters of the models are obtained and fixed throughmeasuring the statistical confidence or learning algorithm from historical data. Thisapproach might suffer from poor performance in long run due to market structure shift.
© Springer Nature Singapore Pte Ltd. 2019T. T. Zin and J. C.-W. Lin (Eds.): ICBDL 2018, AISC 744, pp. 3–8, 2019.https://doi.org/10.1007/978-981-13-0869-7_1

1.1 Artificial Neural Network
Inspired by human brain’s ability of non-linear, parallel and complex computationpower, artificial neural networks are proven to be a universal function approximatorgiven enough neurons within the hidden layer of the network. [4] Different attemptsusing artificial neural network to predict stock trends were presented in [5], where itindicates the possible feasibility of such approach with curtain classes of neuralnetworks.
1.2 Genetic Algorithms (GA)
John Holland proposed the idea of GA in 1970 inspired by the process of biologicalevolution. [6] This method provided us with a learning method to find an optimal solutiongiven an optimization function (fitness function). GA search the solution by encodes thesolution to a chromosome which represents a potential solution to the problem. Thechromosome is then tested by the fitness function which will return a fitness valuerepresenting the survival abilities. Fitness function is specifically designed for a partic‐ular problem, it provides an evaluation of the goodness of the chromosome to theproblem. The chromosome with higher fitness value indicating a better solution towardsthe specific problem. Theses chromosome will produce offspring based on the fitnessvalue through crossover operation, the chromosome with higher fitness value will beselected out and have more offspring. All offspring will then experience a mutationoperation, where the chromosome might mutate under predefined probability. Givenenough generation, the GA will find a near-optimum solution to the problem. In termsof financial applications, in [7], an ensemble system based on GA were proposed toforecast stock market. In [8], a framework based on Web robot, GA and Support VectorMachine was proposed for data analysis and prediction.
2 Problem Scenario and Assumptions
The problem of stock price movement prediction can be seen as a binary classificationproblem. The output y of our model has the property of y ∈ [0, 1], where 0 representinga down-trend prediction and 1 representing an up-trend prediction.
In real-world, stock price of individual company was affected by multi-factorsincluding temporal events, competitors, collaborators and other factors simultaneously.Since the weighting of the combination of factors very likely to change over time,making any non-dynamic model might not be suitable for stock price movement predic‐tion in long run.
We assume that for any given time t there exist a f (., .) decision boundary such thatthe expected error of the decision boundary is smaller than a critical value 𝜀, where
E(error(f (x, t), true label)) ≤ 𝜀 (1)
Unfortunately, the function f is far too complex to model and almost impossible toobserve. However, we can approximate the function at a given time where the
4 H. S. Y. Tang and J. H. Y. Lai

approximate function f ∗(x)t at timet ∼ f (x, t). We further assume that the approximatedfunction f ∗(x)t decision boundary will shift continuously against time, where
f ∗(x)t ∼ f ∗(x)t+Δt (2)
Based on the assumptions, for creating an effective approximation function, thescheme should solve below problem.
2.1 Shift Detection (Trigger)
For the scheme to be functional against market structure shift, we require a mechanismto detect the shifting signal and start triggering the evolution process. This mechanismmight only consider the presence of the shift but not consider the reason of the shift andthe reaction against it.
2.2 Shift Direction
Once we have detected the presence of the shift, we need more information on what typeof shift is occurring, for example there is a new player introduced into the market or newregulation announced. Different external environment influence will cause the marketand investor behavior changes drastically. Therefore, we need to understand what kindof shift we are experiencing currently.
2.3 Shift Degree
After we know the goal of the evolution, it is sensible for us to consider how fast themodel should evolve and from which path. Scheduling of the evolution will allow usprogressively reaching the goal. During the evolution, result from problem 2 need torevise for more accurate estimation.
3 Methodology
In this section, we introduce a scheme to solve the problem indicated in previous section.The architecture of the scheme consists of three major structure. A detection function,evolution function and model base. In terms of operation, the detection function contin‐uously monitoring the new data feed to the system, once the function detected the marketshift, it will start triggering the evolution process and request the model base to supportits operation. Finally, the new model produced will replace the current model and storedin the model base.
Data-Driven Constrained Evolutionary Scheme 5

3.1 Shift Detection Function
In phase one of the scheme, most recent historical data is used, e.g. 4 months to the pastfrom now, and separate into different sections U(i) chronologically, and for each section,we run the current model f ∗(x)t and compute the error rate, where
section error (i) =1
no. of data point in U(i)
∑x∈U(i)
(f ∗(x)t − y(x)
)2(3)
If observed some progressive error increase against i, then the scheme determinesthat there exists a shift in the market structure and trigger the evolutionary process.
3.2 Shift Direction and Shift Degree
In the proposed model, we used the word constrained to describe the evolutionaryprocess being bounded by current and previous models stored in model base.
The chromosome of each model is the weight and activation function of the model.Figure 1 show that the construction of a chromosome of a neural network, where eachlayer of the network can be represented as a m × n matrix ML
m,n. Each row i of matrixML
m,n is the weight of all connection of neuron i at layer L to its descendant. Each modelwill contain one or more layer of matrix ML
m,n and a vector of activation functions attachedto each layer.
Fig. 1. Illustration of an ANN model and its respective chromosome representation.
Two types of crossover operation exist within the evolutionary scheme. First is theneuron swap operation, where the crossover lines only locate between rows of matrixML
m,n. Due to consistency between different layers, the child layer must be the samedimension as its parents. Notice that for this operation, the activation function vector isfollowing the swap as illustrated in Fig. 2a. Second crossover operation will be theconnection swap operation. In this operation, the crossover lines only locate withinrandomly selected rows of the matrix ML
m,n, see Fig. 2b. The activation function vectorin this operation will change based on the parent that contributed the most number ofweight.
6 H. S. Y. Tang and J. H. Y. Lai

Fig. 2a. Type one crossover operation Fig. 2b. Type two crossover operation
Mutation will occur with certain probability on both the weight on the matrix set andthe set of activation function vector. Therefore, the activation function of a neuron canmutate from sigmoid function to tanh or other possible activation functions or vice versa.
The number of child produced by the current model and a previous model will baseon the error rate of the previous model produced with current data feed. More childrenwill be produced by models that having lower error rate.
The reason of choosing the current model as the major partner is because accordingto assumption 2, the current model will be a good starting point as the parent of the nextevolutionary point.
3.3 Fine Tuning
After the crossover and mutation process, the child model will experience a fine tuningand selection stage. At this stage, the data feed will be used to fine tuning the child modelby using backpropagation training method with small learning rate. The fitness functionis the cross-validation error result of the fine-tuned child model. The next generationwill be created based on the fitness function result and the crossover of the fine-tunedchild model. The process will terminate until reaching the desire score of fitness orreaching maximum generation.
4 Discussion
Since the possible outcome of the model are based on the number of previous modelthat stored on the model base, the method for initializing the scheme can be furtherimproved to introduce more constructive model at early stage.
This paper only provided the concept of the proposed model, it is encouraged forfurther experiment on the real-world data and compared the proposed model with arandomized approach to illustrate the efficiency of the speed of convergence of the GAsand accuracy towards individual stock price prediction for a long-extended period.
Data-Driven Constrained Evolutionary Scheme 7

References
1. Hamilton, J.D., Lin, G.: Stock market volatility and the business cycle. J. Appl. Econometrics11(5), 573–593 (1996). Special Issue: Econometric Forecasting
2. Barberis, N., Thaler, R.: A survey of behavioral finance. In: Handbook of the Economics ofFinance, vol. 1, Part B, pp. 1053–1128 (2003). Chap. 18
3. Murphy, J.J.: Technical analysis of the financial markets: a comprehensive guide to tradingmethods and applications, New York Institute of Finance (1999)
4. Haykin, S.: Neural Networks and Learning Machines, 3rd edn. Pearson, Upper Saddle River(2009)
5. Saad, E.W., Prokhorov, D.V., Wunsch, D.C.: Comparative study of stock trend predictionusing time delay, recurrent and probabilistic neural networks. IEEE Trans. Neural Netw. 9(6),1456–1470 (1998)
6. Holland, J.H.: Adaptation in natural and artificial systems, p. 183. The University of MichiganPress, Michigan (1975)
7. Gonzalez, R.T., Padilha, C.A., Couto, D.A.: Ensemble system based on genetic algorithm forstock market forecasting. In: IEEE Congress on Evolutionary Computation (CEC) (2015)
8. Wang, C.-T., Lin, Y.-Y.: The prediction system for data analysis of stock market by usinggenetic algorithm. In: International Conference on Fuzzy System and Knowledge Discovery,pp. 1721–1725 (2015)
8 H. S. Y. Tang and J. H. Y. Lai
Predictive Big Data Analytics Using MultipleLinear Regression Model
Kyi Lai Lai Khine1 and Thi Thi Soe Nyunt2(&)
1 Cloud Computing Lab, University of Computer Studies, Yangon, [email protected]
2 Head of Software Department,University of Computer Studies, Yangon, Myanmar
Abstract. Today fast trending technology era, data is growing very fast tobecome extremely huge collection of data in all around globe. This so-called“Big Data” and analyzing on big data sets to extract valuable information fromthem has also become one of the most important and complex challenges in dataanalytics research. The challenges of limiting memory usage, computationalhurdles and slower response time are the main contributing factors to considertraditional data analysis on big data. Then, traditional data analysis methodsneed to adapt in high-performance analytical systems running on distributedenvironment which provide scalability and flexibility. Multiple Linear Regres-sion which is an empirical, statistical and mathematically mature method in dataanalysis is needed to adapt in distributed massive data processing because it maybe poorly suited for massive datasets. In this paper, we propose MapReducebased Multiple Linear Regression Model which is suitable for parallel anddistributed processing with the purpose of predictive analytics on massivedatasets. The proposed model will be based on “QR Decomposition” indecomposing big matrix training data to extract model coefficients from largeamounts of matrix data on MapReduce Framework with large scale. Experi-mental results show that the implementation of our proposed model can effi-ciently handle massive data with a satisfying good performance in parallel anddistributed environment providing scalability and flexibility.
Keywords: Big data � Multiple linear regression � Predictive analyticsMapReduce � QR decomposition
1 Introduction
Nowadays, the Internet represents a big storage where great amounts of information aregenerated every second. The IBM Big Data Flood Infographic describes 2.7 Zettabytesof data exist in the today digital universe. Moreover, according to this study fromFacebook there are 100 Terabytes updated daily and an estimate of 35 Zettabytes ofdata generated leading to a lot of activities on social networks annually by 2020. Amirand Murtaza expressed that big data moves around 7 Vs: volume, velocity, variety,value and veracity, variability and visibility. Storing huge volume of data available invarious formats which is increasing with high velocity to gain values out it is itself a
© Springer Nature Singapore Pte Ltd. 2019T. T. Zin and J. C.-W. Lin (Eds.): ICBDL 2018, AISC 744, pp. 9–19, 2019.https://doi.org/10.1007/978-981-13-0869-7_2
big deal [3]. Big data analytics can be defined as the combination of traditional ana-lytics and data mining techniques together with any large voluminous amount ofstructured, semi-structured and unstructured data to create a fundamental platform toanalyze, model and predict the behavior of customers, markets, products, services andso on. “Hadoop” has been widely embraced for its ability to economically store andanalyze big data sets. Using parallel processing paradigm like MapReduce, Hadoop canminimize long processing times to hours or minutes. There exists three types of bigdata analytics: descriptive analytics which answer the question: “What has happened?”,use data aggregation and data mining techniques to provide insight into the past,predictive analytics which also replies like this “What could happen in future?”applying statistical models like regression and forecasts to understand the future. Itcomprises a variety of techniques that can predict future outcomes based on historicaland current data and the last one, prescriptive analytics for optimization and simulationalgorithms to advice on possible outcomes for the question: “What should we do tohappen in future?” [7]. Extracting useful features from big data sets also become a bigissue because many statistics are difficult to compute by standard traditional algorithmswhen the dataset is too large to be stored in a primary memory. The memory space insome computing environments can be as large as several terabyte and beyond it.However, the number of observations that can be stored in primary memory is oftenlimited [10].
Therefore, the two challenges for massive data in supervised learning are emergingexplained by Moufida Rehab Adjout and Faouzi Boufares. First, the massive data setswill face two severe situations such as limiting memory usage and computationalhurdles for the most complicated supervised learning systems. Therefore, loading thismassive data in primary memory cannot be possible in reality. Second, analyzing thevoluminous data may take unpredictable time to response in targeted analytical results[1]. One of the important major issues in predictive big data analysis is how to applystatistical regression analysis on entire huge data at once because the statistical dataanalysis methods including regression method have computational limitation tomanipulate in these huge data sets. Jun et al. [8] discussed about the sub-samplingtechnique to overcome the difficulty in efficient memory utilization. They also pre-sented that this approach is useful for regression analysis that only brings the regressionparameters or estimators in parts of data and which are less efficient in comparing withthe estimators that are derived from the entire data set rather than by parts. However,the desirable regression estimators on entire data set may be impossible to derive [9].That is why; we propose an approach to lessen the computational burden of statisticalanalysis for big data applying regression analysis especially multiple linear regressionanalysis on MapReduce paradigm. The paper is organized as follows. Section 2 pre-sents the concepts and relationships between regression analysis and big data. Thebackground theory of multiple linear regression and its equations and then MapReduceFramework explanations are described in Sect. 3. Our main implementation of theproposed algorithm and respective explanations in detail are presented in Sect. 4. Someperformance evaluation results, discussions and final conclusion to illustrate theappropriateness of the proposed approach are given in Sect. 5.
10 K. L. L. Khine and T. T. S. Nyunt
2 Regression Analysis and Big Data
Statistics takes important role in big data because many statistical methods are used forbig data analysis. Statistical software provides rich functionality for data analysis andmodeling, but it can handle only limited small amounts of data. Regression can be seenin many areas widely used such as business, the social and behavioral sciences, thebiological sciences, climate prediction, and so on. Regression analysis is applied instatistical big data analysis because regression model itself is popular in data analysis.There are two approaches for big data analysis using statistical methods like regression.The first approach is that we consider extracting the sample from big data and thenanalyzing this sample using statistical methods. This is actually the traditional statisticaldata analysis approach assuming that big data as a population. Jun et al. [8] alreadyexpressed that in statistics, a collection of all elements which are included in a data setcan be defined as a population in the respective field of study. That is why; the entirepopulation cannot be analyzed indeed according to many factors such as computationalload, analyzing time and so on. Due to the development of computing environment forbig data and decreasing the cost of data storage facilities, big data which close to thepopulation can be analyzed for some analytical purposes. However, the computationalburden still exists as a limitation in analyzing big data using statistical methods. Thesecond approach is that we consider about splitting the whole big data set into severalblocks without using big population data. The classical regression approach is appliedon each block and then respective regression outcomes from all blocks are combined asfinal output [6]. This is only a sequential process of reading and storing data in primarymemory block by block. Analyzing data in each block separately may be convenientwhenever the size of data is small enough for implementing the estimation procedure invarious computing environments. However, a question, how to replace sequentialprocessing of several data blocks that can adversely affect in response time still remainsas an issue for processing increasing volume of data [12]. Jinlin Zhu, Zhiqiang Ge andet al. proved that MapReduce framework is a sort of resolution to this problem for thereplacement of sequential processing with the use of parallel distributed computing thatenables distributed algorithms in parallel processing on clusters of machines withvaried features.
3 Multiple Linear Regression
Multiple linear regression is a statistical model used to describe a linear relationshipbetween a dependent variable called “explain” and a set of independent or predictorvariables called “explanatory” variables. The simplest form of regression, we meanlinear regression, uses the formula of a straight line (yi = biXi + ƹ) and it determines
Predictive Big Data Analytics Using Multiple Linear Regression Model 11

the appropriate value for b and ƹ to predict the value of y based on the inputsparameters, x. For simple linear regression, meaning only one predictor, the model is:
Y ¼ b0 þ b1X1 þ e ð1Þ
This model includes the assumption that the e is a sample from a population withmean zero and standard deviation r. Multiple linear regression, meaning more than onepredictor is represented by the following:
Y ¼ b0 þ b1X1 þ b2X2 þ � � � þ bnXn þ e ð2Þ
where Y is the dependent variable; X1, X2,…., Xn are the independent variablesmeasured without error (not random); b0; b1; . . .; bn are the parameters of the model.This equation defines how the dependent variable Y is connected to the independentvariables X [5]. The primary goal of multiple linear regression analysis is to findb0; b1; . . .; bn so that the sum of squared errors is the smallest (minimum). The mostpowerful and mathematically mature data analysis method, multiple linear regression isfocused on a central approach traditionally where the computation is only done on a setof data stored in a single machine. With an increasing volume of data, the transition tothe algorithm in distributed environment is hardly possible to implement. Multiplelinear regression, a classical statistical data analysis method, also proves unsuitable tofacilitate the scalability of the data processed in the distributed environment due tocomputing memory and response time. In this work, our contribution is to show theadaptation of classical data analysis algorithms generally and predictive algorithmsspecifically for multiple linear regression providing a response to the phenomenon ofbig data. In big data era, it is an essential requirement to solve the transition to thescalability of the algorithms for parallel and distributed massive data processing withthe use of MapReduce paradigm seems like a natural solution to this problem.
3.1 MapReduce Framework
Zhu et al. (as defined by [14], p. 2) have discussed about infrastructure, data flow, andprocessing of MapReduce Framework. MapReduce, a programming platform cooper-ating with HDFS in Hadoop, which is popular in analyzing huge amount of data. Thereare two kinds of computational nodes in MapReduce Framework: one master node(NameNode) and several slave nodes (DataNode). This can be known as master-slavearchitecture and all the computational nodes and their respective operations are in theform of massively parallel and distributed data processing. The master node serves theduty of entire file system and each slave node serves as a worker node. Actually, eachslave node performs the two main phases or processes called Map () and Reduce (). Thedata structure for these both phases exists in the form of <Key, Value> pairs. In the Mapphase, each worker node initially organizes <Key, Value> pairs with same key natureand then produces a list of intermediate <Key, Value> pairs as intermediate Mapresults. Moreover, MapReduce system can also perform another shuffling process inwhich intermediate results produced from all Map operations by lists of same-key pairswith an implicit set of functions such as sort, copy and merge steps. Then, the shuffled
12 K. L. L. Khine and T. T. S. Nyunt

lists of pairs with the specific keys are combined and finally passed down to the Reducephase. In the Reduce phase, it takes lists of <Key, Value> pairs that are resulted fromprevious process to compute the desirable final output in <Key, Value> pairs.
4 The Proposed MapReduce Based Multiple LinearRegression Model with QR Decomposition
With the massive volume of data, training multiple linear regression on a singlemachine is usually very time-consuming task to finish or sometimes cannot be done.Hadoop is an open framework used for big data analytics and its main processingengine is MapReduce, which is one of the most popular big data processing frame-works available. Algorithms that need to be highly parallelizable and distributableacross huge data sets can also be executable on MapReduce using a large number ofcommodity computers. In this paper, a MapReduce based regression model usingmultiple linear regression will be developed. We focus particularly on the adaptation ofmultiple linear regression in distributed massive data processing. This work shows anapproach that the parallelism of multiple linear regression, a classical statistical learningalgorithm that can meet the challenges of big data in parallel and distributed envi-ronment like MapReduce paradigm. However, we have still a big problem or issue tosolve how to split or decompose the large input matrix in computing the regressionmodel parameter “b” for the multiple linear regression analysis. In resolving the valuesof “b”, we actually need to load the transpose of the input matrix and multiplicationwith its original matrix and then other subsequent complex matrix operations. It isimpossible to process the entire huge input matrix at once. Therefore, matrix decom-position for the proposed regression model is contributed to overcome the limitationsand the challenges of multiple linear regression in huge amount of data. We would liketo present a new computational approach; the proposed regression model with QRDecomposition which provides computing on the decomposed or factorized matrixwith scalability that is much faster than computing on the original matrix immediatelywithout any decomposition.
The fundamental building block of many computational tasks consists of complexmatrix operations including matrix decomposition utilized in the fields of scientificcomputing, machine learning, data mining, statistical applications and others. In mostof these fields, there is a need to scale to large matrices in big data sets to obtain higheraccurateness and better results. When scaling large matrices, it is important to designefficient parallel algorithms for matrix operations, and using MapReduce is one way toachieve this goal. For example, in computing “b” values from the Eq. (3), inversion ofmatrix “R” must be calculated. Matrix inversion is difficult to implement in MapRe-duce because each element in the inverse of a matrix depends on multiple elements inthe input matrix, so the computation is not easily splitting as required by theMapReduce programming model [13]. QR Decomposition (also called a QR Factor-ization) of a given matrix A is a decomposition of matrix X into a product X = QR ofan orthogonal matrix Q if QT = Q−1 or QT Q = I and an upper triangular matrix R [11].It is used to solve the ordinary least squares problem in multiple linear regression andalso the standard method for computing QR Factorization of a matrix which has many
Predictive Big Data Analytics Using Multiple Linear Regression Model 13

rows than columns (m > n) causing a common problem arisen in many real-worldapplications. As we already known that data in a MapReduce processing is representedby a collection of Key-Value pairs. When we apply MapReduce to analyze matrix-formdata, a key represents the identity of a row and a value represents the elements in thatrow [4]. Therefore, the matrix is also a collection of Key-Value pairs assuming thateach row has a distinct key for simplicity although sometimes each key may represent aset of rows [2]. To determine multiple linear regression model’s coefficient, “b” thecomputational approach QR Decomposition is to simplify the calculation by decom-
posing the data matrix X into two matrices “Q” and “R” as follows: b ¼ XTX� ��1
XTY
By Substituting X ¼ QR; b ¼ QTRTQR� ��1
QTRTY;we obtain
b ¼ Rð Þ�1QTY ð3Þ
4.1 Implementation of the Proposed Model
The computation of the coefficients “bi[]” of multiple linear regression using QRDecomposition on MapReduce framework will be three-stage processing or iterationsto facilitate parallel and distributed processing of the proposed model in efficientmanner. In the following section, we would like to present the algorithm withthree-stage MapReduce processing including main or driver function in respectivetables.Algorithm for the Proposed Model
The algorithm for the proposed model takes as parameters block numbers to beused to divide the large training input matrix ‘X’ and distribute it on several tasks of“Map” functions. The ‘Map’ function of the first stage takes ‘Xi’ sub-matricesdecomposed from big training data ‘X’ matrix for all ‘noBlock’. The two resultmatrices ‘Qi’ and ‘Ri’ with the respective ‘Keyi’ are produced for the ‘Reduce’function. The main idea here is to highlight that each ‘Map’ process load into memoryat the maximum size of a matrix (BlockSize, n) which significantly overcomes theproblem of “out of memory” with big matrix training data. Likewise, the ‘Reduce’process will also receive a maximum array with size (n*noBlock, n). Therefore,choosing the number of blocks should be considered according to the size or number ofmachines in the cluster we applied. The more increasing computing power may besimply adding new machines into the cluster for the purpose of improving the‘MapReduce Framework Parallelism’. The second stage receives input from the resultof first stage and the yi of for all blocks ‘i’. In the ‘Map’ function, the vector y isdecomposed into several vector yi (number of blocks) and then sent to ‘Reduce’function with associated key ‘Keyi’. The third or final stage uses the input from secondstage including set of vectors of ‘Vi’ and ‘Rfinal’. The ‘Map’ function constructs a list‘ListRV’ combining with all sets of ‘Vi’ from all blocks ‘i’ and ‘Rfinal’ with theassociated key ‘Keyfinal’. The ‘Reduce’ function takes the list ‘ListRV’ and adding thevalues of all ‘Vi’ vectors together to get the final vector V. Moreover, ‘Rfinal’ is appliedas inverse matrix and finally multiplying with ‘V’ to obtain the ‘bi[]’ as final output forthe proposed model (Tables 1, 2, 3 and 4).
14 K. L. L. Khine and T. T. S. Nyunt
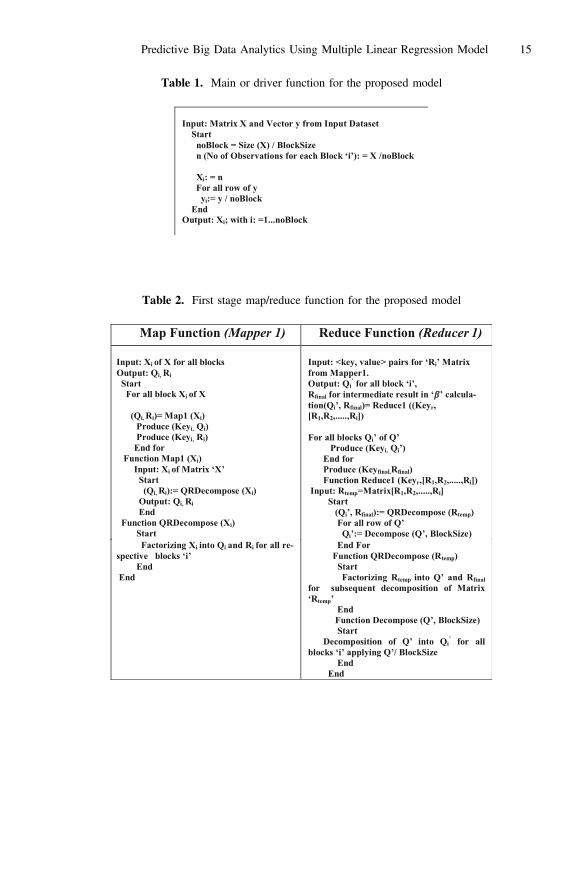
Table 1. Main or driver function for the proposed model
Table 2. First stage map/reduce function for the proposed model
Predictive Big Data Analytics Using Multiple Linear Regression Model 15
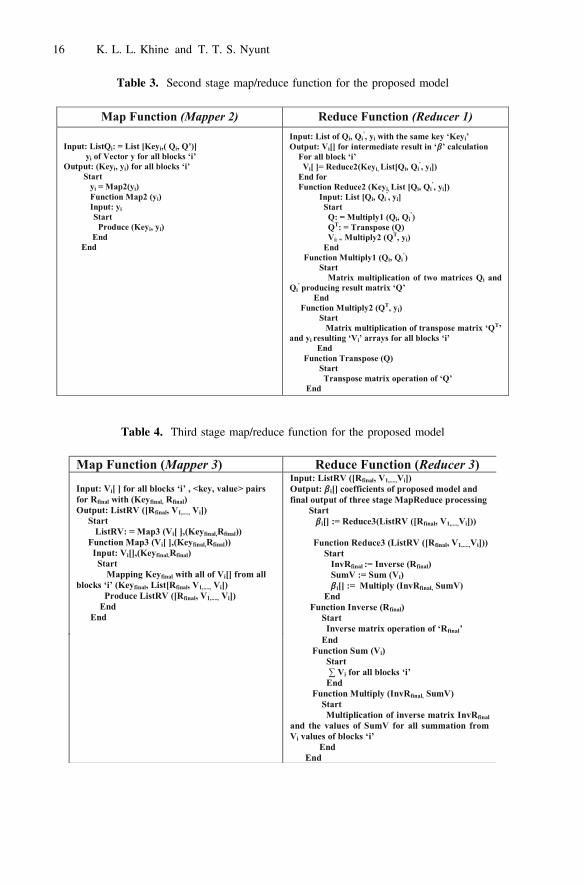
Table 3. Second stage map/reduce function for the proposed model
Table 4. Third stage map/reduce function for the proposed model
16 K. L. L. Khine and T. T. S. Nyunt

5 Experimentation, Discussion and Conclusion
5.1 Experimental Setup
We applied Apache Hadoop (Version 2.7.1) Framework which already consists ofMapReduce processing engine and Hadoop Distributed File System (HDFS). Forcluster setup, there are three machines with the specification of CPU (2.4 GHz 4 Core,RAM 4 GB, HDD 500 GB). One machine serves as master (“NameNode”) and the resttwo machines act as slaves (“DataNode”) to test our proposed model with javaimplementation. In this experiment, the dataset with 1.5 hundred thousand sampleswhich is applied in the simulation of one way roads or streets navigation for cityYangon, Myanmar. This training matrix form dataset composed of “150000” rows and“225” columns. Then, the performance measures in execution time upon four condi-tions (Figs. 1 and 2):
1. Single or conventional processing not distributed environment without applyingdecomposition technique
2. Parallel processing not in distributed environment and also without applyingdecomposition technique
3. Single or conventional processing not distributed environment but applyingdecomposition technique
4. Parallel and distributed processing and also applying decomposition technique (theproposed idea) are presented in the following diagrams.
Fig. 1. The performance measures in four conditions
Fig. 2. The overall performance measures between four conditions
Predictive Big Data Analytics Using Multiple Linear Regression Model 17

5.2 Discussion and Conclusion
According to the experimental results, our proposed work can handle the input massivetraining matrix (m, n) by distributing the computation on “Map” tasks and then localmatrix decomposition function for optimization of the proposed model and finallycombine and extract model coefficients “b” on “Reduce” tasks without facing any riskof “out of memory”. Moreover, we can also prove that our approach provides moreefficient computation and response time in compare with others. In this paper, ourcontributing idea is to show that the adaptation of classical regression analysis gen-erally and multiple linear regression especially is possible to provide a response to thephenomenon of big data analysis. Therefore, our focus mainly places upon traditionalmultiple linear regression for parallel and distributed massive data processing withMapReduce paradigm. We intend to increase processing performance by avoidinglimited memory utilization on massive data providing scalability and flexibility.Moreover, the proposed model will be provided with the purpose of solving extremelylarge matrices where the problems of entire matrix would not be able to fit in memoryand several reads and writes to the hard disk drive would be required to do. We willconsider further improvements in our proposed model by adding a preprocessing stepmaking the input training matrix into tall-and-skinny matrix form (very large number ofrows but fewer numbers of columns) which is an important and commonly used inlinear regression models for the model. And then, we will present further performanceevaluation results and comparative studies for prediction accuracy outcomes obtainedfrom the model.
References
1. Adjout, M.R., Boufares, F.: A massively parallel processing for the multiple linearregression. In: 2014 Tenth International Conference on Signal-Image Technology &Internet-Based Systems (2014)
2. Ahsan, O., Elman, H.: QR Decomposition in a Multicore Environment (2014)3. Amir, G., Murtaza, H.: Beyond the hype: Big data concepts, methods and analytics. Int.
J. Manage. 35, 137–144 (2014)4. Benson, A.R., Gleich, D.F, Demmel, J.: Direct QR factorizations for tall-and-skinny
matrices in MapReduce architectures. In: 2013 IEEE International Conference on Big Data(2013)
5. Dergisi, T.B., Sayfasi, D.W.: Multivariate multiple regression analysis based on principalcomponent scores to study relationships between some pre- and post-slaughter traits ofbroilers. J. Agric. Sci. 17, 77–83 (2011)
6. Fan, T.H., Lin, D.K.J., Cheng, K.F.: Regression analysis for massive datasets. Data Knowl.Eng. 61, 554–562 (2007)
7. Florina, C., Elena, G.: Perspectives on Big Data and Big Data Analytics (2013)8. Jun, S., Lee, S.J., Ryu, J.B.: A divided regression analysis for big data. Int. J. Softw. Eng.
Appl. 9, 21–32 (2015)9. King, M.L., Evans, M.A.: Testing for block effects in regression models based on survey
data. J. Am. Stat. Assoc. 63, 1227–1236 (1986)10. Li, R., Li, B., Lin, D.K.J.: Statistical inference in massive data sets. Appl. Stochast. Models
Bus. Ind. 29, 399–409 (2013)
18 K. L. L. Khine and T. T. S. Nyunt