
ThestructureofZrO 2phasesanddevitrificationprocessesina Ca ... · ThestructureofZrO...
37
manuscript hx5013 for review Journal of Applied Crystallography ISSN 0021-8898 Editor: Gernot Kostorz The structure of ZrO 2 phases and devitrification processes in a Ca-Zr-Si-O based glass-ceramic: a combined A-XRD and XAS study Meneghini Carlo, Mobilio Settimio, Bondioli Federica, Ferrari Anna Maria, Manfredini T. and Siligardi Cristina CONFIDENTIAL – NOT TO BE REPRODUCED, QUOTED NOR SHOWN TO OTHERS SCIENTIFIC MANUSCRIPT For review only. Category: research papers Co-editor: Dr J.L. Hodeau Laboratoire de Cristallographie - CNRS, 25 Avenue des Martyrs, BP 166, F-38042 Grenoble CEDEX 09, France Telephone: 33 4 76881142 Fax: 33 4 76881038 Email: [email protected] Contact author: Carlo Meneghini Physics, Universita’ di Roma Tre, Via della Vasca Navale, 84, Roma , Italy, I-00146, Italy Telephone: +39 06 5517 7217 Fax: + 39 06 5579303 Email: meneghini@fis.uniroma3.it
Transcript of ThestructureofZrO 2phasesanddevitrificationprocessesina Ca ... · ThestructureofZrO...

manuscript hx5013 for review
Journal of
AppliedCrystallography
ISSN 0021-8898
Editor: Gernot Kostorz
The structure of ZrO 2 phases and devitrification processes in aCa-Zr-Si-O based glass-ceramic: a combined A-XRD and XAS study
Meneghini Carlo, Mobilio Settimio, Bondioli Federica, Ferrari Anna Maria,Manfredini T. and Siligardi Cristina
CONFIDENTIAL – NOT TO BE REPRODUCED, QUOTED NOR SHOWN TO OTHERS
SCIENTIFIC MANUSCRIPT
For review only.
Category: research papers
Co-editor:
Dr J.L. HodeauLaboratoire de Cristallographie - CNRS, 25 Avenue des Martyrs, BP 166, F-38042 Grenoble CEDEX 09, France
Telephone: 33 4 76881142
Fax: 33 4 76881038Email: [email protected]
Contact author:
Carlo Meneghini
Physics, Universita’ di Roma Tre, Via della Vasca Navale, 84, Roma , Italy, I-00146, Italy
Telephone: +39 06 5517 7217
Fax: + 39 06 5579303Email: [email protected]

referee’s report
international union of crystallography
referee’s report
Journal: Journal of Applied Crystallography
Paper reference: hx5013
Title: The structure of ZrO 2 phases and devitrification processes in a Ca-Zr-Si-O based glass-ceramic: acombined A-XRD and XAS study
Author(s): Meneghini Carlo, Mobilio Settimio, Bondioli Federica, Ferrari Anna Maria, Manfredini T. and SiligardiCristina
Please either fax this form or e-mail your comments to the Co-editor. If you cannot review this manuscript by thedesired deadline, please contact the Co-editor immediately so that it can be sent to another referee. This form isprovided for your convenience. If preferred, your report may be returned in any other format.
1. Is the manuscript worthy of publication?
Yes, as it is ;
Yes, with minor revision ;
Yes, but with major revision ;
No, not at all
2. Is the work technically sound?
Does the evidence presented justify the conclusions drawn?
If not, please specify.
3. Is the presentation as efficient as possible?
Can any material be omitted or deposited?
Please specify.
4. Is the choice of journal correct?
(Not relevant to conference proceedings.)
5. Have the requirements of Notes for Authors been met?
6. Is the Literature adequately cited?
7. Revisions to be made by the author.
If it is necessary to continue on another sheet, please enclose an extra unsigned copy.
Signature Date

1
The structure of ZrO2 phases and devitrificationprocesses in a Ca-Zr-Si-O based glass-ceramic: a
combined A-XRD and XAS study
Carlo Meneghini,a,b* S. Mobilio,a L. Lusvarghi,c F. Bondioli,c A.
M. Ferrari,c T. Manfredinic and C. Siligardic
aDipartimento di Fisica Universita di ”Roma Tre” Via della vasca navale 84
I-00146 Roma Italy, bINFM-OGG c/o ESRF Grenoble, France, and cDipartimento
Ingegneria dei Materiali e per l’Ambiente, Via Vignolese 905, 41100 Modena, Italy.
E-mail: [email protected]
(Received 0 XXXXXXX 0000; accepted 0 XXXXXXX 0000)
Abstract
The structure of Zr atomic environment in a CaO-ZrO2-SiO2 glass-ceramic has been
studied combining x-ray absorption spectroscopy (XAS), X-ray diffraction (XRD) and
anomalous-XRD (a-XRD) techniques as a function of thermal treatments. The anal-
ysis of XRD patterns demonstrates that the devitrification process, as a function of
thermal treatment, proceeds through the partial segregation of Zr-depleted phases
(Wollastonite-like) and Zr-rich phases (Zr-oxides). The XAS and a-XRD measure-
ments at the Zr K edge have been exploited to get a closer insight on the atomic
structure around Zr ions. In the as quenched glass the Zr is 6-fold coordinated to Oxy-
gen atoms in an amorphous environment rich of Ca and Si. Thermal treatment firstly
(T=1000 - 1050 oC) determines the partial segregation of Zr in form of oxide which
crystalline structure is that of tetragonal Zirconia (t-ZrO2). Raising the temperature
(T=1100 oC) provokes the formation of ZrO2 crystallites in the monoclinic crystallo-
graphic phase (Baddeleyite: m-ZrO2). The analysis of XAS data demonstrates that a
considerable amount of Zr still remains in an amorphous Calcium-Silicate phase.
PREPRINT: Journal of Applied Crystallography A Journal of the International Union of Crystallography

2
1. Introduction
Glass-ceramics are composite materials obtained from partial devitrification of a par-
ent glass through a controlled heating treatment(Strnad, 1986). The evolution of
the glass structure under thermal treatment proceeds through thermodynamically
metastable phases toward a final material made of microcrystalline phases finely dis-
persed into amorphous phases. The processes occurring during the devitrification and
the physical properties of a glass-ceramic material basically depend on the composi-
tion, thermal treatments as well as on a number of factors, such as nucleation and
crystallization phenomena, and chemical nature of the elements(Weinberg, 1993). An
accurate knowledge of metastable phases and intermediate structures evolving during
the thermal treatments are essential for a deep understanding the physical-chemistry
processes giving rise to the final glass-ceramic material.
One of the basic systems in glass ceramics technology belongs to the CaO-ZrO2-
SiO2 (CZS) ternary system (Kordyuk & Gul’ko, 1962). The large interest in adding
Zirconium oxide (ZrO2) to CaO-SiO2 glasses springs out from the general improvement
of chemical, thermal and mechanical features of the final material. ZrO2 addition,
in fact, increases the density, enhances the viscosity and, in general, improves the
mechanical and chemical resistance (Amoros et al., 1994; Escardino et al., 1996). The
role of Si, acting as glass network former, and that of Ca, acting as stabilizer network
modifier, are well established. On the contrary the role of Zr, classified as intermediate
between network former and modifier, is poorly understood. Adding ZrO2 can have,
in fact, different effects on the formation and development of the microcrystalline
structure of the glass (Mac Millan, 1964; Neilson, 1972; Vogel, 1994): it can favour
a metastable liquid-liquid phase separation with subsequent formation of crystalline
nuclei in the phase separated regions; or it may form small crystallites acting as
heterogeneous nucleation sites for the crystallization of the glass matrix.
IUCr macros version 2.0β12: 2003/11/04

3
The main purpose of this work is studying the atomic environment of Zr in a CZS
glass-ceramic: (CaO)x(ZrO2)y(SiO2)z (x ∼ 0.4, y ∼ 0.05, z ∼ 0.55) as a function of
thermal treatment. To this aim we exploited the ample complementarities of X-ray
absorption spectroscopy (XAS) and anomalous X-ray Diffraction (a-XRD) techniques
to probe atomic order around Zr ions at local, medium and long range scale. In
particular we used XAS techniques, namely EXAFS (x-ray absorption fine structure)
and XANES (x-ray absorption near edge structure), in order to probe the local atomic
environment around the Zr, while we exploited the long-range order sensibility of a-
XRD to probe the crystalline nature of the phases containing Zr.
Our results put in evidence the nucleation and growth of crystalline ZrO2 phases
from an amorphous Zirconium-Calcium Silicate (Si-Ca-Zr-O) phase, as a function of
thermal treatment. The segregation of Zr-oxide particles proceed firstly with the for-
mation of small t-ZrO2 crystallites. Raising the temperature produces m-ZrO2 crystal-
lites. We observe that tetragonal ZrO2 phase present systematically broader diffraction
lines with respect to the monoclinic m-ZrO2 phase (Beddeleyte structure) suggesting
the presence of more defective/smaller crystallites in the t-ZrO2 phase. The analysis
of the XAS data shows that a considerable amount of Zr remains in the amorphous
calcium silicate phase, even after firing the sample at 1100 oC.
2. Experimental
2.1. sample preparation and characterization
The studied glass belongs to the Wollastonite stability field of ternary CaO-ZrO2-
SiO2 system (Matsumoto et al., 1954). A mixture containing Calcium Carbonate
(CaCO3 100%), Silica (SiO2 99.9 %) and Zirconium Silicate (ZrSiO4 99.9%) as raw
materials was prepared with weight ratios SiO2/CaO = 3/2, and ZrO2=10 wt%. The
resulting molar composition of the sample was: (CaO)39.78(ZrO2)4.52(SiO2)55.70.
IUCr macros version 2.0β12: 2003/11/04

4
The mixture was melted in platinum crucible in an electric furnace at about 1590
oC for 40 minutes soaking time. The melted batch was quenched in a graphite crucible
to obtain bar shaped pieces of glass. Plates of glass, 1 mm thick, were cut from the
bars and thermally treated on a muffle kiln in order to obtain glass-ceramic materials.
Samples were heated at 10 oC min−1 to the Ta =1000, 1050 and 1100 oC and were
kept at Ta for 60 min, thus were placed on refractory bricks and slowly cooled down to
room temperature (RT). None of the samples fractured during cooling. In the following
we will refer to the as quenched (AQ) glass and treated samples as AQ, 1000, 1050
and 1100 respectively.
Samples were preliminary characterized by standard differential thermal analysis
(DTA), electron microscopy (SEM) and standard X-ray diffraction techniques. DTA
analysis was performed on about 30 mg of fine powders (grain size of about 20µm)
placed in Pt crucible. DTA curves display a change in the sample specific heat due
to a glass transition at Tg = 763oC, and an exothermic peak corresponding to a
crystallization temperature at Tc = 969oC. SEM observations were performed on
superficially polished gold-coated specimens. SEM images show, in all the fired sam-
ples, a poly-crystalline habit typical of Wollastonite. The sample treated at 1100 oC
presents dispersed micrometer sized agglomerates of particles that appear white in
backscattered electron analysis (figure 1) and must be attributed to Zr rich phases.
Preliminary XRD characterization was achieved on a laboratory powder diffractometer
(Philips PW3710) using a Ni filtered Cu-Kα x-ray beam. In the as quenched glass the
XRD patterns demonstrate the amorphous nature of the material while XRD patterns
of fired samples depict the progressive evolution of crystalline phases as a function of
temperature. Qualitative pattern analysis has showed that the principal crystalline
phases developing during the thermal treatments are Wollastonite-like (CaSiO3) but
the samples treated at the higher temperature (1100 oC) demonstrate also the presence
IUCr macros version 2.0β12: 2003/11/04

5
of Baddeleyite (m-ZrO2) phase.
2.2. Synchrotron radiation x-ray diffraction
Synchrotron radiation XRD patterns were collected at the GILDA (General Italian
Line for Diffraction and Absorption) beamline (Pascarelli et al., 1996) at the ESRF
(European Synchrotron Radiation Facility), using an angle dispersed set-up based on
an Imaging Plate (IP) detector (Meneghini et al., 2001). Beam energies were selected
using a double crystal (Si [311]), sagittal focusing, monochromator. An air filled ion-
ization chamber monitored the incoming x-ray intensity that was kept constant by an
active feedback system (PID feedback). The x-ray spot size on the sample was about
0.7(v) × 1.5(h) mm2, the horizontal dimension being limited by the sagittal focusing
monochromator geometry, while the vertical size was selected in order to fully embed
the capillary sample holder (see below). Beam energies were calibrated taking as ref-
erence point the first inflection point of the K-edge absorption coefficient of pure Zr
metal foil (17998 eV). Samples for XRD were finely milled and enclosed in boro-silicate
glass capillaries (inner diameter 0.5 mm). Capillaries were mounted on a goniometer
head and kept rotating during data collection in order to improve the grain statistics.
The geometrical parameters, namely the sample to IP distance, IP to x-ray beam per-
pendicularity and instrumental line broadening were calibrated collecting diffraction
patterns of a LaB6 standard reference material (NIST). The IP was digitised using
a FUJI-BAS2500 reader with a pixel resolution of 100 × 100µm2 and a dynamical
range of 106 counts/pixel. Digitised images were treated and integrated to a standard
Intensity vs 2θ pattern using the Fit2D software (Hammersley et al., 1994).
The angle dispersed set-up allows collecting diffraction patterns having very high
count statistics keeping the collection time in the minute range. This allows detecting
very fine details in the diffraction patterns (figure 4) and is mandatory for accurate
IUCr macros version 2.0β12: 2003/11/04

6
a-XRD experiments. In this study the only disadvantage of this set-up with respect
to a 2θ scan geometry, is the reduced angular range (2θmax is limited to 40-50 deg.)
that shortens the available reciprocal space to a maximum exchanged momentum of
qmax ∼ 6A−1. This drawback prevents an analysis of XRD and a-XRD in terms of
radial distribution functions as done in our previous work (Meneghini et al., 1999).
The sample to detector distance and the sample holder diameter determine the in-
strumental line broadening (Meneghini et al., 2001) that is ∆2θinstr ∼ 5 × 10⁻² deg.
(FWHM), well below the minimum line width observed in our samples (∼ 1.2 deg. in
110 sample) but quite large if compared with the intrinsic line width of a high resolu-
tion diffractometer. The various structural contributions to the line broadening (i.e.
crystallite size, lattice defects, lattice strain) are different functions of the scattering
angle (Warren, 1990), so that, at least in principle, it should be possible to distinguish
between these effects and several methods have been developed to this end (Warren &
Awerbach, 1950; Warren & Awerbach, 1952; Willilamson & Hall, 1953; Wilson, 1962).
However the IP instrumental line broadening, coupled with the poor crystallographic
nature of our glass-ceramics limit the applicability of these methods preventing for
a complete line shape analysis. In particular strain- and size-related line broadening
effects cannot be distinguished within this set-up. Thus we decided to assume, for
shake of simplicity, the systematic evolution of ZrO2 diffraction patterns as a function
of thermal treatments, only related to a particle size effect. In this way the crystallite
size reported in table 1 represent, instead, an upper limit to the true crystallite sizes.
Two series of XRD patterns were collected with beam energy at E1 = 17000 eV
(λ = 0.7293 A), far below the Zr K edge, and E2 = 17990 eV (λ = 0.6892 A), near
below the Zr K edge. A third series of XRD patterns was collected at E3 = 11846 eV
(λ = 1.045 A), allowing for a closer insight on the crystallographic phases other than
Zr-ones. Collection time was fixed to 3 minutes for each pattern. Raw XRD patterns
IUCr macros version 2.0β12: 2003/11/04

7
(E3 series) of the four samples investigated are shown in figure 3: the XRD patterns
of AQ sample present smooth and broad features typical of amorphous structures.
The high quality of the data, however, reveals weak diffraction lines pointing out a
negligible contribution of crystalline phases, remnants of the vitrification processes.
Thermal treatment provokes the structural evolution involving the progressive growth
of crystalline phases. Notice that the sample treated at 1050 oC presents evident
changes also in the amorphous background suggesting that the firing process also
modifies the structure of the glassy phases.
The so called anomalous (or resonant) scattering effect consists in a relative ample
variation of the dispersion corrections (f ′ and f”) to the atomic scattering factor (fo)
of an element, in the energy region near an absorption edge (Materlik et al., 1994).
The anomalous-XRD technique exploits this effect to enhance the chemical selectivity
toward the absorbing atomic species. The intensity of a Bragg diffraction peak is
determined by the structure factor Shkl(q) that, in turn, is proportional to the atomic
scattering factor of the ions involved. Tuning the x-ray beam energy near a specific
absorption edge in the sample affects the intensity of those diffraction lines which
structure factor involve that absorbing atomic specie. Thus the difference between
XRD patterns collected tuning the beam energy far below (E1) and near (E2) a specific
absorption edge in the sample retains only those structural features involving the
absorbing atomic species (figure 4). In practice difference patterns are calculated as:
∆I(q) = IE1(q) − A(IE2(q) − B) (1)
where q = 4π sin(θ)/λ. A and B are empirical parameters: A takes into account dif-
ferences in beam intensity, IP sensitivity and x-ray absorption at the two energies;
B reproduces the increasing fluorescence contribution near the Zr absorption edge.
The A and B are determined minimizing the difference ∆I(q) in selected q-regions
IUCr macros version 2.0β12: 2003/11/04

8
regions of the diffraction patterns. Since Ca, Si and O ions present negligible disper-
sion in the used energy range used (see below), the contributions of Zr free phases
are expected to disappear in the difference pattern 1. The anomalous scattering fac-
tor variations (Dejus & del Rio, 1996) for Zr are ∆f ′Zr = f ′(E1) − f ′(E2) ∼ 5.5 and
∆f”Zr = f”(E1)−f”(E2) ∼ −0.95. For the other ions the differences are much smaller
(negligible): ∆f ′i < 1 × 10⁻² (i=Si, Ca, O); ∆f”Si,O < 1 × 10⁻²; ∆f”Ca ∼ 0.03. Dif-
ference patterns are reported in figure 5. The difference pattern of the as quenched
sample does not show diffraction lines meaning that the Zr is completely melted into
the amorphous matrix. The difference pattern for 1000 sample depicts a weak but
evident set of reflections closely resembling the diffraction pattern expected for t-
ZrO2 while new reflections, associated to the m-ZrO2 phase, appear raising the firing
temperature and became dominant in 1100 sample.
2.3. X-ray absorption spectroscopy
XAS experiments were carried out at the BM29 beamline (Filipponi et al., 2000)
at the European Synchrotron Radiation Facility (ESRF) in Grenoble (France). Beam
energies were defined using a Si[111] double crystal - fixed exit monochromator. Har-
monic rejection was achieved by detuning the monochromator crystals to 1/3 of the
rocking curve. The monochromator crystal detuning and the large energy of the first
allowed harmonic (> 50 keV) with respect to the ESRF critical energy (20 keV) ensure
a high quality monochromatic beam with negligible harmonic content.
XAS spectra at the Zr K-edge (17998 eV) have been collected in standard trans-
mission geometry with fixed δk � 0.024A−1, leading to more than 103 points per1 Notice that the angle dispersed set-up prevents employing a data normalization and correctionstrategy suitable for parallel-beam high-resolution diffractometer (as for example the one proposed byBurger and coworkers (Burger et al., 1988)). In our case, in fact, data normalization must take intoaccount for air scattering and fluorescence background, detector efficiency, geometrical correctionsand other factors which are difficult to precisely parameterize. On the contrary we found that allthese effect can be simply and reliably taken into account by the A and B parameters
IUCr macros version 2.0β12: 2003/11/04

9
spectrum. Incident (Io) and transmitted (It) x-ray intensities were measured using Ar
filled ionization chambers. The absorption signal is defined as µ(E) = ln(Io/I1). Fine
samples powders were mixed with BN powders (1:5 weight ratio) and pressed in pel-
lets. In order to reduce the effects of thermal disorder, that attenuate the structural
EXAFS signal, samples were mounted in a closed-cycle He refrigerator and cooled
down to about 30 K for data acquisition. The low signal to noise ratio 2 (∼ 10−4) and
the wide energy range extending up to about 2 keV above the edge (allowing to reach
a maximum k (see below) higher than 18A−1), ensure the high XAS data quality. The
fig. 2 reports the raw absorption data for the four samples investigated.
The structural XAS signal, known as XAFS (X-ray Absorption Fine Structure),
is defined as the relative oscillation of the absorption coefficient µ(k) around the
atomic cross section µo(k), normalized to the atomic K-edge cross section (Lee &
Pendry, 1975; Lee et al., 1981):
χ(k) =µ(k) − µo(k)
µo(k)
where k =√
2m(E − Eo)/h2 is the modulus of the photoelectron wave vector.
For a given distribution of neighbouring ions around the absorber a, i.e. for a given
partial pair distribution function 4πρor2g
(2)ai (r), the structural XAFS signal is written
as (Filipponi et al., 1995):
χi(k) =∫ ∞
o4πρor
2g(2)ai (r)γ(2)
a,i (k, r)dr (2)
where the γ(2)a,i (k, r) represents the contribution to the XAFS signal associated to a
single ion i at a distance r from the absorber. In case of Gaussian distribution of2 The statistical noise of XAS data has been evaluated as follow: the post-edge µ(E) was fitted withhigh order polynomials simulating the structural signal. The statistical noise was then estimated asthe variance of the difference, normalized to the jump eight, between polynomial functions and theexperimental µ(E)
IUCr macros version 2.0β12: 2003/11/04

10
neighbour shells the integration of eq. 2 gives rise to the well known formula (Lee
et al., 1981):
χi(k) = Aai(k)Ni
kR2i
sin(2kRi + φai(k))e−2k2σ2i e−2Ri/λ(k) (3)
and the total EXAFS signal is: χ(k) = S2o
∑i χi(k). Ni is the coordination number,
Ri the average shell radius and σ2i the variance of the distribution. The Aai and φai
are the amplitude and phase functions in the photoelectron backscattering process.
S2o is an empirical parameters taking into account many body losses and λ(k) is the
photoelectron mean free path.
Differently from x-ray scattering, the strong interaction of the photoelectron with
the atomic potentials surrounding the absorber makes the XAS technique sensitive
to the many body distribution functions (Lee et al., 1981; Benfatto et al., 1986; Fil-
ipponi et al., 1995; Filipponi & Di Cicco, 1995). In the so called EXAFS (extended
x-ray absorption spectroscopy) region, that starts some tenth of eV above the edge, the
limited (few A) photoelectron mean free path, the 1/R2i and the Debye-Waller terms
suppress the contribution coming from long photoelectron paths, so that the multiple
scattering and/or medium range order effects are generally weak. In the near edge
region (XANES) the multiple scattering effects are dominant, making the XANES
highly sensitive to the topology of the atomic environment (Lee et al., 1981; Benfatto
et al., 1986). In addition the details of the electronic configuration near the Fermi
level are also relevant in the XANES region. The large amount of information (struc-
tural and electronic) makes an ab-initio quantitative interpretation of the XANES
region a difficult task. Nevertheless relevant information can be still obtained empir-
ically, comparing the experimental data with reference materials and/or simulations.
(Bianconi, 1988)
The XANES region has been interpreted with the help of simulated spectra cal-
IUCr macros version 2.0β12: 2003/11/04

11
culated using the FEFF8.0 package (Ankudinov et al., 1998). The analysis of the
EXAFS data was performed using the GNXAS package (Filipponi et al., 1995; Filip-
poni & Di Cicco, 1995) along the lines already described in a previous work (Meneghini
et al., 1999).
3. Results and discussion
3.1. XRD.
The XRD patterns reported in figure 3 depict the progressive devitrification pro-
cess as a function of the heating temperature. In the as quenched glass weak Bragg
reflections point out the presence of weak amount of crystalline phases (estimated
lower than 1%) that survived to the vitrification process. These contributions were
not detected by a previous laboratory XRD analysis. In particular the most intense
peak at about 17.73 deg. corresponds to the (101) reflection (d=3.39 A) of quartz
(SiO2) (Wright & Lehmann, 1981). A similar contribution has been observed in previ-
ous work (Meneghini et al., 1999), however the much better statistics in these patterns
allows now a more reliable peak assignment. This is evident looking at the middle
panel in figure 3 which reports the XRD pattern of AQ sample subtracted of the
background (simulated with a smooth polynomial). The features corresponding to the
Quartz phase are clearly recognized, while contributions of other crystalline phases
can be excluded.
In 1000, 1050 and 1100 samples XRD patterns of crystalline phases became evident
(figure 3). Even if the main reflections can be indexed within a Wollastonite-like struc-
tures (see for example the lower panel in figure 3), the pattern appears really complex
and several crystalline unknown phases are involved so that the quantitative interpre-
tation of the whole XRD patterns as a function of thermal treatment is a difficult task
which would give poorly reliable results. In the present study we principally focus on
IUCr macros version 2.0β12: 2003/11/04

12
the Zr-containing phases; therefore we exploited the a-XRD technique at the Zr K-
edge. The difference patterns reported in figure 5 demonstrate that the Zr-containing
phases evolve as a function of thermal treatment: the difference pattern of 1000 sample
presents a weak but visible family of peaks closely resembling the pattern expected
in t-ZrO2. Notice that cubic (c-ZrO2) tetragonal (t-ZrO2) Zirconia phases have very
similar XRD patterns, the main difference being the splitting of some reflections due
to the reduced symmetry of tetragonal phase. The broad diffraction lines observed in
the difference pattern of 1000 sample does not allow distinguishing between cubic and
tetragonal phases. However a sizable amount of cubic Zirconia can be excluded on the
basis of XANES results (see below). This finding demonstrates the early nucleation
of ZrO2 tetragonal phase that, owing its weakness, we did not see in our previous
works. In the difference pattern of 1050 sample a new set of reflection appears. These
new reflections are readily associated to the m-ZrO2 phase. In the sample 1100 the
contribution of m-ZrO2 phase increases with respect to the t-ZrO2 one and becomes
dominant.
In order to have quantitative information, the difference patterns were refined within
the Rietveld full profile refinement approach (GSAS package (Larsen & Von Dreele,
2000)) using a pseudo-Voigt profile function. The t-ZrO2 phase contribution has been
refined within the P42/nmc space group (N. 137) (Canton et al., 1999). The atomic
positions where Zr (0.75, 0.25, 0.25) and O (0.25, 0.25, 0.450). The m-ZrO2 phase
contribution has been refined within the P21/c space group (N. 14) (Hann & Al, 1985).
The atomic positions were kept fixed at Zr (0.274, 0.039, 0.209), O1 (0.063, 0.328,
0.347) and O2 (0.449, 0.755, 0.482). The results of Rietveld analysis are reported in
table 1. The refined unit cell of tetragonal phase has a = 3.63A, in good agreement
with the value a = 3.629A expected for pure t-ZrO2 (Canton et al., 1999), but the
cell appears slightly elongated along c (c = 5.23A) with respect to the pure t-ZrO2
IUCr macros version 2.0β12: 2003/11/04

13
in which c = 5.197A. The b and c cell edges refined for the monoclinic phase appear
slightly enlarged (∼ 1%) with respect to the reference m-ZrO2 (Hann & Al, 1985)
structure.
The tetragonal phase presents diffraction lines systematically broader than those
of the monoclinic phase. Crystallite size, lattice defects and strain concur to enlarge
the diffraction lines, then this trend suggests that the tetragonal phase is made of
more poorly crystallized (smaller and/or more defective) particles with respect to the
monoclinic phase. Owing the aforementioned limitation of the IP based set-up, only
the particle size was estimated by the line profile analysis applying the Sherrer for-
mula as described in the GSAS manual: D(A) = Kλ/Lx, where Lx is the Lorentzian
contribution to the line shape and K=0.9 is the Sherrer constant. Standing these ap-
proximations, the maximum particle size in t-ZrO2 phase is about 80 A in sample
treated at 1000 oC, and increases to about 150 A after firing at 1050 oC and 1100
oC. On the contrary the maximum size of m-ZrO2 crystallites is sensibly larger being
about 200 A in 1050 sample and growing up to about 400 A in 1100 sample. The rel-
ative volume fraction for m-ZrO2 and t-ZrO2 phases are reported in the last column
of table 1 and demonstrate the progressive evolution of ZrO2 phases from tetrago-
nal to monoclinic. The appearance of metastable t-ZrO2 in form of small particles in
samples treated at lower temperatures must be related to the peculiar particle size
dependent phase diagram (Garvie, 1965) of ZrO2 which shows that reducing the par-
ticle size enhances the stability of t-ZrO2 phase over the m-ZrO2 one. It has been
demonstrated that this peculiar trend originates from the considerably larger surface
energy in m-ZrO2 with respect t-ZrO2 phase. Thus increasing the surface to volume
ratio raises the molar free energy of m-ZrO2 making the t-ZrO2 energetically more
favourabl. Thermodynamic calculations (Garvie, 1978) estimated the critical size for
t-ZrO2 phase stability around 100-120 A. This value is in good agreement with the
IUCr macros version 2.0β12: 2003/11/04

14
upper limit for t-ZrO2 crystallites we have found around 150A.
The most relevant information derived from a-XRD are that the temperature treat-
ment provokes the crystallization of ZrO2 oxide phases: firstly tetragonal, then mono-
clinic. In addition a-XRD results exclude the growth of crystalline phases containing
Zr different from ZrO2.
3.2. X-ray Absorption Spectroscopy
The analysis of the XAS spectra concerns both the extended and the near edge
regions. In the XANES region the available information mainly derives from a qual-
itative or semi-quantitative comparison with available models. The analysis of the
EXAFS spectra, that was performed taking into account a-XRD and XANES results,
allowed a more quantitative insight on the average local structure around Zr.
3.2.1. XANES. The sensibility of the XANES region of the absorption spectra to the
topology of the local atomic environment around the absorber, will help in definitively
assess the local atomic structure around Zr this CZS glass ceramic as a function of
thermal treatment.
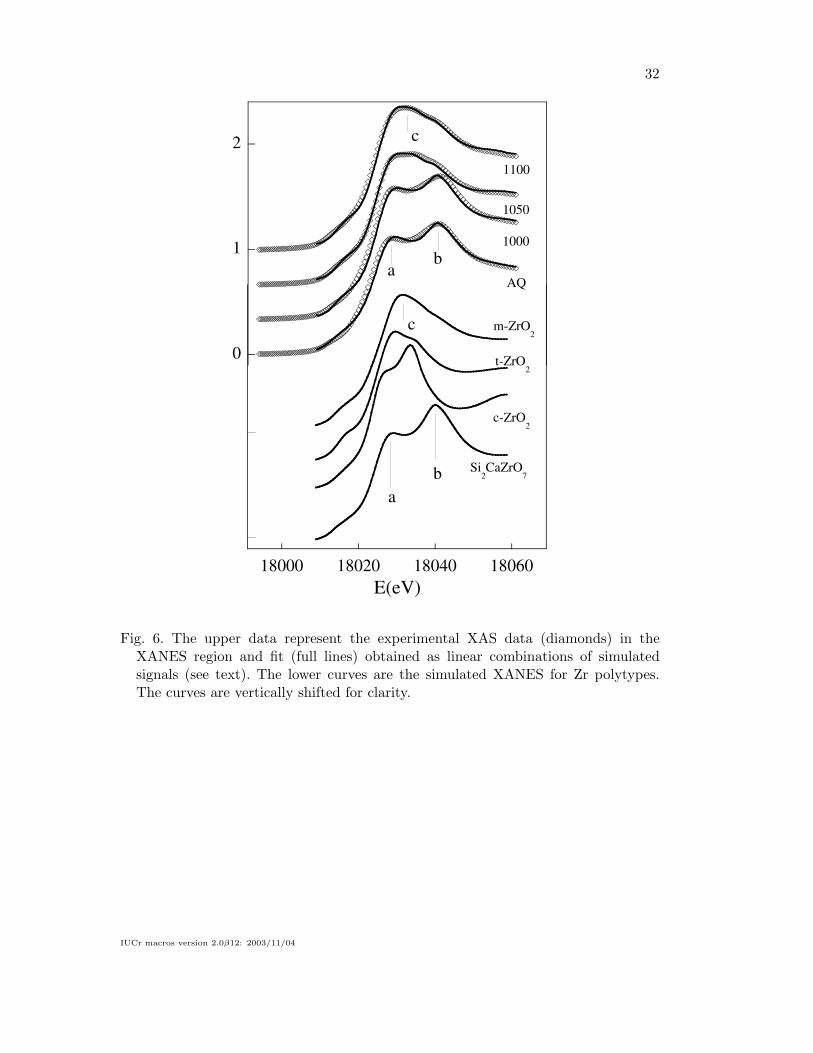
The experimental XANES data for the four investigated samples are shown in fig-
ure 6 in which we also show the theoretical XANES calculated on the basis of crystal-
lographic Zr polytypes: c-ZrO2 (Li et al., 1993), t-ZrO2 (Canton et al., 1999), m-ZrO2
(Hann & Al, 1985) (baddeleyte) and CaZrSi2O7 (Roelofsen-Ahl & Peterson, 1989)
(Gittinsite). The Gittinsite model has been choose after several tests on different Ca-
Zr silicates as the one giving the best agreement between theoretical and calculated
XANES. The local atomic environments of the four models are shown in figure 9. In
all the samples preliminary refinements have shown a negligible fraction of c-ZrO2
allow excluding a cubic environment for Zr in these samples.
IUCr macros version 2.0β12: 2003/11/04

15
The experimental XANES change weakly between AQ and 1000 samples. This trend
is rather different from what observed in XRD patterns of AQ and 1000 samples in
which the crystallization progress is well evident. In agreement with our previous
results (Meneghini et al., 1999), this finding suggests that the early stages of devitri-
fication process have only minor effect on the Zr local environment, mainly affecting
the Wollastonite-like phases. Raising the firing temperature (1050 and 1100 samples)
provokes large modifications also in the Zr environment.
The experimental XANES data of AQ and 1000 samples present two main features
(labelled as a and b in figure 6). These features closely resemble those found in Git-
tinsite and suggest an octahedral arrangement of Oxygen neighbours around Zr. In
1050 sample a new contribution (labelled as c in figure 6) appears between the a and
b shoulders, this peak is close the single maximum found in the XANES calculated
for t-ZrO2 and m-ZrO2 structures. The XANES features of 1100 sample definitively
evolve closely to the curves calculated for m-ZrO2 model. In order to get a quanti-
tative interpretation of the XANES region we fitted the experimental data with a
linear combination of the three models: m-ZrO2, t-ZrO2, and Gittinsite. The fitting
demonstrates that in the AQ sample the 80% of Zr is embedded in a calcium silicate
glassy phase whose local structure closely resembles that of Gittinsite. Even in the AQ
sample about 20% of Zr has a local environment similar to that of t-ZrO2. Both these
phases must be amorphous, since no diffraction lines were observed by a-XRD. The
fraction of Zr contained in the calcium silicate phase decreases with increasing the
temperature below the 20% in 1100 sample. The fraction of t-ZrO2 increases reaching
a maximum of 27-32% in the samples treated at intermediate temperatures (1000 and
1050 samples) and decreases to about 10% in the sample treated at 1100 oC. The m-
ZrO2 phase appears only after treating the sample at 1050 oC (43%) and its fraction
increases rapidly raising the firing temperature till about 75% in 1100 sample.
IUCr macros version 2.0β12: 2003/11/04

16
XRD results appear fully coherent with a-XRD analysis: raising the firing tem-
perature provokes the transition of Zr-containing phase from a Cacium Silicate en-
vironment toward tetragonal and monoclinic ZrO2 phases. Notice that the XANES
analysis allows probing all the phases containing Zr, either long range ordered either
disordered (glass phase). This is different from a-XRD experiments, which allow prob-
ing only long range ordered phases. However the ratios between t-ZrO2 to m-ZrO2
phase fraction derived from the analysis of the XANES data are in good agreement
with those obtained from a-XRD, this gives confidence on the results obtained.
3.2.2. EXAFS. The ”ab-initio” quantitative refinement of the EXAFS spectra in
this kind of samples, in which several Zr containing phases are presents with high
degree of disorder, is a difficult task. However we exploited the previous knowledge
coming from a-XRD and XANES techniques to constrain the analysis and improve
the reliability of the EXAFS analysis.
The figure 7 shows the experimental k2 weighted EXFAS data of the investigated
samples. Details of the refinements are shown in figure 8. The EXAFS signals change
weakly between AQ and 1000 samples, as already noticed from XANES data analysis.
Raising the firing temperature (1050 and 1100 samples) provokes the appearance of
high frequency structures in the EXAFS spectra point out the evolution toward a
medium/long range ordered structure. The modulus of the Fourier transforms (FT) of
the AQ and 1000 samples depict a disordered environment in which only a main nearest
neighbour shell and a weak next neighbour shell are present. In the 1050 and 1100
samples the FT’s dramatically change providing direct evidence of the crystallization
progress as a function of firing temperature.
The quantitative analysis of the EXAFS data requires up to 6 partial contributions
(figure 8) to reproduce the Zr atomic environment till about 3.7-4 A. We found the
IUCr macros version 2.0β12: 2003/11/04

17
multiple scattering contributions negligible in this range (Li et al., 1993) and only two
bodies contributions were used (Filipponi & Di Cicco, 1995). For each shell we refined
the multiplicity (coordination number, N), path length (coordination distance, R) and
Debye Waller factor (variance, σ2). We found N, R and σ2 parameters of Zr-Si and
Zr-Ca shell strongly correlated, thus, for sake of simplicity, the same distance and σ2
were used for the two contributions, leaving free the two coordination numbers. Within
this choice the NZrSi is similar to NZrCa for all the samples. The same S2o = 0.85 was
used analysing all the EXAFS spectra. We found the edge energy changing less than
0.6 eV among the various samples, then Eo was kept fixed for all the samples in the
final refinements. The best fit parameters are resumed in table 3.
In the AQ sample the Zr is coordinated to 5-6 Oxygen neighbours located around
2.14A. This Zr-O shell, however, appears heavily distorted and not Gaussian. This is
due either to the intrinsic distortion of Zr-O environment in ZrO2 polytypes (Table 4)
either to the superimposition of different Zr local environments coherently with XRD
and XANES results. In the AQ sample a double Zr-O shell improves the fitting but
also produces large correlations among the fitting parameters. We found that, in this
sample, a cumulant expansion (Filipponi & Di Cicco, 1995), including a skewness
(β ∼ 1.5) and a Kurtois (K ∼ 0.05) term improves the fitting while keeping reduced
the correlation among the parameters without affecting the global structural results.
In all the other samples the Zr-O nearest neighour distribution is reproduced with two
gaussian shells. The next neighbours shell is composed by a combination of Si and Ca
neighbours located around 3.4A in agreement with our previous results (Meneghini
et al., 1999). The Zr-Si/Ca coordination distance is similar to the Zr-Si/Ca distance
expected, for example, in Gittinsite (see table 4) (Roelofsen-Ahl & Peterson, 1989) and
this finding confirms that the Zr, in the as quenched glass, is embedded in a calcium
silicate glassy phase. A Zr-ZrI coordination shell is found around 3.55 A. It appears
IUCr macros version 2.0β12: 2003/11/04

18
quite disordered (σ2 ∼ .013A2) and the distances is in between the Zr-Zr distances in
m-ZrO2 (∼ 3.5A) and t-ZrO2 (∼ 3.65A).
In the 1000 oC sample the Zr-O nearest neighbour shell depicts a clear bimodal
distribution characterized by two Gaussian contributions: the former being about 5
oxygen ions at about 2.16 A while about 1 Zr-O bond is found around 2.35 A. These
distances being close to the first and second Zr-O distances expected in t-ZrO2 struc-
ture (Table 4).
The coordination number and σ2 of Zr-Si/Ca contributions change weakly, this
pointing out a minor effect of thermal treatment on the Zr environment in the calcium
silicate phase. The Zr-Zr next neighbour distribution is split in two contributions: the
Zr-ZrI at ∼ 3.5 A and the Zr-ZrII at ∼ 3.65 A close to the first Zr-Zr shell in t-ZrO2
polytype (table 4).
In the sample 1050 the first Zr-O shell does not change appreciably, but the Zr-O
shell around 2.35 A becomes more evident with increasing N (∼ 2.5) and decreasing
σ2 (∼ 6 × 10⁻³A2). The total Zr-O coordination number in 1050 sample is around 8
in agreement with a t-ZrO2 structure (see table 4). The next neighbour distribution is
characterized by three Zr-Zr contributions, the most intense (Zr-ZrII) being located
at 3.65A, similar to the first Zr-Zr coordination distance in t-ZrO2 structure (table 4).
The other two: Zr-ZrI at ∼ 3.4A and Zr-ZrIII ∼ 3.8A, should be associated to the
increasing contributions from the m-ZrO2 phase (see table 4).
In the 1100 sample the Zr-O nearest neighbour distances remain unchanged, while
the coordination decreases slightly toward ∼ 7. The next neighbour distribution is
characterized by the growth of Zr-Zr contributions associated to the monoclinic struc-
ture (Zr-ZrI at 3.48A and Zr-ZrIII around 3.8A) while the Zr-ZrII coordination num-
ber, associated to the t-ZrO2 phase, decreases. All the Debye-Waller factors in 1100
sample decreases systematically, confirming the ordering of the structure around Zr
IUCr macros version 2.0β12: 2003/11/04

19
ions.
The results of the EXAFS analysis confirms that in the as quenched glass the Zr
environment is mainly an amorphous calcium silicate phase. The thermal treatment
provokes the segregation of Zr-rich phases in form of Zirconium oxides. The analysis
of EXAFS data definitively confirms, coherently with a-XRD and XANES data, that
Zr is present in at least three different phases: a Calcium Silicate and two ZrO2 phases
with monoclinic and tetragonal symmetry.
4. Conclusions
This works is intended to give a close insight about the role of Zr in the devitrification
process of a CZS glass as a function of firing temperature, looking at the particular
composition (CaO)x(ZrO2)y(SiO2)z (x ∼ 0.4, y ∼ 0.05, z ∼ 0.55). To this aim we com-
bined complementary structural information coming from XRD and XAS techniques
in order to give detailed picture of the Zr environment at short (atomic), medium and
long range (crystallographic) scales.
The structure of the as quenched glass is essentially amorphous and the Zr is em-
bedded in a calcium silicate glassy phase. The analysis of XAS data shows that the
Zr ions are 6-coordinates in roughly octahedral configuration. This atomic environ-
ment closely resembles that of Gittinsite (Roelofsen-Ahl & Peterson, 1989) and comes
in agreement with recent molecular dynamics simulations (Lancellotti et al., 2002).
The analysis of the XANES data suggests that a minor fraction of Zr could be in a
Zr-rich environment, which local structure is close to that of t-ZrO2. Combined XRD
and EXAFS results demonstrate that the devitrification process produces segregation
of Zirconium oxide phases in form of t-ZrO2 and m-ZrO2 (Baddeleyte) and allows
excluding the formation of other crystalline phases containing Zr.
The heat treatment at 1000 oC provokes the partial devitrification of the glass with
IUCr macros version 2.0β12: 2003/11/04

20
the formation of Wollastonite like phases. In the 1000 sample the effect of firing on
the Zr environment is weak, however the analysis of a-XRD difference patterns put
in evidence a t-ZrO2 phase characterized by small/highly defective crystallites. The
analysis of XAS data confirms the growth of Zr-oxide contribution and the decreasing
of the fraction of Zr in the calcium silicate glassy phase.
The segregation of ZrO2 oxide continues in the sample treated at 1050 oC. This sam-
ple displays a bimodal distribution of ZrO2 particles characterized by smaller/poorly
crystallized t-ZrO2 particles and larger/better crystallized m-ZrO2 crystallites. In 1100
sample the m-ZrO2 phase fraction growth, while decreases the contribution of Zr in
t-ZrO2 and Calcium Silicate phases. It must be noticed that while the diffraction
line width of m-ZrO2 phase decreases raising the firing temperature between 1050 oC
and to 1100 oC, the diffraction lines of m-ZrO2 phase remain broader. This finding
comes in agreement with the peculiar particle size dependence of ZrO2 phase dia-
gram that, for small particles, makes the t-ZrO2 energetically more favourable than
m-ZrO2 (Garvie, 1965; Garvie, 1978).
Our structural results are interpreted as follow: thermal treatment provokes the
segregation of Zr out from the Calcium Silicate glassy phase and the growth of Zirco-
nium oxide particles. The observed ZrO2 phase in the AQ samples (XANES) would
provides the nucleation centers for t-ZrO2 small crystallites firing the samples at 1000
◦C. Raising the firing temperature provokes the growth ZrO2 particles which stabilizes
in the monoclinic structure.
Acknowledgements The excellent technical support of F. Campolungo (INFN-Frascati),
V. Sciarra (INFN-Frascati) and V. Tullio (INFN-Frascati) and F. D’anca (INFM-OGG
Grenoble), R. Weigel (BM29-ESRF) was greatly appreciated. The GILDA project is
financed by the three Italian institutions: CNR, INFM and INFN.
IUCr macros version 2.0β12: 2003/11/04

21
References
Amoros, J. L., Escardino, A., Orts, M. J. & Moreno, A. (1994). Brit. Ceram. Trans. 93,840–844.
Ankudinov, A. L., Ravel, B., Rehr, J. J. & Conradson, S. D. (1998). Phys. Rev. B, 58, 7565.Benfatto, M., Natoli, C. R., Bianconi, A., Garcia, J., Marcelli, A., Fanfoni, M. & Davoli, I.
(1986). Phys. Rev. B, 34, 5774–5781.Bianconi, A. (1988). chap. XANES Spectroscopy in X-Ray Absorption: EXAFS, SEXAFS,
XANES., p. 573. John Wiley & Sons New York.Burger, K., Cox, D., Papoular, R., & Prandl, W. (1998). J. Appl. Cryst. 31, 789–797.Canton, P., Fagherazzi, G., Frattini, R. & Riello, P. (1999). J. Appl. Cryst. 32, 475–480.Dejus, R. J. & del Rio, M. S. (1996). Rev. Sci. Instrum. 9, 67.Escardino, A., Moreno, A., Amoros, J. L., Gozalbo, A., Aparici, J. & Sanchez, L. F. (1996).
Cer. Acta, 8, 21–34.Filipponi, A. (1995). J. Phys.: Condens. Matter, 7, 9343–9356.Filipponi, A., Borowski, M., Bowron, D. T., Ansell, S., De Panfilis, S., Di Cicco, A. & Itie,
J.-P. (2000). Rev. Sci. Instr. 71, 2422–2432.Filipponi, A. & Di Cicco, A. (1995). Phys. Rev. B, 52, 15135–15149.Filipponi, A., Di Cicco, A. & Natoli, C. R. (1995). Phys. Rev. B, 52, 15122–15134.Filipponi, A. & DiCicco, A. (2000). TASK QUARTERLY, 4, 575.Garvie, R. C. (1965). J. Phys. Chem. 69, 1238–1243.Garvie, R. C. (1978). J. Phys. Chem. 82, 218.Hammersley, A. P., Svensson, S. O. & Thomson, A. (1994). Nucl. Instrum. Methods Phys.
Res. A, 346, 312321.Hann, R. E. & Al (1985). J. Amer. Ceram. Soc. 68C, 285–286.James, F. (1994). MINUIT: Function MInimization and Error Analysis. Reference Manual -
V 94.1. Program Library D506, CERN.Kordyuk, R. A. & Gul’ko, N. V. (1962). Dokl. Chem. Tech. 142, 6–10.Lancellotti, I., Leonelli, C., Montorsi, M., Pellacani, G. C., Siligardi, C. & Meneghini, C.
(2002). Phys. Chem. Glasses, 43C, 108.Larsen, A. C. & Von Dreele, R. B. (2000). GSAS General Structure Analysis System. Los
Alamos National Laboratory, Los Alamos, New Mexico.Lee, P. A., H., P., Citrin, Eisenberger, P. & Kincaid, B. M. (1981). Rev. Mod. Phys. 53,
769–806.Lee, P. A. & Pendry, J. B. (1975). Phys. Rev. B, 11, 2795–2811.Li, P., Chen, I.-W. & Penner-Hahn, J. E. (1993). Phys. Rev. B, 48, 10063–10073.Mac Millan, P. (1964). Glass Ceramics. London. Academic Press.Materlik, G., Sparks, C. J. & Fisher, J. (1994). Resonant Anomalous X-ray scattering theory
and applications. Elsevier Science, Amsterdam.Matsumoto, K., Sawamoto, T., Koide, S. & Hokoku, A. K. (1954). Asahi Garasu Kenkyu
Hokoku, 4, 8–13.Meneghini, C., Artioli, G., Norby, P., Balerna, A., Gualtieri, A. & Mobilio, S. (2001). J. of
Synchrotron Rad. 8, 1162–1166.Meneghini, C., Gualtieri, A. & Siligardi, C. (1999). J. Appl. Cryst. 32, 1090–1099.Neilson, G. F. (1972). Advances in Nucleation and Crystallization in Glasses., vol. 5. Am.
Ceram. Soc. Spec. Publ.Pascarelli, S., Boscherini, F., D’Acapito, F., Hrdy, J., Meneghini, C. & Mobilio, S. (1996). J.
Synchrotron Rad. 3, 147–155.Roelofsen-Ahl, J. N. & Peterson, R. C. (1989). Canad. Mineral. 27, 703–708.Strnad, Z. (1986). Glass ceramic materials. Elsevier.
IUCr macros version 2.0β12: 2003/11/04

22
Vogel, W. (1994). Glass Chemistry. Berlin, Springer.Warren, B. E. (1990). X-ray diffraction. Dover Pubblications, INC., New York.Warren, B. E. & Awerbach, B. L. (1950). J. Appl. phys. 21, 595.Warren, B. E. & Awerbach, B. L. (1952). J. Appl. phys. 23, 497.Weinberg, M. C. (1993). Nucleation and crystallization in liquids and glasses. The American
Ceramic Society.Willilamson, G. K. & Hall, W. H. (1953). Acta Metall. 1, 22.Wilson, A. J. C. (1962). Proc. Phys. Soc. 80, 286.Wright, A. F. & Lehmann, M. S. (1981). J. Sol. Stat. Chem. 36, 371–380.
IUCr macros version 2.0β12: 2003/11/04

23
Table 1. Crystallographic structure of Zr-containing long range ordered phases: A=t-ZrO2,
B=m-ZrO2. Statistical uncertainties on the last digit are reported in parenthesis. The
maximum size of crystallites (D) for each phase has been estimated using the Sherrer
formula (see text). In the last column the volume fraction of the two phases is reported.
Lattice parameters for t-ZrO2 (ref. (Canton et al., 1999)) and m-ZrO2 (ref. (Hann &
Al, 1985)) are reposted for shake of comparison.
Ph. a b c β D Vol%A A A deg. nm
1000 A 3.63(1) 5.20(1) 8(1) 1001050 A 3.63(1) 5.23(2) 15(1) 59(6)
B 5.16(2) 5.26(3) 5.36(3) 98.9(2) 20(1) 41(6)1100 A 3.63(2) 5.23(2) 16(2) 19(4)
B 5.18(9) 5.24(3) 5.34(2) 99.0(2) 40(2) 81(4)
t-ZrO2 A 3.629 5.197m-ZrO2 B 5.151 5.203 5.315 99.2
IUCr macros version 2.0β12: 2003/11/04

24
Table 2. Experimental XANES data were fitted with a linear combination of theoretical
signals calculated for crystalline Zr oxide polytypes: t-ZrO2, m-ZrO2 and Gittinsite
(Si2CaZrO7). The statistical uncertainty on the last digit is reported in parenthesis.
t-ZrO2 m-ZrO2 Si2CaZrO7
% % %AQ 20(4) - 80(4)1000 27(4) - 73(4)1050 32(5) 43(6) 25(4)1100 9(2) 73(7) 18(3)
IUCr macros version 2.0β12: 2003/11/04

25
Table 3. EXAFS results. The statistical uncertainties on the last digit are reported in
parenthesis.
Pair N R (A) σ2 × 10³A2 N R (A) σ2 × 10³A2
RT 1050Zr-OI 5.5(3) 2.14(2) 5.6(6) 5.5(5) 2.16(1) 6.4(6)Zr-OII - - - 2.3(2) 2.35(2) 7.0(7)Zr-Si/Ca 0.9(2)/0.8(2) 3.43(2) 6.5(5) 2.6(2)/2.3(2) 3.40(2) 5.6(6)Zr-ZrI - - - 0.9(2) 3.42(2) 9.5(6)Zr-ZrII 1.8(2) 3.55(2) 13(2) 4.4(3) 3.65(2) 6.5(6)Zr-ZrIII - - - 2.0(4) 3.78(3) 15.3(5)
1000 1100Zr-OI 5.3(3) 2.16(1) 6.2(6) 5.0(4) 2.17(1) 6.2(6)Zr-OII 1.3(2) 2.35(2) 12(2) 2.2(2) 2.35(2) 6.0(6)Zr-Si/Ca 1.3(2)/1.0(2) 3.40(2) 6.6(5) 2.4(2)/2.0(2) 3.40(2) 3.1(2)Zr-ZrI 1.4 3.48(2) 6.5(7) 2.7(2) 3.48(3) 6.1(3)Zr-ZrII 2.0 3.64(2) 10.(1) 3.6(2) 3.65(2) 4.2(2)Zr-ZrIII - - - 3.0(4) 3.77(4) 6.3(5)
IUCr macros version 2.0β12: 2003/11/04

26
Table 4. Zr coordination distances in crystalline polytypes used for XAS data analysis.
t-ZrO2 m-ZrO2 Si2CaZrO7
ZrO 2.11×4 2.07×2,2.14 2.07×42.38×4 2.17×2 2.15×2
2.26, 2.32ZrZr 3.65×12 3.36,
3.49 × 5 3.62,3.93×2 4.0×2
ZrSi 3.4×43.55×2
ZrCa 3.4,3.55×2
IUCr macros version 2.0β12: 2003/11/04

27
1 µm
AQ
2 µm
1050
5 µm
1100
Fig. 1. SEM images of our (CaO)0.4(ZrO2)0.05(SiO2)0.55 samples. The AQ sample(top panel) depicts homogeneous glassy structure. Fired samples (1050 and 1100respectively) present poly-crystalline habit, typical of glass ceramics. In the glasstreated at 1000 oC in backscattering geometry. The white grain clearly visible in1100 sample (lower panel) must be a Zr-rich particle (backscattering image).
IUCr macros version 2.0β12: 2003/11/04

28
0
0.4
0.8
1.2
18 18.5 19 19.5 20
11001050
1000
AQ
E (keV)
α(E)
18.1 18.2
Fig. 2. Raw XAS data of the four samples investigated.
IUCr macros version 2.0β12: 2003/11/04

29
10 20 30 402θ
1000
I(a.u.)
1100
1050
1000
AQ
35 40
1100
1050
1000
10 20
1000
AQ
AQ
Fig. 3. The upper panel reports the raw XRD patterns for the samples investigatedcollected with λ = 1.045 A. In the insert are shown fine details of the diffrac-tion patterns demonstrating the high quality of the data. In particular the weakdiffraction peaks visible in the AQ sample pattern must be ascribed to quartz phaseparticles. The lower panels plot the
√Iexp − Ibck where Iexp are the experimental
data and Ibck is the background modelled with a polynomial spline. Calculateddiffraction lines pattern for quartz structure are shown, shifted for clarity. In thelower panel the
√Iexp − Ibck for 1000 sample is shown. The main features suggest
a Wollastonite-like phase.
IUCr macros version 2.0β12: 2003/11/04

30
10 20 30 402θ (deg.)
I(a.
u.)
21 24 27
Fig. 4. Anomalous diffraction on 1050oC sample: XRD patterns collected at 17000eV (dashed line) and at 17990 eV (full line) together the difference pattern. Thedifference pattern only retains features concerning to the Zr containing phases. Inthe insert the subtraction procedure is highlighted.
IUCr macros version 2.0β12: 2003/11/04

31
1100
I(ar
b.un
its)
t-m-
10 20 30 40
1000 × 2
1050
1100
I(ar
b.un
its)
2θ (deg.)
m-ZrO2
t-ZrO2
Fig. 5. Upper panel: example of Rietveld profile refinement on 1100 differencepattern: the experimental data (crosses) and fit (full line) are shown. The residualis reported shifted below for clarity. In the middle panel the markers signal thepositions of diffraction lines for tetrahedral (t-) and monoclinic (m-) structures.Lower panel: Difference curves for 1000, 1050 and 1100 samples are shown, shiftedfor clarity. On the top and bottom of the lower panel the calculated patterns form-ZrO2 t-ZrO2 polytypes are shown for sake of comparison.
IUCr macros version 2.0β12: 2003/11/04
32
18000 18020 18040 18060E(eV)
c-ZrO2
Si2CaZrO
7
m-ZrO2
t-ZrO2
ab
c
0
1
2
AQ
1000
1050
1100
ab
c
Fig. 6. The upper data represent the experimental XAS data (diamonds) in theXANES region and fit (full lines) obtained as linear combinations of simulatedsignals (see text). The lower curves are the simulated XANES for Zr polytypes.The curves are vertically shifted for clarity.
IUCr macros version 2.0β12: 2003/11/04

33
5 10 15k (Å-1)
k2 χ(k)
(Å-2
)
1100
AQ
1000
1050
2 4 6 8R(Å)
|FT
|of
k2 χ(k)
(Å-2
)
1100
AQ
1000
1050
Fig. 7. The experimental k2 weighted EXAFS data (left panel, dots) and the modulusof their Fourier Transform (right panel, dots) are shown. The k2 weighted theoreticalχ(k)’s (left panel, full lines) and their Fourier Transforms (right panel, full lines)are shown.
IUCr macros version 2.0β12: 2003/11/04

34
5 10 15
k2 χ(k)
(Å-2
)
Res.
a
e
c
5 10 15
k (Å-1)
Res.
a
b
d
e
c
5 10 15
Res.
a
b
d
fe
c
5 10 15
Res.
a
b
d
fe
c
Fig. 8. Experimental EXAFS data (dots) and best fit (gray lines). The par-tial contributions are shown shifted upward for clarity: a=ZrOI , b=ZrOII ,c=ZrSi+ZrCa,d=ZrZrI ,e=ZrZrII ,f =ZrZrIII . The residuals (best fit minus experi-mental) are reported, shifted downward for clarity. The quite large residual observedin 1050 and 1100 samples is mainly determined by high frequency structural signals(R > 4A) not considered in the fitting (see text).
IUCr macros version 2.0β12: 2003/11/04

35
a)
Zr
O
OO
O
OO
OO
Zr
ZrZr
ZrZr
ZrZr
ZrZr
ZrZr
b)
Zr
Zr
Zr
Zr
Zr
Zr
Zr
Zr
Zr
Zr
O
O
Zr
O
O
O ZrO
OZr O
c)
Zr
Zr
Zr
O
Zr
Zr
O
O
O
O
O
Zr
Zr
OO
O
O
O
O
Zr
d)
Zr Ca
Si
O
Ca
Ca
O
O
O
O
O
O
OO
Si
OO
O O
O
O
Si
SiO
Si
Si
Fig. 9. Local atomic structure around Zr in model polytypes used for XANES simu-lation: c-ZrO2 (a), t-ZrO2 (b), m-ZrO2 (c), Si2CaZrO7 (d).
Synopsis
The effect of devitrification process on the Zr-containing phases in a CaO-ZrO2-SiO2 glass-ceramic has been studied combining x-ray anomalous diffraction and x-ray absorption spec-troscopy techniques.
IUCr macros version 2.0β12: 2003/11/04