Thesis Topic An Integrated Petrophysical Study Using Well Logging Data for Evaluation of a Gas Field...
66
Thesis Topic An Integrated Petrophysical Study Using Well Logging Data for Evaluation of a Gas Field in The Gulf of Thailand Presented by Thoedpong Witthayapradit ST105514 Date 18 May 2009 Committee member : Dr. Pham Huy Giao (Chairman) : Dr. Noppadol Phien-wej : Dr. Le Hai An
-
Upload
garry-wade -
Category
Documents
-
view
263 -
download
0
Transcript of Thesis Topic An Integrated Petrophysical Study Using Well Logging Data for Evaluation of a Gas Field...

Thesis Topic
An Integrated Petrophysical Study Using Well Logging Data for Evaluation of a Gas Field in
The Gulf of Thailand
Presented by Thoedpong WitthayapraditST105514
Date 18 May 2009
Committee member : Dr. Pham Huy Giao (Chairman): Dr. Noppadol Phien-wej: Dr. Le Hai An

Outline
Introduction Objectives Scopes of work Literature review Methodology Results and Discussions Conclusions and Recommendations Q & A
Abbreviation
ANN Artificial Neural NetworkGR Gamma Ray logDT Acoustic logNPHI Neutron porosity logRHOB Bulk density logRESD Resistivity log- deep investagationRESM Resistivity log- medium investigationRESS Resisitivity log- shallow investigationIP Interactive PetrophysicsMATLAB MATrix LABoratoryMMSCF Million Standard Cubic FeetMTJDA Malaysia-Thailand Join Development Area
Introduction
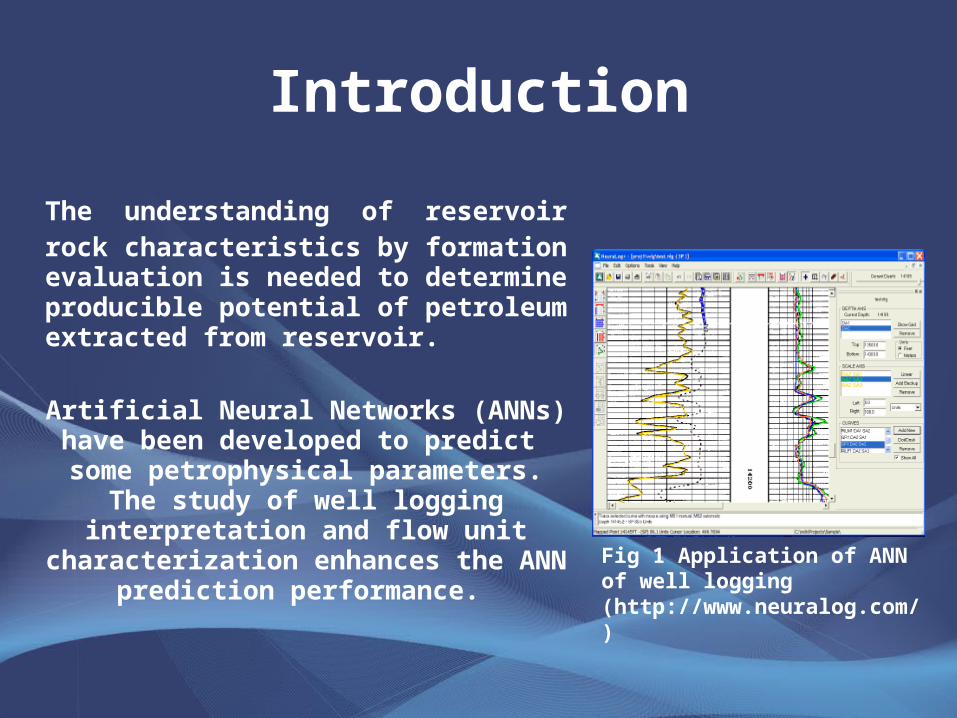
The understanding of reservoir rock characteristics by formation evaluation is needed to determine producible potential of petroleum extracted from reservoir.
Artificial Neural Networks (ANNs) have been developed to predict some
petrophysical parameters. The study of well logging interpretation and flow unit
characterization enhances the ANN prediction performance.
Fig 1 Application of ANN of well logging (http://www.neuralog.com/)
Objectives
The objectives in this study is ;
Application of the backpropagation ANN technique to predict the porosity and permeability
of gas reservoir in North Malay basin, Gulf of Thailand by using of well logging and core data
that can be used for formation evaluation in the study area.
Scopes of Work• Collection of data, i.e. well logging, core analysis and geological data
• Perform a well logging interpretation using Interactive Petrophysics software.
• Flow unit characterization from core analysis data.
• Review on the ANN methods and its application in parameter prediction based on the well logging data.
• ANN training and testing with data sets from all available data, data selected from interpreted reservoir zone and data from flow unit characterization.
• Perform a trained ANN analysis using MATLAB on data sets in integration with the core analysis data to predict porosity and permeability.
• Compare porosity and permeability from derived well logging, core analysis and ANN prediction

• Natural gas situation and statistic in 2007• Area of study• Formation evaluation
– Coring and core analysis– Well logging
• Flow unit characterization• Artificial Neural Network (ANN)
Literature ReviewThe literature review is following:
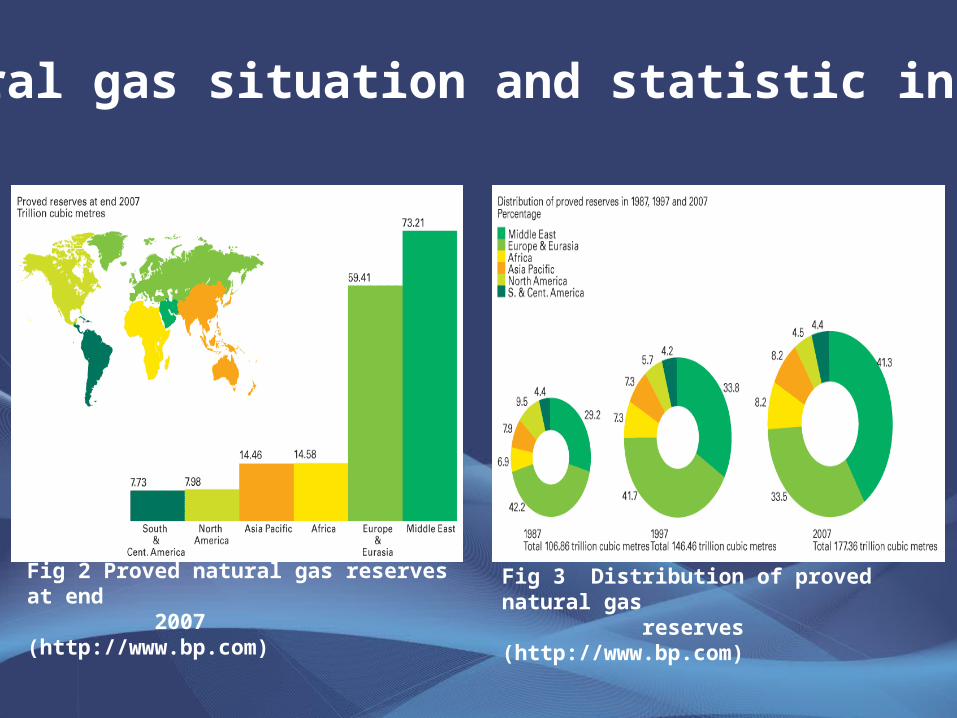
Fig 2 Proved natural gas reserves at end 2007 (http://www.bp.com)
Fig 3 Distribution of proved natural gas
reserves (http://www.bp.com)
Natural gas situation and statistic in 2007
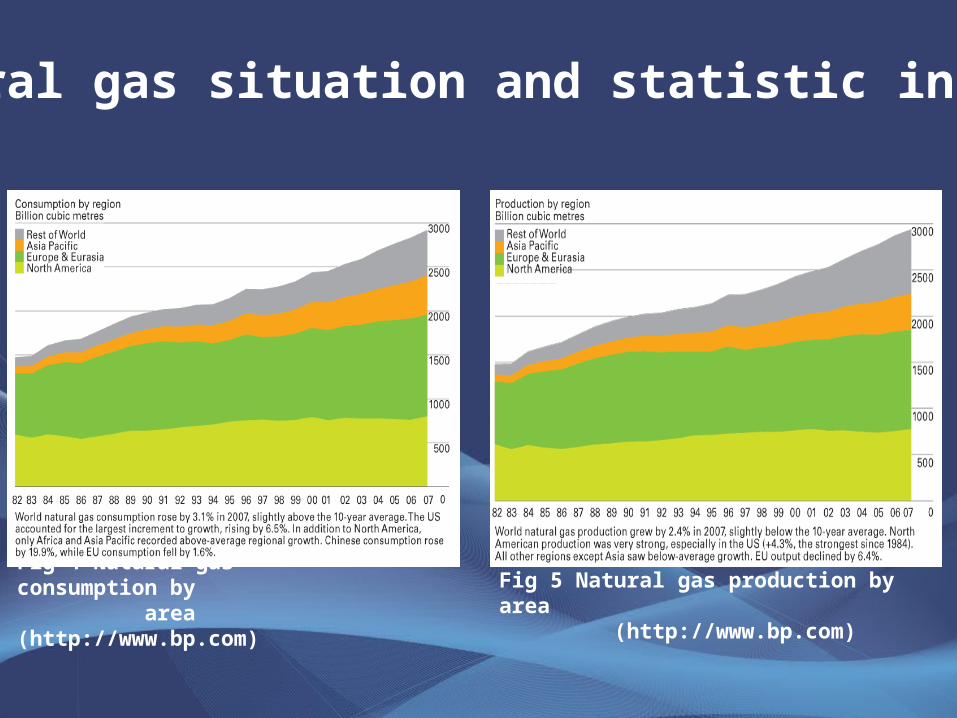
Fig 4 Natural gas consumption by
area (http://www.bp.com)
Fig 5 Natural gas production by area (http://www.bp.com)
Natural gas situation and statistic in 2007
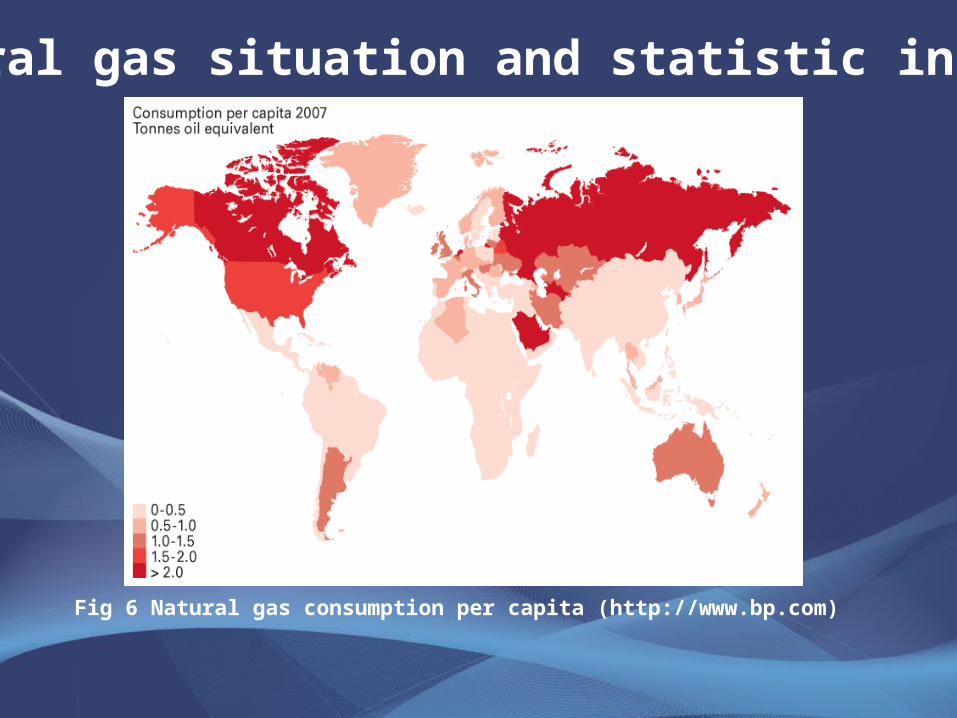
Fig 6 Natural gas consumption per capita (http://www.bp.com)
Natural gas situation and statistic in 2007
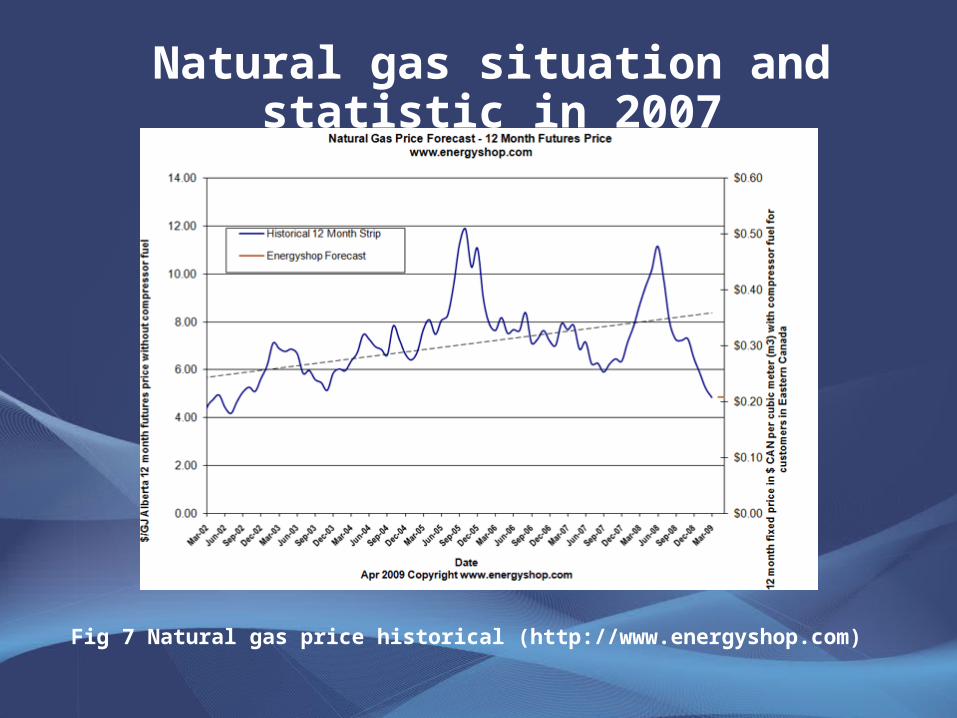
Natural gas situation and statistic in 2007
Fig 7 Natural gas price historical (http://www.energyshop.com)
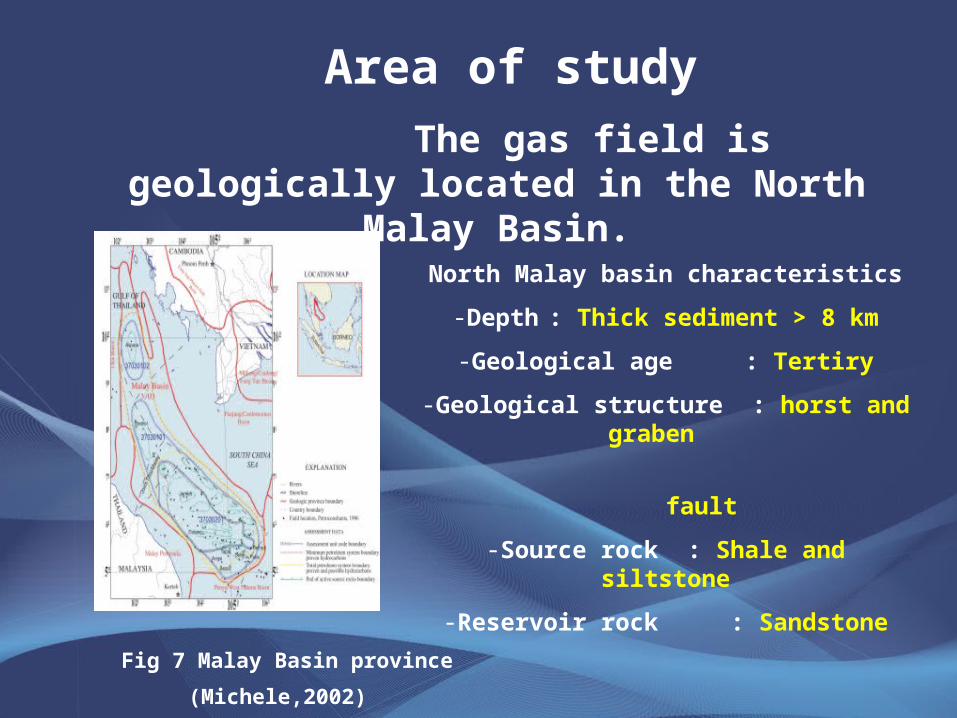
The gas field is geologically located in the North Malay Basin.
Area of study
Fig 7 Malay Basin province (Michele,2002)
North Malay basin characteristics
-Depth : Thick sediment > 8 km
-Geological age : Tertiry
-Geological structure : horst and graben
fault
-Source rock : Shale and siltstone
-Reservoir rock : Sandstone
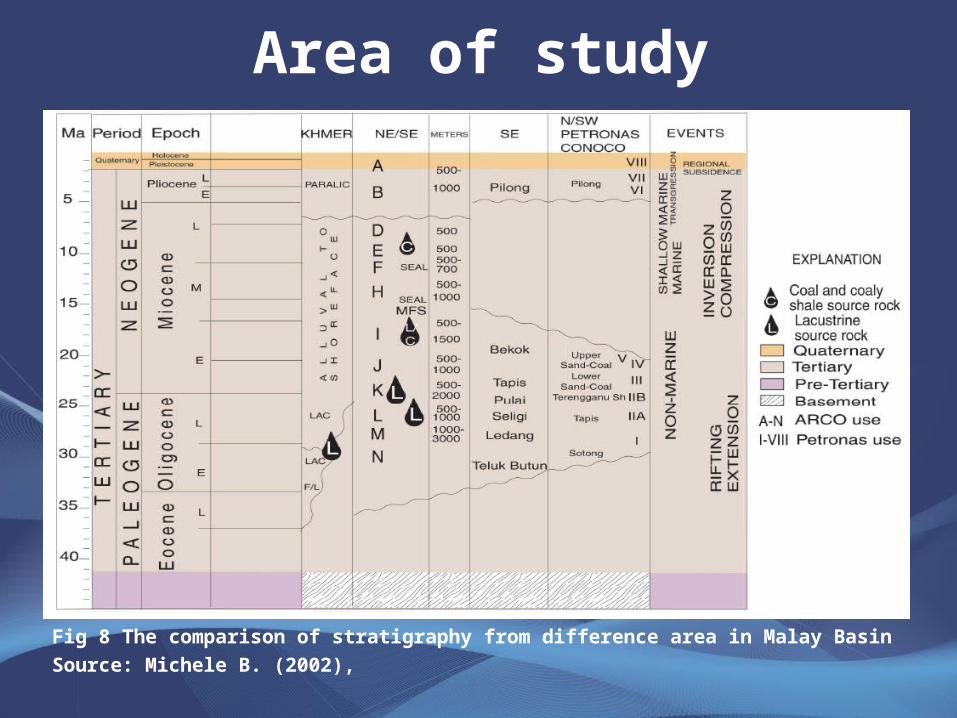
Area of study
Fig 8 The comparison of stratigraphy from difference area in Malay Basin
Source: Michele B. (2002),

Formation Evaluation
The use and interpretation of several tools and methods that are capable of locating and evaluating
the commercial significance of petroleum in the rock. (Lynch,1962)
The formation evaluation tools
• Coring and core analysis
• Drilling fluid and cuttings analysis logging
• Well Logging
Electric logging
Radioactive logging
Acoustic velocity logging
• Drill Stem Testing (DST)

Coring and Core Analysis
Fig 9 Core sample
(http://www.intertek-cb.com)
Coring is integration part of formation evaluation which direct
measurements are made.
Routine Core Analysis (RCAL) Special Core Analysis (SCAL)
•Porosity•Grain density•Absolute permeability•Water and oil saturation•Water salinity•Lithologic description•Core Gamma Log•Core Photography
•Capillary pressure•Relative permeability•Wettability•Petrography- thin sections and SEM•Damage assessment tests•Electrical properties- n, m and F•Mechanical properties•Acoustic velocity•NMR •Mineralogy- QXRD•Completion testing
Table 1 petrophysical parameters which can be determined from core measurement
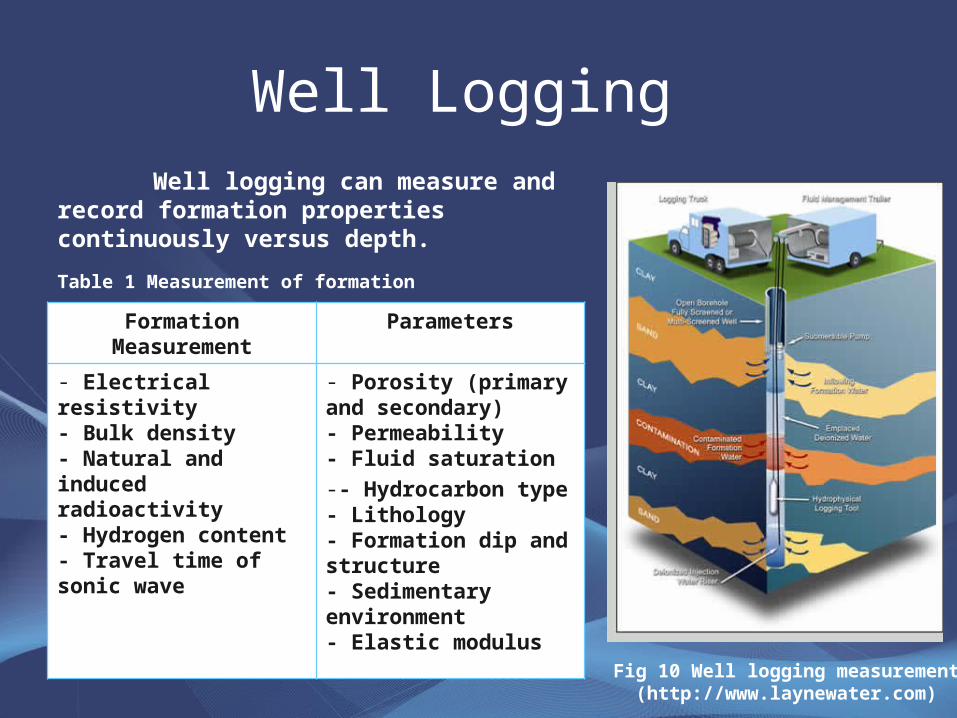
Well Logging Well logging can measure and
record formation properties continuously versus depth.
Formation Measurement Parameters
- Electrical resistivity- Bulk density- Natural and induced radioactivity- Hydrogen content- Travel time of sonic wave
- Porosity (primary and secondary)- Permeability- Fluid saturation-- Hydrocarbon type- Lithology- Formation dip and structure- Sedimentary environment- Elastic modulus
Table 1 Measurement of formation
Fig 10 Well logging measurement(http://www.laynewater.com)
Flow unit characterizationThe flow units are the resultant of the depositional
environment and diagenetic process. Many authors defined flow unit as follows(Tiab et al,2004);
- A flow unit is a specific volume of reservoir, composed of one or more reservoir quality lithologies
- A flow unit is correlative and mapable at the interval scale.- A flow unit zonation is recognizable on wire-line log.- A flow unit may be in communication with other flow units.
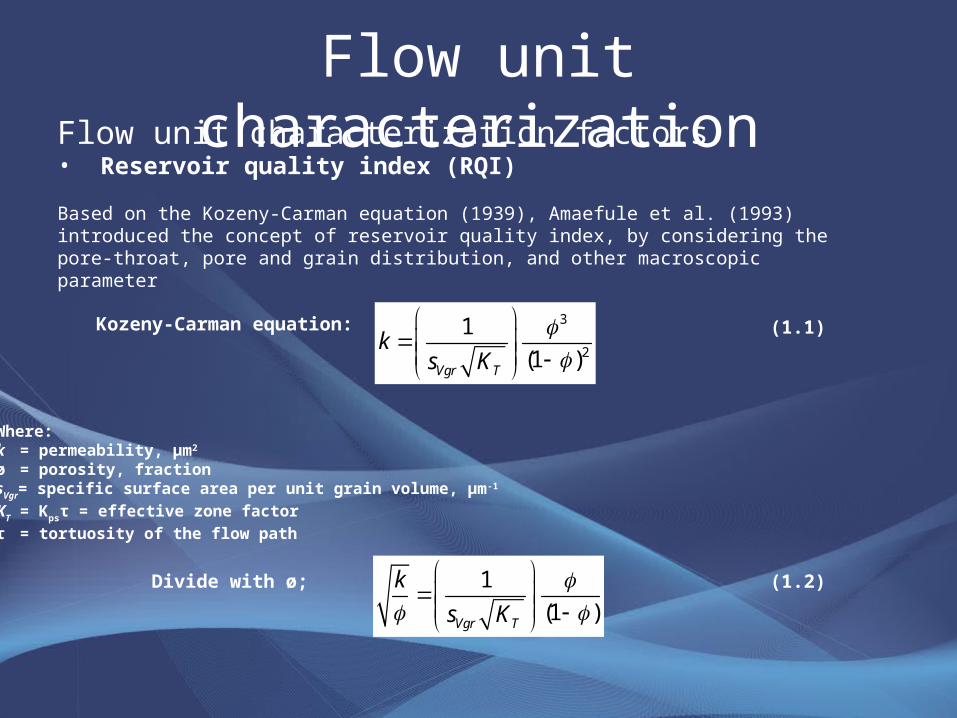
Flow unit characterization factors• Reservoir quality index (RQI)
Based on the Kozeny-Carman equation (1939), Amaefule et al. (1993) introduced the concept of reservoir quality index, by considering the pore-throat, pore and grain distribution, and other macroscopic parameter
Flow unit characterization
3
2
1
(1 )Vgr T
ks K
1
(1 )Vgr T
k
s K
Kozeny-Carman equation:
Where:k = permeability, µm2
ø = porosity, fractionsVgr= specific surface area per unit grain volume, µm-1
KT = Kpsτ = effective zone factor
τ = tortuosity of the flow path
Divide with ø;
(1.1)
(1.2)
( )zRQI FZI
1e
ze
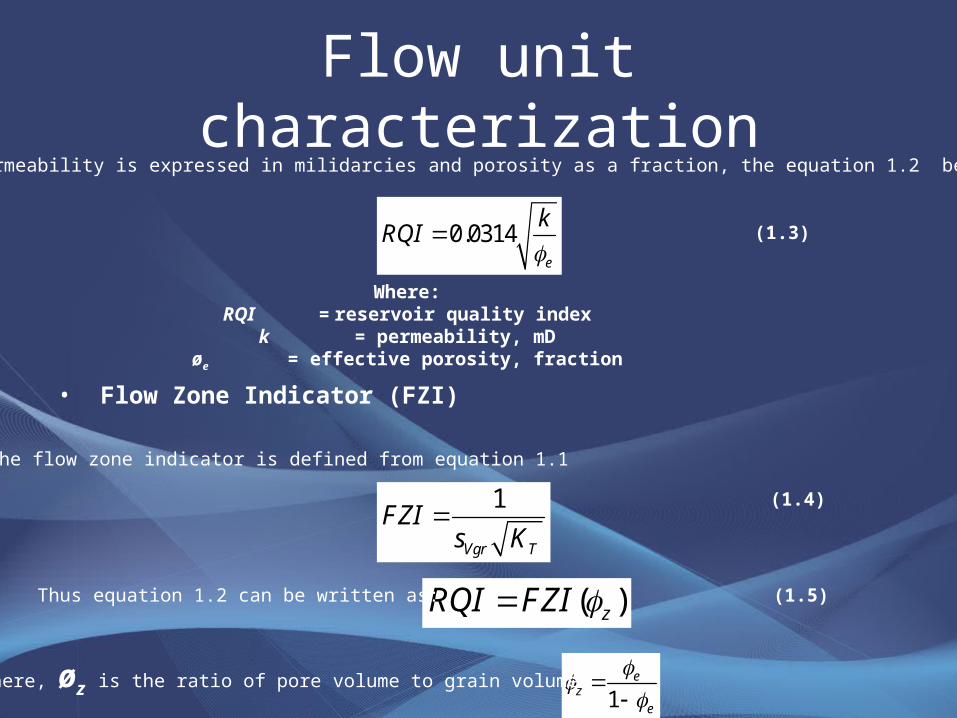
0.0314e
kRQI
Where:RQI = reservoir quality index
k = permeability, mDøe = effective porosity, fraction
• Flow Zone Indicator (FZI)
1
Vgr T
FZIs K
If the permeability is expressed in milidarcies and porosity as a fraction, the equation 1.2 becomes:
Flow unit characterization
The flow zone indicator is defined from equation 1.1
Thus equation 1.2 can be written as:
(1.3)
(1.4)
Where, øz is the ratio of pore volume to grain volume;
(1.5)

Artificial Neural Network
1
N
i ii
y f w x
;
i
i
Where
x an input signal at i
y an output signal
f activation function
w weight or connection strength at i
a bias or threshold
Fig 11 Schematic of ANN model
WN
W2 f
x1
y
xN
x2
W1
An ANN is an information processing system that roughly replicates the behaviors of a human brain by emulating the operations and connectivity of biological neurons (Tsoukalas and Uhrig, 1997).
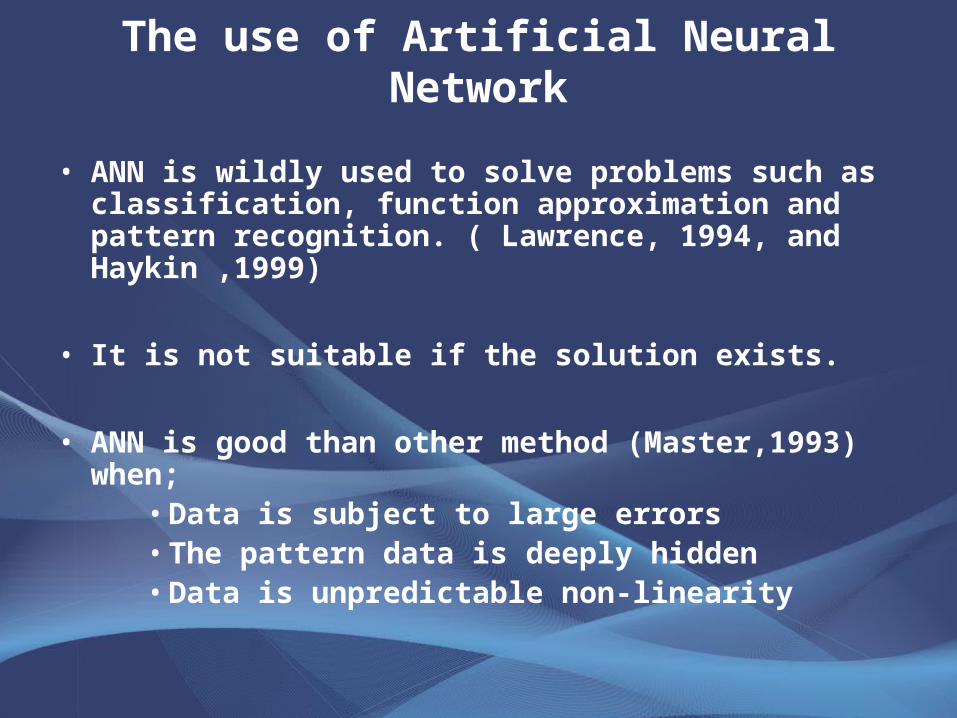
The use of Artificial Neural Network
• ANN is wildly used to solve problems such as classification, function approximation and pattern recognition. ( Lawrence, 1994, and Haykin ,1999)
• It is not suitable if the solution exists.
• ANN is good than other method (Master,1993) when;• Data is subject to large errors• The pattern data is deeply hidden• Data is unpredictable non-linearity
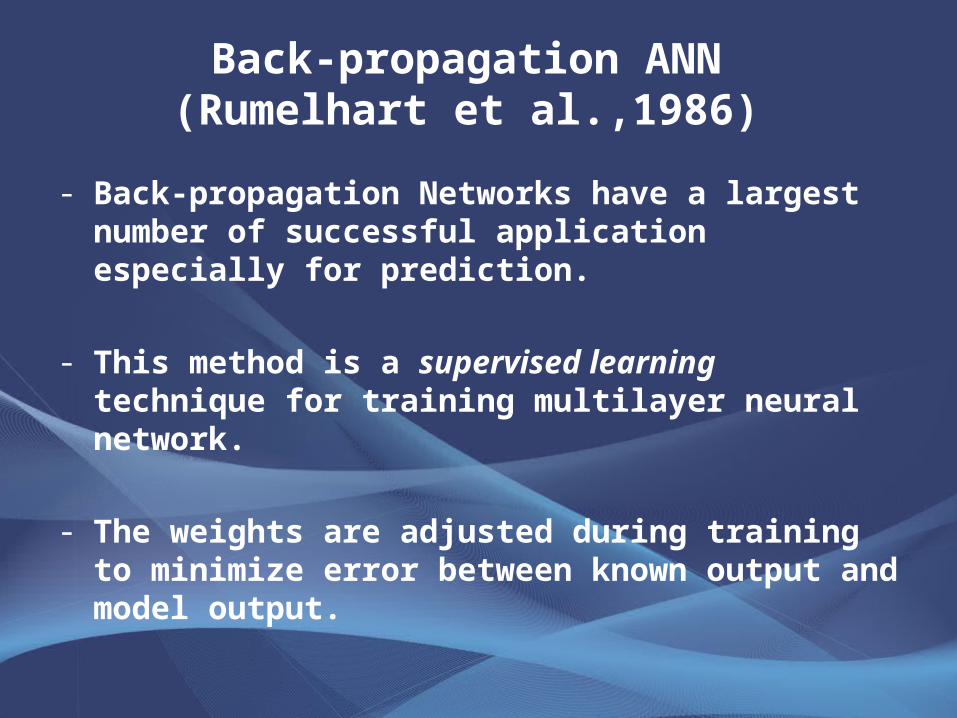
Back-propagation ANN (Rumelhart et al.,1986)
- Back-propagation Networks have a largest number of successful application especially for prediction.
- This method is a supervised learning technique for training multilayer neural network.
- The weights are adjusted during training to minimize error between known output and model output.
Application of ANN for well logging
• As the relationships of the well logging data and the reservoir properties are unknown, the neural network is proposed to predict the formation parameters (Helle et al., 2001).
• The advantage of this method are;• User does not need a deep geological knowledge of the
area.
• It is faster interpretation than conventional interpretation
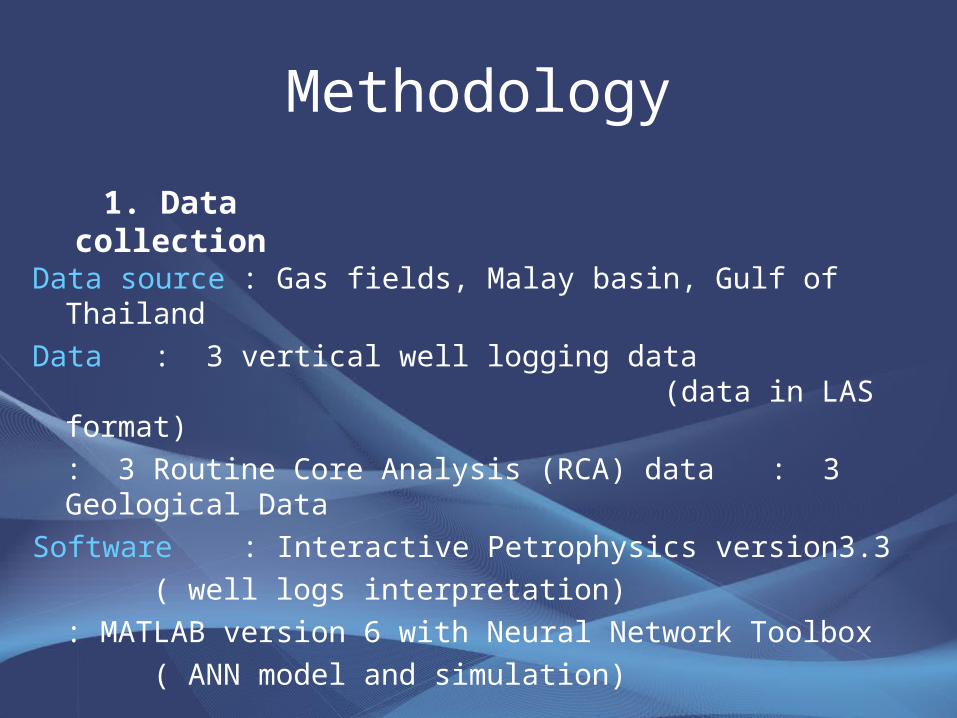
Methodology
Data source : Gas fields, Malay basin, Gulf of Thailand
Data : 3 vertical well logging data (data in LAS format)
: 3 Routine Core Analysis (RCA) data : 3 Geological Data
Software : Interactive Petrophysics version3.3
( well logs interpretation)
: MATLAB version 6 with Neural Network Toolbox
( ANN model and simulation)
1. Data collection
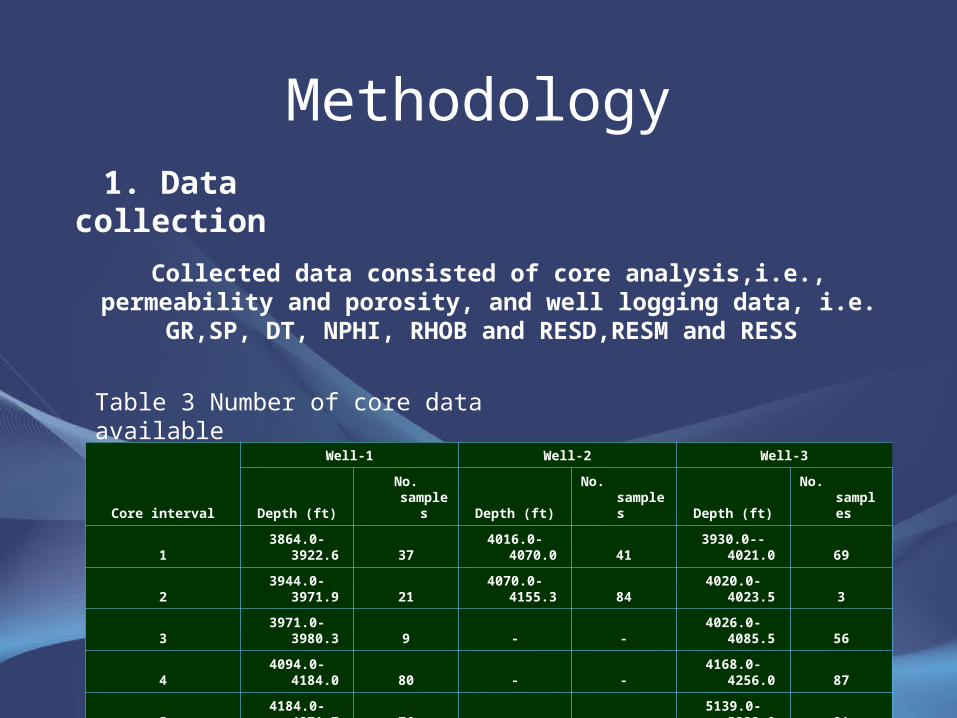
Core interval
Well-1 Well-2 Well-3
Depth (ft) No. samples Depth (ft) No. samples Depth (ft) No. samples
1 3864.0- 3922.6 37 4016.0- 4070.0 41 3930.0--4021.0 69
2 3944.0-3971.9 21 4070.0-4155.3 84 4020.0- 4023.5 3
3 3971.0-3980.3 9 - - 4026.0- 4085.5 56
4 4094.0-4184.0 80 - - 4168.0-4256.0 87
5 4184.0-4271.7 76 - - 5139.0- 5222.0 81
6 - - - - 5560.4-5648.3 88
Total 223 Total 125 Total 384
Table 3 Number of core data available
Methodology1. Data collection
Collected data consisted of core analysis,i.e., permeability and porosity, and well logging data, i.e. GR,SP, DT, NPHI, RHOB and
RESD,RESM and RESS
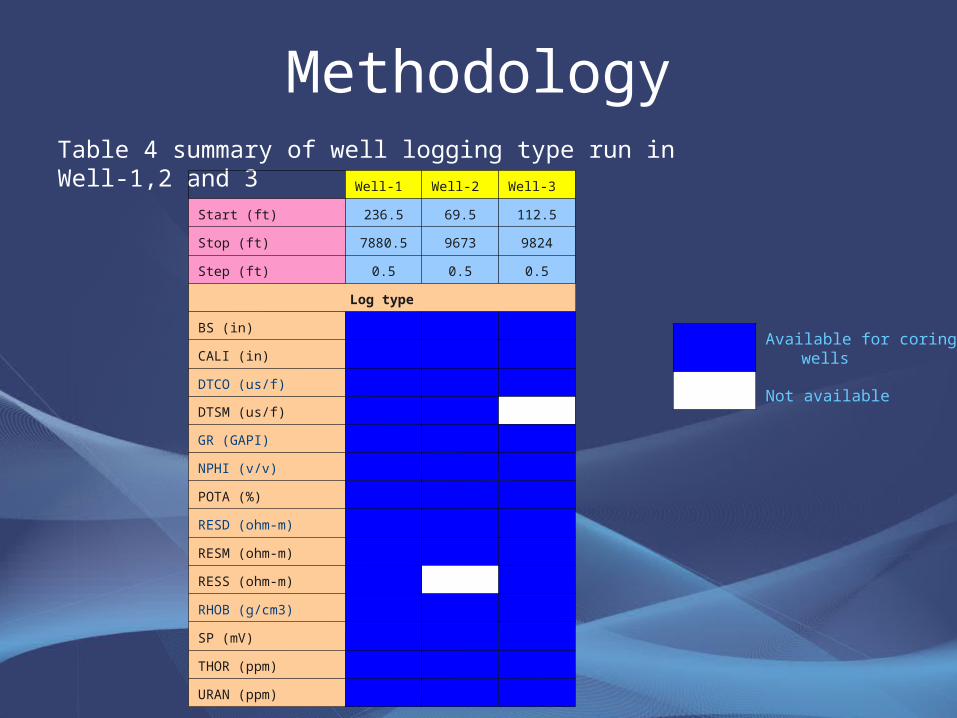
Table 4 summary of well logging type run in Well-1,2 and 3 Well-1 Well-2 Well-3
Start (ft) 236.5 69.5 112.5
Stop (ft) 7880.5 9673 9824
Step (ft) 0.5 0.5 0.5
Log type
BS (in)
CALI (in)
DTCO (us/f)
DTSM (us/f)
GR (GAPI)
NPHI (v/v)
POTA (%)
RESD (ohm-m)
RESM (ohm-m)
RESS (ohm-m)
RHOB (g/cm3)
SP (mV)
THOR (ppm)
URAN (ppm)
Available for coring wells
Not available
Methodology
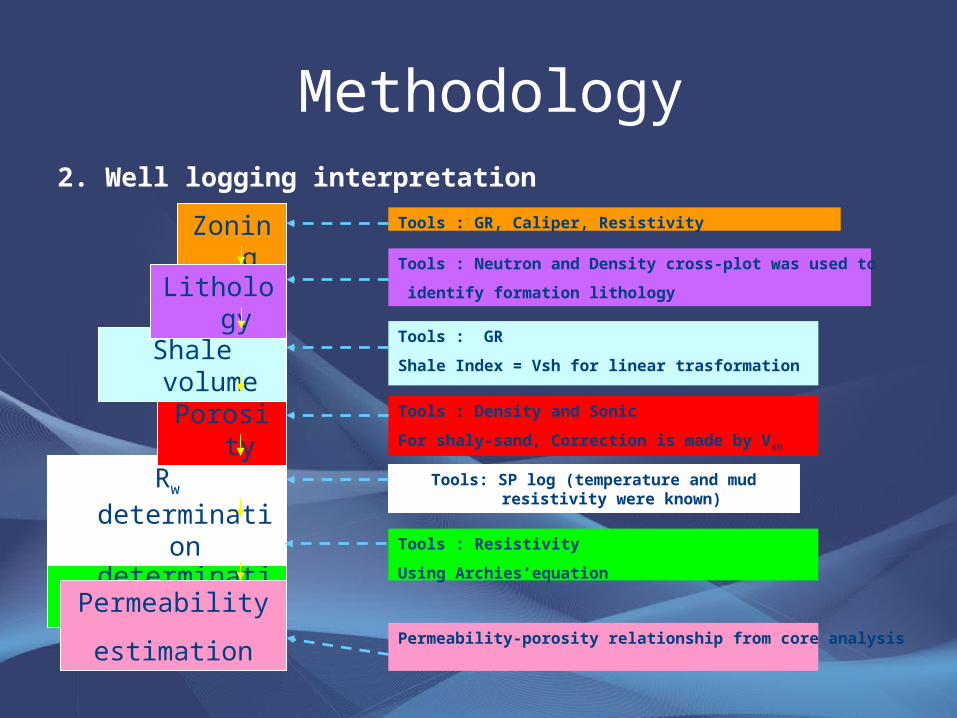
2. Well logging interpretation
Zoning
Sw determination
Rw determination
Porosity
Shale volume
Permeability
estimation
Lithology
Tools : GR, Caliper, Resistivity
Tools : Neutron and Density cross-plot was used to
identify formation lithology
Tools : GR
Shale Index = Vsh for linear trasformation
Tools : Density and Sonic
For shaly-sand, Correction is made by Vsh
Tools : Resistivity
Using Archies’equation
Tools: SP log (temperature and mud resistivity were known)
Permeability-porosity relationship from core analysis
Methodology
Flow unit characterization
The flow unit characterization is studied from core analysis of each intervals. The following steps were done as follows:
- The RQI and øz are plotted in log-log scale- The flow zone indicator, FZI, was determined from the intercept where øz =1.- FZIs from each core intervals were used to determine the flow unit of the reservoir as the plots that lie on the same straight line have similar pore throat characteristics and constitute a flow unit. - Flow unit identification and construction well correlation.
In addition, the permeability-porosity relationships from core analysis can be plotted in semi-log scale. The slopes of the plot of each core interval are also used as supporting criteria for flow unit characterization. The permeability-porosity relationships of all core intervals each well were also used for well logging interpretation to determine the permeability from derived porosity.
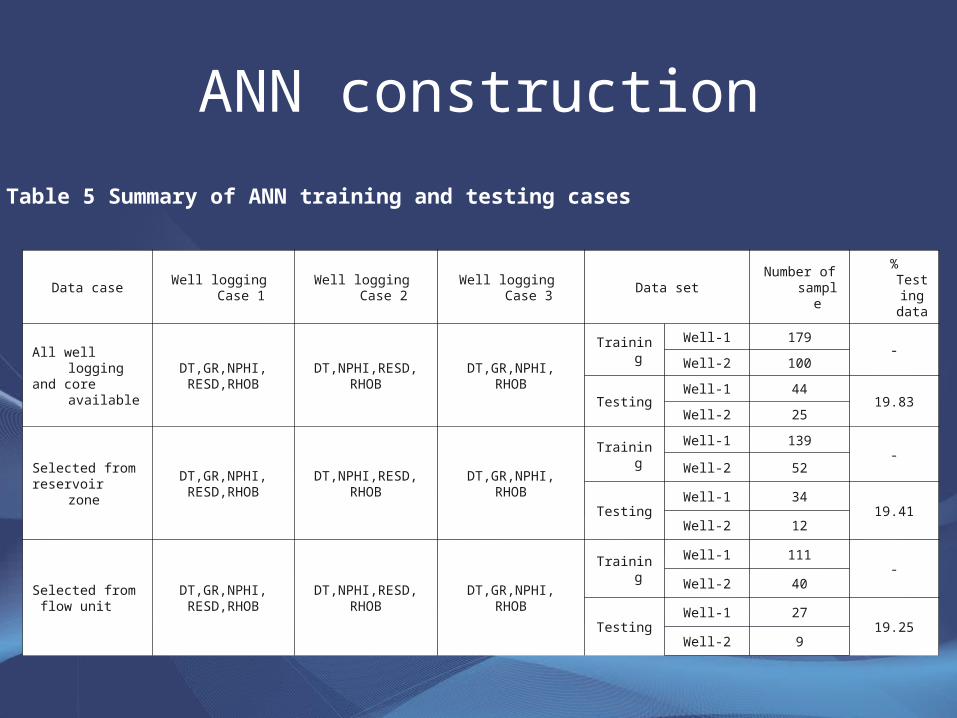
ANN construction
Data case Well logging Case 1 Well logging Case 2 Well logging Case 3 Data setNumber of
sample% Testing
data
All well loggingand core available
DT,GR,NPHI,RESD,RHOB
DT,NPHI,RESD,RHOB
DT,GR,NPHI,RHOB
Training Well-1 179
-Well-2 100
TestingWell-1 44
19.83Well-2 25
Selected fromreservoir zone
DT,GR,NPHI,RESD,RHOB
DT,NPHI,RESD,RHOB
DT,GR,NPHI,RHOB
Training Well-1 139
-Well-2 52
TestingWell-1 34
19.41Well-2 12
Selected from flow unit
DT,GR,NPHI,RESD,RHOB
DT,NPHI,RESD,RHOB
DT,GR,NPHI,RHOB
Training Well-1 111
-Well-2 40
TestingWell-1 27
19.25Well-2 9
Table 5 Summary of ANN training and testing cases
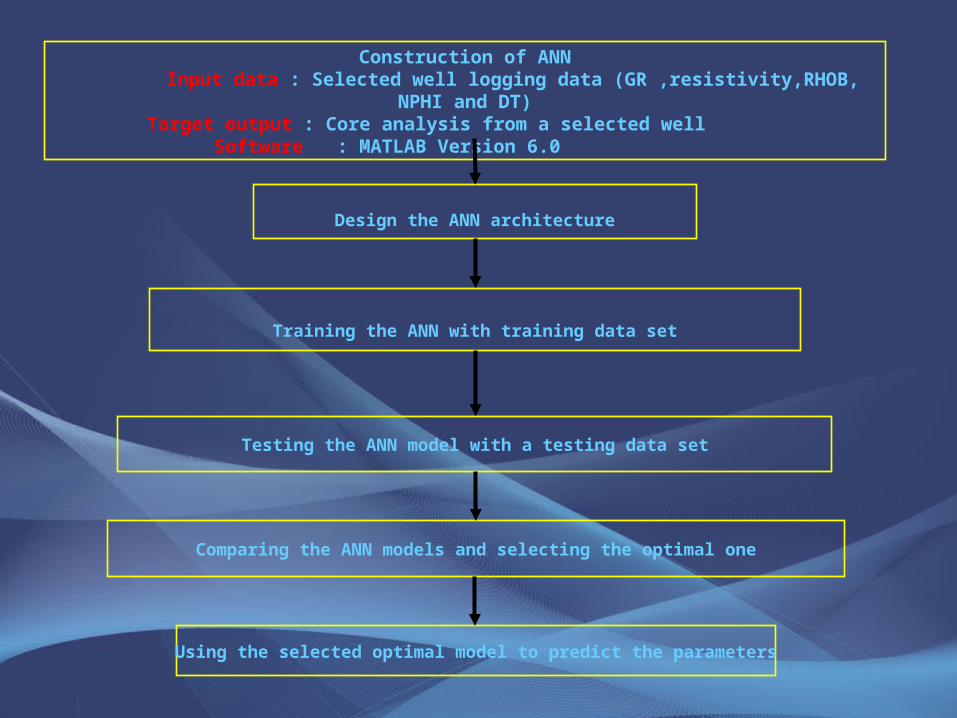
Construction of ANNInput data : Selected well logging data (GR ,resistivity,RHOB, NPHI and DT)
Target output : Core analysis from a selected well Software : MATLAB Version 6.0
Design the ANN architecture
Training the ANN with training data set
Comparing the ANN models and selecting the optimal one
Testing the ANN model with a testing data set
Using the selected optimal model to predict the parameters
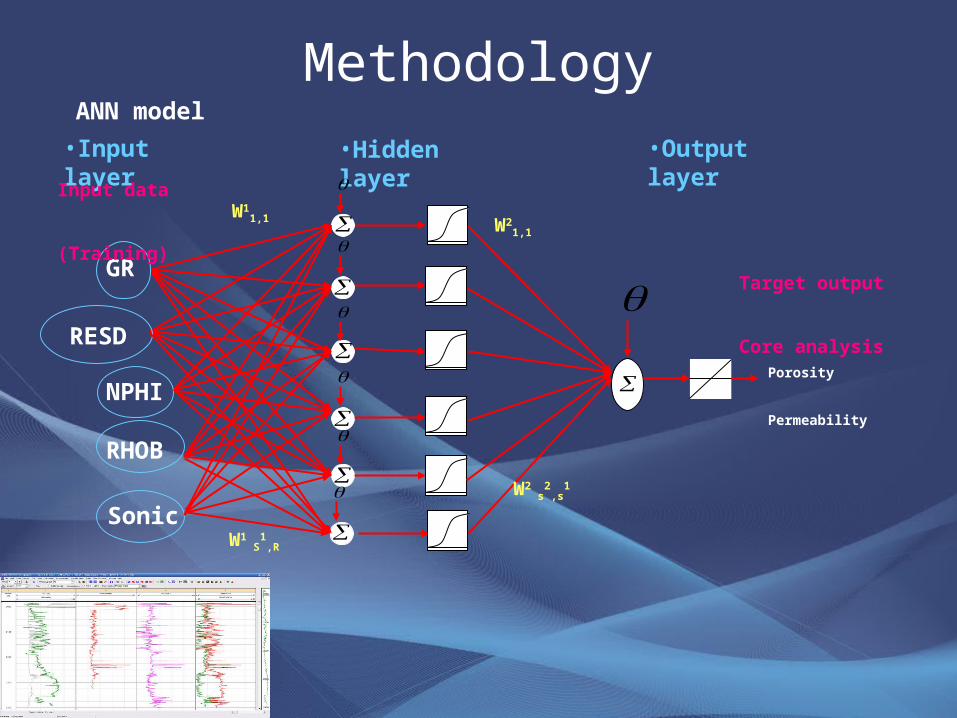
MethodologyANN model
Porosity
Permeability
RHOB
NPHI
•Input layer
GR
RESD
•Hidden layer
•Output layer
Sonic
W11,1
W1 S
1,R
W21,1
W2 s
2,s
1
Target output
Core analysis
Input data
(Training)
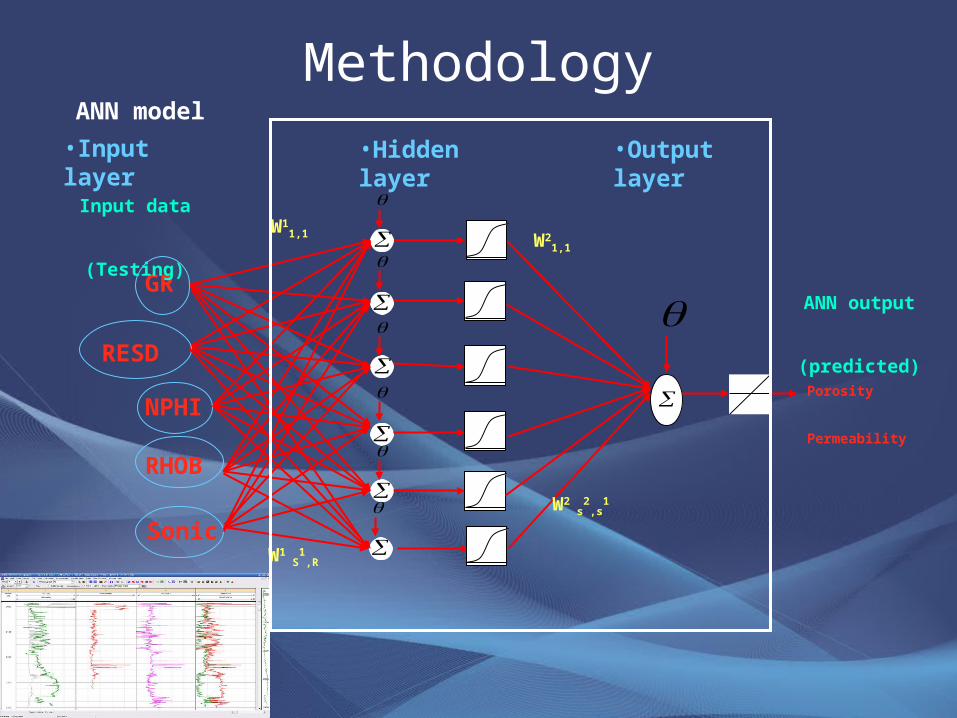
MethodologyANN model
Porosity
Permeability
RHOB
NPHI
•Input layer
GR
•Hidden layer
•Output layer
Sonic
W11,1
W1 S
1,R
W21,1
W2 s
2,s
1
ANN output
(predicted)
Input data
(Testing)
RESD
1. Well logging interpretation- Interpretation result of Well-1, 2 and 3
- Summary table of reservoir zones.
Results and Discussions
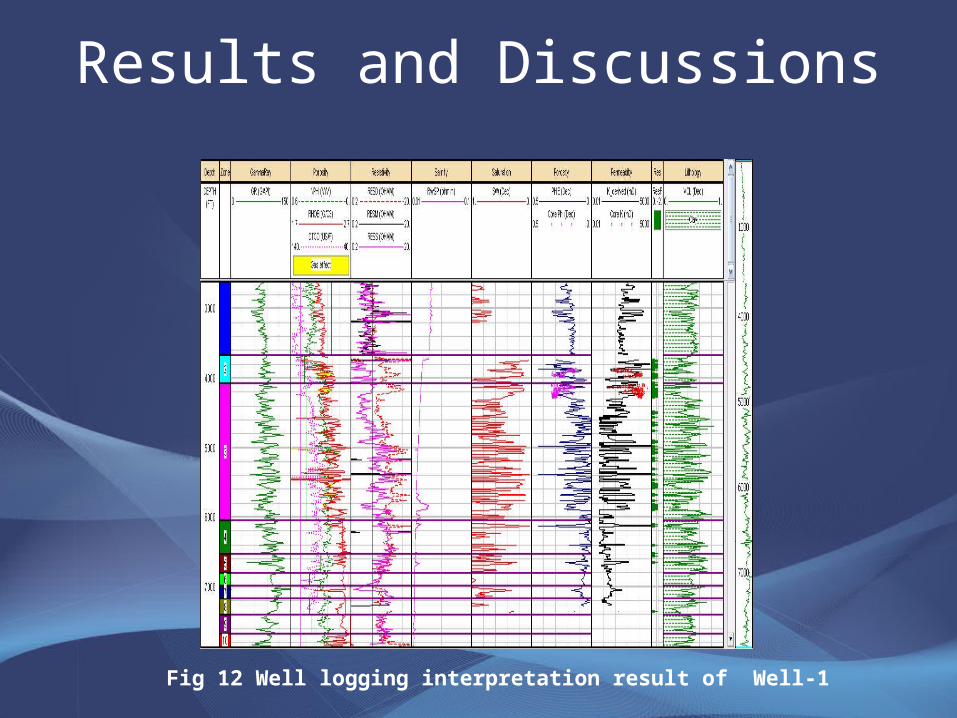
Results and Discussions
Fig 12 Well logging interpretation result of Well-1
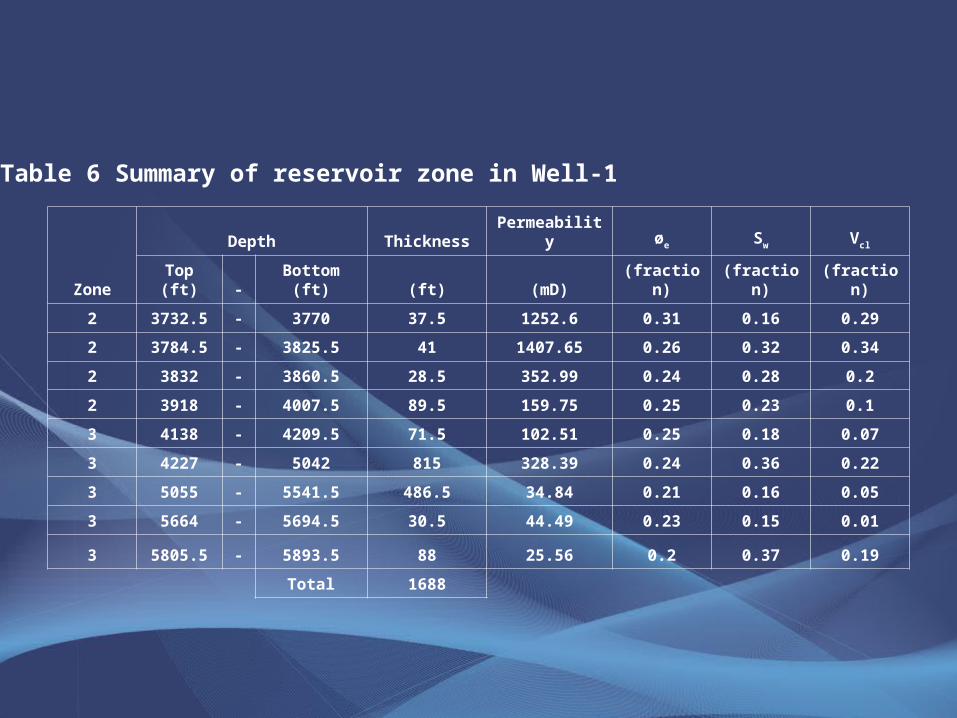
Zone
Depth Thickness Permeability øe Sw Vcl
Top (ft) - Bottom (ft) (ft) (mD) (fraction) (fraction) (fraction)
2 3732.5 - 3770 37.5 1252.6 0.31 0.16 0.29
2 3784.5 - 3825.5 41 1407.65 0.26 0.32 0.34
2 3832 - 3860.5 28.5 352.99 0.24 0.28 0.2
2 3918 - 4007.5 89.5 159.75 0.25 0.23 0.1
3 4138 - 4209.5 71.5 102.51 0.25 0.18 0.07
3 4227 - 5042 815 328.39 0.24 0.36 0.22
3 5055 - 5541.5 486.5 34.84 0.21 0.16 0.05
3 5664 - 5694.5 30.5 44.49 0.23 0.15 0.01
3 5805.5 - 5893.5 88 25.56 0.2 0.37 0.19
Total 1688
Table 6 Summary of reservoir zone in Well-1
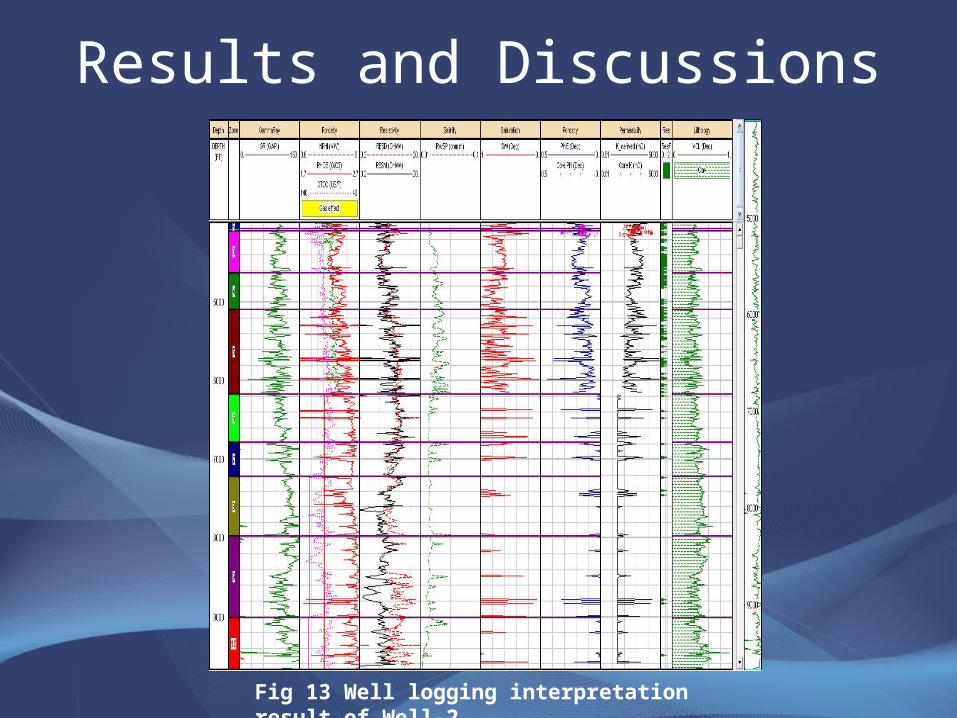
Results and Discussions
Fig 13 Well logging interpretation result of Well-2
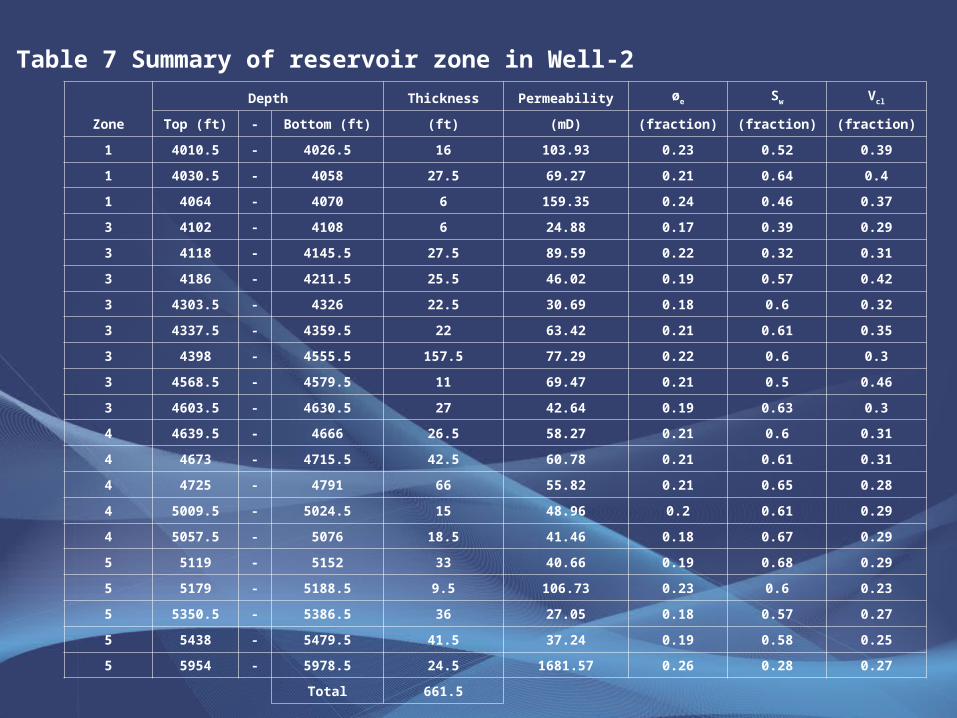
Zone
Depth Thickness Permeability øe Sw Vcl
Top (ft) - Bottom (ft) (ft) (mD) (fraction) (fraction) (fraction)
1 4010.5 - 4026.5 16 103.93 0.23 0.52 0.39
1 4030.5 - 4058 27.5 69.27 0.21 0.64 0.4
1 4064 - 4070 6 159.35 0.24 0.46 0.37
3 4102 - 4108 6 24.88 0.17 0.39 0.29
3 4118 - 4145.5 27.5 89.59 0.22 0.32 0.31
3 4186 - 4211.5 25.5 46.02 0.19 0.57 0.42
3 4303.5 - 4326 22.5 30.69 0.18 0.6 0.32
3 4337.5 - 4359.5 22 63.42 0.21 0.61 0.35
3 4398 - 4555.5 157.5 77.29 0.22 0.6 0.3
3 4568.5 - 4579.5 11 69.47 0.21 0.5 0.46
3 4603.5 - 4630.5 27 42.64 0.19 0.63 0.3
4 4639.5 - 4666 26.5 58.27 0.21 0.6 0.31
4 4673 - 4715.5 42.5 60.78 0.21 0.61 0.31
4 4725 - 4791 66 55.82 0.21 0.65 0.28
4 5009.5 - 5024.5 15 48.96 0.2 0.61 0.29
4 5057.5 - 5076 18.5 41.46 0.18 0.67 0.29
5 5119 - 5152 33 40.66 0.19 0.68 0.29
5 5179 - 5188.5 9.5 106.73 0.23 0.6 0.23
5 5350.5 - 5386.5 36 27.05 0.18 0.57 0.27
5 5438 - 5479.5 41.5 37.24 0.19 0.58 0.25
5 5954 - 5978.5 24.5 1681.57 0.26 0.28 0.27
Total 661.5
Table 7 Summary of reservoir zone in Well-2
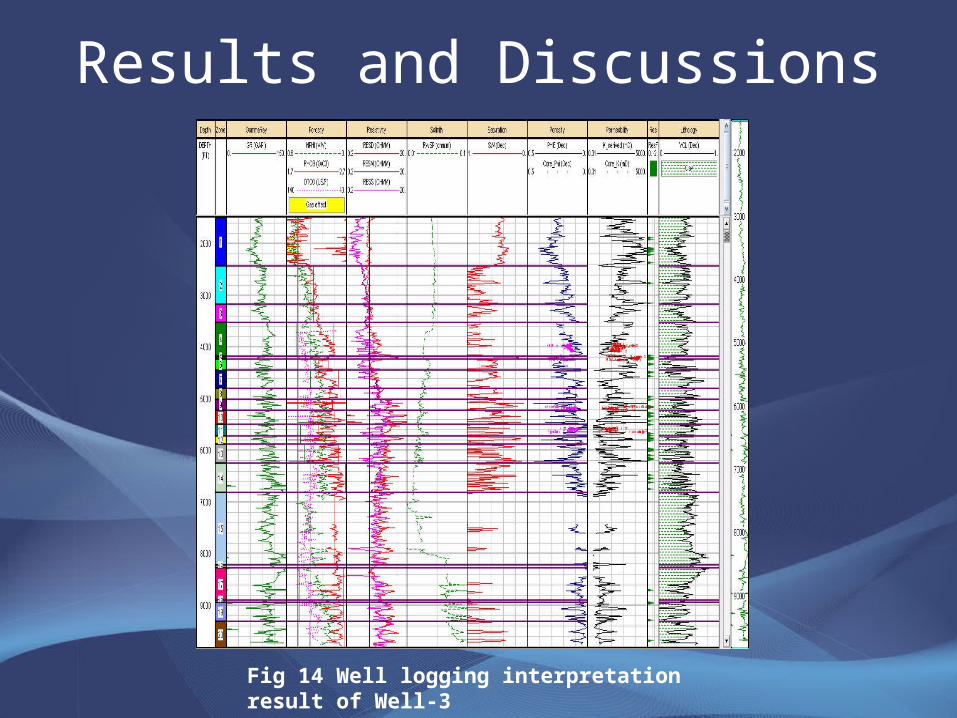
Results and Discussions
Fig 14 Well logging interpretation result of Well-3
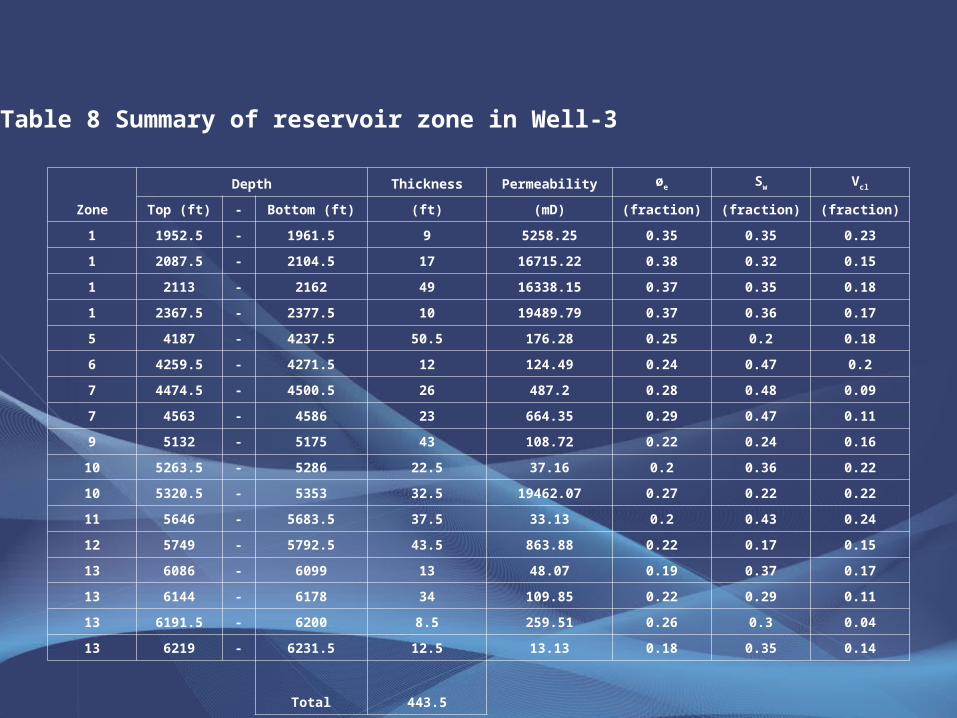
Zone
Depth Thickness Permeability øe Sw Vcl
Top (ft) - Bottom (ft) (ft) (mD) (fraction) (fraction) (fraction)
1 1952.5 - 1961.5 9 5258.25 0.35 0.35 0.23
1 2087.5 - 2104.5 17 16715.22 0.38 0.32 0.15
1 2113 - 2162 49 16338.15 0.37 0.35 0.18
1 2367.5 - 2377.5 10 19489.79 0.37 0.36 0.17
5 4187 - 4237.5 50.5 176.28 0.25 0.2 0.18
6 4259.5 - 4271.5 12 124.49 0.24 0.47 0.2
7 4474.5 - 4500.5 26 487.2 0.28 0.48 0.09
7 4563 - 4586 23 664.35 0.29 0.47 0.11
9 5132 - 5175 43 108.72 0.22 0.24 0.16
10 5263.5 - 5286 22.5 37.16 0.2 0.36 0.22
10 5320.5 - 5353 32.5 19462.07 0.27 0.22 0.22
11 5646 - 5683.5 37.5 33.13 0.2 0.43 0.24
12 5749 - 5792.5 43.5 863.88 0.22 0.17 0.15
13 6086 - 6099 13 48.07 0.19 0.37 0.17
13 6144 - 6178 34 109.85 0.22 0.29 0.11
13 6191.5 - 6200 8.5 259.51 0.26 0.3 0.04
13 6219 - 6231.5 12.5 13.13 0.18 0.35 0.14
Total 443.5
Table 8 Summary of reservoir zone in Well-3
Results and Discussions2. Flow unit characterization
- Permeability and porosity relationship
- FZI determination
- Flow unit characterization
- Well correlation

0 10 20 30 40øe, %
0.1
1
10
100
1000
10000
Per
mea
bilit
y, m
D
C ore in te rva l 1D epth 3864.3-3922.5 ft
C ore in te rva l 2D epth 3945.1-3970.0 ft
C ore in te rva l 3D epth 3971.5-3979.5 ft
C ore in te rva l 4D epth 4094.3-4183.6 ft
C ore in te rva l 5D epth 4184.2-4271.6 ft
Results and Discussions
Fig 15 Porosity-permeability relationship of
all core interval in Well-1
- Permeability and porosity relationship
2. Flow unit characterization (continued)

Results and Discussions
0 10 20 30 40øe, %
0.1
1
10
100
1000
10000
Per
mea
bilit
y, m
D
C ore in terval 1D epth 3864.3-3922.5 ft
Log(K)=0.650*Phi - 5 .717
0 10 20 30 40øe, %
0.1
1
10
100
1000
10000
Per
mea
bilit
y, m
D
C ore in terval 3D epth 3971.5-3979.5 ft
Log(K )=0.3669*Phi-0 .065
Fig 16 Porosity-permeability relationship of core interval No.1 in Well-1
Fig 17 Porosity-permeability relationship
of core interval No.3 in Well-1
2. Flow unit characterization (continued)
- Permeability and porosity relationship

Results and Discussions
0.1 1øz, fraction
0.01
0.1
1
10
RQ
I, m
C ore in terva l 1D epth 3864.3-3922.5ft
C ore in terva l 2D epth 3945.1-3970.0ft
C ore in terva l 3D epth 3971.5-3979.5ft
C ore in terva l 4D epth 4094.3-4183.6ft
C ore in terva l 5D epth 4184.2-4271.6ft
Fig 18 Flow unit characterization of all core interval in Well-1
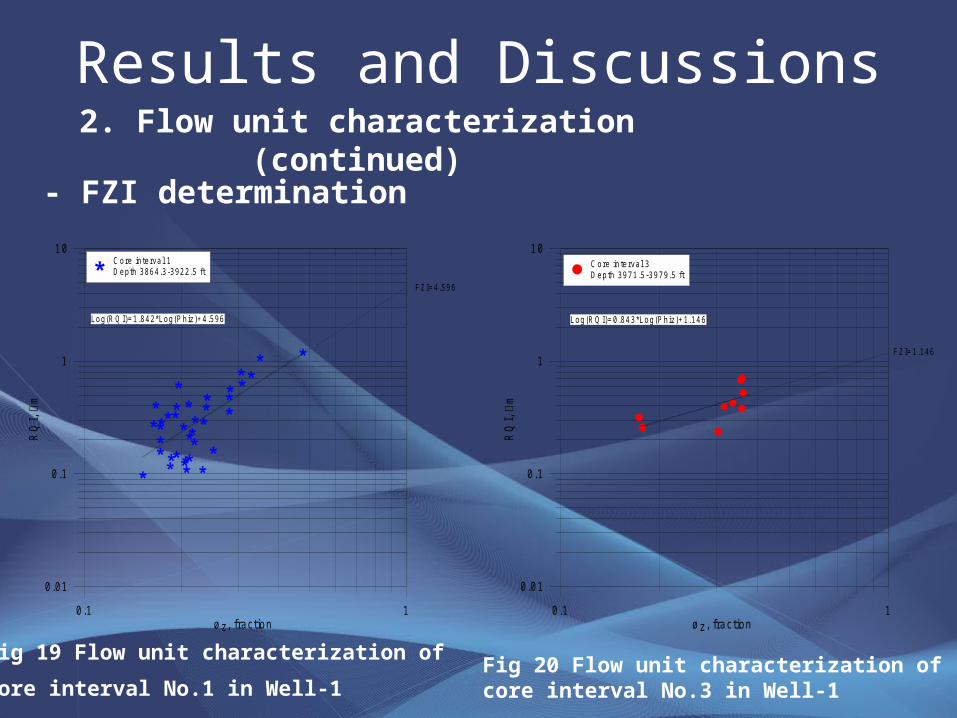
2. Flow unit characterization (continued)
- FZI determination
Results and Discussions
0.1 1øz, fraction
0.01
0.1
1
10
RQ
I, m
C ore in te rva l 1D epth 3864.3-3922.5 ft
FZ I=4.596
Log(R Q I)=1 .842*Log(P h iz)+4.596
0.1 1øz, fraction
0.01
0.1
1
10
RQ
I, m
C ore in terva l 3D epth 3971.5-3979.5 ft
FZ I=1.146
Log(R Q I)=0.843*Log(Phiz)+1.146
Fig 19 Flow unit characterization of
core interval No.1 in Well-1 Fig 20 Flow unit characterization of core interval No.3 in Well-1
2. Flow unit characterization (continued)
- FZI determination
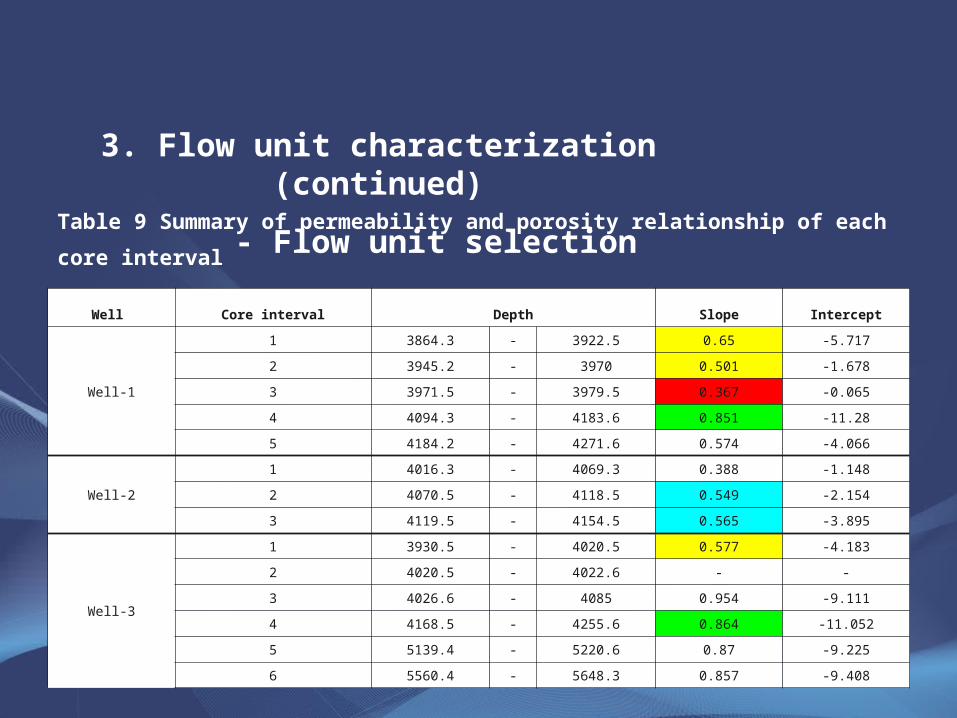
Well Core interval Depth Slope Intercept
Well-1
1 3864.3 - 3922.5 0.65 -5.717
2 3945.2 - 3970 0.501 -1.678
3 3971.5 - 3979.5 0.367 -0.065
4 4094.3 - 4183.6 0.851 -11.28
5 4184.2 - 4271.6 0.574 -4.066
Well-2
1 4016.3 - 4069.3 0.388 -1.148
2 4070.5 - 4118.5 0.549 -2.154
3 4119.5 - 4154.5 0.565 -3.895
Well-3
1 3930.5 - 4020.5 0.577 -4.183
2 4020.5 - 4022.6 - -
3 4026.6 - 4085 0.954 -9.111
4 4168.5 - 4255.6 0.864 -11.052
5 5139.4 - 5220.6 0.87 -9.225
6 5560.4 - 5648.3 0.857 -9.408
Table 9 Summary of permeability and porosity relationship of each core interval
3. Flow unit characterization (continued)
- Flow unit selection
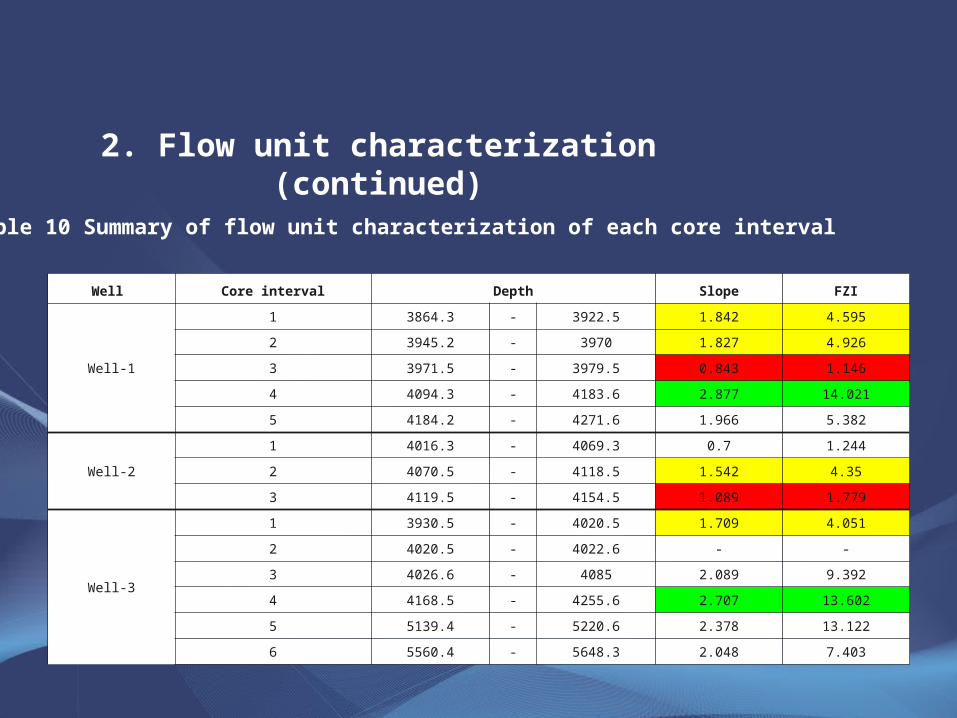
Well Core interval Depth Slope FZI
Well-1
1 3864.3 - 3922.5 1.842 4.595
2 3945.2 - 3970 1.827 4.926
3 3971.5 - 3979.5 0.843 1.146
4 4094.3 - 4183.6 2.877 14.021
5 4184.2 - 4271.6 1.966 5.382
Well-2
1 4016.3 - 4069.3 0.7 1.244
2 4070.5 - 4118.5 1.542 4.35
3 4119.5 - 4154.5 1.089 1.779
Well-3
1 3930.5 - 4020.5 1.709 4.051
2 4020.5 - 4022.6 - -
3 4026.6 - 4085 2.089 9.392
4 4168.5 - 4255.6 2.707 13.602
5 5139.4 - 5220.6 2.378 13.122
6 5560.4 - 5648.3 2.048 7.403
Table 10 Summary of flow unit characterization of each core interval
2. Flow unit characterization (continued)
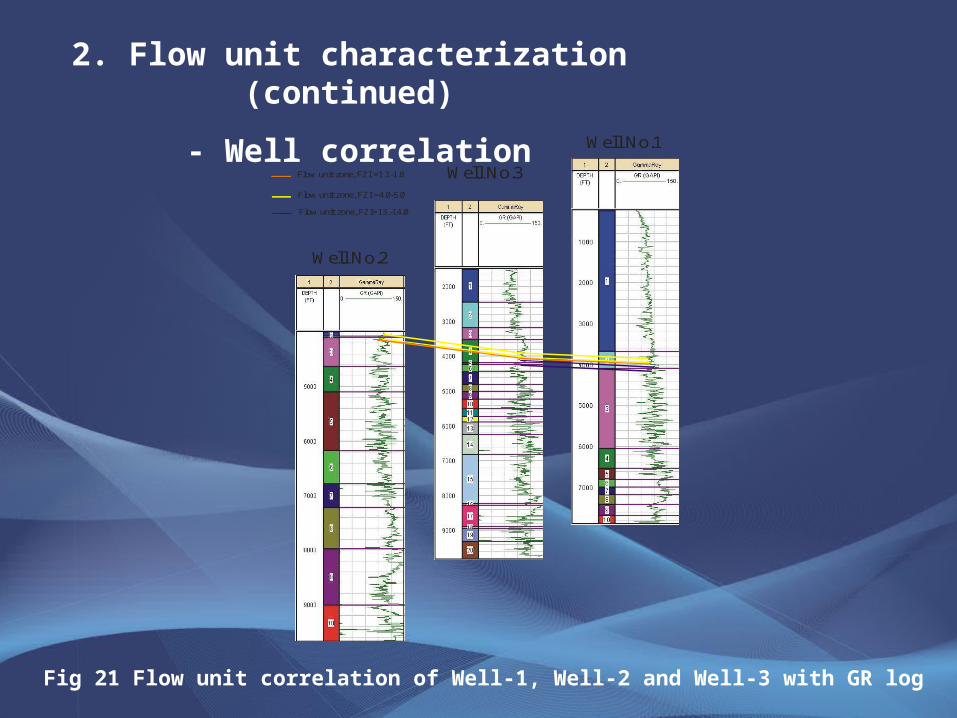
Flow unit zone, FZI=13.-14.0
Flow unit zone, FZI =4.0-5.0
Well No.1
Well No.3
Well No.2
Flow unit zone, FZI =1.1-1.8
Fig 21 Flow unit correlation of Well-1, Well-2 and Well-3 with GR log
2. Flow unit characterization (continued)
- Well correlation
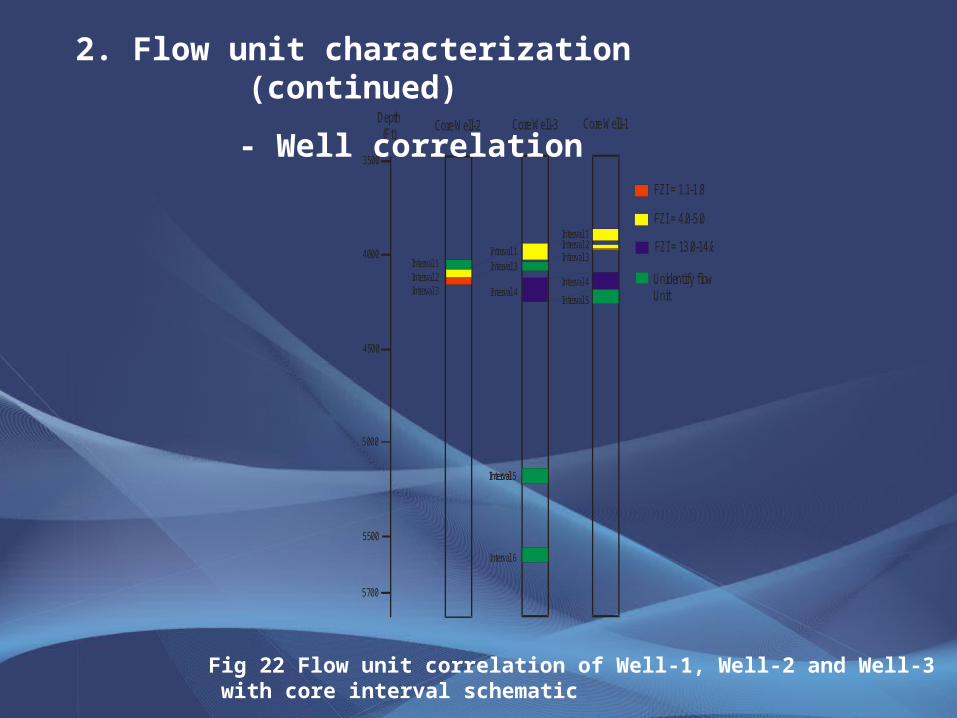
Depth (Ft)
3500
4000
4500
5000
5500
5700
Core Well-1Core Well-2 Core Well-3
Interval 1Interval 2Interval 3
Interval 1Interval 3
Interval 4
Interval 5
Interval 6
Interval 1Interval 2Interval 3
Interval
Interval 4
Interval 5
FZI = 4.0-5.0
FZI = 1.1-1.8
FZI = 13.0-14.0
Unidentify flowUnit
Fig 22 Flow unit correlation of Well-1, Well-2 and Well-3 with core interval schematic
2. Flow unit characterization (continued)
- Well correlation
Results and Discussions
- ANN porosity model
- Performance error
- Selected porosity models
- Regression analysis
- Test performance error
- Well-3 porosity prediction
3. ANN prediction model
0 2 4 6 8 10 12 14 16 18 20 22 24 26 28 30 32 34 36 38 40 42 44 46 48 50 52M odel No.
0
20
40
60
Tes
ting
per
form
ance
err
orTra in w ith a ll data availab leCase 1 (D T,G R ,N PHI,RESD and R HO B)
Case 2 (D T,NPH I,R ESD and RH O B)Case 3 (D T,G R ,N PHI and RH O B)
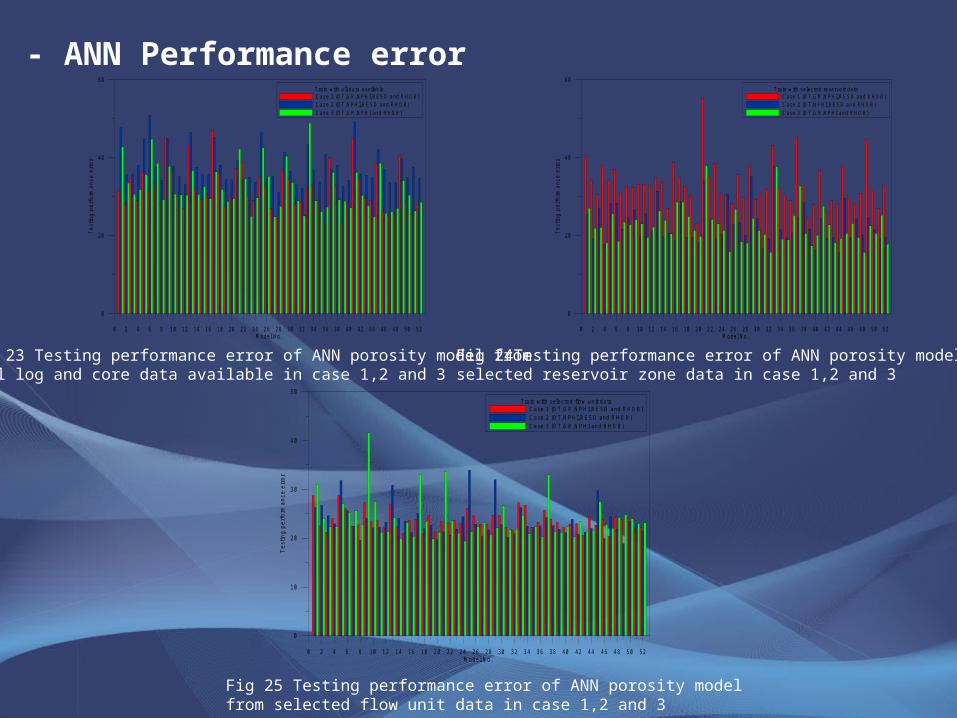
Fig 23 Testing performance error of ANN porosity model from well log and core data available in case 1,2 and 3
0 2 4 6 8 10 12 14 16 18 20 22 24 26 28 30 32 34 36 38 40 42 44 46 48 50 52M odel No.
0
20
40
60
Tes
ting
per
form
ance
err
or
Train w ith se lected reservoir dataCase 1 (D T,G R ,N PHI,RESD and R HO B)
Case 2 (D T,NPH I,R ESD and RH O B)Case 3 (D T,G R ,N PHI and RH O B)
Fig 24Testing performance error of ANN porosity model fromselected reservoir zone data in case 1,2 and 3
0 2 4 6 8 10 12 14 16 18 20 22 24 26 28 30 32 34 36 38 40 42 44 46 48 50 52M odel No.
0
10
20
30
40
50
Tes
ting
per
form
ance
err
or
Train w ith se lected flow unit dataC ase 1 (D T,G R ,N PH I,R ESD and R H O B)
C ase 2 (D T,N PH I,R ESD and R H O B)C ase 3 (D T,G R ,N PH I and R H O B)
Fig 25 Testing performance error of ANN porosity model from selected flow unit data in case 1,2 and 3
- ANN Performance error
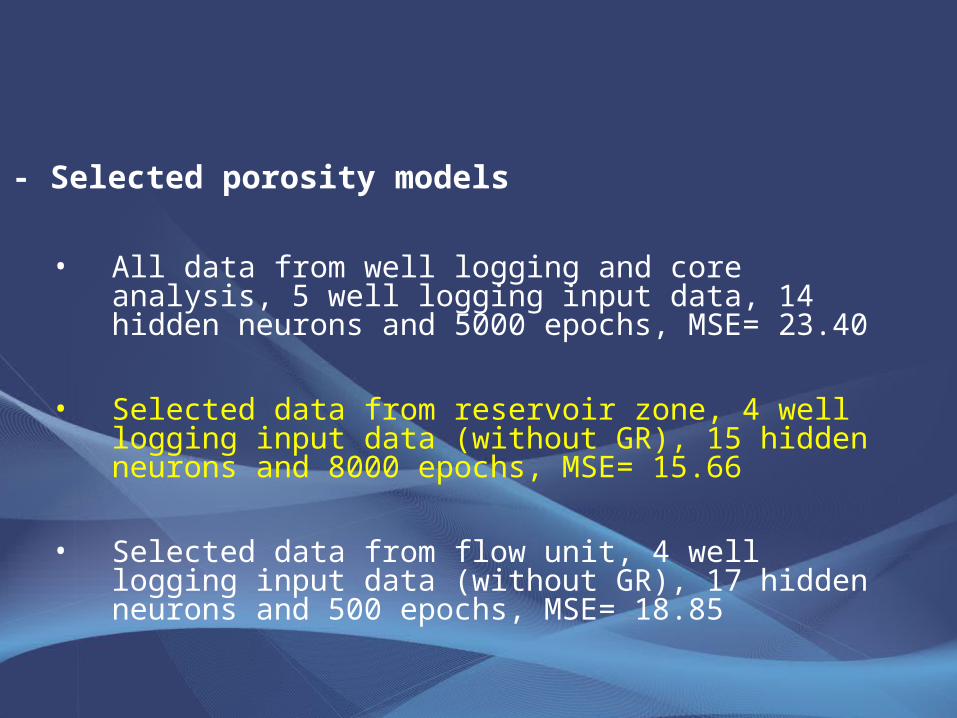
• All data from well logging and core analysis, 5 well logging input data, 14 hidden neurons and 5000 epochs, MSE= 23.40
• Selected data from reservoir zone, 4 well logging input data (without GR), 15 hidden neurons and 8000 epochs, MSE= 15.66
• Selected data from flow unit, 4 well logging input data (without GR), 17 hidden neurons and 500 epochs, MSE= 18.85
- Selected porosity models
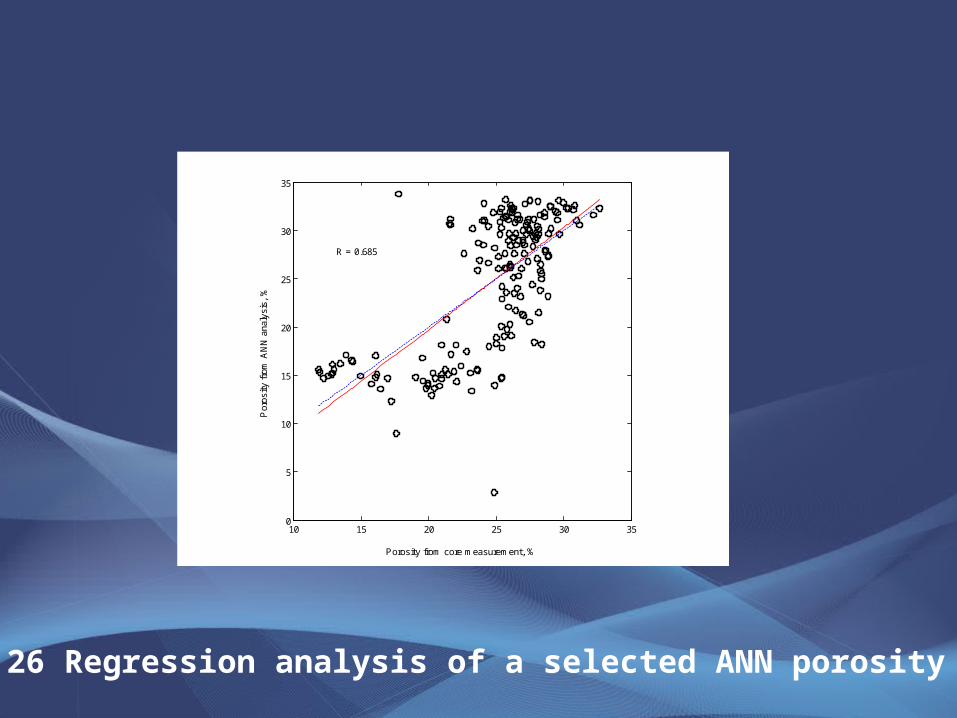
Fig 26 Regression analysis of a selected ANN porosity model
10 15 20 25 30 350
5
10
15
20
25
30
35
Porosity from core measurement, %
Por
osity
fro
m A
NN
ana
lysi
s, %
R = 0.685
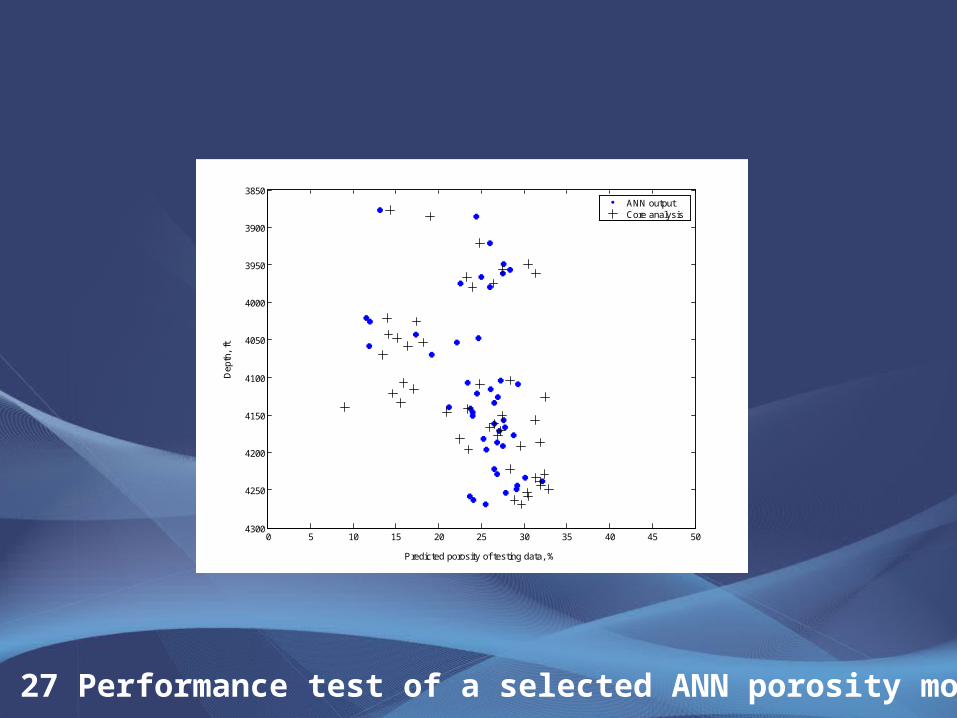
Fig 27 Performance test of a selected ANN porosity model
0 5 10 15 20 25 30 35 40 45 50
3850
3900
3950
4000
4050
4100
4150
4200
4250
4300
Predicted porosity of testing data, %
Dep
th,
ft
ANN outputCore analysis
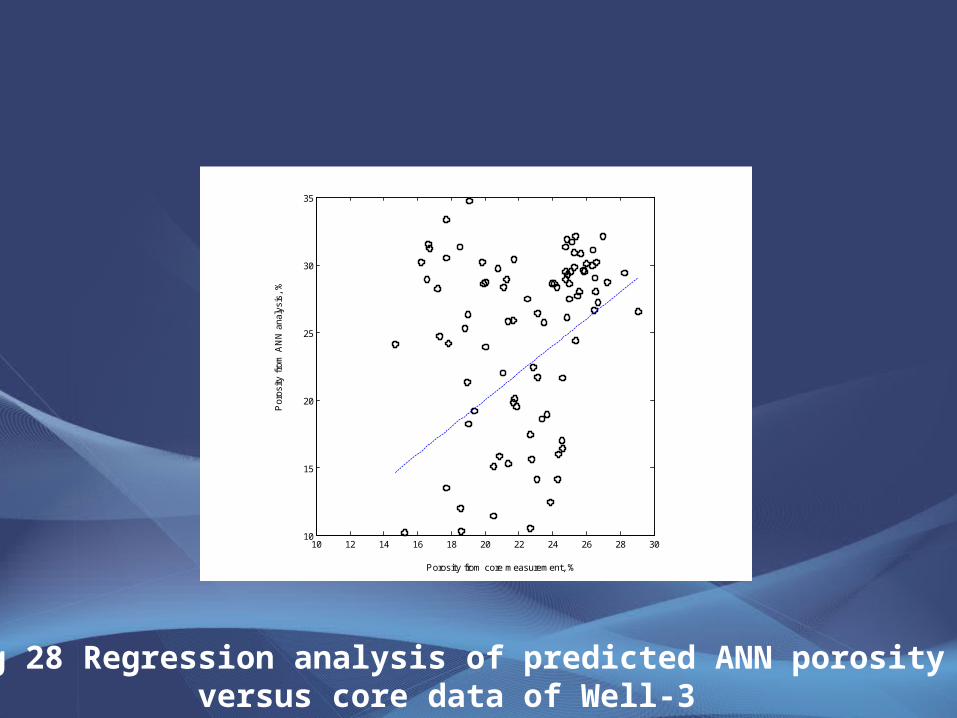
Fig 28 Regression analysis of predicted ANN porosityversus core data of Well-3
10 12 14 16 18 20 22 24 26 28 3010
15
20
25
30
35
Porosity from core measurement, %
Por
osity
fro
m A
NN
ana
lysi
s, %
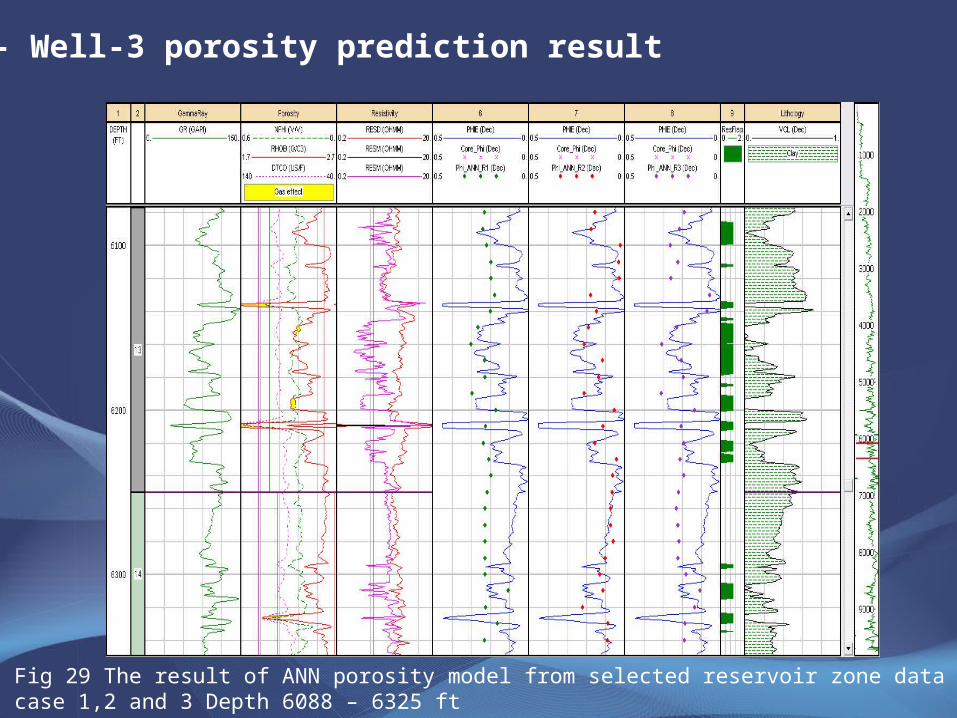
Fig 29 The result of ANN porosity model from selected reservoir zone data in case 1,2 and 3 Depth 6088 – 6325 ft
- Well-3 porosity prediction result
Results and Discussions
ANN permeability model
- Performance error
- Selected permeability models
- Regression analysis
- Test performance error
- Well-3 permeability prediction result
3. ANN prediction model (continued)
0 2 4 6 8 10 12 14 16 18 20 22 24 26 28 30 32 34 36 38 40 42 44 46 48 50 52M ode l N o.
0
40000
80000
120000
Te
stin
g p
erfo
rman
ce e
rror
Tra in w ith a ll data ava ilab leC ase 1 (D T,G R ,N P H I,R E SD and R H O B )
C ase 2 (D T,N PH I,R ES D and R H O B)
C ase 3 (D T,G R ,N P H I and R H O B)
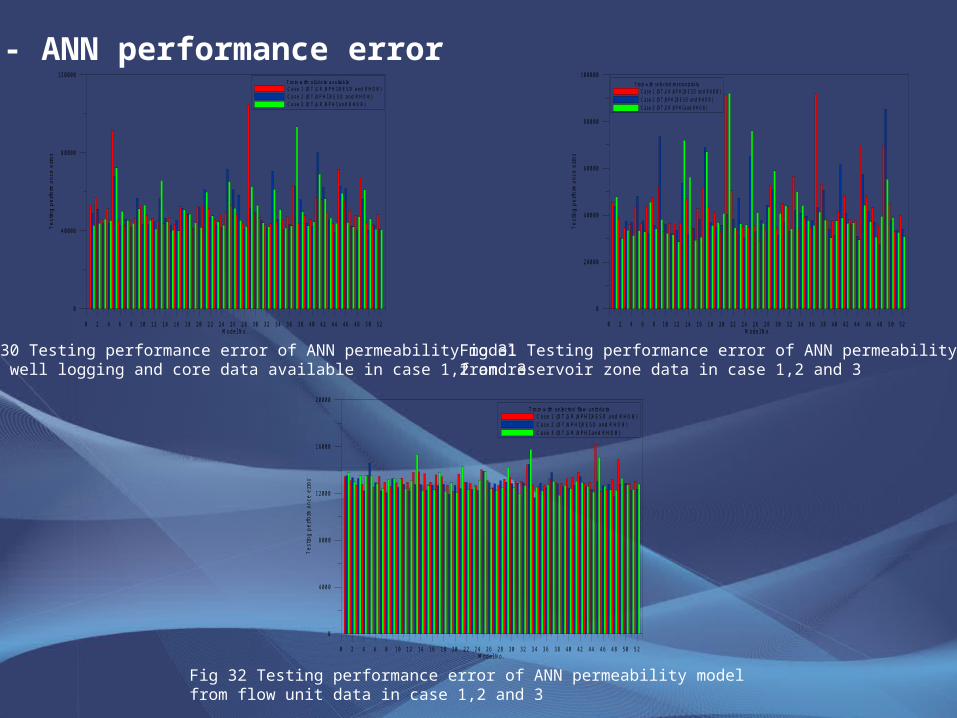
Fig 30 Testing performance error of ANN permeability modelfrom well logging and core data available in case 1,2 and 3
0 2 4 6 8 10 12 14 16 18 20 22 24 26 28 30 32 34 36 38 40 42 44 46 48 50 52M odel N o.
0
20000
40000
60000
80000
100000
Te
stin
g p
erfo
rman
ce e
rror
Train w ith selected reservoir dataCase 1 (DT,G R,NPHI,RESD and RHO B)
Case 2 (DT,NPHI,RESD and RHOB)Case 3 (DT,G R,NPHI and RHOB)
Fig 31 Testing performance error of ANN permeability model from reservoir zone data in case 1,2 and 3
Fig 32 Testing performance error of ANN permeability model from flow unit data in case 1,2 and 3
0 2 4 6 8 10 12 14 16 18 20 22 24 26 28 30 32 34 36 38 40 42 44 46 48 50 52M odel N o.
0
4000
8000
12000
16000
20000
Tes
ting
per
form
ance
err
or
Train w ith se lected flow unit dataCase 1 (D T,G R ,N PHI,RESD and R HO B)
Case 2 (D T,NPH I,R ESD and RH O B)Case 3 (D T,G R ,N PHI and R H O B)
- ANN performance error
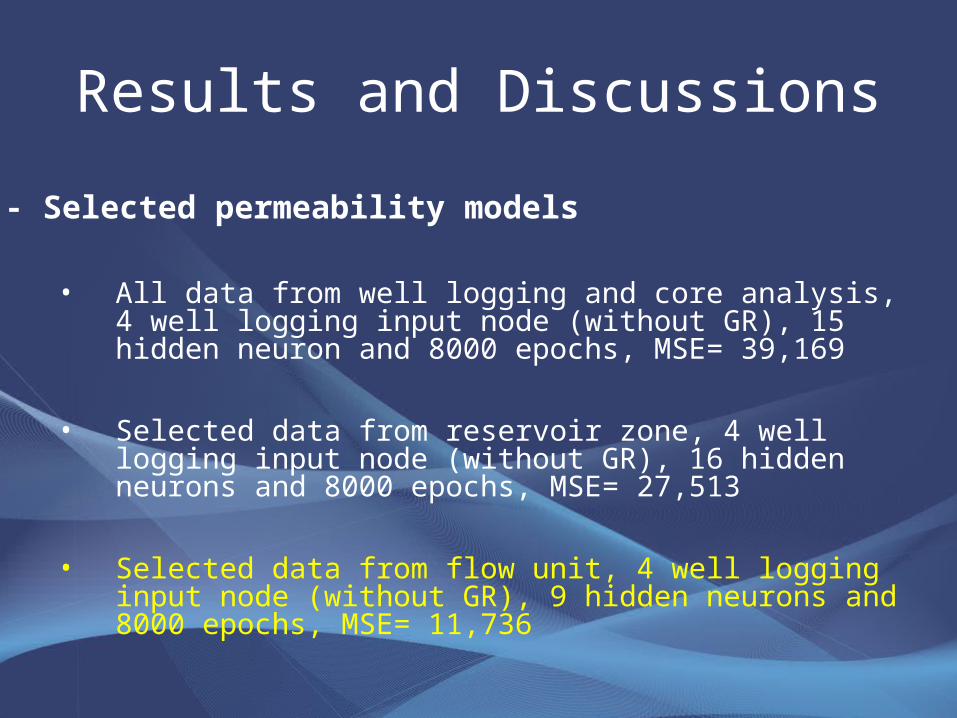
• All data from well logging and core analysis, 4 well logging input node (without GR), 15 hidden neuron and 8000 epochs, MSE= 39,169
• Selected data from reservoir zone, 4 well logging input node (without GR), 16 hidden neurons and 8000 epochs, MSE= 27,513
• Selected data from flow unit, 4 well logging input node (without GR), 9 hidden neurons and 8000 epochs, MSE= 11,736
- Selected permeability models
Results and Discussions
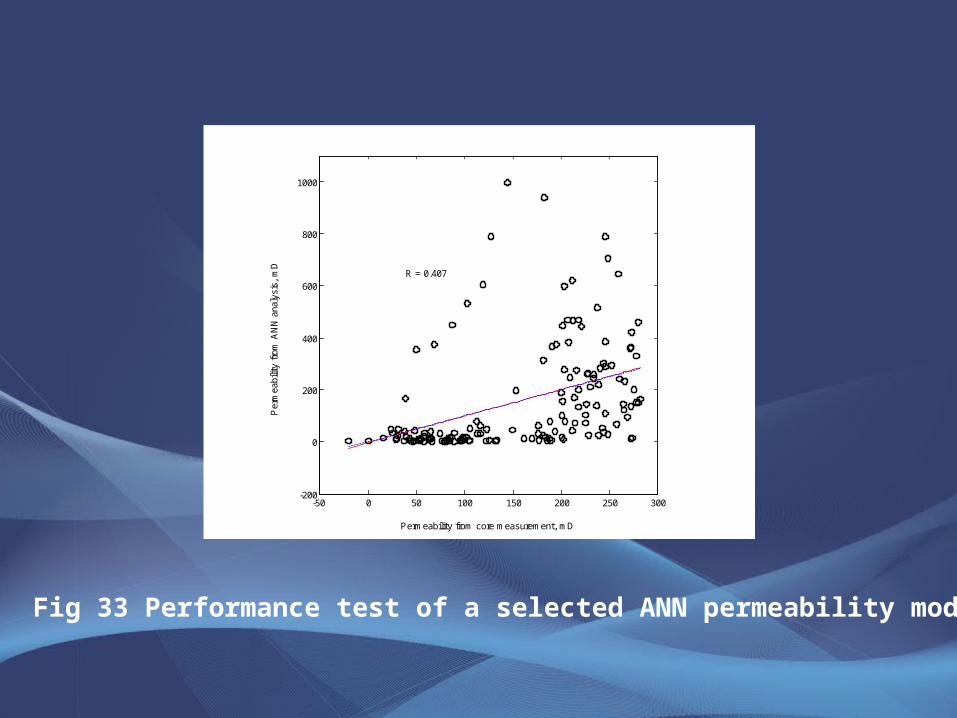
Fig 33 Performance test of a selected ANN permeability model
-50 0 50 100 150 200 250 300-200
0
200
400
600
800
1000
Permeability from core measurement, mD
Per
mea
bilit
y fr
om A
NN
ana
lysi
s, m
DR = 0.407
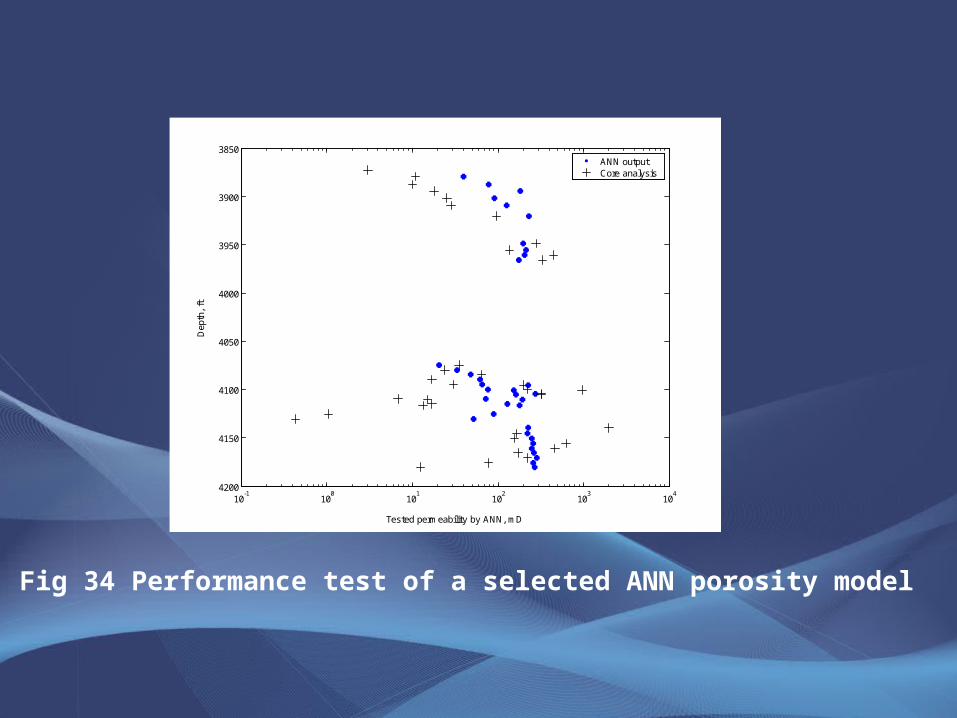
Fig 34 Performance test of a selected ANN porosity model
10-1
100
101
102
103
104
3850
3900
3950
4000
4050
4100
4150
4200
Tested permeability by ANN, mD
Dep
th,
ft
ANN outputCore analysis
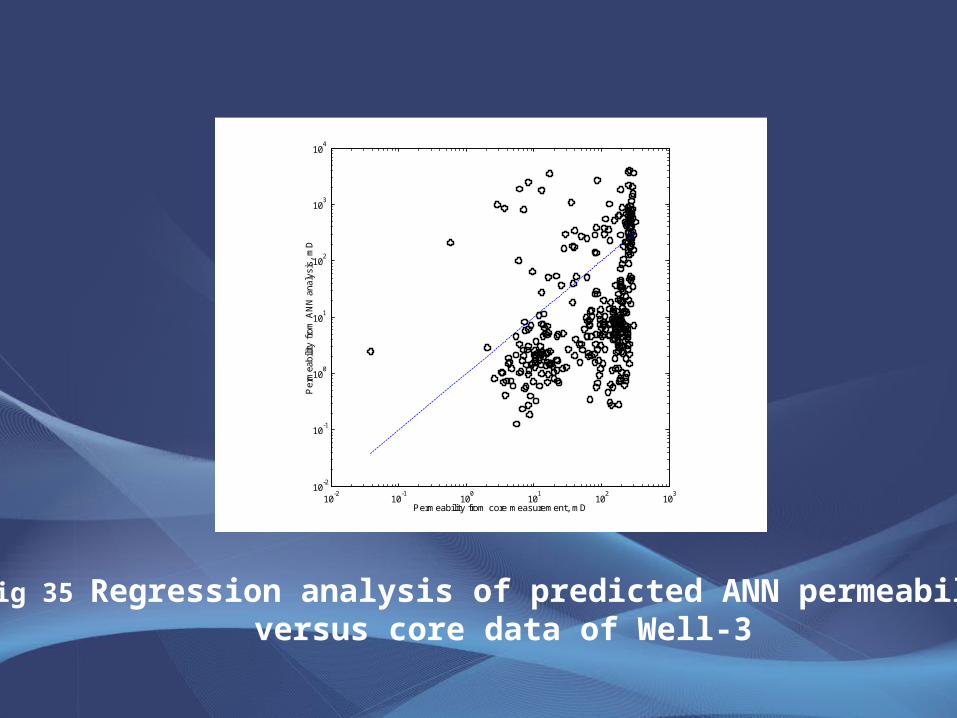
Fig 35 Regression analysis of predicted ANN permeabilityversus core data of Well-3
10-2
10-1
100
101
102
103
10-2
10-1
100
101
102
103
104
Permeability from core measurement, mD
Per
mea
bilit
y fr
om A
NN
ana
lysi
s, m
D
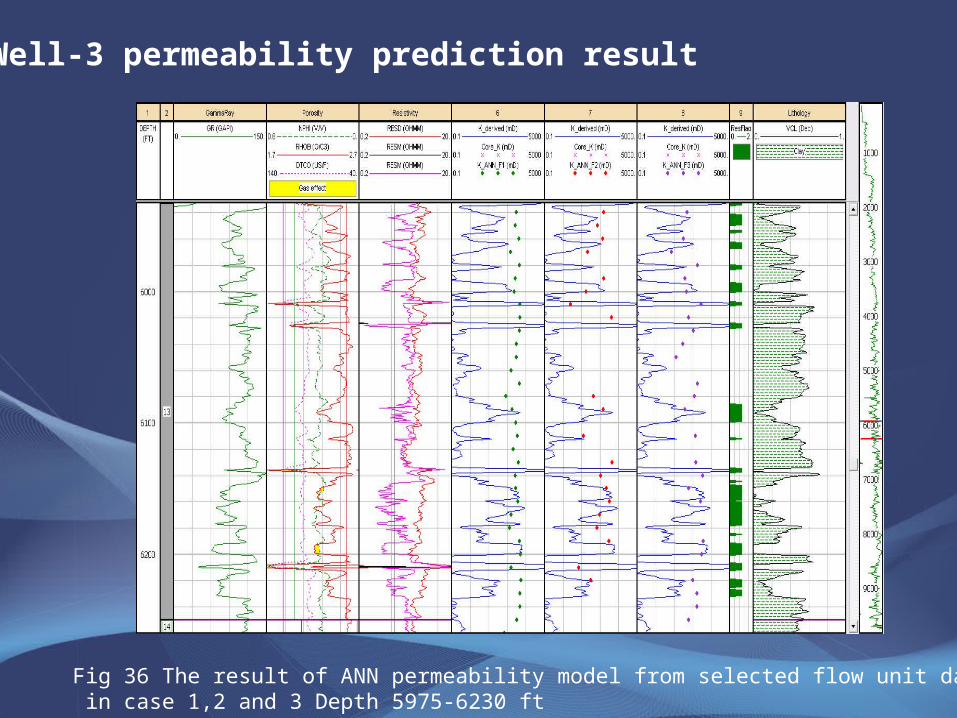
Fig 36 The result of ANN permeability model from selected flow unit data in case 1,2 and 3 Depth 5975-6230 ft
- Well-3 permeability prediction result
Conclusions and Recommendations
• Conclusion
– An Integrated well logging interpretation was done for three wells in the North Malay basin to evaluate porosity, permeability and water saturation.
– The flow unit characterization gives a better understanding of hydraulic flow pattern. The same flow unit might have consistent petrophysical and fluid properties. The flow units were characterized using FZI and the permeability and porosity relationships in this study, three flow units were observed, having FZI equal to 1.5, 4.5 and 13.8.
– The ANN for permeability and porosity prediction was constructed and
used to predict permeability and porosity from well logging in the study area. The ANN and permeability porosity models has the least performance error when input data are selected only from reservoir zone with four input data of DT, NPHI, RESD and RHOB.

Conclusions and Recommendations
• Conclusion (Continued)
– The ANN for porosity and permeability prediction for this study area were found as follows:
(i) ANN porosity model: selected data from reservoir zone, 4 well logging input node (without GR), 15 hidden neurons and 8000 epochs, MSE= 15.66
(ii) ANN permeability model : Selected data from flow unit, 4 well logging input node (without GR), 9 hidden neurons and 8000 epochs, MSE= 11,736

Q & A