Thesis THE DEVELOPMENT OF VIET NAM COFFEE INDUSTRY
52
⦚䵚ℳ抩⮶⸇ ←㯼丰䚕䬸⭺⸇䲚 䬸⭺嵥㠖 怙◦✥⟰㯼䤓䤋⻤ THE DEVELOPMENT OF VIET NAM COFFEE INDUSTRY 䪣䴅䞮᧶喒䘘Ⱜ 㖖⺝㟨㘗᧶➟䝣䜚㟨㘗 ₼噾㺠⦚◐⏼㦗
Transcript of Thesis THE DEVELOPMENT OF VIET NAM COFFEE INDUSTRY
�������
��������
��������
���������
THE DEVELOPMENT OF VIET NAM COFFEE INDUSTRY
�� ���
���� ������
�
���������������
National Chiao Tung University College of Management
Global Master of Business Administration
Thesis
THE DEVELOPMENT OF VIET NAM COFFEE
INDUSTRY
June 2010
Hsinchu, Taiwan, Republic of China
Student: Pham Ngoc Trang
Advisor: Professor Tang Ying Chan

The Development of Viet Nam Coffee Industry
������������� ����
Student: Tara Pham
Advisor: Professor Tang Ying Chan
��������������� ���
�� �����
A thesis
Submitted to Global MBA
College of Management
National Chiao Tung University
In partial Fulfillment of the Requirements
for the Degree of Master in Business Administration
June 2010
Hsinchu, Taiwan, Republic of China
i
The Development of Viet Nam Coffee Industry
Student: Pham Ngoc Trang Advisor: Professor Tang Ying Chan
College of Management - Global MBA
National Chiao Tung University
ABSTRACT
The coffee tree was introduced into Viet Nam by French in the 1850s. However, coffee
only began to play a really important role in the economic after the Economic Revolution in
1975. Since 1986, the production of coffee, like that of rice, has grown dramatically, making
Viet Nam the fourth largest exporter of coffee in the world in 1998 and maintain the second
position in the world since 2000 until now.
Coffee growth has had very important contribution to the economy: high export value,
decrease in the poverty rate in Central Highland … However, during the world coffee price
crisis, Viet Nam coffee commodity chain was one of the most negatively affected in the world.
Living standards of coffee growers were reduced. Poverty rate, coffee agents’ bankruptcy
increased. But in consuming countries, coffee sellers still earned a lot of money.
This fact shows us that Viet Nam coffee industry is very vulnerable and has a lot of
troubles which need to be solved. One of the main issues is so called “coffee paradox” that
not only Viet Nam encounters but also other producing countries do. In addition to the
orthodox coffee paradox, the paper will also mention low domestic consumption in Viet Nam
and in producing countries.
The paper is going to discuss about the coffee paradox, how to improve the consumption
situation in producing countries including Viet Nam, and some suggestions will be given for
Viet Nam coffee industry’s stable development in the future.

ii
Acknowledgement
First of all, I would like to acknowledge my advisor Professor Tang Ying Chan for his
great efforts during teaching me some courses, and for his fruitful cooperation, precious
comments as well as suggestions concerning about this paper.
Second, I would like to send my gratefulness to GMBA friends. All of us are a happy
family. We always support each other and complement for each other. I studied a lot from all
of you, which help me grow up a lot.
Special thank to my dear husband. Thank you for always being together with me, making
me happy, always accompanying me in all difficulties. In your explanation, regression model
becomes much more simple and easy to understand. And most of all, thanks to you that I feel
this life is beautiful.
Above all, I want to send my warmest thank to my beloved family: my parent, my sisters
and brothers, my nephews and my new born niece. Even though they are far away, they
always support me and encourage me to study and finish the GMBA program.

iii
Table of Contents
Page
English abstract ………………………………………………………………… i
Acknowledgement …..….……………………………………………………… ii
Table of content …..…………………………………………………………… iii Chapter 1: Issues of Viet Nam coffee industry ………………………………… 1
1. Government management and policy ………………………………. 1
1.1. Ministry for Agricultural and Rural Development …………………. 1
1.2. VINACAFE ………………………………………………………… 2
1.3. Vietnamese Bank of Agriculture and Rural Development ………… 2
1.4. Viet Nam Coffee and Cocoa Association ………………………… 2
2. Structure of coffee industry ………………………………………… 2
3. Coffee export with low quality……………………………………… 3
4. Insufficient supply chain ……………………………………………… 4
5. Low quality production, process ……………………………………… 5
6. Coffee paradox……………………………………………………… 6
Chapter 2: Introduction of Viet Nam coffee industry ………………………….. 9
1. Development stages ………………………………………………… 9
2. Influential factors on the growth of coffee industry ………………… 10
2.1. Nature condition for coffee growing………………………………..… 10
2.2. Mass migration ……………………………………………………….. 11
2.3. Government policy…………………………………………………….. 11
2.4. Crop selection ………………………………………………………… 13
2.5. Market signal ………………………………………………….…… 14
3. Role of coffee in National Economy …………………………………. 14
3.1. Export market ………………………………………………………… 14
iv
3.2. Economic value ………………………………………………………. 14
4. Fluctuation in price and production …………………………………. 15
Chapter 3: Literature Review …………………………………………………….. 18
1. Coffee paradox ……………………………………………….…….. 18
2. Coffee commodity value chain …………………………………….. 18
3. Global Value Chain …………………………………………………. 19
4. Value added Agriculture ……………………………………………… 22
Chapter 4: Methodology and findings …………………………………………. 24
Chapter 5: Recommendations for stable development of Viet Nam’s
Coffee industry ………………………………………………………. 40
1. Quality improvement ………………………………………………… 40
2. Sustainable coffee structure in producing ……………………………. 40
3. Domestic consumption and marketing effort …………………………. 42
4. Co-operative organization …………………………………………….. 43
Reference …………………………………………………………………………….. 45

Chapter 1: Issues of Viet Nam coffee industry
1. Government management and policy
The production base of coffee in Viet Nam is now approximately 95 percent private
run farms with the remaining 5 percent being state farms, which are also being gradually
redistributed to small farmers. However, many of the collection, processing and export
roles are still performed by State Owned Enterprises (SOEs).
make up 76% total market.
There are a number of key stakeholders in the Viet Nam coffee industry. A brief description
of these is provided below:
1.1.MARD: Ministry for Agricultural and Rural Development
MARD is the key ministry for coffee. There are a number of research and
development institutions under MARD such as:
- IPSARD: Institute of Policy and Strategy for Agriculture and Rural Development,
- Dak Lak agricultural extension centre.
- WASI: Western
- BRC: Bavi Research Centre, specifically set up for Arabica research in North Viet
Nam.
1
Chapter 1: Issues of Viet Nam coffee industry
Government management and policy
The production base of coffee in Viet Nam is now approximately 95 percent private
run farms with the remaining 5 percent being state farms, which are also being gradually
redistributed to small farmers. However, many of the collection, processing and export
roles are still performed by State Owned Enterprises (SOEs). State owned companies
make up 76% total market. Joint companies make up for only 14% and 10% are others.
Figure 1.1: Coffee Organizational structure
Source: IPSARD, 2008
There are a number of key stakeholders in the Viet Nam coffee industry. A brief description
: Ministry for Agricultural and Rural Development
is the key ministry for coffee. There are a number of research and
development institutions under MARD such as:
IPSARD: Institute of Policy and Strategy for Agriculture and Rural Development,
Dak Lak agricultural extension centre.
WASI: Western Agroforestry and Scientific Institute in Dak Lak.
BRC: Bavi Research Centre, specifically set up for Arabica research in North Viet
14%
10%
76%
Joint company
Others
State owned Company
Chapter 1: Issues of Viet Nam coffee industry
The production base of coffee in Viet Nam is now approximately 95 percent private
run farms with the remaining 5 percent being state farms, which are also being gradually
redistributed to small farmers. However, many of the collection, processing and export
State owned companies
14% and 10% are others.
Coffee Organizational structure
There are a number of key stakeholders in the Viet Nam coffee industry. A brief description
is the key ministry for coffee. There are a number of research and
IPSARD: Institute of Policy and Strategy for Agriculture and Rural Development,
Agroforestry and Scientific Institute in Dak Lak.
BRC: Bavi Research Centre, specifically set up for Arabica research in North Viet
Joint company
Others
State owned Company

2
1.2. VINACAFE: Vinacafé Bien Hoa JSC
The Viet Nam Coffee Corporation is the SOE umbrella company under MARD
that manages 59 SOEs that cover a range of industries including 40 state farms
totaling 27 000 ha of coffee. These state farms work with 27 SOEs, including
processors, traders, and service providers providing credit, fertilizer, irrigation,
research and roasting. VINACAFE took over the supervision of the SOEs from
MARD in 1995. It is now in a process of liberalizing and privatizing these enterprises.
At present the government controls only 5 percent of the coffee production area in
Viet Nam in the form of state farms.
1.3. VBARD��Vietnamese Bank of Agriculture and Rural Development
The Vietnamese Bank of Agriculture and Rural Development is the main form of
credit for coffee farmers, which is a government institution and has 1 600 branches in
rural areas. VBARD estimates that it has 75 percent share of the credit market for
coffee growers. In 2002 this market exceeded USD270 million.
1.4. VICOFA: The Viet Nam Coffee and Cocoa Association (110 members which include 90
SOEs, 18 private companies and 2 scientific institutes).
VICOFA was formed in the late 1980s to help organize the coffee sector and help
government develop coffee policy. It is presented as an independent business
association, but is in reality more of a government affiliated organization representing
Viet Nam in overseas forums and is financed through its members and by government.
These institutions belong to the government. This is the remains of the centralized
economy under the communist regime. These institutions still control and play the
main role in the coffee industry. These organizations did not perform very well.
However, with the government subsidy, these state owned companies still exist and
keep the market power. Government need to have some actions to reform companies
like privatizing state owned companies or allowing more and more foreign companies
to invest in this field.
During the transition time after the liberalization, SOEs played a leading role in the
economy and they had a lot of contribution to the economy. However, because of the support
from the government, these SOEs became less competitive and lost the leading role in the
economy. The change in the economy institution requires more contribution from private
companies. As a result, the process of SOEs coffee company privatization is indispensability.
2. Structure of coffee industry

3
Currently, the coffee structure in Viet Nam is: Robusta 95% and 5% of Arabica. The
reason why Robusta dominates coffee structure is because: Robusta is a farmer friendly
friend. Viet Nam Government’s choice to grow Robusta is a wise strategy because
Robusta is very resistant to diseases, time to bear fruit is short; no requirement for high
technology.
AREA ARABICA ROBUSTA
Percentage 5% 95%
Economic value High Low
Now, total area of coffee planting tin Viet Nam is 506.000 hectare. Robusta makes up
95% and is widely planted in Dak Lak, Lam Dong, Gia Nai, Kon Tum, Dong Nai with
total area of 480.000 hectare. Arabica is grown in a wide area from North to South part
with cold weather but the total area is only 26.500 hectare.
However, from the world coffee market, it is easy to be seen: the economic value of
Arabica is double compared with Robusta. For example, the price of Columbia Arabia is
100 cent/lb in 2007, which is double the price of Viet Nam Robusta at 55.8 cent/lb.
Meanwhile the price of Robusta has been sinking much faster than of Arabica.
Vietnamese coffee industry is therefore facing a bigger lost and finds itself in need of
making some changes to be adapted with this ever-changing international market. And we
need to put more effort in balancing coffee structure between Robusta and Arabica.
3. Coffee export with low quality
According to the report of International Coffee Organization (ICO), 88% of the
rejected coffee in the world from September 2006 to March 2007 came from Viet Nam,
which represented an increase of 19% in the quantity of Vietnam coffee rejected
compared to the previous 6 months.
Actually, the new standard for coffee, TCVN 4193 – 2005 (Tieu chuan Viet Nam
4193 - 2005) was issued in 2005 in order to minimize the ratio of rejected coffee and
proves to fit ICO's standards. However, this new standard is not a must in Viet Nam. So it
has been applied but only by 10% of enterprises or equal to 1 ~ 1.5% of coffee export
4
every year. The quality of Vietnam's raw Robusta coffee is not as bad as people think. If
farmers do not pick unripe beans and follow regulations in collecting and processing,
Vietnam's coffee would have a low ratio of bad beans. Coffee is divided into 5 grades
with different ratio of defects in 300 grams. Currently, Viet Nam coffee is grade 4 with
60-70 bad beans for every 300 gram. This bad quality causes the low price of the coffee
export these years.
The failure of applying new standard is due to cost that enterprises have to face. The
application of TCVN 4193-2005 means that enterprises will have to change all the
machines and the production process (purchasing, preliminary treatment and packaging),
which will take time and money.
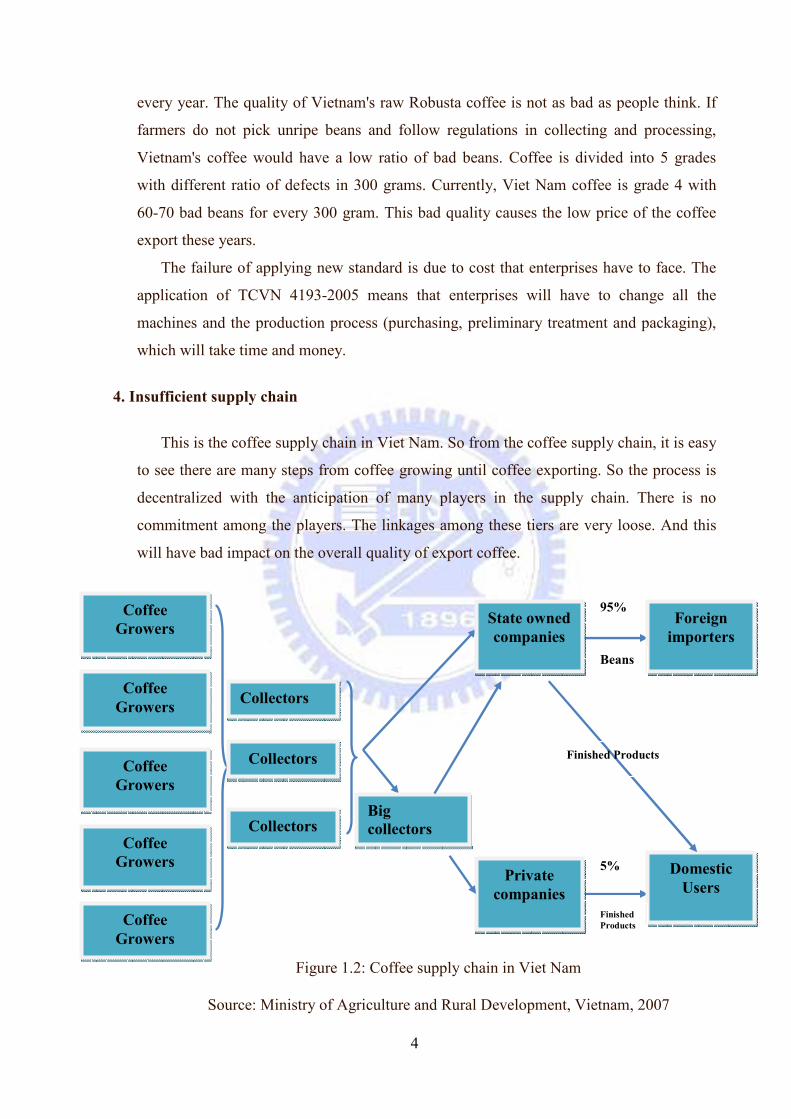
4. Insufficient supply chain
This is the coffee supply chain in Viet Nam. So from the coffee supply chain, it is easy
to see there are many steps from coffee growing until coffee exporting. So the process is
decentralized with the anticipation of many players in the supply chain. There is no
commitment among the players. The linkages among these tiers are very loose. And this
will have bad impact on the overall quality of export coffee.
Figure 1.2: Coffee supply chain in Viet Nam
Source: Ministry of Agriculture and Rural Development, Vietnam, 2007
Coffee Growers
Coffee Growers
Coffee Growers
Coffee Growers
Coffee Growers
Collectors
Collectors
Collectors
Foreign importers
Private companies
State owned companies
95%
Beans
Domestic Users
5%
Finished Products
Finished Products
Big collectors

5
Coffee is grown mainly by the private household (about 95%) and only 5% is grown
in state owned plantation. So when the harvest time comes, coffee cherry will be collected
by household coffee growers. The problem here is that coffee cherry is ripe at different
time. When the farmers pick up coffee cherry, they will pick up both red and green cherry.
Coffee growers do not pay much attention the step of sorting. So the ripe and unripe
coffee will be mixed together. That decrease the quality of coffee a lot and the price will
be pressed down a lot by the buyers.
Coffee collectors will collect coffee from the coffee growers or small collectors. Then
they will sort and dry coffee. Part of coffee will be sold to state owned companies and part
of coffee will be transported to big collectors. Big collectors will process coffee simply
and then partly will be sold to private roasting companies or households. Coffee will be
ground or processed into different kind of products and then sold to domestic customers.
At state owned companies, coffee will be bought from small collectors. Coffee will be
graded again into type I, II …. 95% of coffee will be exported under the form of beans to
foreign importers. And small part will be processed into finished products like ground
coffee, instant coffee, milk coffee and consumed in domestic market.
Deeper looking into the supply chain in the other producing countries, the coffee
supply chain in other countries also has a lot of problems. However, big and developed
coffee countries like Brazil, Indonesia or Mexico; they already developed a very sufficient
coffee supply chain. Vertical integration is one of the models that work very well in
Indonesia. To have a better control of coffee quality, Indonesia applies the vertical
integration in coffee planting and producing. A set of uniform methods is used to reduce
as much “waste” in coffee supply chain as possible. This model is being researched and
considered to be applied in Vietnam.
5. Low quality production, process
The main technology used was dry processing. Most farmers dry coffee outdoor by
themselves and then sell to the collectors. Dry method is the most traditional method and
used broadly because this method does not need a lot of machinery investment. Level of
mechanization in the farmers is very low. Very few farmers can dry coffee by using
drying machine. The advantage of this method is cheap. However, the quality of coffee
product is very low.
6
Recently, domestic companies began to use wet technology. However, the scope is
still very limited. One of the reasons that limit the using and applying wet technology is
that this technology needs a huge investment. Meanwhile, most of the coffee producers in
Viet Nam are small household.
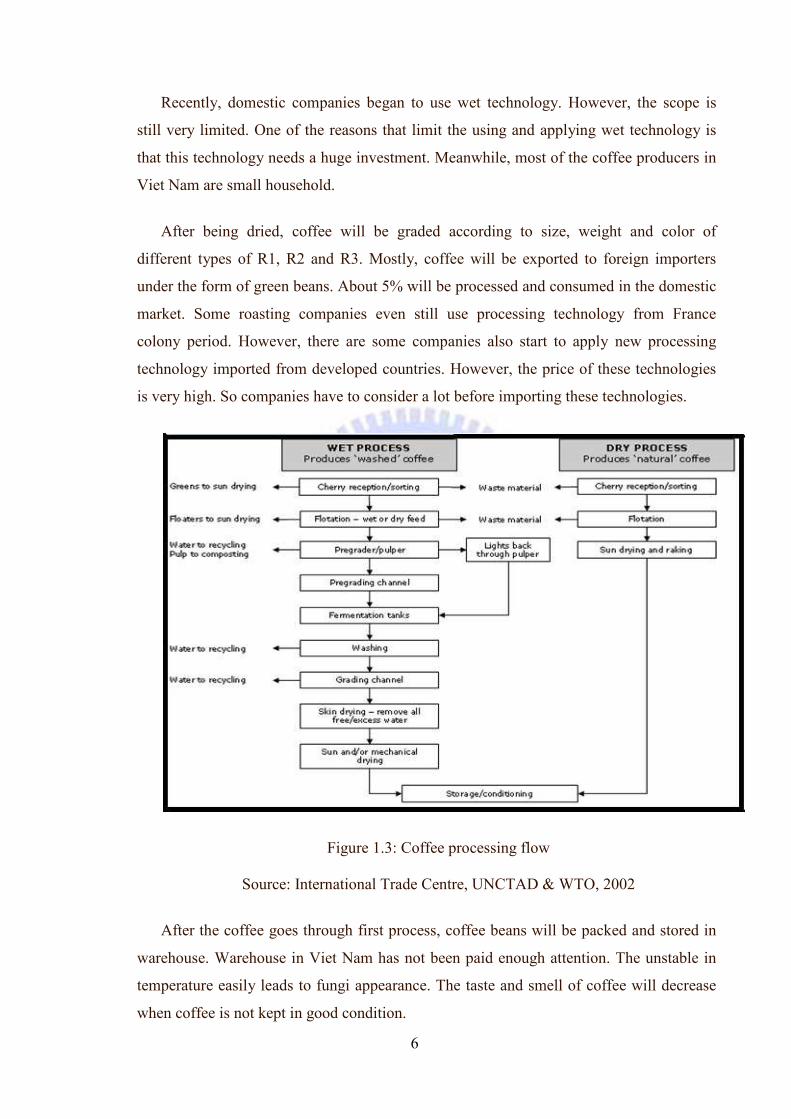
After being dried, coffee will be graded according to size, weight and color of
different types of R1, R2 and R3. Mostly, coffee will be exported to foreign importers
under the form of green beans. About 5% will be processed and consumed in the domestic
market. Some roasting companies even still use processing technology from France
colony period. However, there are some companies also start to apply new processing
technology imported from developed countries. However, the price of these technologies
is very high. So companies have to consider a lot before importing these technologies.
Figure 1.3: Coffee processing flow
Source: International Trade Centre, UNCTAD & WTO, 2002�
After the coffee goes through first process, coffee beans will be packed and stored in
warehouse. Warehouse in Viet Nam has not been paid enough attention. The unstable in
temperature easily leads to fungi appearance. The taste and smell of coffee will decrease
when coffee is not kept in good condition.

7
Currently, the main problem of coffee production and processing is decentralization.
Coffee growers, collectors and companies more or less take part in producing and
processing with many kinds of technologies, which makes the coffee not uniform, low
quality and low price. Meanwhile, in other countries like Indonesia, processing steps only
happen in big companies.
6. Coffee paradox
6.1. Domestic consumption, product diversification
According to a researched by IPSARD, domestic consumption in Viet Nam is 2007 is
only 0.5kg/person/year. Compared with the other countries, this number is too small. And
the paradox that we need to address here is: Viet Nam ranks 2nd on the coffee producing
and exporting market. However, the domestic consumption is too low compared with the
production amount.
Table 6.1: Coffee consumption amount per person per year in Viet Nam and EU
countries 2007
Area Coffee consumption amount per
person per year
Viet Nam 0.5kg
North Europe 10Kg
West Europe 5-6Kg
Source: IPSARD, 2007
Product variety is another side of the problem. Currently, only 5% of coffee produced
is consumed in domestic market. However, the number of product is very poor.
- Ground coffee occupies 2/3 total market
- Instant coffee occupies 1/3 total market
And Viet Nam does not have any national coffee brand.
6.2. Low income for coffee growers

8
The income distributed for coffee growers fluctuates together with the global coffee
price. However, the issue that must be addressed here is the gap of income distribution
between coffee growers and Viet Namese exporters. Coffee growers receive so few from
what they input in the coffee crop. But because they cannot get access to information of
price directly, so they are always at the disadvantageous position in bargaining with
traders.
This situation happens not only in Viet Nam but also in other coffee producing
countries. So in the next part, more time and effort will be put in this paradox under the
global point of view.
Figure 1.4: Price to growers and export price gap
0
500
1000
1500
2000
2500
3000
USD/ton
Gap between Domestic price to growers and export price
Price for grower at farm gate Export price

9
Chapter 2: Introduction of Viet Nam coffee industry
1. Development stages
Viet Nam’s coffee industry’s development process is marked by important time points.
1857 is the year that Coffee was first introduced to Viet Nam by French. But until 1888,
coffee was official planted in Viet Nam. French brought coffee tree Arabica from
Bourbon Island to plant in the Northern Viet Nam and then expanded to other area. At that
time, coffee was exported under the trademark: Arabica du Tonkin.
Early in the 20th century, coffee was grown in plantations in Nghe An and High land
with the total area no more than 7000 hectare. In 1975, Viet Nam was unified. With the
policy of redistribution of population, labor force at highland area was supported with the
stream of migrant residents. Total coffee area in 1975 is 19.000 hectare.
1994 is the time when coffee price set up the record at 135 cent/lb. The price escalated
from 62 cent to 135 cent due to the drop in production and export in Brazil. 1994 coffee
crop in Brazil was hit badly by the frost. The total export from Brazil decreased from 19
million bags in 1993 to 13 million bags in 1995/1996. Price increasing encouraged Viet
Namese farmers to expand coffee area and the total of coffee reached 517.000 hectare in
2000.
With the expansion in producing, export quantity also set up the record in 2000. It is
the first time Viet Nam occupied the second position in coffee exporting market, second to
Brazil with total amount of 11 million bags. Viet Nam has remained this position until
now.
However, the over expansion in coffee producing in Viet Nam was also one of the
reason leading to coffee crisis in 2002-2003. The price dropped down to 45 cents/lb.
Coffee area decreased 70.000 hectare in the time of price crisis.
1857 1975 19941999-2000
2002-2003
Introduction of coffee to Viet Nam
Unification
Brazil coffee crop hit by frost
Rank 2 in the world
Coffee crisis
10
2. Influential factors on the growth of coffee industry
2.1. Nature condition for coffee growing
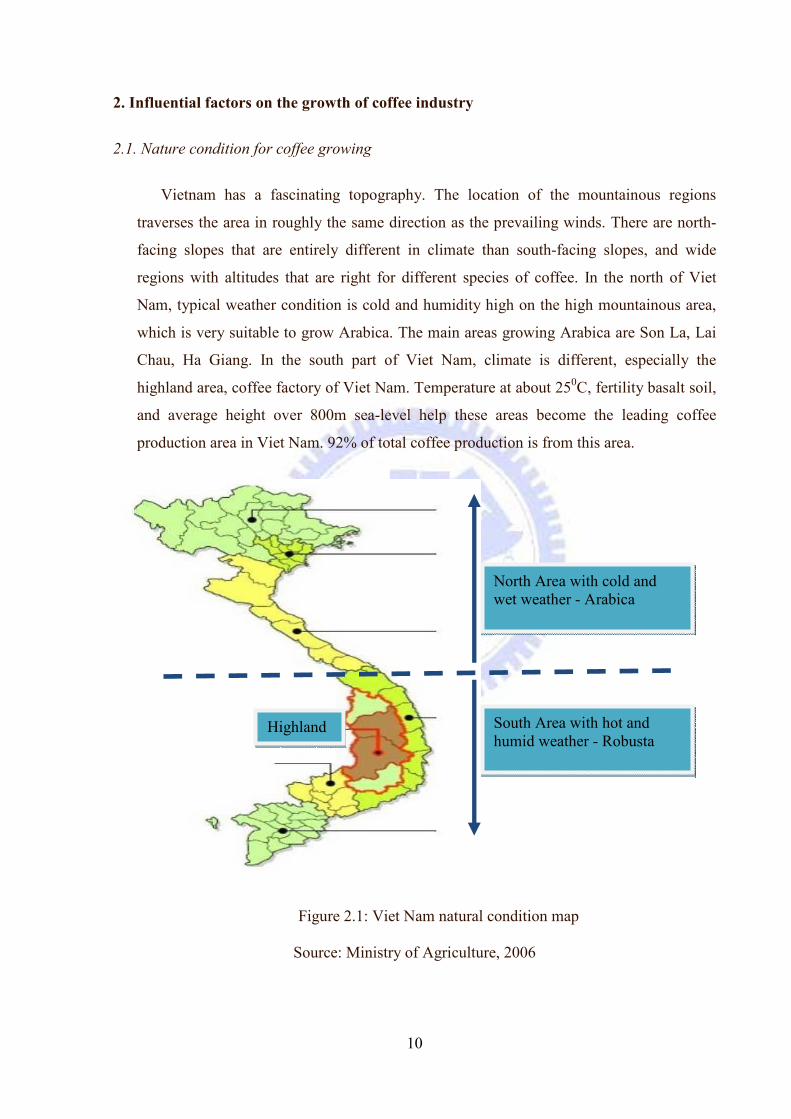
Vietnam has a fascinating topography. The location of the mountainous regions
traverses the area in roughly the same direction as the prevailing winds. There are north-
facing slopes that are entirely different in climate than south-facing slopes, and wide
regions with altitudes that are right for different species of coffee. In the north of Viet
Nam, typical weather condition is cold and humidity high on the high mountainous area,
which is very suitable to grow Arabica. The main areas growing Arabica are Son La, Lai
Chau, Ha Giang. In the south part of Viet Nam, climate is different, especially the
highland area, coffee factory of Viet Nam. Temperature at about 250C, fertility basalt soil,
and average height over 800m sea-level help these areas become the leading coffee
production area in Viet Nam. 92% of total coffee production is from this area.
Figure 2.1: Viet Nam natural condition map
Source: Ministry of Agriculture, 2006
North Area with cold and wet weather - Arabica
South Area with hot and humid weather - Robusta
Highland

11
Five provinces including Dong Nai, Dac Lac, Lam Dong, Kon Tum, Gia Lai are
leading in coffee production annually. Because of this, almost any species of coffee can be
grown in what would be considered its ideal or "native" climate.
2.1.1. Soils: The central highlands are fertile and are well suited for
Robusta coffee. Dak Lak has two main types of soils. These are
deep, weathered soils derived from Basalt origins described as
Rhodic-Humic Ferralsols and Acric Ferralsols. These kinds of land
have a very low bulk-density and allow good water penetration.
2.1.2. Water resources have been essential for the high yields obtained by
coffee farmers in Viet Nam. The basaltic soils of the Central
Highlands have provided this with their large stores of underground
water which are replenished annually by the monsoon rains.
2.1.3. Climate is ideal for both Arabica and Robusta growing. In the
highland area, warm tropical climate, influenced by the south Asian
monsoon with distinct dry and rainy seasons enable Robusta to
develop very well. Cold, humid weather on high mountainous area
in the north is suitable for Arabica growth.
2.2. Mass migration
The corner stone of the development of coffee in Viet Nam has been the mass
migration program undertaken by the GOV after reunification in the late 1970s
and early 1980s to solve unemployment and social unrest. New Economic Zones
(NEZs) were established and people were encouraged to move from populated
areas in the Mekong Delta in the south, the Red River Delta in the north and the
major cities, particularly Ho Chi Minh City. Sparsely populated areas like the
Central Highlands province provided the location. Planned migration also
provided the benefit of ‘stabilizing’ these upland areas dominated by ethnic
minorities, as many settlers were demobilized soldiers from the north. The
population of the Central Highlands (5 provinces) increased from 1.5 million in
1975 to 4.2 million in 2000. This is a big contribution to the labor force in this area.
2.3. Government policy
The key to successful policies have been the willingness of the GOV to change
and adapt to market forces. Throughout the development of the coffee industry the
12
GOV provided the key ingredients for the growth of the coffee industry, these
being:
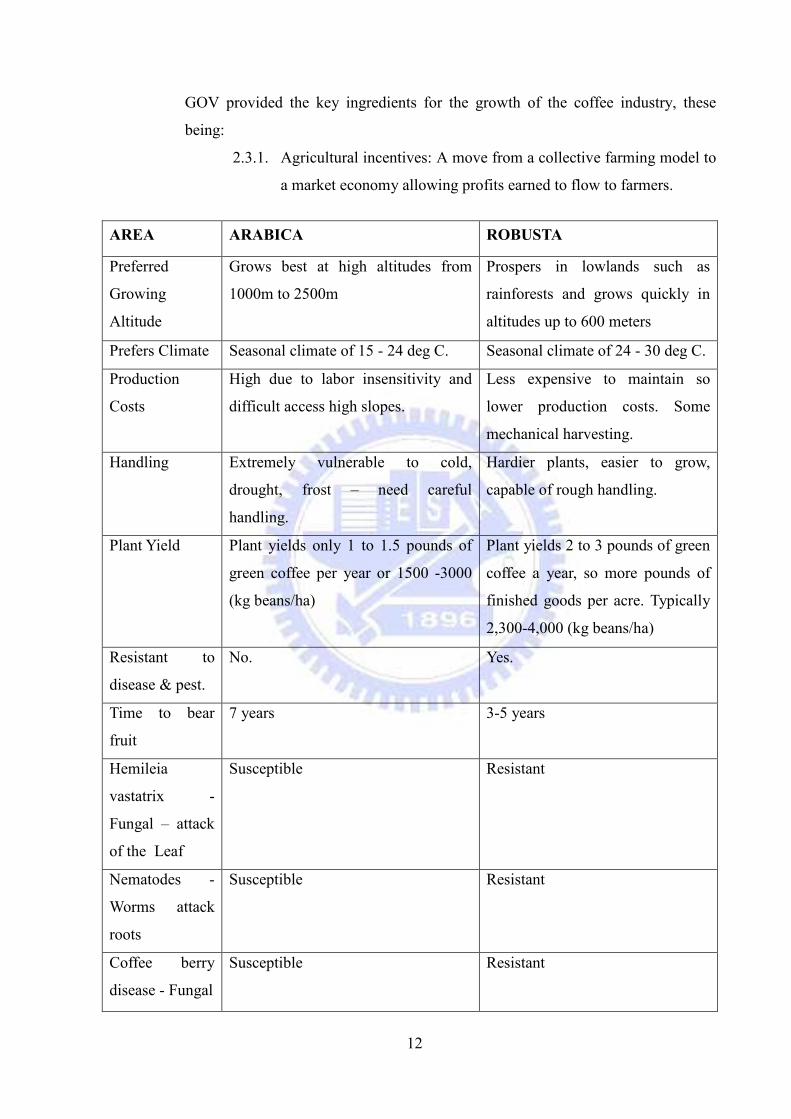
2.3.1. Agricultural incentives: A move from a collective farming model to
a market economy allowing profits earned to flow to farmers.
AREA ARABICA ROBUSTA
Preferred
Growing
Altitude
Grows best at high altitudes from
1000m to 2500m
Prospers in lowlands such as
rainforests and grows quickly in
altitudes up to 600 meters
Prefers Climate Seasonal climate of 15 - 24 deg C. Seasonal climate of 24 - 30 deg C.
Production
Costs
High due to labor insensitivity and
difficult access high slopes.
Less expensive to maintain so
lower production costs. Some
mechanical harvesting.
Handling Extremely vulnerable to cold,
drought, frost – need careful
handling.
Hardier plants, easier to grow,
capable of rough handling.
Plant Yield Plant yields only 1 to 1.5 pounds of
green coffee per year or 1500 -3000
(kg beans/ha)
Plant yields 2 to 3 pounds of green
coffee a year, so more pounds of
finished goods per acre. Typically
2,300-4,000 (kg beans/ha)
Resistant to
disease & pest.
No. Yes.
Time to bear
fruit
7 years 3-5 years
Hemileia
vastatrix -
Fungal – attack
of the Leaf
Susceptible Resistant
Nematodes -
Worms attack
roots
Susceptible Resistant
Coffee berry
disease - Fungal
Susceptible Resistant

13
2.3.2. Access to capital: Land reforms provided an asset base for
individual farmers to access finance to fund further coffee
expansion. A comprehensive rural banking system helped with this
as much of the lending was made by state owned banks. The GOV
has shown a willingness to ensure its banks froze loans or extended
the lending periods in times of hardship and lower coffee prices.
2.3.3. Agricultural inputs: Key agricultural inputs were provided, initially
from locally produced fertilizers, but increased to large-scale
importation at critical times to aid the industry’s growth.
2.3.4. Market access: Marketing channels were developed by the state
farms and SOEs involved in exporting coffee. Gradually the private
sector has taken them over.
2.4. Crop selection: Robusta Coffee, a “farmer friendly” crop
Robusta is a flexible and forgiving crop. Yield can be controlled by varying
the water and fertilizer inputs and farm management inputs like pruning. The
Vietnamese farmers have adopted many successful strategies in order to
maximize profits from Robusta. Viet Nam Robusta flowers in the dry season,
so irrigation is required to break the flower bud dormancy and induce
flowering and then fruit set. The level of flowering depends largely on the
volume and number of heavy watering applied during the dry season from
January to April. Vietnamese farmers use this strategy well. After the harvest
in December and January they also prune to allow light into the Robusta bush,
hence developing new bearing sites.
The amount of water and fertilizer used will also depend on the farmers’
finances and the likely price for coffee. Farmers use these strategies to manage
inputs and to maximize yields when Robusta prices are profitable. They are
able to reduce inputs without any major problems for the Robusta bush (unlike
Arabica coffee which has major issues if the management system is changed).
To rejuvenate Robusta, the plant is simply cut off at knee level and this allows
it to re-grow with vigor when water and fertilizer are applied. Robusta coffee
has few pest and disease problems, hence the name ‘Robusta’. Robusta coffee
is very simple to process; it is storable, tradable, transportable and mostly non-
perishable.
2.5. Market signal:
High coffee market prices during the 1990s gave very strong market signals to
farmers. Viet Nam’s annual average ex
late1980s to reach USD2
USD1200/ton in 1999.
3. Role of coffee in National Economy
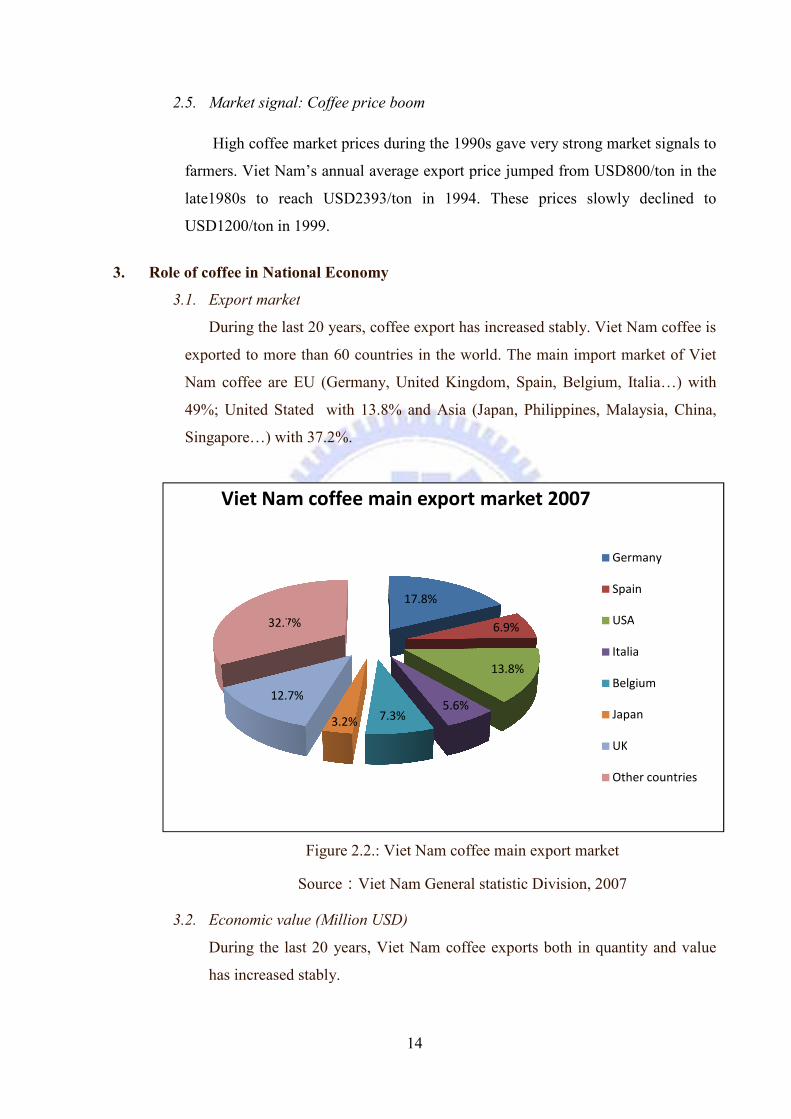
3.1. Export market
During the last 20 years, coffee export has increased stably. Viet Nam
exported to more than 60 countries in the world. The m
Nam coffee are EU (Germany, United Kingdom, Spain, Belgium, Italia…
49%; United Stated
Singapore…) wi
3.2. Economic value (Million USD)
During the last 20 years, Viet Nam coffee exports both in quantity and value
has increased stably.
12.7%
32.7%
Viet Nam coffee main export market 2007
14
Market signal: Coffee price boom
High coffee market prices during the 1990s gave very strong market signals to
farmers. Viet Nam’s annual average export price jumped from USD800/ton in the
ate1980s to reach USD2393/ton in 1994. These prices slowly declined to
USD1200/ton in 1999.
Role of coffee in National Economy
Export market
During the last 20 years, coffee export has increased stably. Viet Nam
exported to more than 60 countries in the world. The main import
are EU (Germany, United Kingdom, Spain, Belgium, Italia…
United Stated with 13.8% and Asia (Japan, Philippines, Malaysia, China,
Singapore…) with 37.2%.
Figure 2.2.: Viet Nam coffee main export market
Source�Viet Nam General statistic Division
Economic value (Million USD)
During the last 20 years, Viet Nam coffee exports both in quantity and value
has increased stably.
17.8%
6.9%
13.8%
5.6%7.3%3.2%
12.7%
32.7%
Viet Nam coffee main export market 2007
High coffee market prices during the 1990s gave very strong market signals to
port price jumped from USD800/ton in the
393/ton in 1994. These prices slowly declined to
During the last 20 years, coffee export has increased stably. Viet Nam coffee is
import market of Viet
are EU (Germany, United Kingdom, Spain, Belgium, Italia…) with
ia (Japan, Philippines, Malaysia, China,
Figure 2.2.: Viet Nam coffee main export market
Viet Nam General statistic Division, 2007
During the last 20 years, Viet Nam coffee exports both in quantity and value
Viet Nam coffee main export market 2007
Germany
Spain
USA
Italia
Belgium
Japan
UK
Other countries

15
Figure 2.3: Coffee export value from 1991 to 2008
Source: Ministry of Agriculture
Coffee price in the world market has increased to 1.873 USD/ton in 1994 and
2.411USD/ton in 1995 because of the reduction in producing and exporting in
Brazil. This market signal encouraged Viet Nam coffee growers to expand the
production area. Gradually, coffee becomes one of the most important agriculture
export products in 1990s and until now. Export value stably fluctuated between
400 and 600 million USD, contributed from 6% to 10% to the national total export
value. In a short time, Viet Nam became the world second biggest export country
in the world, after Brazil. In 2001, Viet Nam ranked number 1 in the world in
exporting Robusta coffee with 41.3% of total market share. The export value also
went up with the increase in production and export.
4. Fluctuation in price and production
The most striking feature of Viet Nam coffee industry is the fluctuation in production
and price. The fluctuation in production and price is together with the global trend.
When the production decreases, price will go up. And the highest price is in 1994/1995
and 2007/2008. And the lowest price is during price crisis 2001-2002. Price dropped
down to around 0.4USD/kg.
0
200
400
600
800
1000
1200
1400
0
200
400
600
800
1000
1200Million USDthousand tons Export result
Export quantity Export Value
16
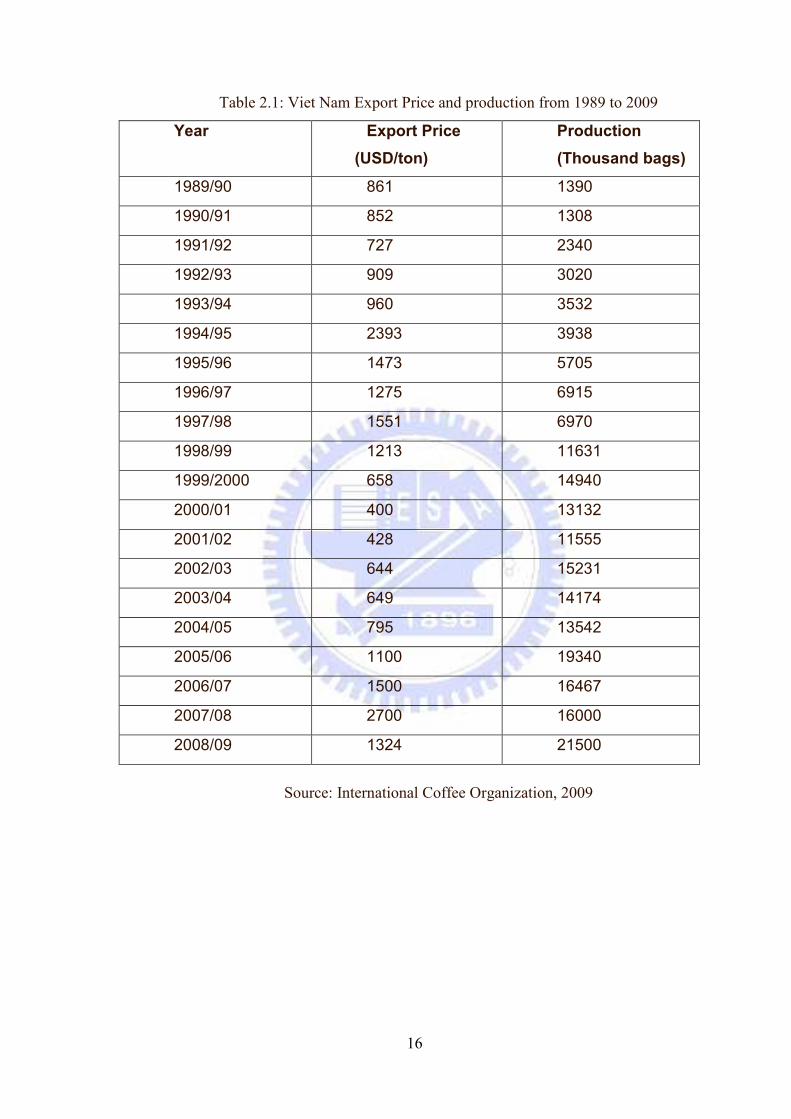
Table 2.1: Viet Nam Export Price and production from 1989 to 2009
Year Export Price
(USD/ton)
Production
(Thousand bags)
1989/90 861 1390
1990/91 852 1308
1991/92 727 2340
1992/93 909 3020
1993/94 960 3532
1994/95 2393 3938
1995/96 1473 5705
1996/97 1275 6915
1997/98 1551 6970
1998/99 1213 11631
1999/2000 658 14940
2000/01 400 13132
2001/02 428 11555
2002/03 644 15231
2003/04 649 14174
2004/05 795 13542
2005/06 1100 19340
2006/07 1500 16467
2007/08 2700 16000
2008/09 1324 21500
Source: International Coffee Organization, 2009

17
Figure 2.4: Fluctuation in Price and production
0
500
1000
1500
2000
2500
3000
0
5000
10000
15000
20000
25000
USD/tonThousand bags
Production Export price
18
Chapter 3: Literature Review
1. Coffee paradox
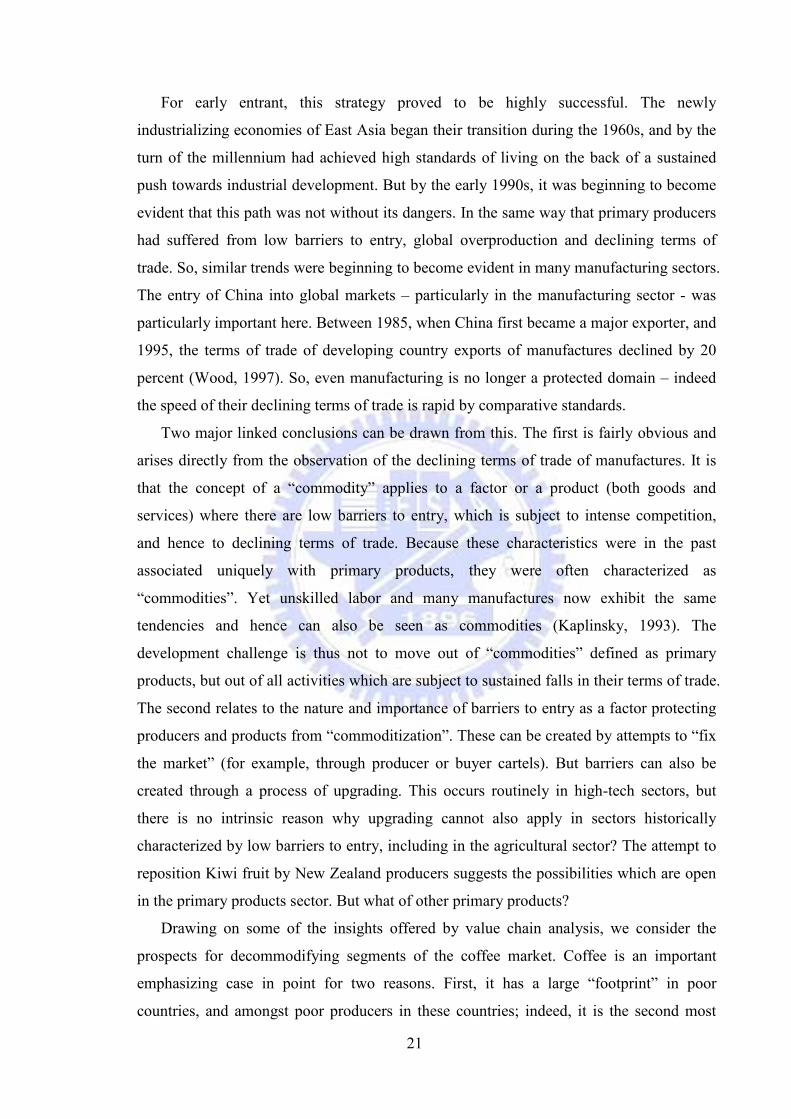
According to Benoit Daviron, Stefano Ponte, 2004, “coffee paradox is the coexistence
of a ‘coffee boom’ in consuming countries and of a ‘coffee crisis’ in producing countries”.
In their research, they raise the question: “Can developing countries trade their way out of
poverty? International trade has grown dramatically in the last two decades in the global
economy; and trade is an important source of revenue in developing countries. Yet, many
low-income countries have been producing and exporting tropical commodities for a long
time. They are still poor. The research is a major analytical contribution to understanding
commodity production and trade, as well as putting forward policy-relevant suggestions
for ‘solving’ the commodity problem.”
Through the study of the global value chain for coffee, the authors recast the
‘development problem’ for countries relying on commodity exports in entirely new ways.
They do so by analyzing the so-called coffee paradox – the coexistence of a ‘coffee boom’
in consuming countries and of a ‘coffee crisis’ in producing countries. New consumption
patterns have emerged with the growing importance of specialty, fair trade and other
‘sustainable’ coffees. In consuming countries, coffee has become a fashionable drink and
coffee bar chains have expanded rapidly. At the same time, international coffee prices
have fallen dramatically and producers receive the lowest prices in decades.
The coffee paradox exists because what farmers sell and what consumers buy are
becoming increasingly ‘different’ coffees. It is not material quality that contemporary
coffee consumers pay for, but mostly symbolic quality and in-person services. As long as
coffee farmers and their organizations do not control at least parts of this ‘immaterial’
production, they will keep receiving low prices. The Coffee Paradox seeks ways out from
this situation by addressing some key questions: What kinds of quality attributes are
combined in a coffee cup or coffee package? Who is producing these attributes? How can
part of these attributes be produced by developing country farmers? To what extent are
specialty and sustainable coffees achieving these objectives?
2. Coffee commodity value chain
This article analyzes the division of the total income and surplus generated along the
coffee commodity chain. Until the late 1980s, coffee growers and producing states

19
retained over a third of the total income and about half of the total surplus that was
available. This was due in part to the collective actions of coffee-producing states, which
led to the imposition of a regulatory regime involving export quotas, creating rents for the
producing countries. By the late 1980s, coffee TNCs had consolidated their control over
core markets, and began to use their market power to increase their shares of both income
and surplus. This shift was greatly accelerated by the breakdown of the export quota
regime in 1989. The article concludes that these results necessitate a reformulation of
commodity chain analysis
3. Global Value Chain
Central to the development challenge is the search for sustainable growth, for without
this, there is little prospect of meeting the physical, social and emotional needs of the
population. But growth in itself is not a sufficient – if it is unevenly distributed, and then
there may be little increase in welfare.
Recent experience in the global economy highlights the importance of these growth
and distributional issues. On the back of high growth rates associated with globalization,
670m people around the world moved out of conditions of “absolute poverty” between
1990 and 1998. That is, their incomes exceeded $1 per day (measured in 1985 purchasing
power parity consumption standards, which take account of living costs in different
countries). In historical terms this represents a major advance in human welfare. But there
has also been a downside to globalization. Despite the rise in living standards of many, the
numbers continuing to live in absolute poverty remain stubbornly large and unchanged, at
something over 1.2 billion. Moreover, there is overwhelming evidence that patterns of
income distribution within and between countries have become significantly more unequal.
There are essentially two (non-contradictory) ways of meeting these poverty-related
concerns. The first is through redistribution, intra-nationally and inter-nationally. Recent
experience in Europe illustrates how important this can be, since this is one of the few
regions where the distribution of consumption standards has not become markedly more
unequal in recent decades despite a worsening in the patterns with which incomes have
been distributed. This follows directly from social welfare programs introduced by
European governments (Förster and Pearson, 2000). The second path is more direct, and
involves enhancing the incomes earned by the poor.

20
From the perspective of poor countries, there is little evidence that the redistributional
path has been pursued successfully. In terms of the inter-national redistribution of income,
the last two decades have seen a weakening of income transfers. And very few developing
countries have the political and fiscal capacity to introduce structured programs of intra-
national income transfer. Hence, the key challenge is to take steps to directly enhance the
income-earning capacities of poor countries and poor groups in poor countries.
Globalization and integration into global product markets have become major
elements in this poverty-focused growth agenda. The East Asian economies and China
have illustrated how international specialization can provide for scale economies and help
producers and economies enter a virtuous circle of capability building. It has largely been
through this that so many people have been lifted out of absolute poverty. If the “losers”
in the globalization era had been confined to those who have been excluded from global
processes, then the policy conclusions would have been clear – enter the global economy
as rapidly as possible and take advantage of these economies of specialization. However,
the “losers” in recent decades include those producers who have participated in the global
economy, but who have done so in ineffective ways. The key challenge thus confronting
policy design and implementation is not whether to participate in global processes, but
how to do so in ways which provide for sustainable income growth.
This is of course not a new agenda. The way in which developing countries and poor
producers have entered the global economy, and the pattern of their global insertion, have
long been a focus of concern. It has now been conclusively shown that their adopted paths
of specialization in primary materials have been a major cause (and perhaps even a
consequence) of their low levels of income. This is because the terms of trade of these
primary products – the prices which they realize compared to the prices paid for
developing country manufactured imports – have systematically declined.
The observation of declining terms of trade and the recognition of what this implied
for developing economies goes back to the 1950s (Prebisch, 1950; Singer, 1950). From
this it was concluded that poor countries and poor producers should shift out of the
production of primary materials, industrialize and move into the production of
manufactures. Manufactures had characteristically been produced by high-income
countries and were the flip side of the declining terms of trade of primary product
producers. From this it was widely concluded that developing countries should
industrialize and become producers and exporters of manufactures.
21
For early entrant, this strategy proved to be highly successful. The newly
industrializing economies of East Asia began their transition during the 1960s, and by the
turn of the millennium had achieved high standards of living on the back of a sustained
push towards industrial development. But by the early 1990s, it was beginning to become
evident that this path was not without its dangers. In the same way that primary producers
had suffered from low barriers to entry, global overproduction and declining terms of
trade. So, similar trends were beginning to become evident in many manufacturing sectors.
The entry of China into global markets – particularly in the manufacturing sector - was
particularly important here. Between 1985, when China first became a major exporter, and
1995, the terms of trade of developing country exports of manufactures declined by 20
percent (Wood, 1997). So, even manufacturing is no longer a protected domain – indeed
the speed of their declining terms of trade is rapid by comparative standards.
Two major linked conclusions can be drawn from this. The first is fairly obvious and
arises directly from the observation of the declining terms of trade of manufactures. It is
that the concept of a “commodity” applies to a factor or a product (both goods and
services) where there are low barriers to entry, which is subject to intense competition,
and hence to declining terms of trade. Because these characteristics were in the past
associated uniquely with primary products, they were often characterized as
“commodities”. Yet unskilled labor and many manufactures now exhibit the same
tendencies and hence can also be seen as commodities (Kaplinsky, 1993). The
development challenge is thus not to move out of “commodities” defined as primary
products, but out of all activities which are subject to sustained falls in their terms of trade.
The second relates to the nature and importance of barriers to entry as a factor protecting
producers and products from “commoditization”. These can be created by attempts to “fix
the market” (for example, through producer or buyer cartels). But barriers can also be
created through a process of upgrading. This occurs routinely in high-tech sectors, but
there is no intrinsic reason why upgrading cannot also apply in sectors historically
characterized by low barriers to entry, including in the agricultural sector? The attempt to
reposition Kiwi fruit by New Zealand producers suggests the possibilities which are open
in the primary products sector. But what of other primary products?
Drawing on some of the insights offered by value chain analysis, we consider the
prospects for decommodifying segments of the coffee market. Coffee is an important
emphasizing case in point for two reasons. First, it has a large “footprint” in poor
countries, and amongst poor producers in these countries; indeed, it is the second most

22
important traded commodity. And, secondly, it is a product which has long been seen as
an undifferentiated “commodity”. Yet, as the Nestles Vice President for International
Relations points out, “the degree of variety of coffee and the variation in taste is at least as
great as that of wine”. Thus, coffee is a product with enormous potential for
differentiation. Some decades back substitute products such as wine and mineral water
were also marketed as relatively undifferentiated products, but are now sold as highly
differentiated lines, with significant premiums for specific products. Are we going to see
the same pattern emerging in the case of coffee? And, if so, who will reap the rewards of
price differentiation? Will it be the global branders (such as Krafts, Nescafe, Doewe
Egberts, Tchibo and Lavazza), global traders (such as Rothfos, E. D. and F. Mann,
Volcafe and Cargill), producer governments using export taxes, or will it be the growers?
And is it possible to identify policies which might help to ensure that some or all of these
decommodifying gains are reaped directly by poor producers rather than large TNCs?
Three elements of value chain analysis are relevant to this study of the coffee value
chain. The first is the mapping of inter-country input-output relations. The second is the
analysis of inter-country distributional outcomes, and the third is the role which value
chain analysis plays in highlighting the power and governance relations which explain
these distributional outcomes. These are complex issues and can only be considered in
outline within the confines of this paper Sections 3 and 4 cover respectively the historic
commodification and emerging decommodification of the coffee value chain.
4. Value added Agriculture
According to the research by MICHIGAN STATE UNIVERSITY, value added
agriculture is a process of increasing the economic value and consumer appeal of an
agricultural commodity. It is an alternative production and marketing strategy that
requires a better understanding of the rapidly changing food industry and food safety
issues, consumer preferences, business savvy, and team work.
In another research about “Adding value to Agriculture products”, David P. Anderson
and Charles R. Hall, The Texas A&M University, Texas Agrilife Extension say that
“Value added” means adding value to a raw product by taking it to, at least, the next stage
of production. This can be as simple as retaining ownership of your calves and wintering
them on wheat pasture or placing them in a feedlot. Value can be added through
membership in a cooperative that processes your products, such as a cooperative cotton

23
gin. Or, adding value may be as elaborate as going all the way to the consumer with a
“case-ready” food product. In the paper, they discuss about the definition of Value added,
customer value, which elements create value, steps to success in value added, ect…

24
Chapter 4: Methodology
In chapter one, the paper mentioned several issues of Viet Nam coffee industry. However,
in this chapter, the paper will focus and clarify the coffee paradox and coffee chain in Viet
Nam. From that we can have deeper discussion about what the problems that our coffee
industry is encountering, how to solve these problems.
In the paper, the data used are secondary data source from official websites. The content of
the data is about coffee production, export price, retail price, farm gate price, consumption…
These data are collected directly from the official websites as following:
ICO: ICO is the abbreviation if International Coffee Organization. The International
Coffee Organization’s comprehensive historical statistical data on coffee comprises
annual, quarterly, monthly and daily data from as far back as 1964 on exports, imports,
market prices, prices to growers, production, stocks and inventories. The value of its
unique database is recognized by market analysts, researchers and academics from
around the world, who frequently consult these data to formulate their technical papers,
econometric models and studies of the coffee market. In addition, coffee authorities
make particular use of ICO group indicator prices for payments to farmers in coffee
producing countries and the ICO data series is widely used by commodity experts in
government trade departments around the world to prepare their coffee statistical
reports. From ICO, data about production, export, retail price, domestic consumption,
consumption in developed countries are collected.
IPSARD is the abbreviation of Institute of Policy and Strategy for Agriculture and
Rural Development. IPSARD was established to improve quality of research and
information activities. IPSARD’s mission is providing the analysis and results
supporting strategy and policy formulation process in agriculture and rural
development. IPSARD provides the consumption per person/year.
VICOFA stands for VIETNAM COFFEE AND COCOA ASSOCIATION. VICOFA
provides the data about Farm gate and export price, production in Viet Nam.
General statistic division provides total export value from 2000 to 2008.
25
Based on the data collected from the above official websites, different methods are
used to analyze data to get the result. The main purpose of this part is to show the
value distribution along the value chain and value added activities. From that, coffee
paradox in coffee value chain can be observed better and direction for better
development of Vietnam coffee industry will be discussed.
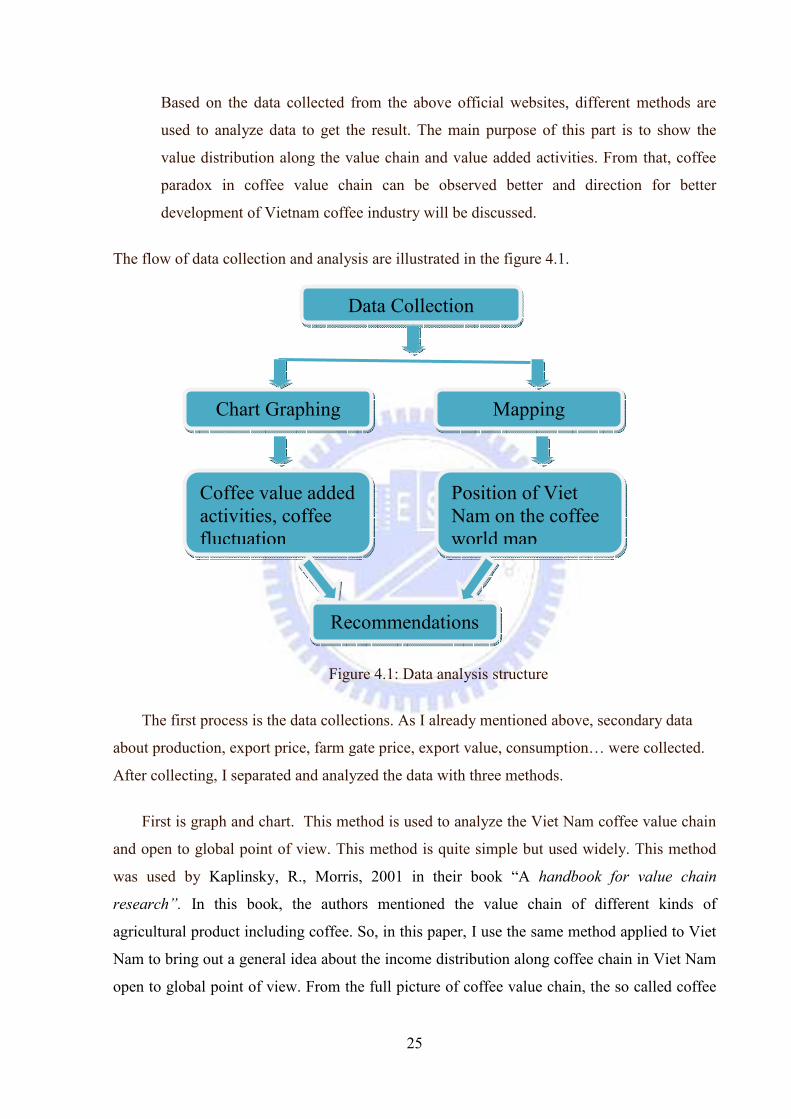
The flow of data collection and analysis are illustrated in the figure 4.1.
Figure 4.1: Data analysis structure
The first process is the data collections. As I already mentioned above, secondary data
about production, export price, farm gate price, export value, consumption… were collected.
After collecting, I separated and analyzed the data with three methods.
First is graph and chart. This method is used to analyze the Viet Nam coffee value chain
and open to global point of view. This method is quite simple but used widely. This method
was used by Kaplinsky, R., Morris, 2001 in their book “A handbook for value chain
research”. In this book, the authors mentioned the value chain of different kinds of
agricultural product including coffee. So, in this paper, I use the same method applied to Viet
Nam to bring out a general idea about the income distribution along coffee chain in Viet Nam
open to global point of view. From the full picture of coffee value chain, the so called coffee
Data Collection
Chart Graphing Mapping
Coffee value added activities, coffee fluctuation
Position of Viet Nam on the coffee world map
Recommendations
26
paradox will be observed more clearly: price booming in consuming countries and price crisis
in producing countries. What are the reasons for this situation?
The second method is mapping global coffee world. Coffee is grown in more than 50
countries in the world. Where is the position of Viet Nam in the coffee world map? Which
position Viet Nam wants to move to? With different data, different map can be drawn and
give different pictures of coffee world. However, in this paper, consumption will be the focal
point. High coffee consumption in developed countries and low domestic consumption will be
the second aspect of coffee paradox.
After finishing, I will analyze my data and further discussion and necessary
recommendation will be offered.
The first one is graphing and charting method. To have a deeper view about the coffee
paradox, one of the best approaches is to analyze the value distribution along coffee chain.
From the empirical evidence, coffee crisis has afflicted producing countries in the late 1990s
and 2000s, with farmers facing among the lowest prices in the century. This paradox already
existed before the coffee crisis. However, during the coffee crisis, it becomes more obvious.
The coffee crisis in producing countries has coexisted with a coffee revival in consuming
countries. The farmers are getting a decreasing share of final price paid by consumers for
coffee. This means that the value added along the chain takes place increasingly in consuming
countries. Consumers pay proportionally less for the material attributes of coffee quality and
more for their symbolic and in – person service attributes – including branding, packaging,
consumption ambience and sustainability content.
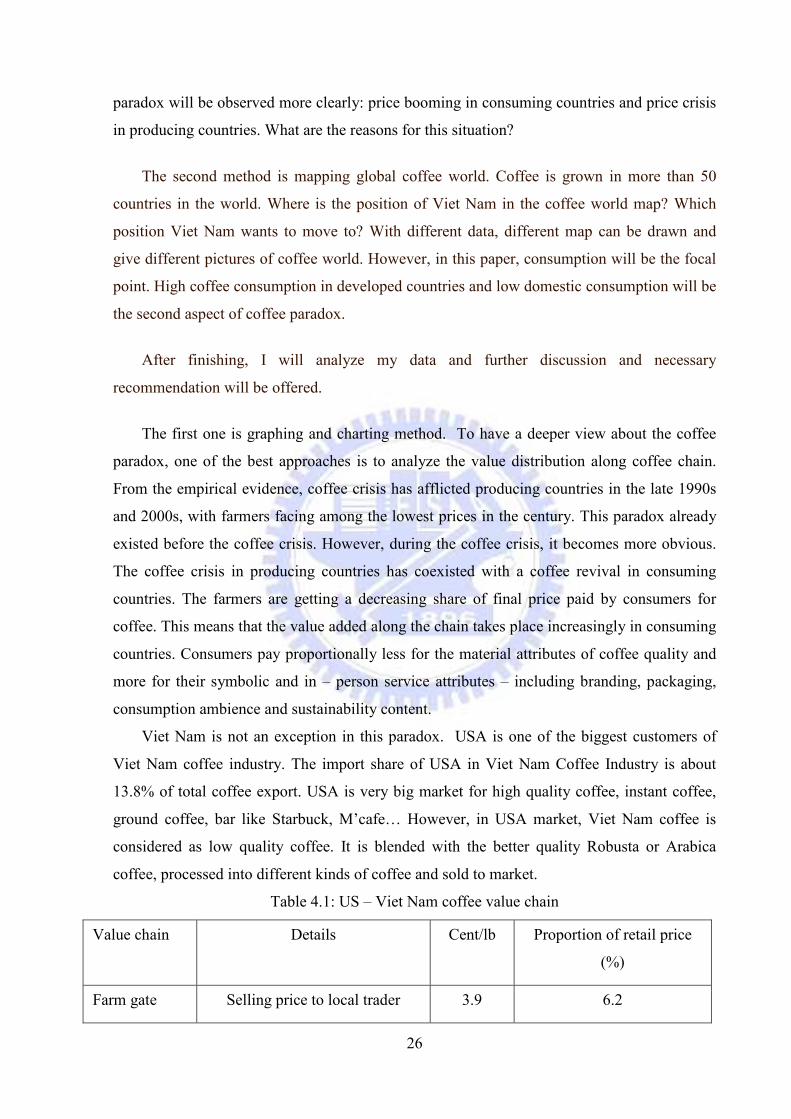
Viet Nam is not an exception in this paradox. USA is one of the biggest customers of
Viet Nam coffee industry. The import share of USA in Viet Nam Coffee Industry is about
13.8% of total coffee export. USA is very big market for high quality coffee, instant coffee,
ground coffee, bar like Starbuck, M’cafe… However, in USA market, Viet Nam coffee is
considered as low quality coffee. It is blended with the better quality Robusta or Arabica
coffee, processed into different kinds of coffee and sold to market.
Table 4.1: US – Viet Nam coffee value chain
Value chain Details Cent/lb Proportion of retail price
(%)
Farm gate Selling price to local trader 3.9 6.2

27
Export harbor FOB 4.4 7
Import harbor CIF 4.6 7.3
Roaster Selling price to the supermarket
chain
29 45.5
Retail Consumer price at supermarket 63 100
Source: VICOFA� 2009
Figure 4.2: Income distribution along USA and Viet Nam coffee value chain 2009
Table 4.1 and figure 4.2 present the income distribution along the coffee value chain
between Viet Nam and USA. The percentage calculated here show the percentage income of
different nodes over the retail price. Farm gate price represents only 6.2 percent of retail price.
Even at the CIF price, the proportion is also lower than 10%. What is presented here is just a
simplified picture of a complex series of transformations and passages. Between the farm gate
and the import point, Robusta coffee goes through the hands of various layers of traders,
processors and exporters. Coffee get hulled, transported, dried, sorted and prepared for export.
What we can see from the domestic market is that there is extreme competition at all level of
value chain and that net margin is very small. That shows in the relative small difference
between farm level and export price. More information is revealed in table 4.2 and figure 4.3.
0.00
10.00
20.00
30.00
40.00
50.00
60.00
70.00
Farm gate Export harbor Import harbor Roaster Retail
US cent/lbUSA - Viet Nam value chain
28
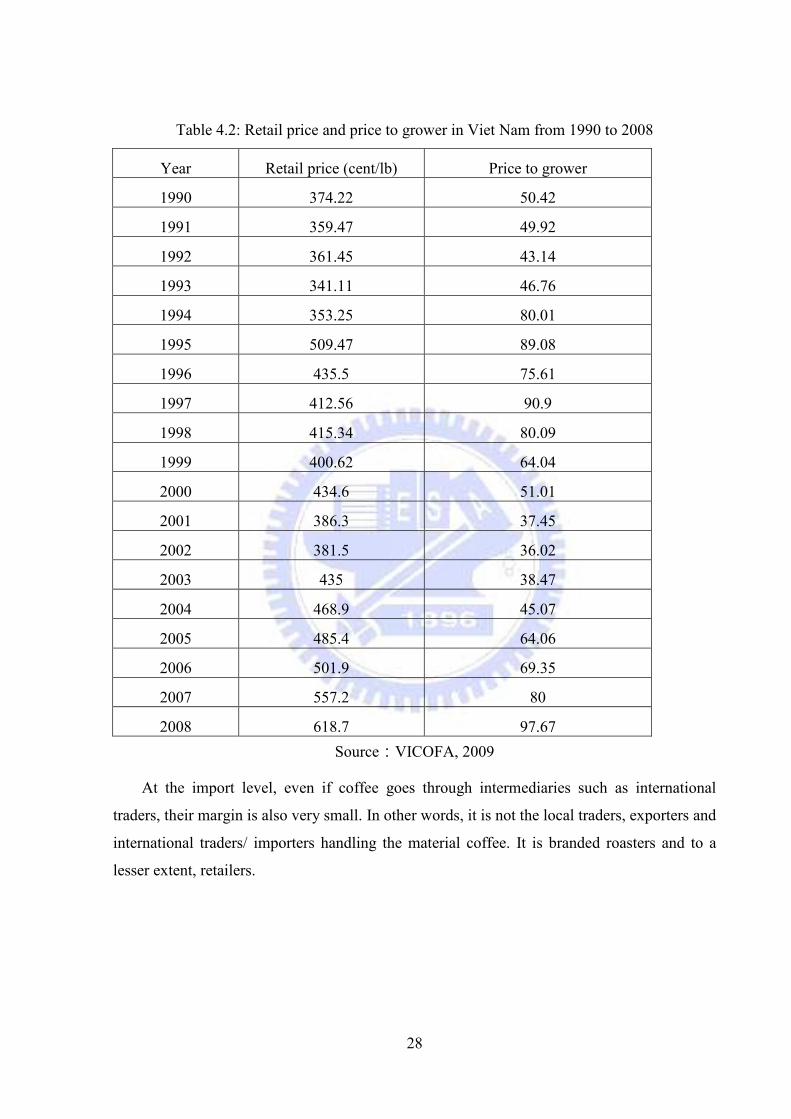
Table 4.2: Retail price and price to grower in Viet Nam from 1990 to 2008
Year Retail price (cent/lb) Price to grower
1990 374.22 50.42
1991 359.47 49.92
1992 361.45 43.14
1993 341.11 46.76
1994 353.25 80.01
1995 509.47 89.08
1996 435.5 75.61
1997 412.56 90.9
1998 415.34 80.09
1999 400.62 64.04
2000 434.6 51.01
2001 386.3 37.45
2002 381.5 36.02
2003 435 38.47
2004 468.9 45.07
2005 485.4 64.06
2006 501.9 69.35
2007 557.2 80
2008 618.7 97.67
Source�VICOFA, 2009 At the import level, even if coffee goes through intermediaries such as international
traders, their margin is also very small. In other words, it is not the local traders, exporters and
international traders/ importers handling the material coffee. It is branded roasters and to a
lesser extent, retailers.
29
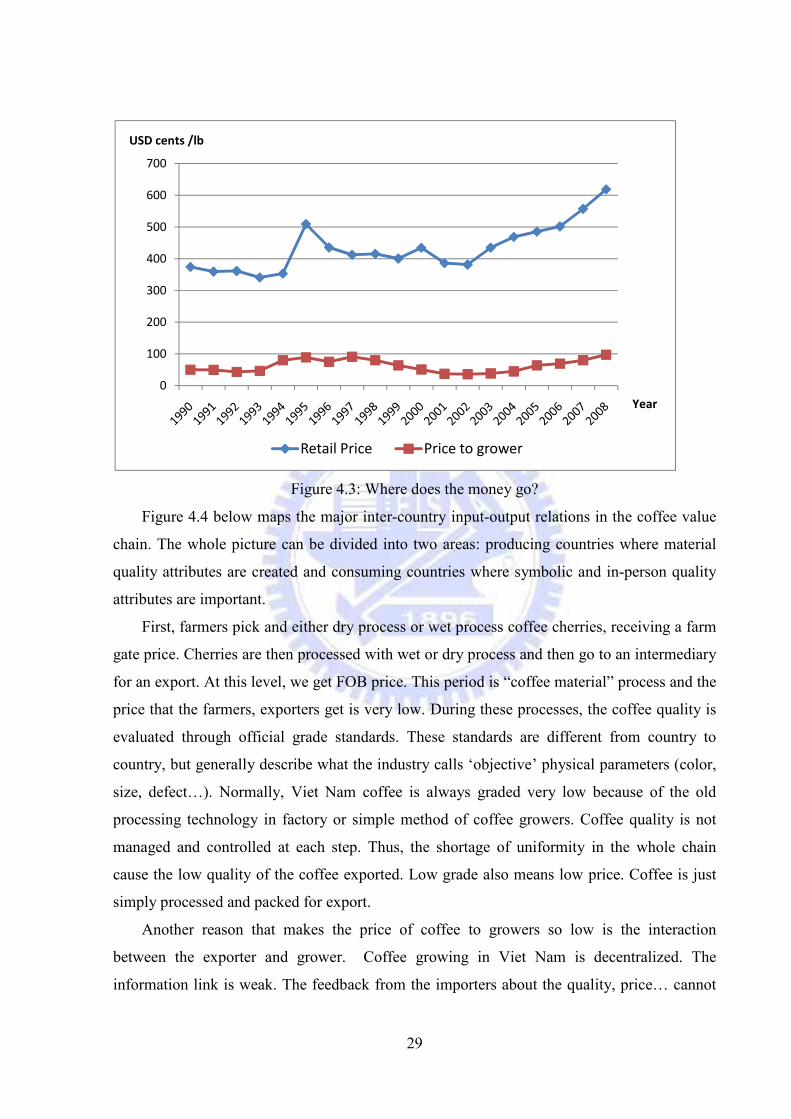
Figure 4.3: Where does the money go?
Figure 4.4 below maps the major inter-country input-output relations in the coffee value
chain. The whole picture can be divided into two areas: producing countries where material
quality attributes are created and consuming countries where symbolic and in-person quality
attributes are important.
First, farmers pick and either dry process or wet process coffee cherries, receiving a farm
gate price. Cherries are then processed with wet or dry process and then go to an intermediary
for an export. At this level, we get FOB price. This period is “coffee material” process and the
price that the farmers, exporters get is very low. During these processes, the coffee quality is
evaluated through official grade standards. These standards are different from country to
country, but generally describe what the industry calls ‘objective’ physical parameters (color,
size, defect…). Normally, Viet Nam coffee is always graded very low because of the old
processing technology in factory or simple method of coffee growers. Coffee quality is not
managed and controlled at each step. Thus, the shortage of uniformity in the whole chain
cause the low quality of the coffee exported. Low grade also means low price. Coffee is just
simply processed and packed for export.
Another reason that makes the price of coffee to growers so low is the interaction
between the exporter and grower. Coffee growing in Viet Nam is decentralized. The
information link is weak. The feedback from the importers about the quality, price… cannot
0
100
200
300
400
500
600
700
USD cents /lb
Year
Retail Price Price to grower

30
reach the growers. Thus, the growers have no concept of quality improvement or struggling
for higher price.
They are shipped to importing countries (landed at CIF prices). Importers then pass the
beans on at the wholesale price and roasters process the beans and sell them at the factory
door cost. In fact, the relation among these actors is much more complicated. But basically,
coffee goes through these steps. The final price is decided when coffee is sold to retail shop,
supermarket or goes to coffee bar. The price here is different.
Figure 4.4: Viet Nam and Global coffee value chain
Source�ICO and VICOFA, 2009 From the map, it is clear that most of the value added is generated by roasters. In coffee
processing, the process of roasting, blending, grinding and vacuum packing is relatively low
tech- operations. Thus, most value is generated in symbolic production. At the low end of the

31
market, symbolic production is mostly generated through branding and associated
promotional and advertising cost. In the bar consumption segment of the market, farmers fare
is even worse. In this segment, most of the value is added at the bar through brewing and the
offering of in – person services.
The value added along the coffee value chain plays a very important role in deciding the
price of coffee. In producing countries, coffee is traded and priced mainly in relation to its
material quality attributes. The evaluation of some of these attributes can only be carried out
in a rough manner of at the farm level.
Table 4.3: Production and consumption in developed and producing countries
Year Production Consumption in producing
countries �Thousand of bags� Consumption in developed
countries �Thousand of bags� 1990/91 93253 19697 70388
1991/92 101562 20413 74600
1992/93 97392 20938 74534
1993/94 91998 21595 78169
1994/95 93881 21801 72569
1995/96 86979 22757 74002
1996/97 103136 23501 76665
1997/98 99695 24327 76419
1998/99 108143 24540 78082
1999/00 130005 24695 80343
2000/01 113033 26375 79120
2001/02 107360 27559 81897
2002/03 122148 27758 82857
2003/04 103982 28650 84526
2004/05 115628 29999 88953
2005/06 110181 31468 88104
2006/07 127908 33337 90083
2007/08 118086 35320 92555
2008/09 128790 35074
Source �ICO, 2009 And the lack of information from the final consumption market makes it is difficult for them
to generate and control the value added activities like symbolic and in-person service
32
attributes. This partly explains the existence of coffee paradox in the coffee value chain in
Viet Nam. In consuming countries, coffee is sold packaged with symbolic and in person
service components, which value is firmly controlled by roasters, retailers and coffee bar
owners.
The second emphasis in coffee paradox is consumption. Viet Nam has been the second
largest export countries for more than 10 years. Every year Vietnamese coffee is imported by
over 40 countries and territories all over the world, including big markets as the USA,
Germany and EU member countries...However, with such a big annual production of over 10
million bags, much more attention should be paid to the issue of market expanding, both
domestically and in other potential markets.
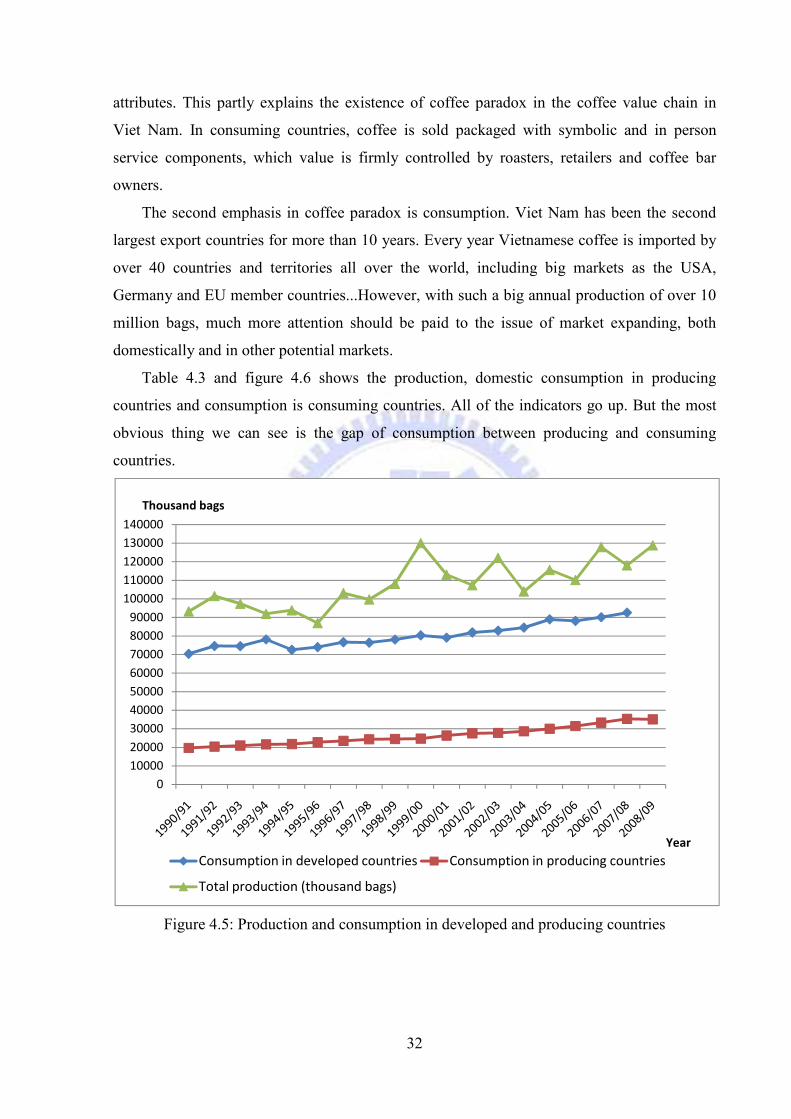
Table 4.3 and figure 4.6 shows the production, domestic consumption in producing
countries and consumption is consuming countries. All of the indicators go up. But the most
obvious thing we can see is the gap of consumption between producing and consuming
countries.
Figure 4.5: Production and consumption in developed and producing countries
0100002000030000400005000060000700008000090000
100000110000120000130000140000
Thousand bags
YearConsumption in developed countries Consumption in producing countries
Total production (thousand bags)
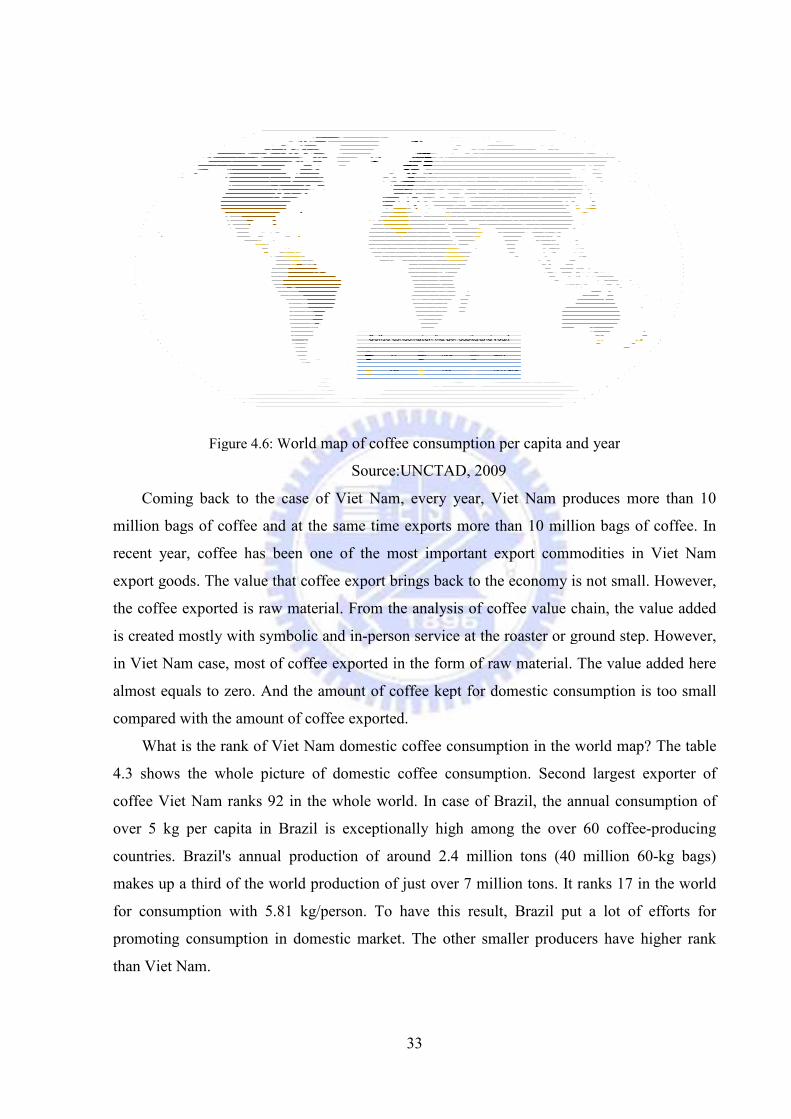
Figure 4.6: W
Coming back to the case of Viet Nam, every year, Viet Nam produces more than 10
million bags of coffee and at the same time exports more than 10 m
recent year, coffee has been one of the most important export commodities in Viet Nam
export goods. The value that coffee export brings back to the economy is not small.
the coffee exported is raw material. From the analy
is created mostly with symbolic and in
in Viet Nam case, most of coffee exported in the form of raw material. The value added here
almost equals to zero. And
compared with the amount of coffee exported.
What is the rank of Viet Nam domestic coffee consumption in the world map? The table
4.3 shows the whole picture of domestic coffee consumption.
coffee Viet Nam ranks 92 in the whole world.
over 5 kg per capita in Brazil is exceptionally high
countries. Brazil's annual production of
makes up a third of the world
for consumption with 5.81 kg/person.
promoting consumption in domestic
than Viet Nam.
33
Figure 4.6: World map of coffee consumption per capita and year
Source:UNCTAD, 2009
Coming back to the case of Viet Nam, every year, Viet Nam produces more than 10
million bags of coffee and at the same time exports more than 10 million bags of coffee. In
recent year, coffee has been one of the most important export commodities in Viet Nam
export goods. The value that coffee export brings back to the economy is not small.
the coffee exported is raw material. From the analysis of coffee value chain, the value added
is created mostly with symbolic and in-person service at the roaster or ground step. However,
in Viet Nam case, most of coffee exported in the form of raw material. The value added here
almost equals to zero. And the amount of coffee kept for domestic consumption is too small
compared with the amount of coffee exported.
What is the rank of Viet Nam domestic coffee consumption in the world map? The table
4.3 shows the whole picture of domestic coffee consumption. Second largest e
coffee Viet Nam ranks 92 in the whole world. In case of Brazil, the annual consumption of
capita in Brazil is exceptionally high among the over 60 coffee
countries. Brazil's annual production of around 2.4 million tons (40 million 60
makes up a third of the world production of just over 7 million tons. It ranks 17 in the world
for consumption with 5.81 kg/person. To have this result, Brazil put a lot of efforts for
promoting consumption in domestic market. The other smaller producers have higher rank
orld map of coffee consumption per capita and year
Coming back to the case of Viet Nam, every year, Viet Nam produces more than 10
illion bags of coffee. In
recent year, coffee has been one of the most important export commodities in Viet Nam
export goods. The value that coffee export brings back to the economy is not small. However,
sis of coffee value chain, the value added
person service at the roaster or ground step. However,
in Viet Nam case, most of coffee exported in the form of raw material. The value added here
the amount of coffee kept for domestic consumption is too small
What is the rank of Viet Nam domestic coffee consumption in the world map? The table
Second largest exporter of
he annual consumption of
among the over 60 coffee-producing
s (40 million 60-kg bags)
t ranks 17 in the world
Brazil put a lot of efforts for
The other smaller producers have higher rank

34
This is the fact that all the coffee planners and specialists have discussed for many years.
It is true that Viet Nam culture is tea culture. It is true that coffee is considered as a high class
or luxury drink. But the situation changed now. Compared with the living standard 5 years
ago, there is much improvement. Income increased from $200 to $800 and the percentage of
city dweller also goes up. Viet Nam population is 86 million and half of the population is
labor force. These elements are necessary for the domestic coffee consumption.
What is the cause of low domestic consumption in Viet Nam? The reasons can be chased back
to the issue part of Viet Nam coffee industry.
Table 4.3: Coffee domestic consumption among producing countries:
Country coffee consumption per capita
(kg)
World rank
Brazil 5.81 17
Honduras 3.9 32
Costa Rica 3.8 33
Dominican Republic 2.3 51
Nicaragua 2.0 54
El Salvador 1.9 55
Columbia 1.8 58
Guatemala 1.3 68
Ethiopia 1.3 69
Mexico 1.2 72
Gambia 1.1 77
Viet Nam 0.7 92
Philippines 0.7 92
Indonesia 0.5 104
Source�Wikipedia 2009
Viet Nam coffee domestic market can be divided into two parts: Home market and shop
or restaurant market. In home market section, as the paper already mentioned above, coffee is
considered as high class or luxury drink in Viet Nam. The culture of tea has existed in Viet
Nam for thousands of years. So it is impossible to change this habit in a short time.
Furthermore, the types of coffee in Viet Nam market are very poor. Ground coffee occupies
2/3 market and 1/3 left is instant coffee. Ground market is not convenient to make at home.
That’s why ground coffee is not very welcome by households. Instant coffee is more suitable

35
for household. However, people do not have many choices. The reason of this situation is
investment in coffee processing is still very humble and the price of coffee machine is too
high to equip at home.
In shop or restaurant (in-person service) market section, coffee consumption has some
achievements. The appearance of some big companies with some coffee chain store is a big
step in coffee industry. The target customers of these shops are the young generation with
high income and open mind. The good sign we can see here is drinking coffee is becoming a
fashion trend among youth. However, what is achieved in this section is still not adequate to
the industry’s potential. Even though the coffee shops appear more and more and more, the
variety of coffee products is still limited. Coffee types just limit at coffee with fresh milk,
condensed milk, iced coffee… Until now, we still do not have the take away coffee service.
This market section still waits for domestic investors to explore.
In the above part, we already discussed about the domestic consumption. In this part, the
paper will go into detail about the consumption again but in relation with the production. In
the interrelation with coffee production, where is the position of Viet Nam on the world map?
The table 4.4 shows the coffee indicators in producing countries. Among more than 50 coffee
producing countries, 25 countries’ coffee data is collected.
Table 4.4: Countries’ coffee indicators in 2008
Country Production
( thousand bags)
Domestic consumption (DC)
(Thousand bags)
DC/Production
(%)
Angola 36 30 83.3
Brazil 36070 17125 47.5
Cameroon 795 69 8.7
Central African Republic 53 19 35.8
Columbia 12515 958 7.7
Congo, Dem. Rep. of 416 200 48.1
Costa Rica 1791 274 15.3
Dominican Republic 465 378 81.3
Côte d'Ivoire 2150 317 14.7
Ecuador 1110 150 13.5
Ethiopia 4906 2100 42.8
36
Source: ICO, 2009
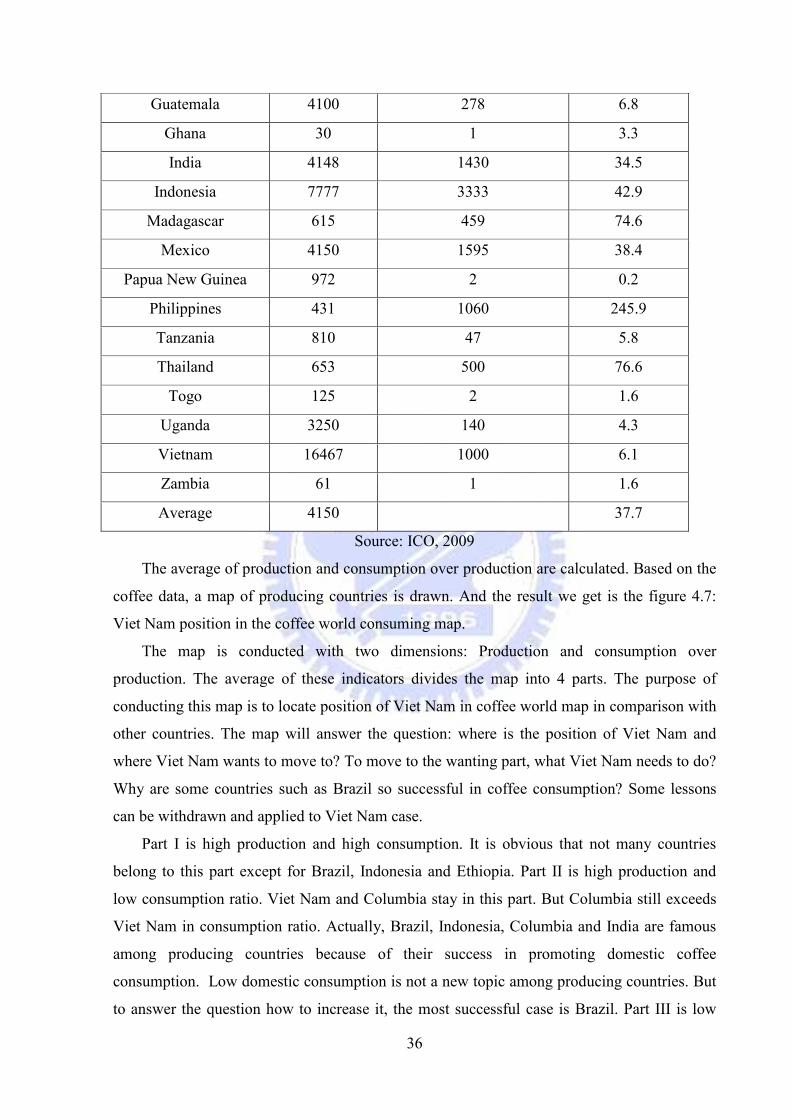
The average of production and consumption over production are calculated. Based on the
coffee data, a map of producing countries is drawn. And the result we get is the figure 4.7:
Viet Nam position in the coffee world consuming map.
The map is conducted with two dimensions: Production and consumption over
production. The average of these indicators divides the map into 4 parts. The purpose of
conducting this map is to locate position of Viet Nam in coffee world map in comparison with
other countries. The map will answer the question: where is the position of Viet Nam and
where Viet Nam wants to move to? To move to the wanting part, what Viet Nam needs to do?
Why are some countries such as Brazil so successful in coffee consumption? Some lessons
can be withdrawn and applied to Viet Nam case.
Part I is high production and high consumption. It is obvious that not many countries
belong to this part except for Brazil, Indonesia and Ethiopia. Part II is high production and
low consumption ratio. Viet Nam and Columbia stay in this part. But Columbia still exceeds
Viet Nam in consumption ratio. Actually, Brazil, Indonesia, Columbia and India are famous
among producing countries because of their success in promoting domestic coffee
consumption. Low domestic consumption is not a new topic among producing countries. But
to answer the question how to increase it, the most successful case is Brazil. Part III is low
Guatemala 4100 278 6.8
Ghana 30 1 3.3
India 4148 1430 34.5
Indonesia 7777 3333 42.9
Madagascar 615 459 74.6
Mexico 4150 1595 38.4
Papua New Guinea 972 2 0.2
Philippines 431 1060 245.9
Tanzania 810 47 5.8
Thailand 653 500 76.6
Togo 125 2 1.6
Uganda 3250 140 4.3
Vietnam 16467 1000 6.1
Zambia 61 1 1.6
Average 4150 37.7

production and low consumption. Most of small producing countries drop in this section. And
the last part IV is high consumption rate and low production. The most outstanding country is
Philippines. The reason of this situation is the influence of long time USA colony system in
Philippines.
Figure 4.7: Viet Nam position in the coffee world
The map gives a better vision and understanding about the position of Viet Nam among
other producing countries. Among producing countries, there are successful countries in both
producing and consumption, there are unsuccessful ones. The paper
of successful countries in producing and consumption such as Brazil, Indonesia
own experiences in producing and promotion. A
withdrawn and applied to unsuccessful countries.
In the map, it is obvious to see that the most outstanding country is Brazil.
about 40% is for domestic market and 60% is for export. Brazil is a country with big
population. Brazil is the colony of Portugal for hundreds of year. Somehow, the lifestyle
which is connected to coffee is one the heritage from Po
character in this coffee land. This is a big advantage of this country. However, in addition to
this good advantage, Brazil government and coffee organizations als
action in promoting coffee consumption.
promotion campaign to make Brazilian aware of the coffee existence as well as to enforce the
coffee culture in citizen’s mind.
37
production and low consumption. Most of small producing countries drop in this section. And
V is high consumption rate and low production. The most outstanding country is
Philippines. The reason of this situation is the influence of long time USA colony system in
Viet Nam position in the coffee world consuming
The map gives a better vision and understanding about the position of Viet Nam among
other producing countries. Among producing countries, there are successful countries in both
producing and consumption, there are unsuccessful ones. The paper specifies
of successful countries in producing and consumption such as Brazil, Indonesia
own experiences in producing and promotion. And from the analysis, a lot of lessons can be
unsuccessful countries.
it is obvious to see that the most outstanding country is Brazil.
about 40% is for domestic market and 60% is for export. Brazil is a country with big
population. Brazil is the colony of Portugal for hundreds of year. Somehow, the lifestyle
ch is connected to coffee is one the heritage from Portugal. Drinking coffee is one cultural
character in this coffee land. This is a big advantage of this country. However, in addition to
this good advantage, Brazil government and coffee organizations also have taken a lot of
action in promoting coffee consumption. Brazil government has taken out a lot of coffee
promotion campaign to make Brazilian aware of the coffee existence as well as to enforce the
coffee culture in citizen’s mind.
production and low consumption. Most of small producing countries drop in this section. And
V is high consumption rate and low production. The most outstanding country is
Philippines. The reason of this situation is the influence of long time USA colony system in
consuming map
The map gives a better vision and understanding about the position of Viet Nam among
other producing countries. Among producing countries, there are successful countries in both
specifies some examples
of successful countries in producing and consumption such as Brazil, Indonesia with their
nd from the analysis, a lot of lessons can be
it is obvious to see that the most outstanding country is Brazil. In Brazil,
about 40% is for domestic market and 60% is for export. Brazil is a country with big
population. Brazil is the colony of Portugal for hundreds of year. Somehow, the lifestyle
rtugal. Drinking coffee is one cultural
character in this coffee land. This is a big advantage of this country. However, in addition to
o have taken a lot of
Brazil government has taken out a lot of coffee
promotion campaign to make Brazilian aware of the coffee existence as well as to enforce the
38
Brazilian coffee domestic consumption continued to expand sharply. From November
2006 to October 2007, Associacao Brasileira da Industria de Coffee (ABIC) – a coffee
association in Brazil recorded a 17.1 million bag consumption, representing a 4.74% increase
in relation to the same period (Nov 2005 - Oct 2006), when the volume had been 16.3 million
bags. The consumption by inhabitant/year (per capita) was 5.53 kg of green coffee or 4.42 kg
of roasted coffee, almost 74 liters a year for each Brazilian citizen, or a 3.5% increase in
relation to 2006 (against 4.5% in the prior period), which confirms what was evidenced by the
research performed by InterScience that individuals are consuming more cups of coffee a day.
With this result, Brazil maintains an important position in the world scenario of the coffee
agribusiness, since it is one of the countries where domestic coffee consumption growth is
expanding the most. This is one of the most effective forms of giving sustainability to world
coffee production, therefore not allowing any coffee bean surpluses, which would make
coffee quotes drop to prices that would not adequately remunerate the coffee productive chain
agents.
The reason for this high consumption and consumption expansion in Brazil is a series of
consistent and long lasting factors. The first one is “Continuous improvement of the quality of
coffee” offered to consumers, which increased with the Coffee Quality Program (Programa
da Qualidade do Café - PQC), launched by ABIC at the end of 2004, and that currently
already certifies over 250 brands Brazilwide. In 2008, PQC is complemented with the
Sustainable Coffee Program of Brazil (Programa Cafés Sustentáveis do Brasil), which offers
a complete certification guarantee, from growing to the cup, to sustainably produced coffees.
Furthermore, the coffee shops now have a qualification program, the Quality Coffee Circle
(Círculo do Café de Qualidade - CCQ), with which ABIC wants to stimulate coffee
consumption away from home, always with the best quality. The second reason is
Consolidation of the Gourmet or Specialty coffee markets, and expansion of the away from
home consumption, that are increasingly attracting more attention, interest and curiosity
among consumers. Significant improvement in the perception of coffee regarding its benefits
to health, as a result of large investments in the Coffee and Health Program supported by the
whole agribusiness and better economic conditions in Brazil are the other reasons for coffee
consumption expansion in recent years.
Furthermore, investment in Advertising and Promotion also show its efficiency in
ensuring coffee consumption. In 2007, coffee companies expanded their investments in
marketing and advertising. Large companies made major campaigns in several medias

39
investing more than R$50 million. ABIC invested R$630,000 of its Marketing Fund in
additional institutional actions.
From the case of Brazil, it is clear that coffee consumption expansion requires the
cooperation among players including governments, coffee growers, companies and consumers.
Brazil is a very successful case for Viet Nam to study.
Position of Viet Nam on the map is part II. In comparison with other countries in part II,
Viet Nam leads in coffee producing but not in consumption. Viet Nam coffee industry\s
leaders and organization acknowledge this fact and they are trying to improve the situation.
The direction that Viet Nam coffee industry wants to move to is Part I. However, how to
move to that part? How to increase the consumption in domestic market are the questioned
that Viet Nam coffee industry is still stuck in. A lot of recommendations have been given and
trial programs have been carried out to enhance the situation. These recommendations cover
all aspects from quality improvement, sustainable producing structure, marketing effort to
changing organizational structure. These recommendations will be suggested and discussed in
more detail.

40
Chapter 5: Recommendations for a stable development
of Viet Nam coffee industry
1. Quality improvement
Quality improvement needs to be improved through the whole chain of coffee from
growers to exporters. Coming back to the methodology, in the part of Viet Nam coffee
industry value chain, the paper already analyzed the problems of the whole value chain in
detail.
We firstly need to complete and put into force the set of Vietnam Coffee Standards in
accordance with the International Standards, market demands and in order to protect the
interests of Vietnam coffee industry. A set of coffee standards started to be set up in 1983, and
in 1987 it is approved and issued by the State with Coffee Terminologies and Definitions,
Export Coffee Technology Standards, and standards on packaging, labeling, storing,
transporting... By now there have been some amendments and supplements but it is still
necessary that we take completion steps before it can be issued officially and can be referred
to in every coffee contracts. The Standards will be the common direction for all coffee players
to reach the last purpose: high quality coffee. And all the coffee involvers must apply that
regulation in the progress of coffee process.
The technique of coffee harvesting, drying, processing and storing etc should also be
improved. Vietnam Government is now considering to approve a project on processing the
whole Vietnam coffee industry. Government through the national bank will make it easy for
coffee growers, processors, exporters to access the credit source. So the investment in
technology will be paid more attention to.
It is necessary to do researches to transfer advanced technologies to farmers with GAP and
GMP methods; as well as research on preventing mould formation, especially Ochratoxyn A.
2. Sustainable coffee structure in producing
Vietnamese climatic conditions enable to grow both Robusta and Arabica coffee trees in
some respective areas. The figure of Vietnam, with the mainland stretches along the meridian
of above 150 north latitude, creates favorable conditions for growing Robusta coffee in the
southern hot and humid climate and Arabica in the northern mountainous moderate climate
and somewhere of about 800 - 900 meters height of sea level in the south. In fact, the

41
steadiness of Robusta coffee trees in Vietnam has been proved for many years. Climatic
conditions such as high temperature and heavy rainfall in the Central Highlands enable
Robusta coffee trees to grow fast and produce high yields if it is watered in the dry season
which also the time for flowering and fruiting.
Robusta coffee development in Vietnam, the potential of the fertile red basalt soil has
been exploited. Labor is abundant and weather conditions are hot with a humid tropical
climate. As a matter of course, it is necessary to take into consideration the relationship
between Robusta coffee areas and water capacity.
There are many huge unexploited areas in the highlands in Vietnam, especially in the
North and North West of Vietnam where the climate is more moderate and would be suitable
for Arabica coffee.
In the last few years, Vietnam coffee growers expand their coffee plantations in a
spontaneous way without complying with Government’s guidelines and plans. Robusta coffee
is grown everywhere possible, from hillsides to hilltops. And Robusta is chosen since they
find Arabica coffee growing need more seedlings but not as resistant to diseases, so require
more investment, more cares and more complicated processing method. That’s the reason for
the poorness of Vietnam coffee product.
In order to cope with market changes both in the long-term and short-term, Vietnam coffee
industry has carried out studies for the adjustments on area, production, and Robusta-Arabica
proportion structure to the whole industry. All the new plantations outside the planned area
with unsuitable soil and hydrographic conditions and with weak growing, low productivity
will be erased. Robusta plantations in places better suitable for Arabica will be replaced by
Arabica. It is still encouraged to develop Arabica coffee in suitable places as middle lands and
mountainous areas in the North. After some years investigating Vietnam, several prospective
and well-developed Arabica coffee areas have been formed. Such are North West areas,
mainly in Dien Bien and Son La. The belt of land in the Central as in Phu Quy of Nghe An
province, Khe Sanh of Quang Tri province and A Luoi of Thua Thien Hue province. In the
South, Gia Lai, M’Drak, Dak Nong, Lam Dong and especially famous Da Lat city should be
mentioned. The Bourbon coffee has good quality and is praised by drinkers. The aromatic
flavor of Bourbon can also be compared with mild coffee in the Central America.
Therefore, in the next few years Vietnam will have around 300,000 to 400,000 ha under
Robusta coffee and around 100,000 ha under Arabica. The total production will then be
around 600,000 tons equal to 10 million bag in which 7.5 million bags of Robusta and 2,5

42
million of Arabica. The remaining cultivation land in coffee areas will be used for pepper,
fruit trees etc. depend on conditions of each area.
During such adjustment we need also take much care of high value products as organic
coffee, specialty coffee and gourmet coffee etc. As regard to our traditional export coffee,
Vietnam has long been exporting solely green coffee. So we should make some adjustments
to produce more of other value added products as soluble coffee and roasted coffee etc.
Such policy is very correct and necessary that the key policy of Vietnamese coffee
industry is to reduce itself both coffee areas and coffee production. Annually, Vietnamese
coffee industry only supplies a reasonable amount with high quality of green coffee to the
market to meet consumers’ demand. This is the orientation of Vietnamese coffee industry to
integrate the world coffee market.
3. Domestic consumption and marketing effort
Domestic consumption of coffee should be promoted and concerned. Currently, only 5%
of coffee produced is consumed in domestic market, 95% is exported. It also means that the
coffee market in Viet Nam depends too much on the foreign customers. So to create a stable
market for the coffee industry, domestic market is a good choice. Brazil and Indonesia are
good example for us to see. According to a coffee report from Indonesia, 33% of coffee is
consumed in local market, 67% is exported. And in Brazil case, about 40% is for domestic
market and 60% is for export.
To learn the lessons from Brazil, Colombia, Indonesia and India, it is necessary to have a
program for promoting coffee consumption in Vietnam; priority encourages home consumers
consuming more than one million bags of coffee every year. Conferences, exhibitions are
organized. Books, documents and newspapers are published to introduce subjects related to
coffee and health, encourage people to drink more coffee, etc… These works are required
much of time and efforts.
Vietnam has a population of approximately 86 million people and the per head
consumption capacity is merely of 0.5kg/head/year. With a promotion program conformable
to the normal income of the people, Vietnam is managing to achieve the average capacity of 1
kg/head/year. In the next few years, with the total population increases to 100 million people,
the total domestic consumption is estimated at 100.000 tons. The remaining 500.000 tons of
Vietnam annual production will be for exports. With this strategy, Vietnam is striving to
contribute to harmonize the coffee supply-demand balance.

43
Another concern that Viet Nam Government as well as all coffee producers and growers
are bothered with is building a trademark for Viet Nam coffee. Coming back with the coffee
value chain, the value added is not at “material producing” period. In person service or
symbolic are the main value added along the chain. Coffee growers and processors are aware
of the importance of produce high quality products, high value added products, change the
habit of consumers and a sustainable trademark for Viet Nam coffee. Instead of producing
coffee bean only, more investment is put in coffee roasting and processing. The appearance of
more coffee products under different company brands on the market is a good signal. It
diversifies the consumers’ choice. Going around supermarket chain, it is easy to find so many
kinds of instant coffee: G7, Coffee moment, Vinacafe, Ca Phe Buon Ma Thuot, Ca phe Dak
Lak, coffee Trung Nguyen… or ground coffee with the famous brand Trung Nguyen.
In the higher quality class market section, going around big cities with high income and
open culture environment like Ha Noi, Ho Chi Minh, coffee shop appears everywhere, in
every small alley to big shopping mall. The appearance of Trung Nguyen Caphe ignites the
new era for Viet Nam coffee in domestic market. Following Trung Nguyen coffee success, a
lot of coffee shop chains come up. Typical are Nang Sai Gon, New Window, Buon Me
Thuot… The slogan which is correct for this time is: Where Viet Namese people live, where
you can find Viet Nam Coffee. Viet Nam domestic coffee is prospering now.
Viet Namese people migrate to other countries like USA, France, and Australia… are very
proud of Viet Nam coffee. It is easy to enjoy one cup of coffee outside Viet Nam border. It is
a good beginning for coffee traders who want to promote Viet Nam coffee to the outside
world.
Establishing a trademark is a long process requiring much effort of sectors and industries. It is
strongly believed that ‘Viet Nam’ coffee trademark will become popular in the coming years.
4. Co-operative organization
It is the right time to think of setting up co-operative organizations for coffee specialty
including people together to produce coffee product in order to help the farmers to do their
services of input and output, etc,… to set up and co-ordinate producing process, not to earn
benefit from such services but benefit from collective activities.
Co-operative of specialty would also develop spontaneous network for agricultural
extension, create favorable conditions to transfer advanced technology to production. This is a
44
new type of co-operative which helps farmers approach and accesses the market as well as
specializes and professionalizes in production.
As a matter of course, to set up such co-operative, the Government should have sponsor
fund and programs combining application of new technology with building co-operatives of
specialty. Therefore, the coffee industry could overcome individual farmers’ shortcomings,
farmers are linked together to participate in the market; enhance competitiveness of
Vietnamese coffee producers.
45
Reference
1. Behrens, B., Dembski, N. and Georg Müller-Christ, (2006). “Bastian Behrens, Nadine
Dembski, and Georg Müller-Christ ”
2. Born, H. and Bachmann, J., (2006). “Adding Value to Farm Products: An Overview ”,
ATTRA Publication #IP141
3. Daviron, B. and Ponte, S. (2005). “The coffee paradox “
4. Doan, T.N., (2005). “Vietnamese Coffee Industry after 5 Years’ Crisis and it’s Future
Orientation ”, 2nd World Coffee Conference, Salvador, Brazil
5. ICO workshop, (2009). “Towards Sustainable Coffee Production”, Turkey
6. IPSARD, (2007). “Viet Nam coffee profile”
7. Kaplinsky, R., Morris, M. 2001). “Who gains from product rents as the coffee market
becomes more differentiated? A value chain analysis”, IDS Bulletin Paper 2001
8. Kaplinsky, R., Morris, M. 2001: A handbook for value chain research.
9. Lewin, B., Giovannucci, D. and Varangis P., (2004). “Coffee Markets: New
Paradigms in Global Supply and Demand”
10. Marsh, A., (2007). “Diversification by smallholder farmers: Viet Nam Robusta
Coffee”, FAO
11. Osorio, N., (2005). “Action to avoid further coffee price crisis”, G-8 Summit,
Gleneagles, Scotland
12. Patrick de Fontenay and Leung, S., (2002)“Managing commodity price fluctuations in
Vietnam's Coffee Industry”, International and Development Economics idec02-4
13. Talbot, J.M. (2004). “Grounds for Agreement. The political Economy of the Coffee
Commodity Chain”, Boulder, New York, Toronto, London: Rowman & Littlefield
Publishers
14. Tuck School of Business at Dartmouth, (2002). “Starbucks Coffee Company”
15. Tuvhag, E., (2008). “A Value Chain Analysis of Fairtrade Coffee”, Lund University