Thesis Proposal Supply Chain Management in Humanitarian...
109
M.Sc. in Management, University of Ottawa Mingli Liu University of Ottawa Faculty of Graduate and Post-Doctoral Studies Master’s Program in Management Thesis Proposal Supply Chain Management in Humanitarian Aid and Disaster Relief Student Name: Mingli Liu Student Number: 6836114 Thesis Supervisor: Professor Daniel E. Lane Telfer School of Management University of Ottawa October 2013
Transcript of Thesis Proposal Supply Chain Management in Humanitarian...
M.Sc. in Management, University of Ottawa Mingli Liu
University of Ottawa
Faculty of Graduate and Post-Doctoral Studies
Master’s Program in Management
Thesis Proposal
Supply Chain Management in Humanitarian Aid and
Disaster Relief
Student Name: Mingli Liu
Student Number: 6836114
Thesis Supervisor: Professor Daniel E. Lane
Telfer School of Management
University of Ottawa
October 2013
M.Sc. in Management, University of Ottawa Mingli Liu
1
Abstract
Humanitarian aid and disaster relief are delivered in times of crises or disasters, such as after
a conflict or in response to a tsunami. Different from regular aid programs of a country, they
are sent to fix local areas and repatriate refugees in pace with sudden events instead of
dealing with systemic problems of global poverty or inequality.
There is evidence that a growing number of natural and man-made disasters happen all
around the world, affecting hundreds of millions of people every year. In spite of this fact,
only in these years starting from 2005 has supply chain management for humanitarian aid and
disaster relief been a topic of interest for researchers. Consequently, the academic literature in
this field is comparatively new and still sparing, indicating a requirement for more academic
studies in this field.
The purpose of this proposal is to develop a conceptual framework for supply chain
management in humanitarian aid and disaster relief. In particular, the focus includes two
specific aspects during preparedness phase: inventory prepositioning and transportation
planning. In addition, the research proposes and analyzes how to put an effective supply
chain management framework into practice to help Canadian communities improve their
performances of relief efforts.
Keywords: supply chain management, humanitarian aid and disaster relief, conceptual
framework development, inventory prepositioning, transportation planning, linear
programming model, Canadian communities
M.Sc. in Management, University of Ottawa Mingli Liu
2
Table of Contents
Abstract ................................................................................................................................................... 1
1. Introduction ......................................................................................................................................... 6
1.1. Research Background and Motivation .................................................................................. 6
1.2. Research Questions and Objectives....................................................................................... 9
1.3. Plan of the Proposal ............................................................................................................. 10
2. Literature Review .............................................................................................................................. 11
2.1. Disaster Management .......................................................................................................... 12
2.1.1. Disaster Types ..................................................................................................................... 12
2.1.2. Disaster Phases .................................................................................................................... 13
2.1.3. Operations Research in Disaster Management .................................................................... 15
2.2. Supply Chain Management ................................................................................................. 16
2.2.1. Performance Measurement .................................................................................................. 17
2.2.2. Critical Successful Factors .................................................................................................. 20
2.2.3. Inventory Management ........................................................................................................ 24
2.2.4. Transportation Management ................................................................................................ 27
2.3. Humanitarian Aid and Disaster Relief Supply Chain Management .................................... 29
2.3.1. Performance Measurement .................................................................................................. 30
2.3.2. Critical Successful Factors .................................................................................................. 33
2.3.3. Inventory Prepositioning ..................................................................................................... 39
2.3.4. Transportation Planning ...................................................................................................... 44
2.4. Community Relief Application ........................................................................................... 51
2.4.1. Current Situation in Canada ................................................................................................ 51
2.4.2. Base Case Scenario ............................................................................................................. 53
2.5. Summary ............................................................................................................................. 55
3. Methodology ..................................................................................................................................... 60
3.1. Development of Conceptual Framework............................................................................. 61
3.2. Selection of Indicators for Performance Measurement ....................................................... 64
M.Sc. in Management, University of Ottawa Mingli Liu
3
3.3. Modeling Approach and Process Definition ....................................................................... 66
3.4. Establishment of Base Case Model ..................................................................................... 69
3.5. Evaluation and Decision Making ........................................................................................ 73
4. Analysis and Expected Results .......................................................................................................... 74
5. Expected Recommendation and Consideration for Future Research ................................................ 76
6. Research Timeline ............................................................................................................................. 77
7. Bibliography ...................................................................................................................................... 78
Appendix ............................................................................................................................................... 95
M.Sc. in Management, University of Ottawa Mingli Liu
4
List of Tables
Table 1.1: Summary of natural disasters in Canada from 1900 to 2013
Table 2.1: Disaster types and examples
Table 2.2: Performance measurement of commercial supply chain management
Table 2.3: CSFs in commercial supply chain management
Table 2.4: Performance measurement of humanitarian aid and disaster relief supply chain
management
Table 2.5: CSFs in humanitarian aid and disaster relief supply chain management
Table 2.6: Summary of humanitarian aid and disaster relief transportation modeling
Table 2.7: Comparison of commercial with humanitarian aid and disaster relief supply chain
Table 3.1: Parameters about ECs
Table 3.2: The availability of RS and RVs in CEB
Table 3.3: The number of AP in specific locations and the distance between AP and EC
Table 3.4: Unit satisfaction score for assignment problem
Table 3.5: Unit shipping cost in transportation problems
M.Sc. in Management, University of Ottawa Mingli Liu
5
List of Figures
Figure 1.1: Number of natural disasters reported from 1900 to 2011
Figure 2.1: Establishing effective disaster management
Figure 2.2: Supply chain management activities in 2013 Alberta flooding response
Figure 3.1: Conceptual framework for humanitarian aid and disaster relief supply chain
management
Figure 3.2: Relationships between indicators and enablers
Figure 3.3: A general spreadsheet modeling process
Figure 3.4: A grid map of centralized example problem
Figure 6.1: Research timeline
M.Sc. in Management, University of Ottawa Mingli Liu
6
1. Introduction
During recent decades, compelling evidences and discussions show that the number of
disasters has grown at an unprecedented rate all around the world. How to improve the
performance of humanitarian aid and disaster relief has attracted an increasing attention on a
global scale. This chapter introduces the current disaster situations, as well as the important
role that supply chain management plays in humanitarian aid and disaster relief processes.
Subsequently, research questions and objectives are proposed.
1.1. Research Background and Motivation
Among the 310 natural disasters recorded in EM-DAT database in 2012, the most serious one
in terms of mortality was Typhoon Bopha in the southern Philippine island of Mindanao
which caused 1901 deaths and affected more than 6 million people (CRED, 2013). Although
the continent most influenced by natural disasters, in terms of mortality and occurrence, was
still Asia, 63% of total 2012 economic losses happened in the Americas because of Hurricane
Sandy hitting the Eastern seaboard of the United States and the drought impacting 62% of the
adjacent United States (CRED, 2013). In the past few years, tsunami in South Asia (2004),
Hurricane Katrina in the United States (2005), earthquakes in Pakistan (2005), Java (2006),
China (2008) and Haiti (2010), as well as Superstorm Sandy (2012) are some other examples
of the deadliest disasters.
Narrowing down the scope from international to Canada, two massive flood disasters cannot
be ignored in the year of 2013. On June 20th
, Alberta experienced heavy rainfall causing
catastrophic flooding which is described by the provincial government as the worst one in
Alberta’s history. Flood waters swept over parts of Alberta, touching the lives of more than
100,000 people, leading to the damage of over 5 billion Canadian dollars, and leaving behind
a decade’s worth of recovery (CBC News, 2013a). Later, on July 8th
, Toronto experienced the
most expensive natural disaster in Ontario history – the flood resulted from a severe
M.Sc. in Management, University of Ottawa Mingli Liu
7
thunderstorm in the GTA region (CBC News, 2013b).
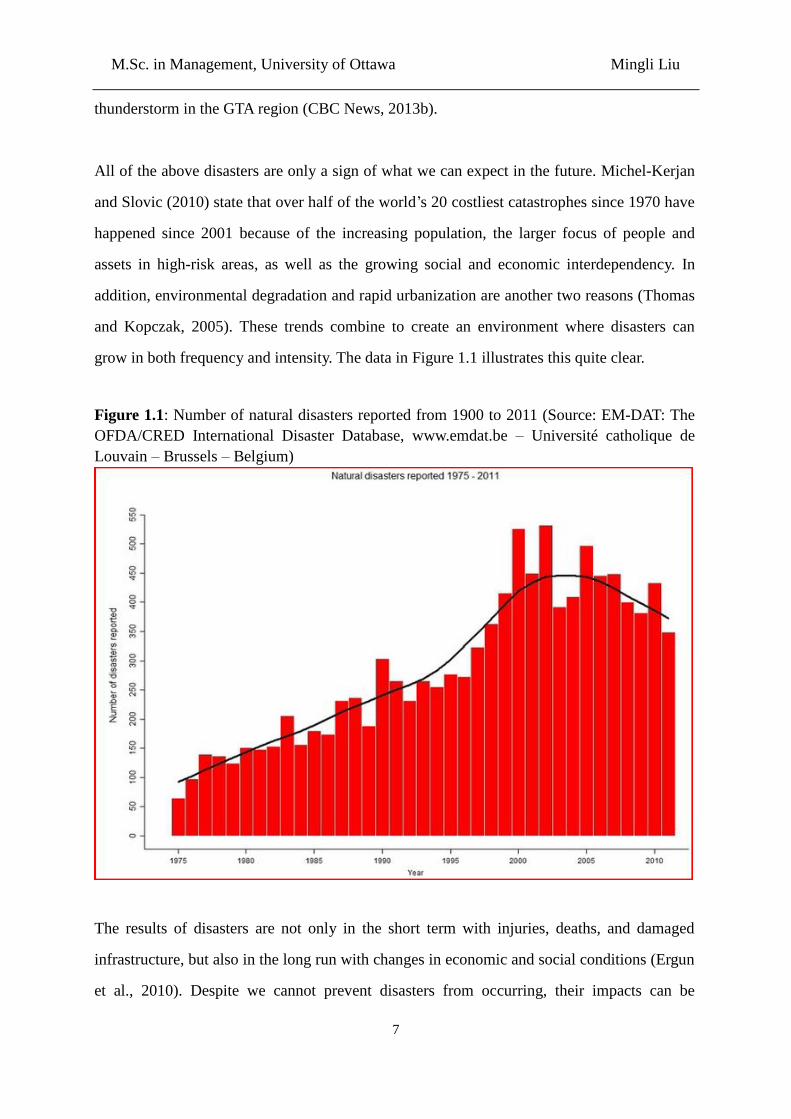
All of the above disasters are only a sign of what we can expect in the future. Michel-Kerjan
and Slovic (2010) state that over half of the world’s 20 costliest catastrophes since 1970 have
happened since 2001 because of the increasing population, the larger focus of people and
assets in high-risk areas, as well as the growing social and economic interdependency. In
addition, environmental degradation and rapid urbanization are another two reasons (Thomas
and Kopczak, 2005). These trends combine to create an environment where disasters can
grow in both frequency and intensity. The data in Figure 1.1 illustrates this quite clear.
Figure 1.1: Number of natural disasters reported from 1900 to 2011 (Source: EM-DAT: The
OFDA/CRED International Disaster Database, www.emdat.be – Université catholique de
Louvain – Brussels – Belgium)
The results of disasters are not only in the short term with injuries, deaths, and damaged
infrastructure, but also in the long run with changes in economic and social conditions (Ergun
et al., 2010). Despite we cannot prevent disasters from occurring, their impacts can be
M.Sc. in Management, University of Ottawa Mingli Liu
8
reduced by different means including humanitarian and disaster operations research. It is
because disasters place special needs on logistical, supply chain, and organizational skills of
the affected countries (PAHO/WHO, 2001). For instance, assistance cannot reach disaster
areas due to logistics difficulties with limited infrastructure.
In January 2005, the World Conference on Disaster Reduction in Japan called for better
preparedness for humanitarian aid and disaster relief in natural disasters. The only approach
to this goal is efficient and effective logistics operations and more precisely supply chain
management, since logistics occupies 80% of humanitarian aid and disaster relief (Van
Wassenhove, 2006), and supply chain management is needed to maximize the timeliness and
efficiency of response operations.
As noted by Thomas and Kopczak (2005), supply chain management is central to
humanitarian aid and disaster relief for three reasons. First, it is one of the most expensive
parts of a relief effort due to inventory and transportation. Second, it plays an important role
in response for major humanitarian programs, such as food, water, shelter, and sanitation.
Third, it is the repository of data that can be analyzed to provide post-event learning in that
the logistics department is responsible for tracking goods through the supply chain. Thus, it is
important to the performance of both current and future operations and programs.
Humanitarian aid and disaster relief supply chain operates in a different environment from
other supply chains that are more widely known and researched. The differences provide
chances to conduct potential useful research (Clay Whybark et al., 2010). Research in this
field tends to concentrate on several particular aspects of the supply chain’s operation, such as
location selection, inventory management, or transportation planning, rather than the entire
chain all at once. It is because we can make the whole supply chain more effective if we can
work on manageable portions of it first. Two individual interviews were done with the chief
of Emergency Preparedness and Response in Public Health Agency of Canada and the senior
manager of logistics in the Canadian Red Cross in March 2013. Both of them stated that their
organizations did not specify supply chain management according to functions. Thus, the
M.Sc. in Management, University of Ottawa Mingli Liu
9
proposed research will centre on two aspects – inventory and transportation – of supply chain
management in humanitarian aid and disaster relief.
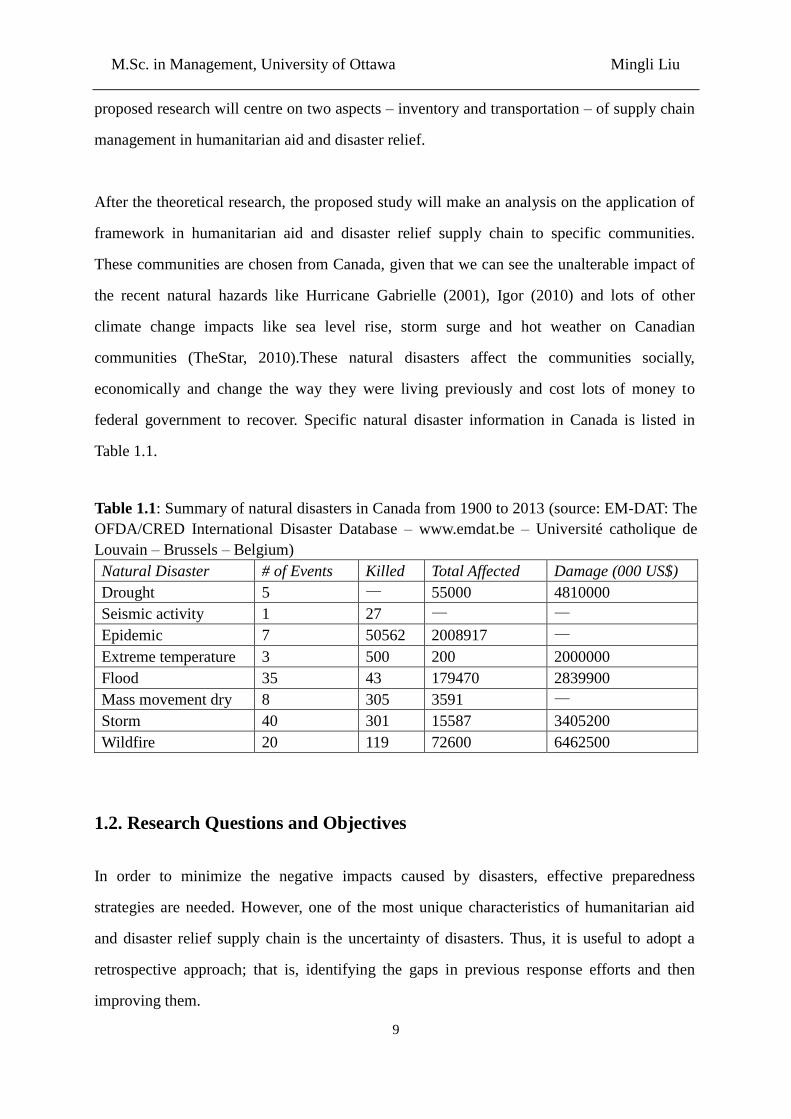
After the theoretical research, the proposed study will make an analysis on the application of
framework in humanitarian aid and disaster relief supply chain to specific communities.
These communities are chosen from Canada, given that we can see the unalterable impact of
the recent natural hazards like Hurricane Gabrielle (2001), Igor (2010) and lots of other
climate change impacts like sea level rise, storm surge and hot weather on Canadian
communities (TheStar, 2010).These natural disasters affect the communities socially,
economically and change the way they were living previously and cost lots of money to
federal government to recover. Specific natural disaster information in Canada is listed in
Table 1.1.
Table 1.1: Summary of natural disasters in Canada from 1900 to 2013 (source: EM-DAT: The
OFDA/CRED International Disaster Database – www.emdat.be – Université catholique de
Louvain – Brussels – Belgium)
Natural Disaster # of Events Killed Total Affected Damage (000 US$)
Drought 5 — 55000 4810000
Seismic activity 1 27 — —
Epidemic 7 50562 2008917 —
Extreme temperature 3 500 200 2000000
Flood 35 43 179470 2839900
Mass movement dry 8 305 3591 —
Storm 40 301 15587 3405200
Wildfire 20 119 72600 6462500
1.2. Research Questions and Objectives
In order to minimize the negative impacts caused by disasters, effective preparedness
strategies are needed. However, one of the most unique characteristics of humanitarian aid
and disaster relief supply chain is the uncertainty of disasters. Thus, it is useful to adopt a
retrospective approach; that is, identifying the gaps in previous response efforts and then
improving them.
M.Sc. in Management, University of Ottawa Mingli Liu
10
Based on the research background and motivation, this proposal attempts to address the
following research questions:
1. How to describe clearly an effective supply chain management framework?
2. What is the current status of inventory and transportation management in selected
Canadian communities with respect to humanitarian aid and disaster relief?
3. How can the existing framework for humanitarian aid and disaster relief be improved to
assist its operations for Canadian communities?
In response to the above research questions, the associated research objectives are as follows:
1. To analyze different models that have been developed or used, and then to construct an
effective supply chain management framework for humanitarian aid and disaster relief.
2. To collect data on specific Canadian communities, subsequently, to analyze and evaluate
their current status.
3. To define the strategies of applying the effective framework to improve their inventory
and transportation management in humanitarian aid and disaster relief and to
communicate the results to Canadian communities.
1.3. Plan of the Proposal
This proposal has seven main chapters. They are organized as follows:
Chapter 1: The current chapter is an introduction. It includes the background of supply chain
management in humanitarian aid and disaster relief, the motivation of developing a
framework which can be applied to Canadian communities, as well as the specific research
questions and objectives.
Chapter 2: The literature review summarizes previous and current research in four related
areas: disaster management, general supply chain management, humanitarian aid and disaster
relief supply chain management, as well as community relief application.
M.Sc. in Management, University of Ottawa Mingli Liu
11
Chapter 3: The methodology part represents the processes to develop a conceptual
framework, the approaches to collecting data and establishing a linear programming model,
as well as the steps to apply this framework to the selected Canadian communities.
Chapter 4: This section provides further details on analysis methodology and describes the
expected results of this research.
Chapter 5: An overview of expected recommendation and consideration for future research
in this area is proposed in this part.
Chapter 6: A brief timeline of completing the proposed research is represented in this
chapter.
Chapter 7: The last part lists the bibliography used in this proposal.
2. Literature Review
Research questions in the first chapter are defined after reviewing an extensive academic and
practitioner literature. In this chapter, papers in several topics which can help answer the
research questions are illustrated in detail. To set the stage for literature review, research
topics on disaster management are classified in section 2.1. Among them, operations and
process research has the closest relationship with the proposed research. Section 2.2 discusses
papers on four themes in general supply chain management: performance measurement,
critical successful factors, inventory management, and transportation planning. Subsequently,
the corresponding four themes in humanitarian aid and disaster relief context are reviewed in
section 2.3. An overview of community relief application for this proposed research is shown
in section 2.4. The last section is a summary for the whole chapter.
M.Sc. in Management, University of Ottawa Mingli Liu
12
2.1. Disaster Management
United Nations (1992, p. 28) defines disaster management as “the body of policy and
administrative decisions and operational activities which pertain to the various stages of a
disaster at all levels”. In order to understand it better, this section illustrates it from the
following three aspects.
2.1.1. Disaster Types
The term “disaster” is usually applied to “a serious disruption of the functioning of society,
causing widespread human, material or environmental losses which exceed the ability of the
affected society to cope using only its own resources” (United Nations, 1992, p. 27).
According to the causes, they can be grouped into two main categories: natural or man-made
disasters. The former ones are caused by natural hazards, while the latter ones are the results
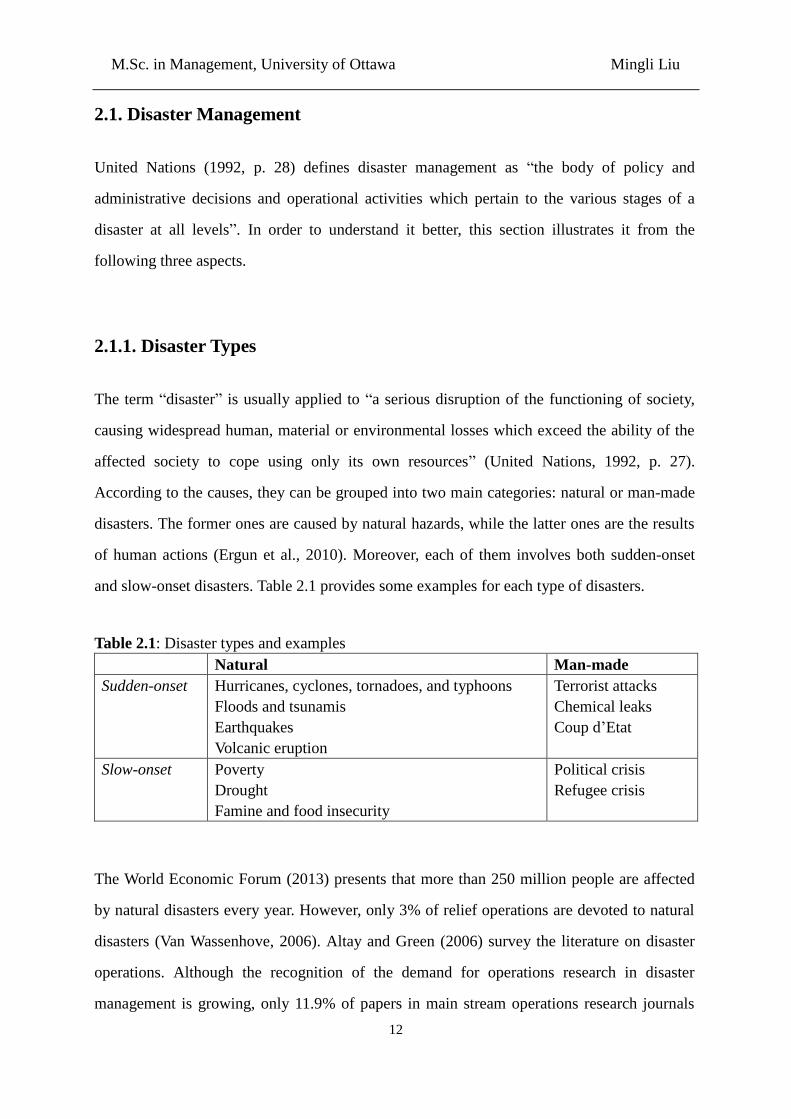
of human actions (Ergun et al., 2010). Moreover, each of them involves both sudden-onset
and slow-onset disasters. Table 2.1 provides some examples for each type of disasters.
Table 2.1: Disaster types and examples
Natural Man-made
Sudden-onset Hurricanes, cyclones, tornadoes, and typhoons
Floods and tsunamis
Earthquakes
Volcanic eruption
Terrorist attacks
Chemical leaks
Coup d’Etat
Slow-onset Poverty
Drought
Famine and food insecurity
Political crisis
Refugee crisis
The World Economic Forum (2013) presents that more than 250 million people are affected
by natural disasters every year. However, only 3% of relief operations are devoted to natural
disasters (Van Wassenhove, 2006). Altay and Green (2006) survey the literature on disaster
operations. Although the recognition of the demand for operations research in disaster
management is growing, only 11.9% of papers in main stream operations research journals
M.Sc. in Management, University of Ottawa Mingli Liu
13
are on natural disasters (Altay and Green, 2006). Thus, more attention needs to be paid to
natural disasters. Furthermore, famine relief and aid to help develop a poor region is different
from that demanded after a sudden catastrophe (Kovacs and Spens, 2007). Two main streams
of humanitarian aid and disaster relief supply chain management are continuous aid work and
sudden disaster relief. In short, this proposed research will just focus on natural disasters,
particularly, sudden-onset ones.
2.1.2. Disaster Phases
Disaster phases, also called disaster cycle or disaster continuum, are pre- and post- disaster
stages subdivided into particular actions (OFDA, 1984). Pre-event tasks consist of forecasting
and analyzing potential dangers and developing action plans for mitigation (Tufekci and
Wallace, 1998). In contrast, post-event efforts include responses that begin when disasters are
in progress (Tufekci and Wallace, 1998).
Specific phases vary from research to research. For example, not a few researchers prefer the
four-phase approach – mitigation, preparedness, response and recovery – based on the
Comprehensive Emergency Management concept proposed in the 1978 report of the National
Governors’ Association Emergency Preparedness Project. Lee and Zbinden (2003) and
Kovacs and Spens (2007) just separate the cycle into three phases: preparedness (preparation),
during operation (immediate response), and post operation (reconstruction). There is also
another two-phase method. For instance, disaster mitigation (assessment, prevention,
preparedness) includes “measures taken in advance of a disaster aimed at decreasing or
eliminating its impact on society and environment” (United Nations, 1992, p. 53) and disaster
response (relief, rehabilitation, reconstruction) is “a sum of decisions and actions taken
during and after disaster, including immediate relief, rehabilitation, and reconstruction”
(United Nations, 1992, p. 29).
This proposed research follows a similar two-phase approach: disaster preparation and
M.Sc. in Management, University of Ottawa Mingli Liu
14
disaster response. The preparation stage consists of all tasks conducted before disaster strike,
while the response stage includes activities in both short-term immediate responses and
long-term recoveries and reconstructions after the onset of disasters. Since there is no doubt
that being better prepared leads to a better response, this proposed research will concentrate
on the pre-disaster phase, that is, disaster preparedness.
In order to produce effective results, disaster preparedness includes five key elements: human
resources, knowledge management, operations and process management, financial resources,
and the community (Samii et al., 2002). Human resources preparedness aims to choose
trained people who can plan, act, intervene, and coordinate where necessary; knowledge
management means leaning from previous practices through capturing, codifying, and
transferring knowledge on logistics operations; operations and process management is about
humanitarian aid and disaster relief supply chain management; financial resources
preparation refers to raising enough money to ensure smooth preparedness and operations;
finally, the community entails finding effective collaboration methods among key players
(Van Wassenhove, 2006). The interconnection among these five elements as well as the
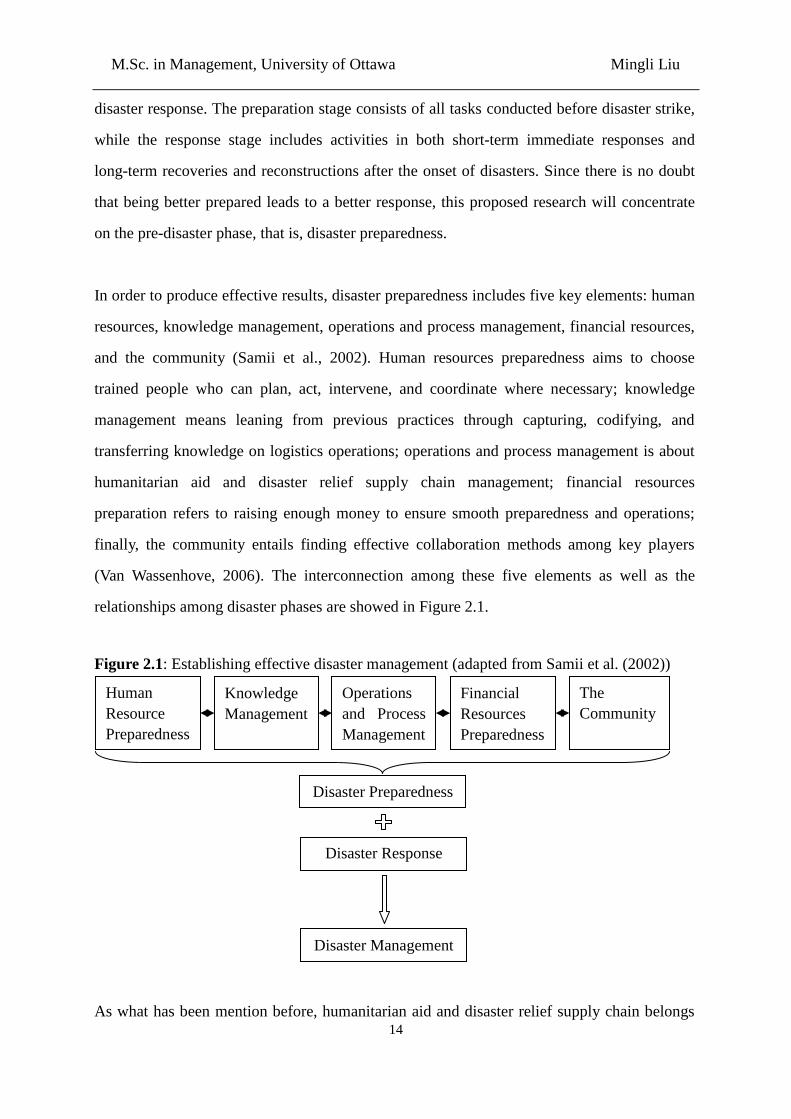
relationships among disaster phases are showed in Figure 2.1.
Figure 2.1: Establishing effective disaster management (adapted from Samii et al. (2002))
As what has been mention before, humanitarian aid and disaster relief supply chain belongs
Human
Resource
Preparedness
Disaster Preparedness
Disaster Response
Disaster Management
The
Community
Operations
and Process
Management
Financial
Resources
Preparedness
Knowledge
Management
M.Sc. in Management, University of Ottawa Mingli Liu
15
to operations and process management part and it cannot be improvised at the time of
disasters. Thus, it is a cornerstone of disaster preparedness efforts (PAHO/WHO, 2001).
Therefore, this is the area which the proposed research will mainly centre on.
2.1.3. Operations Research in Disaster Management
Researchers have developed new methods in studying disaster management. Analysis and
modeling techniques such as risk analysis, operations research, simulation, artificial
intelligent systems, decision support systems, and geographic information systems have been
used (Tufekci and Wallace, 1998). Operations management means controlling processes or
systems that create goods and/or provide services by transforming inputs into outputs. It
includes a set of activities such as forecasting, purchasing, scheduling, capacity planning,
production control, quality assurance, inventory management, making facility location
decision, logistics and so on (Heizer and Renser, 2004; Stevenson and Hojati, 2004). Due to
the randomness and uniqueness of the impacts and problems in disasters, they need dynamic,
effective, cost efficient solutions. This topic is suitable for operations research. Disaster
operations compass activities performing before, during, and after a disaster with the aim to
decrease human life losses, reduce negative effects on economy, and return to a normal state
(Altay and Green, 2006).
A growing number of studies on humanitarian supply chain have been published, and
application of operations research to this area has been suggested. Generally, humanitarian
aid and disaster relief supply chain is filled with various optimization problems combining
aspects from classic problems in supply chain management, warehouse location, inventory
control, and vehicle routing (Van Hentenryck et al., 2010). Different aspects of the above
problems in commercial situations have been studied before. However, significant complexity
is added to the classical problems when it comes to humanitarian aid and disaster relief
context. Thus, novel research in this area is required to solve these kinds of problems.
M.Sc. in Management, University of Ottawa Mingli Liu
16
According to Altay and Green (2006), interest in disasters has increased rapidly since 1990,
and the most frequently utilized method in disaster operations management research is
mathematical programming which is followed by probability theory and statistics. In contrast,
systems dynamics, constraint programming and soft operations research techniques are
underused in disaster operations management research. Based on the phases of disaster
management lifecycle, only 21.1% of them address preparation. Furthermore, only 11.9% of
papers in main stream operations research are about natural disasters. They summarize three
types of contribution of the articles: model development, theory development, and application
development. They find that over 50% of published disaster operations management research
using model development, followed by theory development (26.6%) and application
development (15.6%). Few studies combine two or three of them together. Thus, this
proposed research will first develop a model and then apply it to the reality.
2.2. Supply Chain Management
The definition of logistics and supply chain management varies from area to area. In military
area, it means “the science of planning and carrying out the movement and maintenance of
forces” dealing with “a. design and development, acquisition, storage, movement, distribution,
maintenance, evacuation, and disposition of material; b. movement, evacuation, and
hospitalization of personnel; c. acquisition or construction, maintenance, operation, and
disposition of facilities; and d. acquisition or furnishing of services” (DoD, 2005, p. 313). In
commercial domain, it is defined as a planning framework for managing materials, services,
information, and capital flows to convey superior customer value at the least cost (Van
Wassenhove, 2006). In humanitarian context, the Fritz Institute defines it as “the process of
planning, implementing, and controlling the efficient, cost-effective flow and storage of
goods, and materials, as well as related information, from point of origin to the point of
consumption for the purpose of alleviating the suffering of vulnerable people” (Thomas and
Kopczak, 2005, p. 2). No matter what the definition is, the fact supply chain management has
in common is that it consists of preparedness, planning, procurement, transportation,
M.Sc. in Management, University of Ottawa Mingli Liu
17
inventory, warehousing, tracking, allocation, and recipient satisfaction.
This section places focus on supply chain management in business context. Stevenson and
Hojati (2004, p. 462) define supply chain as “the sequence of organizations – their facilities,
functions, and activities – that are involved in producing and delivering a product or service.”
In commercial context, factories, processing centres, warehouses, distribution centres, and
retail stores all belong to facilities. Functions and activities involve forecasting, scheduling,
procurement, production, quality assurance, delivery, inventory management, distribution,
information management, as well as customer service. Overall, commercial supply chain
aims to link all the above components to meet market demand as efficiently as possible
through the entire chain (Stevenson and Hojati, 2004).
2.2.1. Performance Measurement
For years, academic and practical papers have studied the various processes of supply chain
individually; however, a growing attention has been recently placed on the performance,
design, and analysis of the supply chain as a whole (Beamon, 1998). Performance
measurement can be defined as “the process of quantifying the efficiency and effectiveness of
action” (Neely et al., 1995, p. 80). Effectiveness measures the extent to which customer
demands are met, while efficiency refers to how economically an organization’s resources are
used when offering a given level of customer satisfaction (Neely et al., 1995). Parker (2000)
points out six reasons of measuring performance: (1) identify success; (2) identify whether
customer requirements are met; (3) make organizations to understand its process better; (4)
identify where bottlenecks exist and where improvements are needed; (5) ensure decisions
are made according to fact; (6) demonstrate whether planned improvements actually happen.
In order to reveal a real insight of supply chain management, appropriate performance
measures are required to help it evolve into an efficient and effective chain (Chan and Qi,
2003; Gunasekaran et al., 2001; Persson and Olhager, 2002). It is because performance
M.Sc. in Management, University of Ottawa Mingli Liu
18
measurement can offer insight to identify success and potential opportunities (Chan and Qi,
2003). Since no one measure will be sufficient for supply chain management performance
(Chow et al., 1994), researchers attempt to examine a set of measures that collectively capture
most of the performance dimensions. Available literature has identified lots of performance
measurement as important in the evaluation of supply chain efficiency and effectiveness.
Different types of performance measurement have been used to characterize systems, in
particularly, production, distribution, and inventory systems (Beamon, 1999).
Beamon (1998) summarizes two broad types of performance measurement in existing
literature: qualitative and quantitative. Qualitative performance measurement includes
customer satisfaction, flexibility, information and material flow integration, effective risk
management, and supplier performance. Quantitative performance measurement includes cost
(inventory and operating cost) and customer responsiveness (lead-time, stock-out probability,
and fill rate). Some studies follow the main stream of using quantitative performance
measurement. For example, Petrovic et al. (1998) adopt total cost and fill-rate when fuzzy
modeling and simulating a made-up, serial supply chain with infinite capacity.
Furthermore, a three-part framework is developed for the selection of supply chain
performance measurement: resource measures, output measures, and flexibility measures
(Beamon, 1999). As noted by Beamon (1999), resource performance measures assess the
efficient level of resources used to meet the goals, such as total cost, distribution cost,
manufacturing cost, inventory cost, and return on investment; output performance measures
evaluate the effectiveness with which supply chains can supply, including sales, profit, fill
rate, on-time deliveries, backorder/stock-out, customer response time, manufacturing lead
time, shipping errors, and customer complaints; flexibility performance measures examine
the range of possible operating conditions profitably achievable by the chain, for example,
volume flexibility, delivery flexibility, mix flexibility, and new product flexibility. A few
researchers apply this three-part framework to their studies. For instance, the supply chain
design of Persson and Olhager (2002) chooses cost and inventory as resource measures, uses
lead-time and lead-time availability as both output measures and flexibility measures.
M.Sc. in Management, University of Ottawa Mingli Liu
19
Angerhofer and Angelides (2006) also use this framework to measure their collaborative
supply chain performance and identify areas for improvement.
Different from the above studies, Gunasekaran et al. (2001) build a framework to assess a
supply chain at strategic, tactical, and operational level, respectively. They propose a list of
key performance measurement for each level, mainly dealing with supplier, delivery,
customer service, inventory cost, and logistics cost. Based on the research of Gunasekaran et
al. (2001), Shepher and Günter (2006) also state that supply chain performance needs to be
evaluated at these three levels and assign five categories of measures to the first level: cost,
quality, time, flexibility, and innovativeness. Time and quality indicate the capacity of a
supply chain to deliver a high customer service, while flexibility and innovativeness reflect
the ability of dealing with rapid changed in supply or demand.
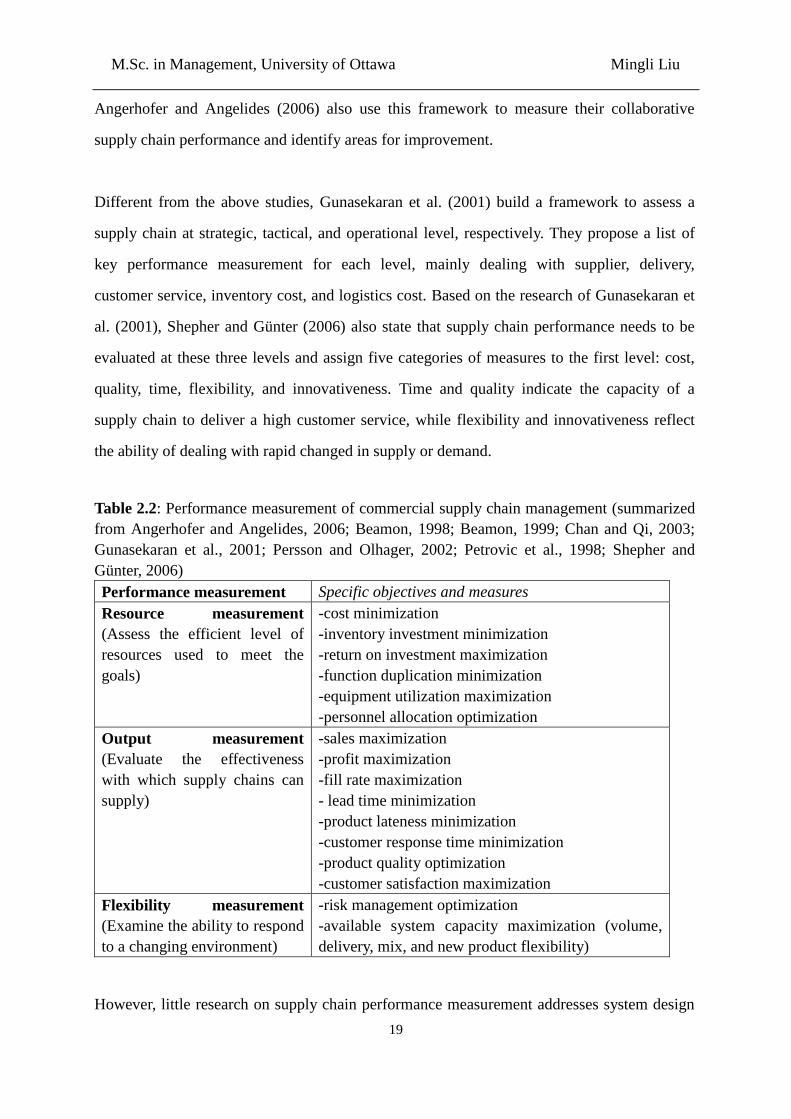
Table 2.2: Performance measurement of commercial supply chain management (summarized
from Angerhofer and Angelides, 2006; Beamon, 1998; Beamon, 1999; Chan and Qi, 2003;
Gunasekaran et al., 2001; Persson and Olhager, 2002; Petrovic et al., 1998; Shepher and
Günter, 2006)
Performance measurement Specific objectives and measures
Resource measurement
(Assess the efficient level of
resources used to meet the
goals)
-cost minimization
-inventory investment minimization
-return on investment maximization
-function duplication minimization
-equipment utilization maximization
-personnel allocation optimization
Output measurement
(Evaluate the effectiveness
with which supply chains can
supply)
-sales maximization
-profit maximization
-fill rate maximization
- lead time minimization
-product lateness minimization
-customer response time minimization
-product quality optimization
-customer satisfaction maximization
Flexibility measurement
(Examine the ability to respond
to a changing environment)
-risk management optimization
-available system capacity maximization (volume,
delivery, mix, and new product flexibility)
However, little research on supply chain performance measurement addresses system design
M.Sc. in Management, University of Ottawa Mingli Liu
20
and measure selection. Thus, Chan and Qi (2003) adopt an innovative process-based
system-thinking approach to measuring the holistic performance of complex supply chains,
aiming to contribute to its performance improvement. They build a process and performance
hierarchy, and then discuss measurement from three dimensions: inputs (time and cost),
outputs (delivery reliability and customer responsiveness), and composite (productivity,
efficiency, and utilization) ones. Overall, performance measurement of commercial supply
chain management can be summarized under the general framework built by Beamon (1999)
as Table 2.2.
2.2.2. Critical Successful Factors
The concept of success factors is developed by Daniel (1961) of McKinsey & Company, and
it is refined into critical successful factors (CSFs) by Rockart (1979). In spite of various
definitions, the classical one considers CSFs as those characteristics, conditions, or variables
that when properly sustained, maintained, or managed can have a significant effect on the
performance of an organization and its endeavor (Leidecker and Bruno, 1984). CSFs can help
organizations set and convey goals to everyone, assist managers in holding people
responsible for progress against the goals, as well as proactively deal with productivity and
performance gaps as they occur (Oloruntoba, 2010). Thus, studying CSFs is important. CSFs
have been examined in a variety of areas such as human resource management, information
technology, small business management, project management, and supply chain management
(Oloruntoba, 2010). This section reviews the research on CSFs in commercial supply chain
management.
Korpela and Tuominen (1996) identify the logistics CSFs and determine their importance.
There are five CSFs: reliability, lead time, flexibility, cost-effectiveness, and value-added.
Reliability is the ability of delivering products in right quantities without damage; lead time
means the time interval between placing an order and receiving the order; flexibility refers to
the capacity of arranging urgent deliveries; cost-effectiveness in meeting demands is a major
M.Sc. in Management, University of Ottawa Mingli Liu
21
characteristic of a successful supply chain; value-added entails the ability to offer services
exceeding the basic requirements. They also define six enablers applying for the CSFs:
management systems (effective logistics strategic management system); process integration
(a process-based approach to integrating production, sales and marketing, and distribution
into a customer-oriented logistics system); information systems (effective strategic and
operational information systems); organization (the effectiveness and flexibility of the
logistics organization); technology (utilization of modern technology in different parts of the
logistics system); relationships (long-term and contractual relationships with both customers
and providers of logistics services).
In particular, Razzaque and Sheng (1998) use a comprehensive literature survey to identify
the CSFs with regard to organizations outsourcing their logistics activities. These are internal
and external communication, development of user-provider relationships, customer focus,
standards establishing and performance monitoring against the standards, importance of
human factor, knowing the payback period for outsourcing activities.
Power et al. (2001) investigate the CSFs in agile supply chain management. They summarize
7 independent variable groups: participative management style such as the coordination
within organizations and human resource management; computer-based technologies such as
the use of information technology; resource management such as production planning and
inventory management; supplier relations such as collaboration; just-in-time methodology
such as the balance of leanness and agility; continuous improvement enablers; and
technology utilization.
Gunasekaran and Ngai (2003) examine the CSFs of a small logistics company. They are
strategic planning which includes making long-term decisions on supply chain operations;
inventory management which involves planning, coordinating and controlling of materials
flow; transportation or shipping which consists of transportation modes, utilization of
available capacity, planning of transportation equipment and maintenance of transportation
facilities; capacity planning which is driven by both long-term and short-term demand;
M.Sc. in Management, University of Ottawa Mingli Liu
22
information technology or systems which assists with activity integration of all these areas by
collecting data on the performance and utilization of resources and then making required
changes to logistics operations.
Wong (2005) investigates the CSFs for implementing knowledge management in small and
medium enterprises systematically. The author proposes a set of 11 CSFs: management
leadership and support, culture, information technology, strategy and purpose, measurement,
organizational infrastructure, processes and activities, motivational aids, resources, training
and education, as well as human resource management.
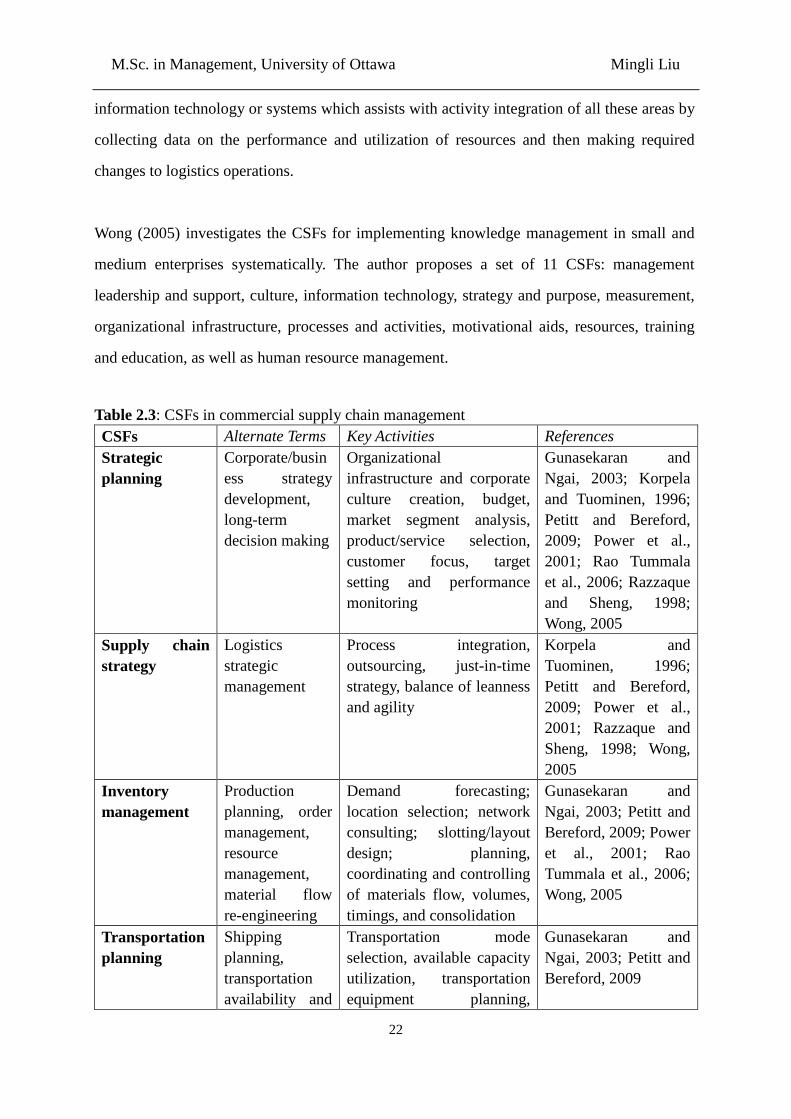
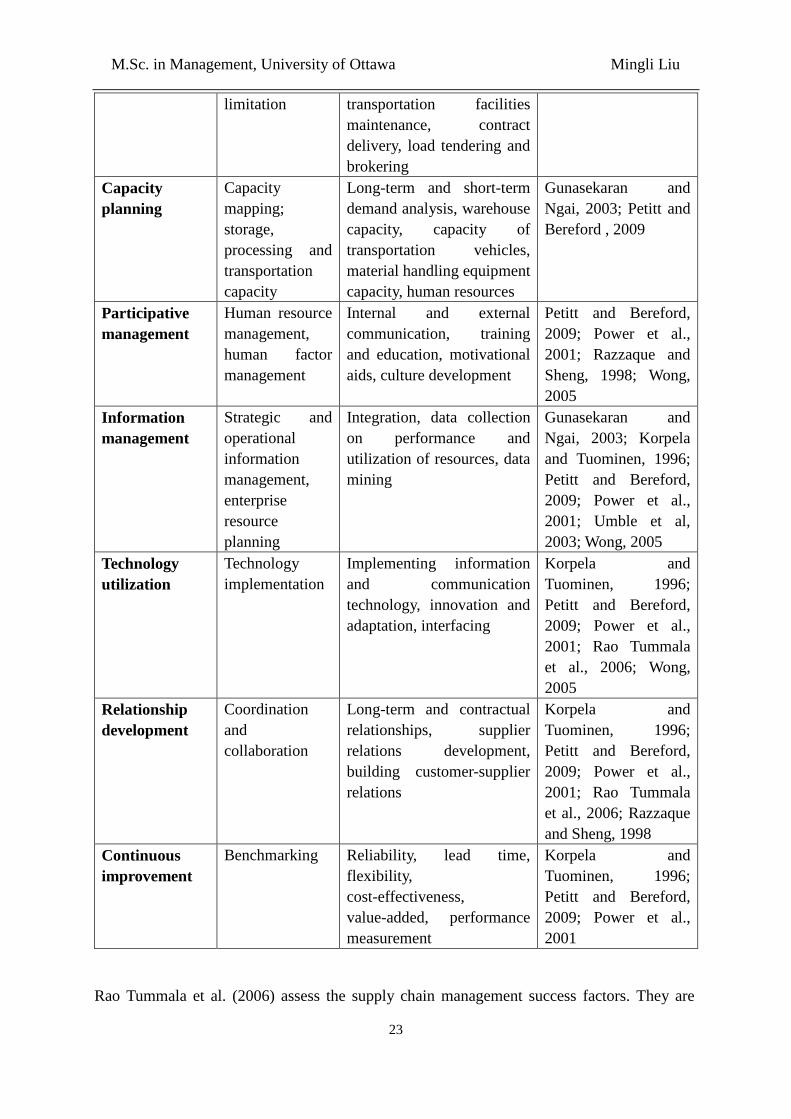
Table 2.3: CSFs in commercial supply chain management
CSFs Alternate Terms Key Activities References
Strategic
planning
Corporate/busin
ess strategy
development,
long-term
decision making
Organizational
infrastructure and corporate
culture creation, budget,
market segment analysis,
product/service selection,
customer focus, target
setting and performance
monitoring
Gunasekaran and
Ngai, 2003; Korpela
and Tuominen, 1996;
Petitt and Bereford,
2009; Power et al.,
2001; Rao Tummala
et al., 2006; Razzaque
and Sheng, 1998;
Wong, 2005
Supply chain
strategy
Logistics
strategic
management
Process integration,
outsourcing, just-in-time
strategy, balance of leanness
and agility
Korpela and
Tuominen, 1996;
Petitt and Bereford,
2009; Power et al.,
2001; Razzaque and
Sheng, 1998; Wong,
2005
Inventory
management
Production
planning, order
management,
resource
management,
material flow
re-engineering
Demand forecasting;
location selection; network
consulting; slotting/layout
design; planning,
coordinating and controlling
of materials flow, volumes,
timings, and consolidation
Gunasekaran and
Ngai, 2003; Petitt and
Bereford, 2009; Power
et al., 2001; Rao
Tummala et al., 2006;
Wong, 2005
Transportation
planning
Shipping
planning,
transportation
availability and
Transportation mode
selection, available capacity
utilization, transportation
equipment planning,
Gunasekaran and
Ngai, 2003; Petitt and
Bereford, 2009
M.Sc. in Management, University of Ottawa Mingli Liu
23
limitation transportation facilities
maintenance, contract
delivery, load tendering and
brokering
Capacity
planning
Capacity
mapping;
storage,
processing and
transportation
capacity
Long-term and short-term
demand analysis, warehouse
capacity, capacity of
transportation vehicles,
material handling equipment
capacity, human resources
Gunasekaran and
Ngai, 2003; Petitt and
Bereford , 2009
Participative
management
Human resource
management,
human factor
management
Internal and external
communication, training
and education, motivational
aids, culture development
Petitt and Bereford,
2009; Power et al.,
2001; Razzaque and
Sheng, 1998; Wong,
2005
Information
management
Strategic and
operational
information
management,
enterprise
resource
planning
Integration, data collection
on performance and
utilization of resources, data
mining
Gunasekaran and
Ngai, 2003; Korpela
and Tuominen, 1996;
Petitt and Bereford,
2009; Power et al.,
2001; Umble et al,
2003; Wong, 2005
Technology
utilization
Technology
implementation
Implementing information
and communication
technology, innovation and
adaptation, interfacing
Korpela and
Tuominen, 1996;
Petitt and Bereford,
2009; Power et al.,
2001; Rao Tummala
et al., 2006; Wong,
2005
Relationship
development
Coordination
and
collaboration
Long-term and contractual
relationships, supplier
relations development,
building customer-supplier
relations
Korpela and
Tuominen, 1996;
Petitt and Bereford,
2009; Power et al.,
2001; Rao Tummala
et al., 2006; Razzaque
and Sheng, 1998
Continuous
improvement
Benchmarking Reliability, lead time,
flexibility,
cost-effectiveness,
value-added, performance
measurement
Korpela and
Tuominen, 1996;
Petitt and Bereford,
2009; Power et al.,
2001
Rao Tummala et al. (2006) assess the supply chain management success factors. They are
M.Sc. in Management, University of Ottawa Mingli Liu
24
building customer-supplier relationships, implementing information and communication
technology, re-engineering material flows, creating corporate culture, identifying
performance measurement.
Petitt and Bereford (2009) summarize 10 CSFs in supply chain management literature:
strategic planning, resource management, transport planning, capacity planning, information
management, technology utilization, human resource management, continuous improvement,
supplier relations, and supply chain strategy. From the literature, several CSFs, related to
commercial supply chain management, are consistently identified. Table 2.3 summarizes and
lists the CSFs examined in previous literature.
2.2.3. Inventory Management
Inventory is a stock of goods kept for sale or use in the future (Stevenson and Hojati, 2004)
and plays a role of staple in most supply chains (Zhang, 2013). In the 17th
Annual State of
Logistics Report, Wilson (2006) reviews the trends in inventory costs, transportation costs,
and total logistics costs since 1984 in the United States. He points out that inventory carrying
costs account for about 33% of the over $1 trillion spent on logistics.
Inventory management includes two basic functions: one is how to classify inventory items
and maintain accurate inventory records (Heizer and Render, 2004); the other is how to
decide the amount and time to order items (Stevenson and Hojati, 2004). The main goal of
inventory management is balance – too much adds unnecessary costs, while too little causes
delays or disrupts schedules (Stevenson and Hojati, 2004). Thus, inventory management
research has long been central to academic literatures. Scholars in different areas try to
advance the theory and practice in inventory management. Studies in the field of supply chain
management are examined in this section. There are three general themes: traditional
inventory management models, collaborative inventory management models, and just-in-time
(JIT) inventory management strategy.
M.Sc. in Management, University of Ottawa Mingli Liu
25
Traditional Inventory Management Models
A majority of the less recent research on inventory management in supply chain concentrates
on traditional inventory control models (Williams and Tokar, 2008). Generally, there are five
inventory models for independent demand: (1) basic economic order quantity (EOQ) model;
(2) reorder point (ROP) model; (3) economic production quantity (EPQ) model; (4) quantity
discount model; (5) fixed order-interval (FOI) model (Heizer and Render, 2004; Stevenson
and Hojati, 2004). All of the first four models, assuming the demand for a product is known
and constant, belong to fixed-quantity system, or Q system; that is, the same fixed amount (Q
units) is added to inventory every time an inventory decreases to the reorder point (Heizer
and Render, 2004). If organizations use fixed-quantity system, they will need perpetual
inventory system to keep track of each addition or withdrawal to inventory continuously
(Heizer and Render, 2004). On contrast, the last one is in a fixed-period system, or P system
(Heizer and Render, 2004). FOI model is suitable when demand is unknown but can be
specified by a probability distribution (Heizer and Render, 2004; Stevenson and Hojati, 2004).
In this kind of model, various amounts of items are ordered at regular time intervals (P) to
raise inventory up to the target value (T) (Heizer and Render, 2004; Stevenson and Hojati,
2004).
According to Williams and Tokar (2008), most research of inventory management assumes an
approach of Q system. Moreover, there are studies extending Q system in several aspects.
Specifically, on one hand, additional elements like transportation factors (Swenseth and
Godfrey, 2002), short lead times (Mattsson, 2007), as well as emergency conditions (Beamon
and Kotleba, 2006b) are taken into consideration. On the other hand, some authors evaluate
the Q system approach under particular demand and lead-time distribution. For instance,
Namit and Chen (1999) build an accurate and efficient algorithm that does not need tabulated
values for solving inventory model in Q system with gamma lead-time demand.
However, the method of P system has not been studied as widely as Q system in logistics
literature. There are some authors assuming P system approach as either the sole inventory
management policy or one of several policies. To illustrate, Sezen (2006) uses simulation
M.Sc. in Management, University of Ottawa Mingli Liu
26
approach to explore the effects on the performance of a period review inventory model while
changing length of review period with lost sales under normally distributed demands. Among
them, fewer researchers integrate diverse logistics factors into this policy. For example, Qu et
al. (1999) propose an integrated inventory-transportation system with modified periodic
policy for multiple products. They use a heuristic decomposition approach to deal with a
multi-item joint replenishment problem in a stochastic setting, aiming to minimize the
long-run total average costs and make the decisions on inventory control as well as
transportation planning at the same time. Graves and Willems (2000) build a framework for
modeling strategic safety stock placement in a supply chain subject to uncertain demand or
forecast. A key assumption in their research is that they regard supply chain as a network and
each stage of it operates with a periodic-review base-stock replenishment policy.
Collaborative Inventory Management Models
The above-mentioned literature shows that researchers pay attention to integrating logistics
considerations into traditional inventory management models. Giunipero and Eltantawy
(2004) state that traditional buffer strategies against risks are using multiple sources for
strategic items and holding safety inventories, while new methods include identifying
potential losses, understanding the likelihood of potential losses, and assigning significance
to the losses. Applying this concept to supply chain management means enhancing
performances by integrating internal functions within an organization and linking them with
external operations of suppliers, channel members and customers (Giunipero and Eltantawy,
2004).
From the perspective of inventory management, researchers in supply chain management area
focus on how collaboration among business entities affects inventory policy decisions in an
organization. According to Williams and Tokar (2008), four widely used collaborative
methods are continuous replenishment planning (CRP), vendor managed inventory (VMI),
efficient consumer response (ECR), and quick response (QR). Some researchers try to find
the determinants and enablers of successful collaborative inventory relationships. For
example, Borade et al. (2013) identify 7 factors and 50 subfactors which are critical to VMI,
M.Sc. in Management, University of Ottawa Mingli Liu
27
and build an AHP-based framework for its adoption. In contrast, others concentrate on testing
their benefits for supply chain entities. For instance, Yao and Dresner (2008) make an
analysis of benefits in terms of inventory cost savings to both manufactures and retailers
under information sharing, CRP, or VMI.
Just-in-time (JIT) Inventory Management Strategy
Usually, inventory in supply chain management exists just in case (JIC) something goes
wrong, and extra inventory is used to cover problems (Heizer and Render, 2004). Nonetheless,
efficient and effective inventory management strategy needs JIT rather than JIC. JIT
inventory is the minimum inventory necessary to keep a perfect system running, and the exact
number of items arrives at the moment it is needed (Heizer and Render, 2004). Previous
sections summarize studies on inventory management without JIT considerations. Recently,
more and more researchers focus on this new inventory management strategy. For example,
Hoque and Goyal (2000) propose an optimal solution process for the single-vendor
single-buyer production-inventory system with both equal and unequal sized shipments from
vendor to buyer under the limitation of transportation equipment capacity.
2.2.4. Transportation Management
Transportation is a key function in supply chain management because it is a physical link
between supplier and customer enabling the resources flow (Naim et al., 2006). It is
interrelated with inventory strategy and warehouse management. All of the cost, method, and
route of transportation can have impacts on inventory level. There is an antinomy relation
between transportation efficiency and inventory efficiency (Zhang, 2013). In addition, Wilson
(2006) finds that transportation cost growth is the single largest rise of business logistics in
the United States and accounts for 6 percent of nominal GDP in 2006. After reviewing the
literature in this area, three research streams are identified in this area: attribute identification,
decision process development, and supply chain integration.
M.Sc. in Management, University of Ottawa Mingli Liu
28
Attribute Identification
This kind of research identifies critical properties for the transportation mode choice and
carrier selection. Flexibility is a major performance measure in supply chain management,
especially under uncertainties. From a logistics prospective, Naim et al. (2006) develop a
framework to rationalize transportation flexibility into 14 elements: mode, fleet, vehicle, node,
link, temporal, capacity, routing, communication, product, mix, volume, delivery, and access.
Then they determine the time and degree of required transportation flexibility. Therefore, the
role of flexibility types in conveying specific strategic logistics results such as collaborative
and information technology strategies can be determined. From a fresh perspective, Voss et al.
(2006) point out that the topic of importance of carrier attributes needs to be reevaluated
because of increasing demand for carrier preparation under unforeseen environment, as well
as growing emphasis on transport costs reduction and supply chain security. Different
previous studies, their research applies the Theory of Reasoned Action (TRA) since TRA can
assist with the forecast of behavioral intentions under various situations; that is, it might be
helpful in evaluating shippers’ intention to purchase transportation service from carriers with
certain attributes. Finally, the top two carrier selection criteria are identified: delivery
reliability and rates.
Decision Process Development
Developing qualitative or quantitative models to support the logistics decision procedure of
transportation mode choice and carrier selection is the purpose of this research stream.
McGinnis (1989) investigate four general types of transportation choice model in the
literature: (1) classical economic model which identifies the distance breakpoint between
competing modes such as rail and truck shipments by cost issues, (2) inventory-theoretic
model which makes trade-offs among freight rates, transit time, reliability, and en-route
lossage, as well as determines the optimal model relying on total costs of ordering,
transportation, and inventory; (3) trade-off model identifying the best model according to the
total of transportation costs and quantifiable non-transportation costs, and (4) constrained
optimization model making the choice by minimizing transportation costs subject to both
quantitative and qualitative non-transportation constraints such as production constraint,
M.Sc. in Management, University of Ottawa Mingli Liu
29
distribution pattern restrict, service need limitation and so on. Other researchers build their
own model and apply to a real problem. For instance, deJong and Ben-Akiva (2007) develop
a micro-simulation (firm-to-firm level) multi-nominal logit choice model of shipment size,
segment number in transport chain, as well as use of consolidation and distribution centre for
water, road, rail, and air transport. Their purpose is to minimize the total annual logistics costs
such as order, transport and inventory. Also, they apply this model to the national freight
transportation forecasting systems in Norway and Sweden.
Supply Chain Integration
This category of studies is related to supply chain integration in which organizations
collaborate to integrate transportation choices into other supply chain decisions. Supply chain
management includes a series of activities such as demand management, order fulfillment
management, manufacturing flow management, customer relationship management and so on
(Meixell and Norbis, 2008). These activities involve transportation choice at several points
(Meixell and Norbis, 2008). Different authors consider different initiatives in supply chain
activities, while Esper and Williams (2003) nearly address all of them. They develop a
conceptual framework and quantifiable measures for Collaborative Transportation
Management (CTM) and illustrate the importance of information technology in CTM
procedures, aiming to reduce transaction costs, improve service capacities, and realize a more
streamlined chain via third-party logistics and transportation service providers or
collaborative relationships. An important concept of CTM is to transfer order forecast
established by Collaborative Planning, Forecasting and Replenishment (CPFR) into shipment
forecast along with accurate fulfillment. It is a meaningful approach to dealing with issues on
inventory reduction, underutilized carrier equipment, or even the overall operation
performance.
2.3. Humanitarian Aid and Disaster Relief Supply Chain Management
Humanitarian aid and disaster relief supply chain management is sense-and-respond,
M.Sc. in Management, University of Ottawa Mingli Liu
30
including a series of activities: planning, preparedness, procurement, transportation,
warehousing, tracking, last mile delivery, and customer clearance (Thomas, 2007; Thomas
and Kopczak, 2005). Thomas and Kopczak (2005) explain the process specifically: once a
disaster happens, experts will be sent to assess the extent of damage and the number of
affected people, helping identify both the kinds and the quantities of relief items; emergency
stocks of standard relief items are sent from the nearest warehouses; when the relief items
arrive, local transportation, warehousing, and distribution need to be organized.
However, only few organizations have prioritized the development of high-performing supply
chain operations, and humanitarian aid and disaster relief operations are not as effective and
efficient as they could be (Thomas and Kopczak, 2005). Thus, it is important to improve the
performance of supply chain management and then enhance the whole humanitarian aid and
disaster relief operations. Logisticians participating in Fritz Institute’s Humanitarian Logistics
Conference identified several topics: managing a humanitarian response, humanitarian supply
chains, procurement, warehousing and inventory management, transportation, fleet
management, and import/export procedures (Thomas and Kopczak, 2005). The proposed
research will centre on several topics of them.
2.3.1. Performance Measurement
Since logistics occupies 80% of disaster relief (Van Wassenhove, 2006), measuring the
performance of logistics operations and more precisely supply chain management is
significant for humanitarian aid and disaster relief. Effective performance measurement
system can help practitioners make relief decisions, and can enhance the efficiency and
effectiveness of relief operations, therefore can improve the transparency and accountability
of disaster response (Beamon and Balcik, 2008). In spite of its importance, research has not
widely developed and systematically implemented performance measurement systems in
humanitarian aid and disaster relief supply chain due to the uniqueness and complexity of
disaster relief environment (Beamon and Balcik, 2008).
M.Sc. in Management, University of Ottawa Mingli Liu
31
A recent exception is the research conducted by Davidson (2006), proposing a performance
measurement framework of relief logistics for the International Federation of Red Cross and
Red Crescent Societies. The framework is based on four indicators which measure supply
chain performance in terms of the trade-offs of speed, cost and accuracy: appeal coverage,
donation-to-delivery time, financial efficiency, and assessment accuracy. Despite the fact that
this research is performed with an international non-profit humanitarian organization in mind,
its principles of measurement are related to other organizations that take part in disaster relief
operations such as non-governmental organizations and governmental agencies.
Particular characteristics in humanitarian aid and disaster relief supply chain can be divided
into three parts: strategic goals, demand characteristics, and customer characteristics. To start
with, the strategic goal of commercial supply chain is to produce maximum profits and high
quality goods or services, while the ultimate objective of humanitarian aid and disaster relief
supply chain is to save lives and reduce human suffering (Beamon and Balcik, 2008). In
addition, the demands in commercial supply chain are products or services, but the demands
in humanitarian aid and disaster relief are relief items and human resources (Beamon and
Balcik, 2008). The demand within a commercial supply chain is stable and predictable, while
the demand in humanitarian aid and disaster relief supply chain is changeable in terms of type,
time, location, and quantity (Beamon and Balcik, 2008). Finally, customers in humanitarian
aid and disaster relief supply chain are aid recipients who do not have rich choices for
supplies (Beamon and Balcik, 2008).
Although the environment where humanitarian aid and disaster relief operates is not exactly
as same as commercial situations, identifying its performance measurement can also learn
from that in commercial supply chain management. As what has been summarized in section
2.2.1, there are three broad measures in terms of commercial supply chain management. They
are also important and can be applied to humanitarian aid and disaster relief context.
However, the specific measures need to be adjusted.
First of all, resource measurement indicates the efficiency level of humanitarian aid and
M.Sc. in Management, University of Ottawa Mingli Liu
32
disaster relief supply chain. Inefficient resource utilization can discourage donors to fund. In
commercial supply chain management, cost is the major resource measure. Although saving
money is not the priority in humanitarian aid and disaster relief, a budget constraint exists and
efficient resource utilization can lead to more people helped per dollar spent. Three
dominating costs in humanitarian aid and disaster relief are supply cost, distribution cost, and
inventory cost (Beamon and Balcik, 2008). Apart from cost, resources also include personnel,
facilities, information, and materials. Efficient allocation of personnel, utilization of
equipment, and integration of process can improve the operation performance of the whole
chain.
What is more, output measurement can directly evaluate the characteristics of supply which is
the primary goal of any supply chain. In humanitarian aid and disaster relief background,
time is an important dimension and poor output will cause more deaths and suffering. The
objective of output is minimizing product lateness and response time instead of maximizing
sales and profits. Other measures in commercial supply chain such as fill rate can be used for
permanent warehouses in humanitarian aid and disaster relief background (Beamon and
Balcik, 2008). Besides, the distinctive distribution concern in disaster operation is equity
(Beamon and Balcik, 2008). All of them can be combined together to improve demand
satisfaction.
Finally, inherent uncertainties and high variability of humanitarian aid and disaster relief
environment call for high flexibility level. In commercial situation, there are four types of
flexibility: (1) volume flexibility refers to the ability to change the volume of output, (2)
delivery flexibility is about the capacity of adjusting assumed dates of delivery, (3) mixed
flexibility reveals the ability of changing the variety of produced products in a given time
period, and (4) new product flexibility means the capacity in modifying existing products or
introducing new ones (Slack, 2005). Except the last one, enhancing anyone of the first three
types can help optimize the general risk management in humanitarian aid and disaster relief.
As noted by Beamon and Balcik (2008), volume flexibility implies the ability of responding
to different magnitudes of disasters; delivery flexibility indicates the response time to
M.Sc. in Management, University of Ottawa Mingli Liu
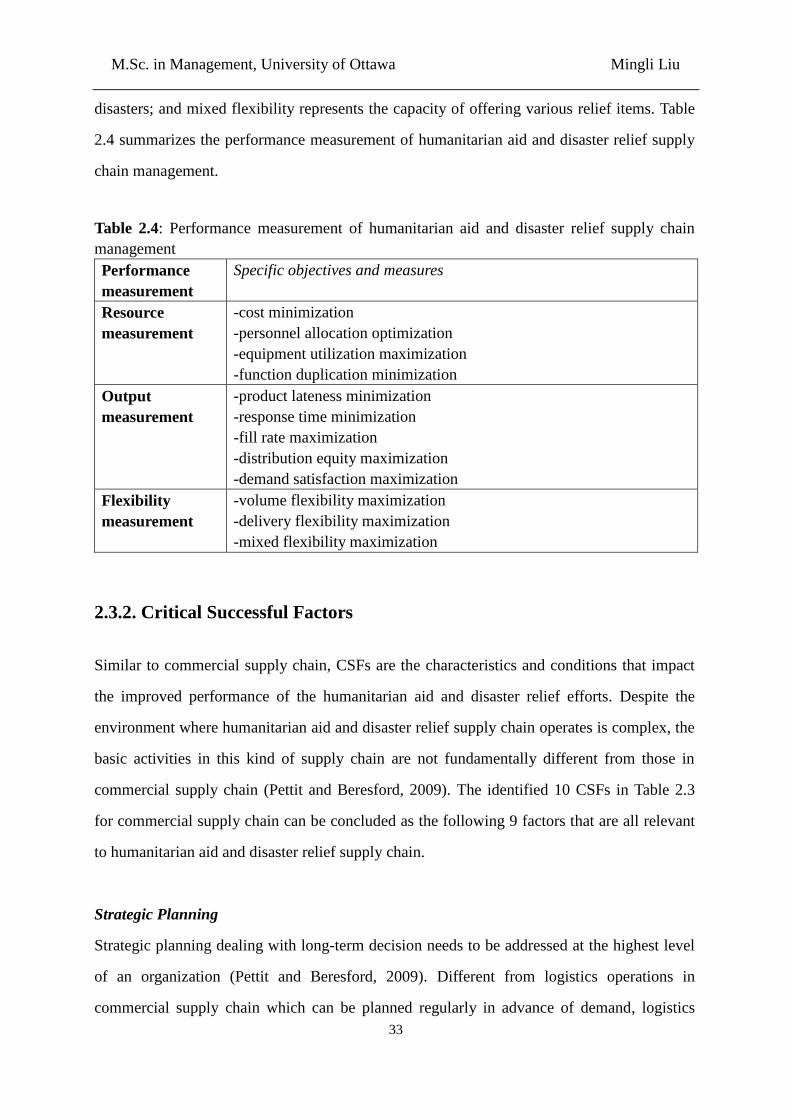
33
disasters; and mixed flexibility represents the capacity of offering various relief items. Table
2.4 summarizes the performance measurement of humanitarian aid and disaster relief supply
chain management.
Table 2.4: Performance measurement of humanitarian aid and disaster relief supply chain
management
Performance
measurement
Specific objectives and measures
Resource
measurement
-cost minimization
-personnel allocation optimization
-equipment utilization maximization
-function duplication minimization
Output
measurement
-product lateness minimization
-response time minimization
-fill rate maximization
-distribution equity maximization
-demand satisfaction maximization
Flexibility
measurement
-volume flexibility maximization
-delivery flexibility maximization
-mixed flexibility maximization
2.3.2. Critical Successful Factors
Similar to commercial supply chain, CSFs are the characteristics and conditions that impact
the improved performance of the humanitarian aid and disaster relief efforts. Despite the
environment where humanitarian aid and disaster relief supply chain operates is complex, the
basic activities in this kind of supply chain are not fundamentally different from those in
commercial supply chain (Pettit and Beresford, 2009). The identified 10 CSFs in Table 2.3
for commercial supply chain can be concluded as the following 9 factors that are all relevant
to humanitarian aid and disaster relief supply chain.
Strategic Planning
Strategic planning dealing with long-term decision needs to be addressed at the highest level
of an organization (Pettit and Beresford, 2009). Different from logistics operations in
commercial supply chain which can be planned regularly in advance of demand, logistics
M.Sc. in Management, University of Ottawa Mingli Liu
34
decisions in humanitarian aid and disaster relief supply chain have to be made within short
time frames (Balcik and Beamon, 2008). The assessment and planning for the Asian Tsunami
were insufficient in many organizations, causing problems in the performance of an effective
response (Fritz Institute, 2005). Thus, they need long-term scheduling to realize a
high-performance disaster response. Below the organizational level, strategic planning deals
with critical attributes related to various stages of disaster planning (Pettit and Beresford,
2009). Resources and capacities are varied in three phases: preparation, immediate response,
and reconstruction (Kovacs and Spens, 2007). Organizations that will be involved vary from
stage to stage. Hence, strategic planning requirements will be different in each phase. Overall,
without it, it is improbable that individual aspects of a humanitarian aid and disaster relief
business, such as supply chain management, can be fully achieved (Pettit and Beresford,
2009).
Inventory Management
There are two kinds of systems in supply chain: push system and pull system. Push system
means that suppliers produce products according to the prediction of customers’ demands; in
contrast, pull system entails that real customers’ demands simulate the producing of final
products (Zhang, 2013). Inventory is controlled by pull system in commercial context to
decrease inventory, while it is pushed into strategic storage locations before pull system is
implemented to reach the precise area of need in humanitarian aid and disaster relief
circumstance (Clay Whybark, 2007). A variety of methods have been used in commercial
organizations to optimize their resource utilization. Some of them may be proper for
humanitarian aid and disaster relief, such as just-in-time, vendor-managed inventory. Time is
one of the most important factors in any humanitarian aid and disaster relief operation. In
order to offer humanitarian aid and disaster relief rapidly, we need logistics capabilities to
deliver them to where they are needed as soon as possible (Clay Whybark, 2007). Therefore,
pre-positioning – the storage of inventory at or near disaster location for seamless delivery of
critical goods – plays a critical role in inventory process (Ukkusuri and Yushimoto, 2008).
Besides, developing a collaborative warehouse network (Fritz Institute, 2005) which is
supported by transportation capacity can also save time.
M.Sc. in Management, University of Ottawa Mingli Liu
35
Transportation Planning
In commercial circumstance, the fleet of vehicles is stable and the primary infrastructure over
which to operate is good (Kovacs and Spens, 2007). On the contrary, there is often
destabilised infrastructure and the fleet has to be organized at the disaster location from
available resources in humanitarian aid and disaster relief situation (Kovacs and Spens, 2007).
In the disaster area, physical infrastructures including bridges, roads, railways, and airports
are often destroyed. Transportation capacity becomes limited or even non-existent (Thomas
and Kopczak, 2005). A full range of delivery choices are needed including sea, road, and air.
Hence, the planning of transportation and delivery in preparedness phase is important in
humanitarian aid and disaster relief.
Participative Management
The effectiveness and capacity of distributing relief aid of an organization is impacted on by
how it organizes its staff (Pettit and Beresford, 2009; Thomas and Kopczak, 2005). However,
people in humanitarian organizations come from diverse background and most of them with
logistics responsibilities do not have training in logistics (Thomas and Kopczak, 2005). A
survey following the Asian Tsunami shows that 88% of organizations have to reallocate their
most experienced logisticians from other assignments to staff the relief efforts (Fritz Institute,
2005). The professionalization of logistics is not smooth because field experience may be
more meaningful than formal training (Thomas and Kopczak, 2005). Since the availability of
trained logistics professionals to promote effective humanitarian aid response is important,
there is a need to create a pool of trained and experienced logistics professionals – who share
common processes, standardization, and vocabulary – at international, national, and local
level to be deployed on short notice (Fritz Institute, 2005; Thomas and Kopczak, 2005).
Supply Chain Strategy
In commercial supply chain, researchers pay attention to lean logistics and agile logistics.
Leanness entails establishing a value stream to remove waste including time and to enable a
level schedule (Naylor et al., 1999). Agility means using market knowledge and virtual
companies to develop profitable chances in an unstable marketplace (Naylor et al., 1999). It is
M.Sc. in Management, University of Ottawa Mingli Liu
36
important to identify the most proper concepts from established commercial supply chain
frameworks (Pettit and Beresford, 2009) and then use them to improve the performance of
humanitarian aid and disaster relief. Lean thinking paradigm suggests doing more with less.
This concept is suitable for situations with stable demand, low variety, and high volume
(Christopher, 2000). Thus, it is difficult to apply lean concept to humanitarian aid and disaster
relief environment. In contrast, the key of agility is the flexibility in responding quickly to
changes in demand in terms of variety and volume (Christopher, 2000). It is helpful to
improve the demand satisfaction in humanitarian aid and disaster relief supply chain
performance. Nevertheless, an agile supply chain is less cost effective than a lean one.
Therefore, some researchers also try to combine these two concepts into leagility (Naylor et
al., 1999), aiming to bring the advantages of lean and agile supply chain together. Besides,
outsourcing non-core activities like just-in-time may also be a useful strategy (Razzaque and
Sheng, 1998).
Information Management and Technology Utilization
In the general supply chain context, information management and technology utilization are
often regarded as enablers for knowledge management in an organization (Wong, 2005).
Similarly, they play an important role in humanitarian aid and disaster relief environment. It
is because the use of information systems to track and trace relief items helps improve the
effectiveness of aid delivery and waste minimization (Fiedrich et al., 2000; Pettit and
Beresford, 2009). In addition, specific communication systems and decision support systems
are also critical in handling relief operations (Pettit and Beresford, 2009). For example,
geographical information systems can help analyze transportation lifelines, map resources,
and identify highly damaged areas (Fiedrich et al., 2000). SUMA system can assist in
classification of available resources (PAHO/WHO, 2001). However, supply chain
management in humanitarian aid and disaster relief sector is still largely manual (Lee and
Zbinden, 2003; Thomas and Kopczak, 2005). Only 26% of organizations have access to track
and trace software (Fritz Institute, 2005). Therefore, there is a common need for developing
flexible technology solutions to support procurement, tracking and tracing inventory,
distribution through a pipeline, robust reporting and connectivity in the field (Fritz Institute,
M.Sc. in Management, University of Ottawa Mingli Liu
37
2005). Moreover, advanced information systems can form a foundation for knowledge
management, performance measurement, and organization learning (Thomas and Kopczak,
2005). Overall, four major functions must be included in humanitarian logistics software:
mobilization, procurement, transportation and tracking, as well as reports (Lee and Zbinden,
2003).
Relationship Development
In the immediate response to Asian Tsunami, a considerable inter-organization conflict
existed and it was not until this addressed that improved collaborative was achieved (Pettit
and Beresford, 2009). This is an example revealing the fact that poor collaboration will affect
many other success factors such as inventory management, transportation planning, and
capacity planning. Thus, building relationship by collaboration is a key factor in best supply
chain practice and in logistics network integration (Power et al., 2001). According to Fritz
Institute (2005), the result is overall positive once collaboration happens. For example,
collaborative warehousing strategy can make relief provision more effective and therefore
save more people. Moreover, relationship is built on the basis of trust and it needs to be
established quickly in sudden onset disasters. Therefore, the development of swift trust is a
significant enabler which means “the willingness to rely upon team members to perform their
formal and informal roles in a hastily formed temporary team” (Zolin, 2002, p.4).
Capacity Planning
Capacity planning is influenced by demand and has an effect on decisions about numbers of
warehouses, distribution centres, vehicles, employees, and other equipment (Pettit and
Beresford, 2009). Four key activities which can affect capacity are warehousing, transporting,
material handling, and personnel resources (Gunasekaran and Ngai, 2003). Maximizing the
use of capacity is a key to humanitarian aid and disaster relief supply chain management
(Gunasekaran and Ngai, 2003). Generally speaking, capacity planning of aid and relief
network can be enhanced by collaboration. Also, capacity planning can involve the ability of
ports and airports to hold relief items under different scenarios (Pettit and Beresford, 2009).
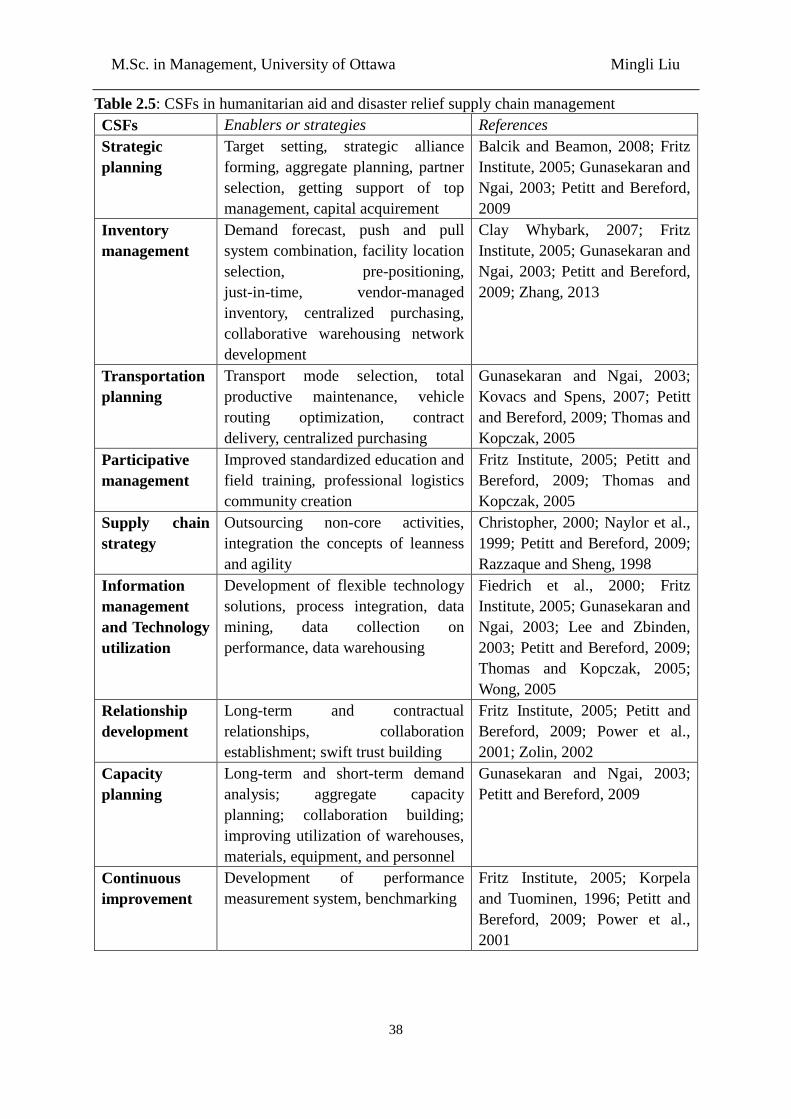
M.Sc. in Management, University of Ottawa Mingli Liu
38
Table 2.5: CSFs in humanitarian aid and disaster relief supply chain management
CSFs Enablers or strategies References
Strategic
planning
Target setting, strategic alliance
forming, aggregate planning, partner
selection, getting support of top
management, capital acquirement
Balcik and Beamon, 2008; Fritz
Institute, 2005; Gunasekaran and
Ngai, 2003; Petitt and Bereford,
2009
Inventory
management
Demand forecast, push and pull
system combination, facility location
selection, pre-positioning,
just-in-time, vendor-managed
inventory, centralized purchasing,
collaborative warehousing network
development
Clay Whybark, 2007; Fritz
Institute, 2005; Gunasekaran and
Ngai, 2003; Petitt and Bereford,
2009; Zhang, 2013
Transportation
planning
Transport mode selection, total
productive maintenance, vehicle
routing optimization, contract
delivery, centralized purchasing
Gunasekaran and Ngai, 2003;
Kovacs and Spens, 2007; Petitt
and Bereford, 2009; Thomas and
Kopczak, 2005
Participative
management
Improved standardized education and
field training, professional logistics
community creation
Fritz Institute, 2005; Petitt and
Bereford, 2009; Thomas and
Kopczak, 2005
Supply chain
strategy
Outsourcing non-core activities,
integration the concepts of leanness
and agility
Christopher, 2000; Naylor et al.,
1999; Petitt and Bereford, 2009;
Razzaque and Sheng, 1998
Information
management
and Technology
utilization
Development of flexible technology
solutions, process integration, data
mining, data collection on
performance, data warehousing
Fiedrich et al., 2000; Fritz
Institute, 2005; Gunasekaran and
Ngai, 2003; Lee and Zbinden,
2003; Petitt and Bereford, 2009;
Thomas and Kopczak, 2005;
Wong, 2005
Relationship
development
Long-term and contractual
relationships, collaboration
establishment; swift trust building
Fritz Institute, 2005; Petitt and
Bereford, 2009; Power et al.,
2001; Zolin, 2002
Capacity
planning
Long-term and short-term demand
analysis; aggregate capacity
planning; collaboration building;
improving utilization of warehouses,
materials, equipment, and personnel
Gunasekaran and Ngai, 2003;
Petitt and Bereford, 2009
Continuous
improvement
Development of performance
measurement system, benchmarking
Fritz Institute, 2005; Korpela
and Tuominen, 1996; Petitt and
Bereford, 2009; Power et al.,
2001
M.Sc. in Management, University of Ottawa Mingli Liu
39
Continuous Improvement
In supply chain management, organizations need to concentrate on having a continuous and
holistic improvement method to meet the demands of customers (Power et al., 2001).
Performance measurement is useful in this process, tracking key factors in supply chain
performance and benchmarking its activities against key performance indicators (Koeprla and
Tuominen, 1996). Humanitarian aid and disaster relief supply chain can learn from this
process to improve itself and achieve greater success. Continuous improvement such as
transformational or incremental change is an essential part of disaster management practices
at all levels to minimize the recurrence of problems (Government of Canada, 2011a). After a
disaster happens, a systematic method can be used to learn lessons from the experience, to
increase effectiveness, and to improve disaster management practices and processes
(Government of Canada, 2011a). For instance, using information technology performance
measurement system can evaluate the overall effectiveness of the supply chain (Fritz Institute,
2005).
Taking above mention into consideration, the 9 CSFs in humanitarian aid and disaster relief is
listed in Table 2.5. In particular, specific strategies which can help achieve each factor are
classified and summarized.
2.3.3. Inventory Prepositioning
Planning disaster relief inventories of supplies is challenging. On the one hand, organizations
may experience stock-out for responding to demand surge without enough inventory. On the
other hand, large amount of excess inventory can be commonplace due to an inactive period
of disasters. Within disaster preparedness phase, facility location and stock prepositioning
decision are two important parts requiring long-term planning to achieve a high-performance
disaster response (Balcik and Beamon, 2008). Recently, some humanitarian aid and disaster
relief organizations have pre-positioned relief items in strategic locations to improve their
ability of delivering sufficient items in a short period. Although much literature is available
M.Sc. in Management, University of Ottawa Mingli Liu
40
on enterprise inventories, there is little research of humanitarian aid and disaster relief
inventories (Beamon and Balcik, 2006a; Clay Whybark, 2007). An exception exists in health
service area, for example, Bechtel et al. (2000) explore how to manage disaster relief
inventories of blood, medicine, and medical supplies.
Different kinds of relief items are needed at different time, thus, some of them which are
immediately needed during the earliest phases of relief operations should be pre-positioned;
while those which can be safely provided in later phases can be postponed. Prepositioned
items include food items such as ready-to-eat meals; non-food items such as blankets, tents
and jerry cans; medical supplies; as well as equipment such as telecommunication equipment
(Balcik and Beamon, 2008). The prepositioning system should keep balance between costs
against risks in humanitarian aid supply chain and maximize the benefits to affected
population (Balcik and Beamon, 2008).
Inventory prepositioning theory includes two broad categories: one is inventory theory which
appraises stock level needed at various nodes along a supply chain; the other one is related to
facility location which uses facility location model to identify optimal locations for stocks
(Ukkusuri and Yushimito, 2008).
Inventory Theory
Generally, research on humanitarian aid and disaster relief concentrates on solving decision
problems from the view of non-government and not-for-profit organizations, leaving out the
for-profit, private sector organizations. For example, Beamon and Kotleba (2006a) build a
stochastic single-item multi-supplier inventory management model to determine optimal
order quantities and reorder points. Their analysis depends on a case study of a single
humanitarian organization operating a pre-positioned warehouse in Lockichoggio, Kenya and
responding to south Sudan crisis.
Similarly, Beamon and Kotleba (2006b) build three single-item inventory management
models for pre-positioned stocks supporting long-term relief response in south Sudan: (a) a
M.Sc. in Management, University of Ottawa Mingli Liu
41
mathematical model optimizing reorder quantity and level according to the costs of
reordering, holding, and backorder; (b) a heuristic model deciding reorder quantity based on
reordering and holding costs; and (c) a naïve model relies on convenience and
implementation ease. Then, a humanitarian relief simulation model and a relief-specific
performance measurement system are proposed. According to their analysis, they identify the
factors important to the performance of inventory system. Additional details and analysis
about the first model has been demonstrated in Beamon and Kotleba (2006a).
The previous two papers of Beamon and Kotleba are from the perspective of an NGO
focusing on long-term humanitarian aid and disaster relief operations. Some other research
just pays attention to for-profit and private sector organizations particularly. Using a
newsvendor-type of analysis, Lodree and Taskin (2008) model the uncertainty of a potential
threat to identify proper inventory levels. They develop variations to classical newsvendor
solution to plan the inventory for initial disaster response. They build an insurance policy
framework to prepare for demand surge caused by potential disaster relief activities or supply
chain disruption in the context of inventory control. However, they do not take the facility
location and the possibility of inventory being destroyed into account.
Lodree and Taskin (2009) formulate the inventory control problem as an optimal stopping
problem with Bayesian updates for a single-supplier, single-retailer supply chain. They
include an unofficial hurricane prediction model introduced by the authors. They present a
method to determine when to order and how much to order non-priority product by a
manufacturer. They still do not consider location decisions.
Taskin and Lodree (2010) formulate a stochastic programming model to specify cost
minimizing inventory strategies for meeting demands which happen prior to the hurricane
season and preparing for potential demand surge during the season. Particularly, they consider
the information updating problem which is similar to Advance Booking Discount program in
commercial supply chain. They propose that decision makers can modify inventory policy
based on updated hurricane season demand information and when pre-season demand
M.Sc. in Management, University of Ottawa Mingli Liu
42
realizations happen.
Taskin and Lodree (2011) build a sequential Bayesian decision model to help private sector
manufacturing firm to minimize expected costs of inventory control in response to an
observed tropical cyclone. They deal with a single-supplier, multi-retailer supply chain
system with a random demand at each retailer location. They include an official hurricane
prediction model used by the National Hurricane Centre (NHC).
Different from all the above studies, models built by some research can be applied to both
not-for-profit and for-profit organizations. For example, Ozbay and Ozguven (2007) develop
a realistic model of time-dependent inventory planning and management problem which can
be used for developing efficient pre- and post-disaster plans. Their model aims to determine
the minimal safety stock level while allowing a continuous consumption without disruption.
Facility Location
Inventory management involves three basic questions: how much to order, when to order, and
where to store it. In disaster relief inventory area, the question of where to store inventories is
more critical (Clay Whybark, 2007). Dekle et al. (2005) test where to locate Disaster
Recovery Centres (DRCs) for a single county in Florida. First, a standard set-covering model
is built. Then, other site locations are identified close to those chosen by the set-covering
model. Still, no inventory decisions are considered.
Campbell and Jones (2011) point out that inventory and facility locations are intertwined,
while all research mentioned above just concentrate on inventory control strategy. Not a few
studies integrate facility location decision into inventory control problem. Chang et al. (2007)
propose two stochastic programming models to help government departments to make
decisions for urban flood emergency logistics preparation, including locations of relief items
storehouse, required quantities and distribution of relief equipment. They study how to
optimize the expected performances in all scenarios and combine scenario planning with
flood emergency logistics preparation modeling. However, they do not consider the vehicle
M.Sc. in Management, University of Ottawa Mingli Liu
43
scheduling problem.
Balcik and Beamon (2008) build a mathematical model which is a variant of the maximal
covering location model. They combine facility location and inventory prepositioning
together, deciding the number and location of the warehouses first, and then determining the
amount of relief items to be stocked in each warehouse. Their model provides an integrated
global stock prepositioning system for humanitarian aid and disaster relief supply chain
responding to sudden-onset disasters. However, in their model, they assume that multiple
disasters will not happen simultaneously and they do not consider the possibility of inventory
being destroyed.
Closely related to Balcik and Beamon (2008), Duran et al. (2011) build a mixed integer
programming inventory location model for CARE to decide the optimal number and location
of pre-positioning warehouses as well as quantity of inventory in each warehouse.
Nevertheless, their study has two differences: one is they let multiple events happen during a
replenishment period, the other is they allow the probability of demand for every item to rely
on local conditions and natural disaster type.
Based on the dynamic hurricane information, Salas et al. (2012) starts from building a
stochastic programming inventory model of perishable products for government or non-profit
organizations to minimize costs and maximize demands satisfaction. Then they propose a
process to transform this model into a deterministic mixed integer programming model.
Most research in humanitarian context determines location decisions and stocking levels
aiming to minimizing some goals within limited scenarios, while research of Campbell and
Jones (2011) is the first one to consider both inventory level and risk without using scenarios.
They explore where to pre-position relief items in preparation for a disaster and how much to
pre-position at each location. However, they assume that the destruction probability of each
facility location is independent.
M.Sc. in Management, University of Ottawa Mingli Liu
44
2.3.4. Transportation Planning
Transportation is the second largest overhead cost to humanitarian aid and disaster relief
operations after personnel (Pedraza Martines et al., 2011). Main operational decisions on
transportation involve allocation of relief supply, planning of vehicle delivery, and scheduling
of vehicle routing (Balcik et al., 2008). The Asian Tsunami in 2004 led to the public
acknowledgement of the role of logistics in effective relief efforts (Fritz Institute, 2005;
Thomas and Kopczak, 2005). Specifically speaking, the total number of cargo-laden
humanitarian flights overwhelmed the ability of handling goods at the airport in Sri Lanka,
and transportation pipelines were bottlenecked in India. “Last mile” challenges were
experienced during the transportation of humanitarian goods to less developed regions of the
world. Thus, improving the distribution of relief items effectively is a key point in
humanitarian aid and disaster relief.
As early as the year of 1988, Knott (1988) conducts a research focusing on the last mile
delivery of multiple food stocks from distribution centres to various camps which they are
responsible for. The author proposes a knowledge-based approach to schedule vehicles,
combining Operations Research heuristics with Artificial Intelligence techniques. The
knowledge bases include information on camps that will be supplied, types of trucks,
individual trucks available to planner, and types of relief items to be supplied. The program
proposed by the author is able to deal with several operations, including various vehicle types
and capabilities, some discrete truck fleets, a variety of relief items, different types of roads
and terrains, as well as changeable priorities for different consignments.
However, the relief items include not only food, but also some other different commodities
(food, clothing, medical supplies, relief personnel). The transportation of relief items and
relief personnel needs to be done efficiently to minimize operation costs and maximize the
survival rate of affected people. There are plenty of transportation modes, but they all may
not be proper for every commodity. Thus, Haghani and Oh (1996) propose a
multi-commodity, multi-modal network flow problem with time windows as a single
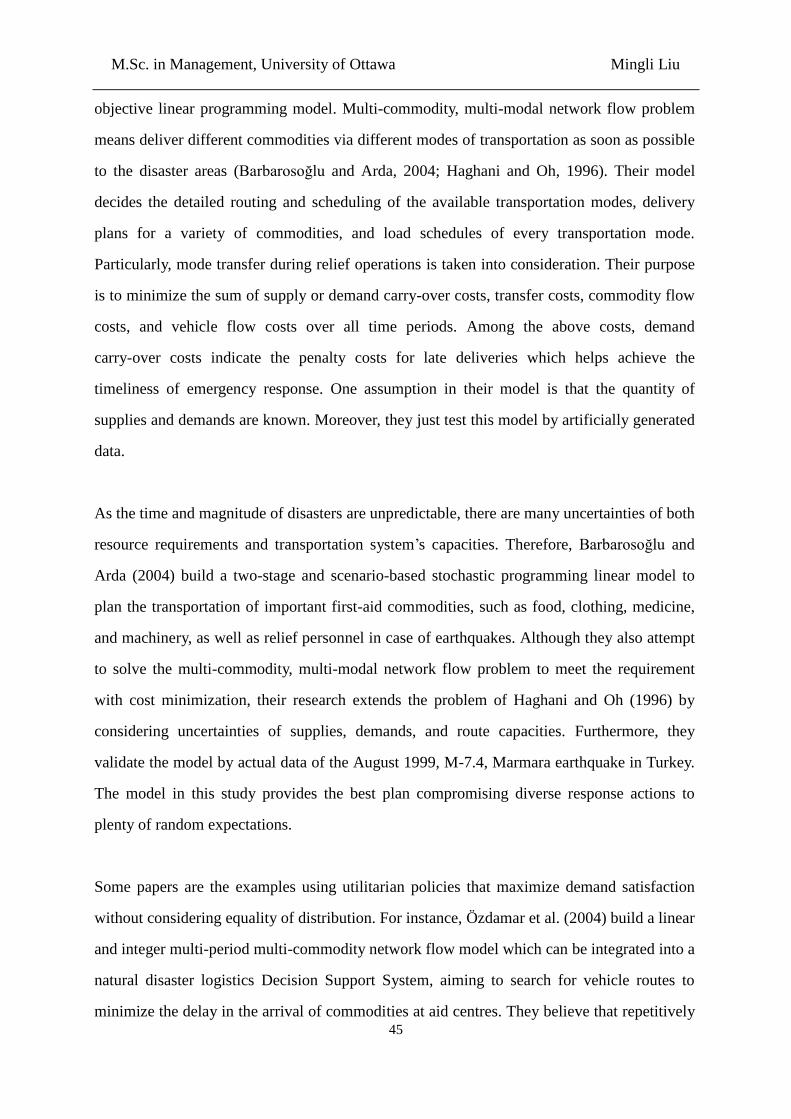
M.Sc. in Management, University of Ottawa Mingli Liu
45
objective linear programming model. Multi-commodity, multi-modal network flow problem
means deliver different commodities via different modes of transportation as soon as possible
to the disaster areas (Barbarosoğlu and Arda, 2004; Haghani and Oh, 1996). Their model
decides the detailed routing and scheduling of the available transportation modes, delivery
plans for a variety of commodities, and load schedules of every transportation mode.
Particularly, mode transfer during relief operations is taken into consideration. Their purpose
is to minimize the sum of supply or demand carry-over costs, transfer costs, commodity flow
costs, and vehicle flow costs over all time periods. Among the above costs, demand
carry-over costs indicate the penalty costs for late deliveries which helps achieve the
timeliness of emergency response. One assumption in their model is that the quantity of
supplies and demands are known. Moreover, they just test this model by artificially generated
data.
As the time and magnitude of disasters are unpredictable, there are many uncertainties of both
resource requirements and transportation system’s capacities. Therefore, Barbarosoğlu and
Arda (2004) build a two-stage and scenario-based stochastic programming linear model to
plan the transportation of important first-aid commodities, such as food, clothing, medicine,
and machinery, as well as relief personnel in case of earthquakes. Although they also attempt
to solve the multi-commodity, multi-modal network flow problem to meet the requirement
with cost minimization, their research extends the problem of Haghani and Oh (1996) by
considering uncertainties of supplies, demands, and route capacities. Furthermore, they
validate the model by actual data of the August 1999, M-7.4, Marmara earthquake in Turkey.
The model in this study provides the best plan compromising diverse response actions to
plenty of random expectations.
Some papers are the examples using utilitarian policies that maximize demand satisfaction
without considering equality of distribution. For instance, Özdamar et al. (2004) build a linear
and integer multi-period multi-commodity network flow model which can be integrated into a
natural disaster logistics Decision Support System, aiming to search for vehicle routes to
minimize the delay in the arrival of commodities at aid centres. They believe that repetitively
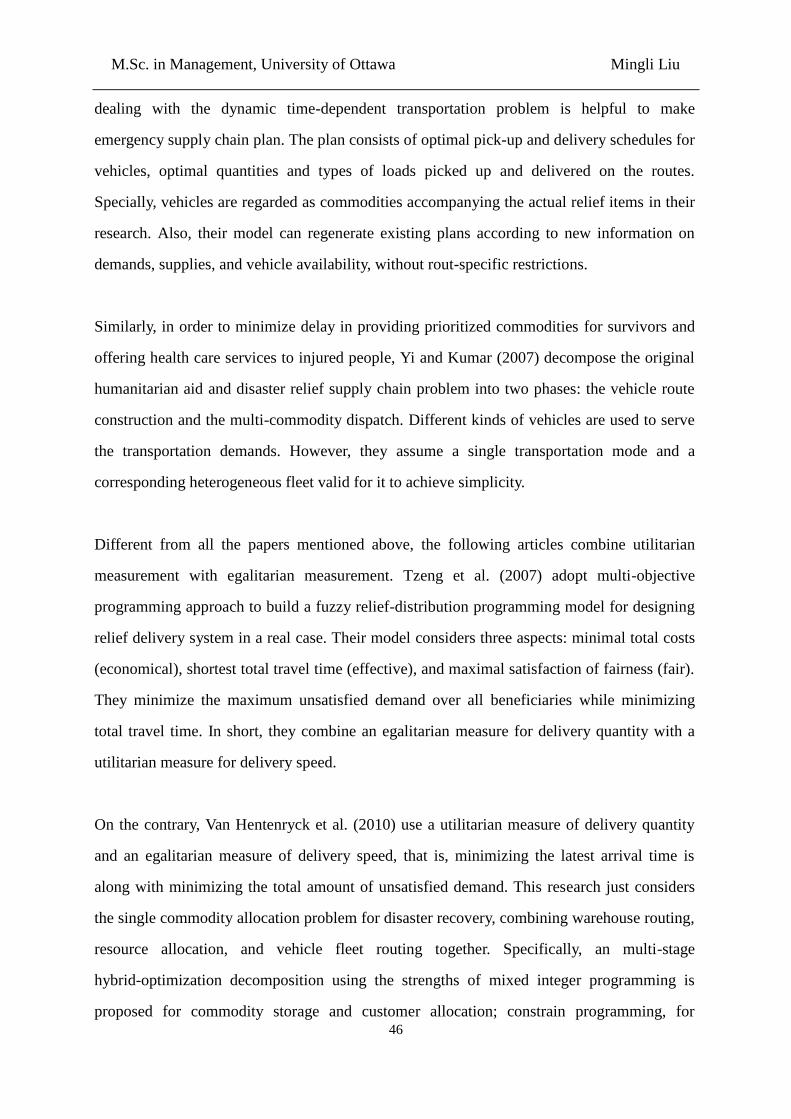
M.Sc. in Management, University of Ottawa Mingli Liu
46
dealing with the dynamic time-dependent transportation problem is helpful to make
emergency supply chain plan. The plan consists of optimal pick-up and delivery schedules for
vehicles, optimal quantities and types of loads picked up and delivered on the routes.
Specially, vehicles are regarded as commodities accompanying the actual relief items in their
research. Also, their model can regenerate existing plans according to new information on
demands, supplies, and vehicle availability, without rout-specific restrictions.
Similarly, in order to minimize delay in providing prioritized commodities for survivors and
offering health care services to injured people, Yi and Kumar (2007) decompose the original
humanitarian aid and disaster relief supply chain problem into two phases: the vehicle route
construction and the multi-commodity dispatch. Different kinds of vehicles are used to serve
the transportation demands. However, they assume a single transportation mode and a
corresponding heterogeneous fleet valid for it to achieve simplicity.
Different from all the papers mentioned above, the following articles combine utilitarian
measurement with egalitarian measurement. Tzeng et al. (2007) adopt multi-objective
programming approach to build a fuzzy relief-distribution programming model for designing
relief delivery system in a real case. Their model considers three aspects: minimal total costs
(economical), shortest total travel time (effective), and maximal satisfaction of fairness (fair).
They minimize the maximum unsatisfied demand over all beneficiaries while minimizing
total travel time. In short, they combine an egalitarian measure for delivery quantity with a
utilitarian measure for delivery speed.
On the contrary, Van Hentenryck et al. (2010) use a utilitarian measure of delivery quantity
and an egalitarian measure of delivery speed, that is, minimizing the latest arrival time is
along with minimizing the total amount of unsatisfied demand. This research just considers
the single commodity allocation problem for disaster recovery, combining warehouse routing,
resource allocation, and vehicle fleet routing together. Specifically, an multi-stage
hybrid-optimization decomposition using the strengths of mixed integer programming is
proposed for commodity storage and customer allocation; constrain programming, for
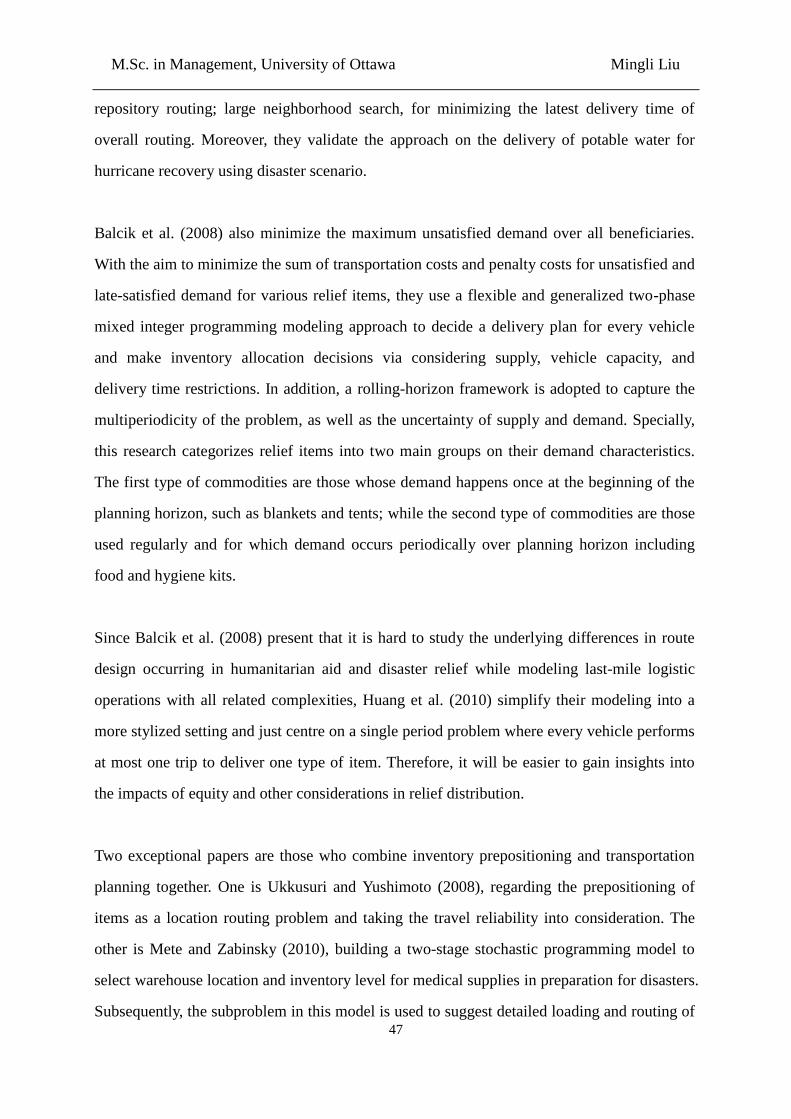
M.Sc. in Management, University of Ottawa Mingli Liu
47
repository routing; large neighborhood search, for minimizing the latest delivery time of
overall routing. Moreover, they validate the approach on the delivery of potable water for
hurricane recovery using disaster scenario.
Balcik et al. (2008) also minimize the maximum unsatisfied demand over all beneficiaries.
With the aim to minimize the sum of transportation costs and penalty costs for unsatisfied and
late-satisfied demand for various relief items, they use a flexible and generalized two-phase
mixed integer programming modeling approach to decide a delivery plan for every vehicle
and make inventory allocation decisions via considering supply, vehicle capacity, and
delivery time restrictions. In addition, a rolling-horizon framework is adopted to capture the
multiperiodicity of the problem, as well as the uncertainty of supply and demand. Specially,
this research categorizes relief items into two main groups on their demand characteristics.
The first type of commodities are those whose demand happens once at the beginning of the
planning horizon, such as blankets and tents; while the second type of commodities are those
used regularly and for which demand occurs periodically over planning horizon including
food and hygiene kits.
Since Balcik et al. (2008) present that it is hard to study the underlying differences in route
design occurring in humanitarian aid and disaster relief while modeling last-mile logistic
operations with all related complexities, Huang et al. (2010) simplify their modeling into a
more stylized setting and just centre on a single period problem where every vehicle performs
at most one trip to deliver one type of item. Therefore, it will be easier to gain insights into
the impacts of equity and other considerations in relief distribution.
Two exceptional papers are those who combine inventory prepositioning and transportation
planning together. One is Ukkusuri and Yushimoto (2008), regarding the prepositioning of
items as a location routing problem and taking the travel reliability into consideration. The
other is Mete and Zabinsky (2010), building a two-stage stochastic programming model to
select warehouse location and inventory level for medical supplies in preparation for disasters.
Subsequently, the subproblem in this model is used to suggest detailed loading and routing of
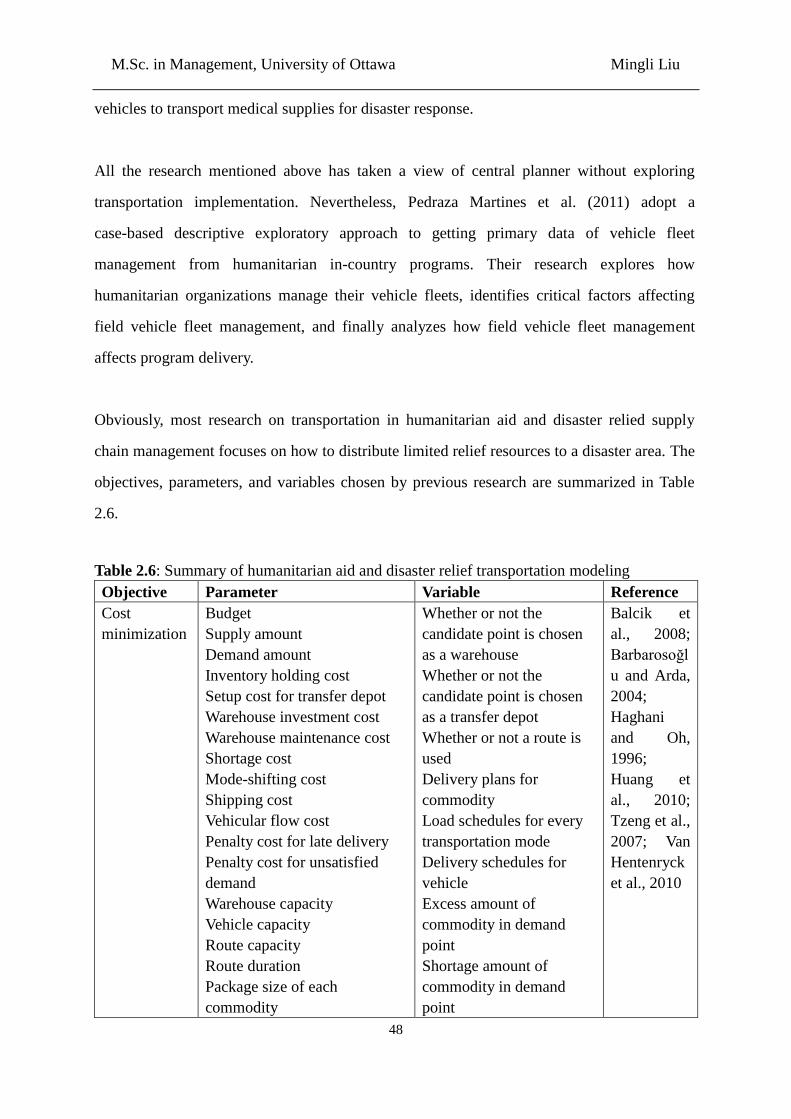
M.Sc. in Management, University of Ottawa Mingli Liu
48
vehicles to transport medical supplies for disaster response.
All the research mentioned above has taken a view of central planner without exploring
transportation implementation. Nevertheless, Pedraza Martines et al. (2011) adopt a
case-based descriptive exploratory approach to getting primary data of vehicle fleet
management from humanitarian in-country programs. Their research explores how
humanitarian organizations manage their vehicle fleets, identifies critical factors affecting
field vehicle fleet management, and finally analyzes how field vehicle fleet management
affects program delivery.
Obviously, most research on transportation in humanitarian aid and disaster relied supply
chain management focuses on how to distribute limited relief resources to a disaster area. The
objectives, parameters, and variables chosen by previous research are summarized in Table
2.6.
Table 2.6: Summary of humanitarian aid and disaster relief transportation modeling
Objective Parameter Variable Reference
Cost
minimization
Budget
Supply amount
Demand amount
Inventory holding cost
Setup cost for transfer depot
Warehouse investment cost
Warehouse maintenance cost
Shortage cost
Mode-shifting cost
Shipping cost
Vehicular flow cost
Penalty cost for late delivery
Penalty cost for unsatisfied
demand
Warehouse capacity
Vehicle capacity
Route capacity
Route duration
Package size of each
commodity
Whether or not the
candidate point is chosen
as a warehouse
Whether or not the
candidate point is chosen
as a transfer depot
Whether or not a route is
used
Delivery plans for
commodity
Load schedules for every
transportation mode
Delivery schedules for
vehicle
Excess amount of
commodity in demand
point
Shortage amount of
commodity in demand
point
Balcik et
al., 2008;
Barbarosoğl
u and Arda,
2004;
Haghani
and Oh,
1996;
Huang et
al., 2010;
Tzeng et al.,
2007; Van
Hentenryck
et al., 2010
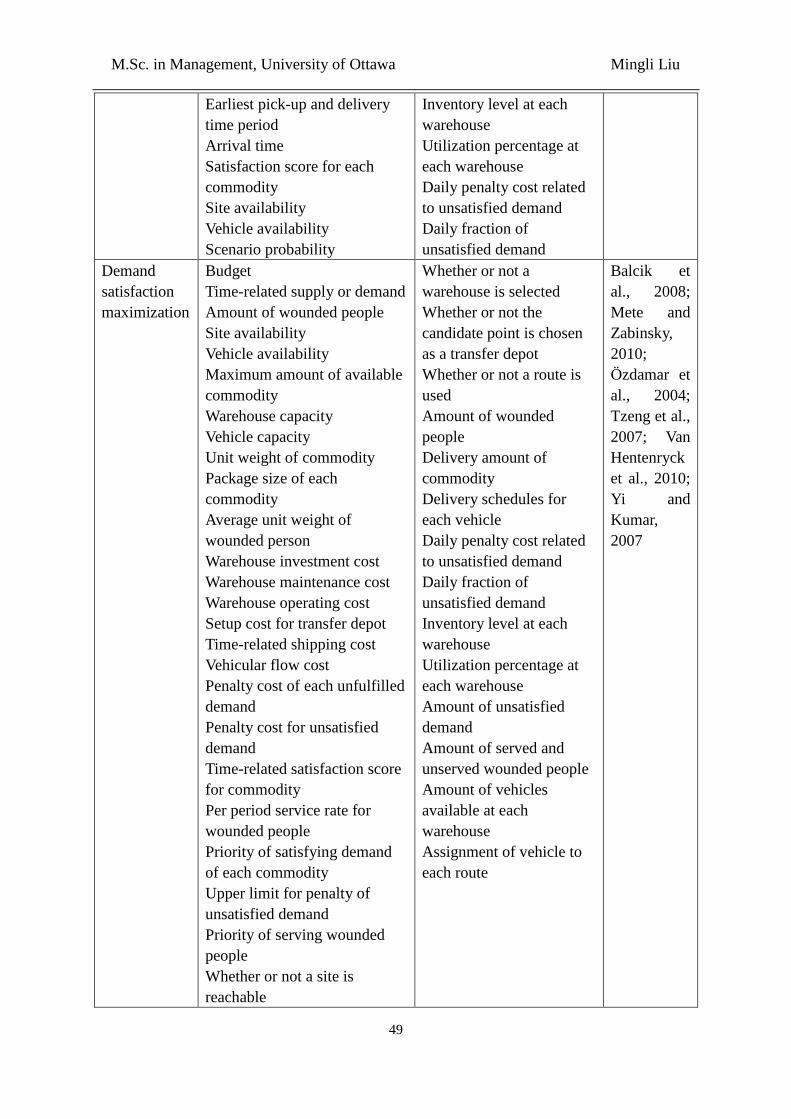
M.Sc. in Management, University of Ottawa Mingli Liu
49
Earliest pick-up and delivery
time period
Arrival time
Satisfaction score for each
commodity
Site availability
Vehicle availability
Scenario probability
Inventory level at each
warehouse
Utilization percentage at
each warehouse
Daily penalty cost related
to unsatisfied demand
Daily fraction of
unsatisfied demand
Demand
satisfaction
maximization
Budget
Time-related supply or demand
Amount of wounded people
Site availability
Vehicle availability
Maximum amount of available
commodity
Warehouse capacity
Vehicle capacity
Unit weight of commodity
Package size of each
commodity
Average unit weight of
wounded person
Warehouse investment cost
Warehouse maintenance cost
Warehouse operating cost
Setup cost for transfer depot
Time-related shipping cost
Vehicular flow cost
Penalty cost of each unfulfilled
demand
Penalty cost for unsatisfied
demand
Time-related satisfaction score
for commodity
Per period service rate for
wounded people
Priority of satisfying demand
of each commodity
Upper limit for penalty of
unsatisfied demand
Priority of serving wounded
people
Whether or not a site is
reachable
Whether or not a
warehouse is selected
Whether or not the
candidate point is chosen
as a transfer depot
Whether or not a route is
used
Amount of wounded
people
Delivery amount of
commodity
Delivery schedules for
each vehicle
Daily penalty cost related
to unsatisfied demand
Daily fraction of
unsatisfied demand
Inventory level at each
warehouse
Utilization percentage at
each warehouse
Amount of unsatisfied
demand
Amount of served and
unserved wounded people
Amount of vehicles
available at each
warehouse
Assignment of vehicle to
each route
Balcik et
al., 2008;
Mete and
Zabinsky,
2010;
Özdamar et
al., 2004;
Tzeng et al.,
2007; Van
Hentenryck
et al., 2010;
Yi and
Kumar,
2007
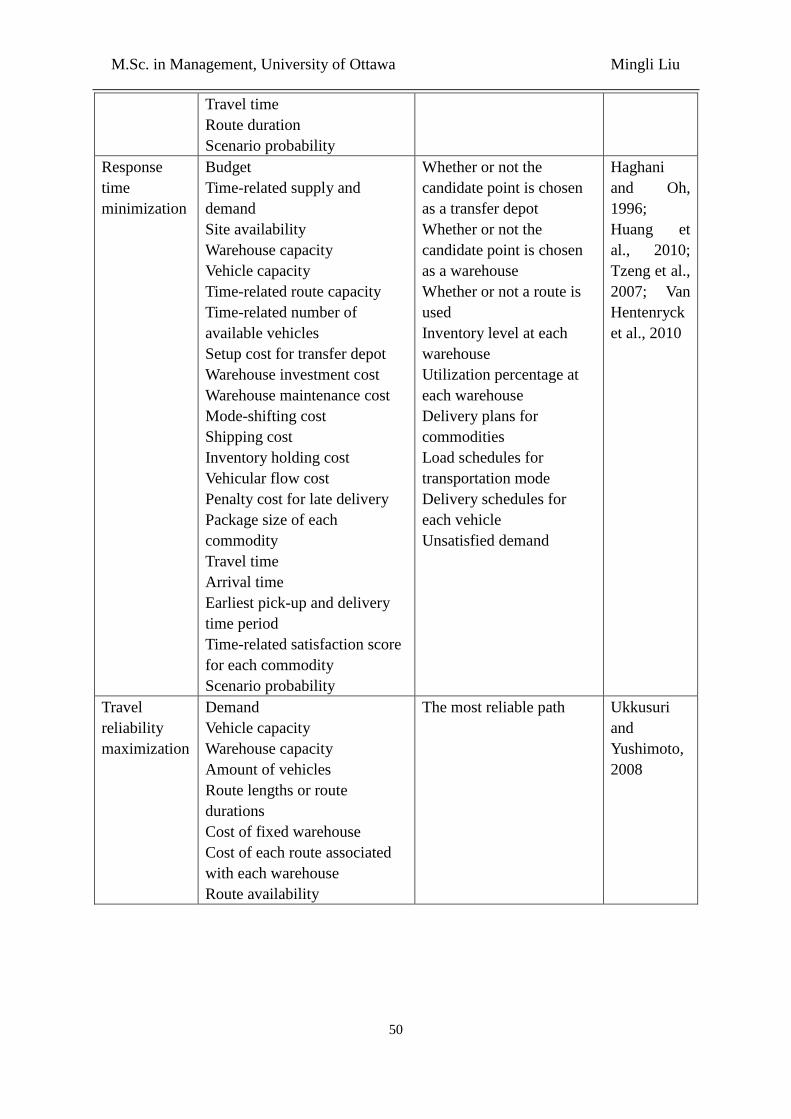
M.Sc. in Management, University of Ottawa Mingli Liu
50
Travel time
Route duration
Scenario probability
Response
time
minimization
Budget
Time-related supply and
demand
Site availability
Warehouse capacity
Vehicle capacity
Time-related route capacity
Time-related number of
available vehicles
Setup cost for transfer depot
Warehouse investment cost
Warehouse maintenance cost
Mode-shifting cost
Shipping cost
Inventory holding cost
Vehicular flow cost
Penalty cost for late delivery
Package size of each
commodity
Travel time
Arrival time
Earliest pick-up and delivery
time period
Time-related satisfaction score
for each commodity
Scenario probability
Whether or not the
candidate point is chosen
as a transfer depot
Whether or not the
candidate point is chosen
as a warehouse
Whether or not a route is
used
Inventory level at each
warehouse
Utilization percentage at
each warehouse
Delivery plans for
commodities
Load schedules for
transportation mode
Delivery schedules for
each vehicle
Unsatisfied demand
Haghani
and Oh,
1996;
Huang et
al., 2010;
Tzeng et al.,
2007; Van
Hentenryck
et al., 2010
Travel
reliability
maximization
Demand
Vehicle capacity
Warehouse capacity
Amount of vehicles
Route lengths or route
durations
Cost of fixed warehouse
Cost of each route associated
with each warehouse
Route availability
The most reliable path Ukkusuri
and
Yushimoto,
2008
M.Sc. in Management, University of Ottawa Mingli Liu
51
2.4. Community Relief Application
Since natural disasters can strike anywhere, regardless of location, history, or culture,
communities need to be well prepared for them. Thus, some research pays attention to
community relief application. For example, Mathbor (2007) studies the scope and prospect
for effective use of social capital in mitigating the results of natural disasters that hit coastal
regions. Particularly, he emphasizes social capital at three stages: linking within communities,
bridging communities, and connecting communities via ties with financial and public
institutions (governmental organizations, scientific organizations, United Nations,
international private organizations, foreign voluntary organizations, etc.).
2.4.1. Current Situation in Canada
Even though federal and provincial governments actively engage in emergency planning,
municipal government plays a central role in Canadian emergency management because
specific operational measures must be implemented locally (Henstra, 2011). Those
communities which are well-trained psychologically, socially, and culturally are better
prepared and more effective in response to the consequence of disasters (Mathbor, 2007).
Different communities face different hazards and vulnerabilities; thus, local officials are
arguably best positioned to decide the proper mix of preparedness measures (Henstra, 2011).
The Standing Senate Committee on National Security and Defence published a report of
emergency preparedness in Canada in 2008. Based on the testimony of over 110 witnesses
from 2001 to 2008 and 2 emergency preparedness surveys, the Committee has examined
Canadian governments’ efforts on improving the ability of disaster preparedness and response
(Government of Canada, 2008). In consequence, 12 problems of emergency preparedness in
the Canadian system can be improved: (1) lack of emergency management; (2) use of the
Canadian Forces for domestic emergencies; (3) hidden emergency caches; (4) lack of funding
for equipment and training; (5) poor collaboration among governments; (6) lessons learned
M.Sc. in Management, University of Ottawa Mingli Liu
52
not remembered and lack of leadership on best practices; (7) emergency public
communications; (8) lack of first responder interoperability; (9) first responders ignored; (10)
poor federal leadership on critical infrastructure protection; (11) emergency ad hockery; (12)
policy during emergencies (Government of Canada, 2008).
The Committee has suggested that Public Safety Canada should involve the Canadian Forces
Militia into the national inventory of emergency preparedness resources, as well as offer
details of the Militia’s assets and capabilities to first responders (Government of Canada,
2008). Good communication between local emergency management officials and the
Canadian Forces is beneficial, while only 32 percent of responding municipalities have
included the Canadian Forces Reserves in their emergency plans (Government of Canada,
2008). It is because any communications between municipalities and federal government
must trickle back and forth through provinces. According to the concept of Territorial
Defence Battalion Groups declared by the former Defence Minister Gordon O’Connor, these
units need to be located in 12 Canadian cities to be able to come to the rescue following
natural disasters (Government of Canada, 2008). In spite of this initial commitment, no
battalions have been established.
When it comes to inventory management, the Public Health Agency of Canada maintains a
National Emergency Stockpile System (NESS) consisting of a central depot in Ottawa, 8
warehouses, and 1,300 pre-positioned supply centres strategically located throughout Canada,
under the combined management of the provinces and federal government (PHAC, 2012). In
addition, pre-positioned supply centres have a mix of supplies relying on their locations and
anticipated disasters (PHAC, 2012). However, first responders usually do not know the
locations and contents of emergency cashes, and they have no input into what goes into the
vital cashes (Government of Canada, 2008). In reality, local responders are first on the scene
and operate without help from provincial or federal governments until they request assistance
(Government of Canada, 2008).
M.Sc. in Management, University of Ottawa Mingli Liu
53
2.4.2. Base Case Scenario
According to the statistics in Canadian Disaster Database, floods are the most costly natural
disasters in Canada in terms of property damage (Public Safety Canada, 2013). They can
happen in any region at any time of the year and have affected hundreds of thousands of
Canadians. Heavy precipitation on steep slopes of mountains in western Canada often causes
flooding; tropic storms and hurricanes in eastern Canada carry the risk of heavy rain; spring
ice break-up results in floods in most Yukon and Northwest Territories. In addition, there is
potential for floods in lots of urban areas since Canadian cities are developed along harbors,
rivers, and lakes due to the convenience of commerce and transportation. In recent history of
Canada, the worst floods are the Central and Southern Alberta flood in June 2013 and the
Manitoba’s Red River flood in May 1997 (Public Safety Canada, 2013). Thus, in order to
gain insight into current disaster management system in Canada, it is suitable to choose the
latest 2013 Alberta flood as the base case scenario.
In June 2013, Alberta was devastated by flooding with 31 communities directly affected and
nearly 120,000 people forced out of their homes (Government of Alberta, 2013b). According
to the day-by-day updated timeline recorded by Government of Alberta (2013b), the whole
process of humanitarian aid and disaster relief can be generalized as follows. A slow-moving
weather system in Saskatchewan attacked northern Alberta on June 8th
. Fort McMurray
declared an emergency state on June 11th
. On the same day, evacuation orders went into effect
and Alberta Health Services issued a boil water advisory. The rescue work did not stop until
flood warnings were downgraded to flood watches in the northeast on June 15th
. However,
torrential downpour started up against over southern Alberta on June 19th
. The immediate
response lasted from June 20th
to June 23rd
. During those four days, states of local emergency,
evacuations, and shelter in place orders were initiated in multiple communities. Key tasks
include setting up evacuation centres, evacuating affected people (distressed residents, acute
care patients, stranded travelers, etc.), delivering essential commodities (food, water, etc.), as
well as deploying relief staff (officials, doctors, volunteers, military personnel, etc.) and
vehicles. From June 23rd
up to now, recovery and reconstruction work continued.
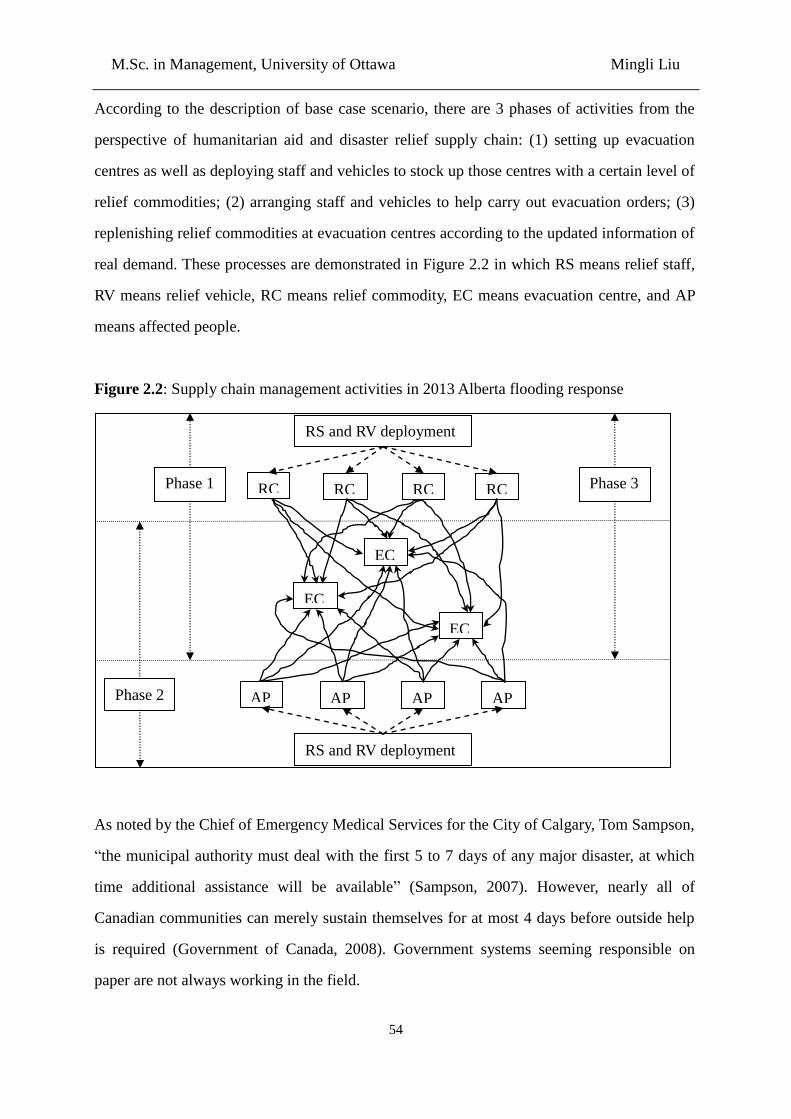
M.Sc. in Management, University of Ottawa Mingli Liu
54
According to the description of base case scenario, there are 3 phases of activities from the
perspective of humanitarian aid and disaster relief supply chain: (1) setting up evacuation
centres as well as deploying staff and vehicles to stock up those centres with a certain level of
relief commodities; (2) arranging staff and vehicles to help carry out evacuation orders; (3)
replenishing relief commodities at evacuation centres according to the updated information of
real demand. These processes are demonstrated in Figure 2.2 in which RS means relief staff,
RV means relief vehicle, RC means relief commodity, EC means evacuation centre, and AP
means affected people.
Figure 2.2: Supply chain management activities in 2013 Alberta flooding response
As noted by the Chief of Emergency Medical Services for the City of Calgary, Tom Sampson,
“the municipal authority must deal with the first 5 to 7 days of any major disaster, at which
time additional assistance will be available” (Sampson, 2007). However, nearly all of
Canadian communities can merely sustain themselves for at most 4 days before outside help
is required (Government of Canada, 2008). Government systems seeming responsible on
paper are not always working in the field.
RS and RV deployment
RS and RV deployment
RC RC RC RC
AP AP AP AP
EC
EC
EC
Phase 1 Phase 3
Phase 2
M.Sc. in Management, University of Ottawa Mingli Liu
55
2.5. Summary
At the highest level, a supply chain consists of two basic and integrated processes: (1)
production planning and inventory control process, (2) distribution and logistics process
(Beamon, 1998). They two interact with each other to produce an integrated supply chain.
The design and management of them can determine the extent to which the supply chain
works as a unit to meet the required performance objectives (Beamon, 1998).
The unpredictable nature of natural disasters and the large casualties at stake make supply
chain management be a key part of humanitarian aid and disaster relief operations. One
important issue in it is the agility in mobilizing resources and the effectiveness in distributing
them (Duran et al., 2011). In spite of its importance, research in this area is limited (Van
Wassenhove, 2006). Moreover, most research on humanitarian aid and disaster relief supply
chain focuses on how to distribute limited relief resources to a disaster area after a disaster
has happened (Chang et al., 2007). Thus, more attention needs to be paid on preparedness
phase because better preparation can also improve response performances.
Preparedness can be defined from different perspectives. When it comes to humanitarian aid
and disaster relief supply chain, preparedness is related to several logistics issues such as
facility location, inventory management, and transportation planning (Clay Whybark, 2007;
Duran et al., 2011). Studies in facility location in humanitarian aid and disaster relief context
concentrate on the spatial aspects of operations which investigate the impacts of geographical
location on costs and response time (Duran et al., 2011). Since the proposed research focuses
on inventory and transportation management, previous reviewed studies just include those
integrating facility location decisions into either of these two parts. Most of them conduct
research on a two-stage issue: warehousing location and stocking level (Balcik and Beamon,
2008; Campbell and Jones, 2011; Chang et al., 2007; Dekle et al., 2005; Duran et al., 2011;
Salas et al., 2012); or warehousing location and delivery plan (Mete and Zabinsky, 2010; Van
Hentenryck et al., 2010).
M.Sc. in Management, University of Ottawa Mingli Liu
56
Research in inventory management mainly addresses problems such as demand estimation,
purchasing quantity, order frequency, and stock level. Apart from the above papers which
consider facility location element in inventory prepositioning decision, some research just
focuses on inventory control (Beamon and Kotleba, 2006a; Beamon and Kotleba, 2006b;
Lodree and Taskin, 2008; Lodree and Taskin, 2009; Ozbay and Ozguven, 2007; Taskin and
Lodree, 2010; Taskin and Lodree, 2011).
Given the decisions on location and inventory, the next step is transporting items. Most of the
reviewed literature pays attention to the build humanitarian aid and disaster relief distribution
models. (Balcik et al., 2008; Barbarosoğlu and Arda, 2004; Haghani and Oh, 1996; Huang et
al., 2010; Knott, 1988; Mete and Zabinsky, 2010; Özdamar et al., 2004; Tzeng et al., 2007;
Ukkusuri and Yushimoto, 2008; Van Hentenryck et al., 2010; Yi and Kumar, 2007). Only
Pedraza Martines et al. (2011) use qualitative method to explore the practice of vehicle fleet
management in humanitarian organization.
Although studies summarized above pay attention to the operational logistical activities in
humanitarian aid and disaster relief supply chain, aiming to optimize the flow of supplies
through existing distribution network, little attention is paid to learning best practices from
commercial supply chain. Recently, an increasing number of research compares commercial
supply chain with humanitarian aid and disaster relief supply chain, and recognizes the
challenges and opportunities of applying supply chain management practices in commercial
situations to that in humanitarian aid and disaster relief context (Clay Whybark, 2007;
Oloruntoba and Gray, 2006; Pettit and Beresford, 2009; Thomas, 2007; Thomas and Kopczak,
2005; Van Wassenhove, 2006).
To start with, directly applying practices working well in commercial supply chain
management to humanitarian aid and disaster relief settings may be improper. It is because
the environment in which humanitarian aid and disaster relief supply chain operates is
extremely uncertain and dynamic. Its unique characteristics are as follows: (1) demand
unpredictability associated with type, time, location, and quantity; (2) sudden-occurring
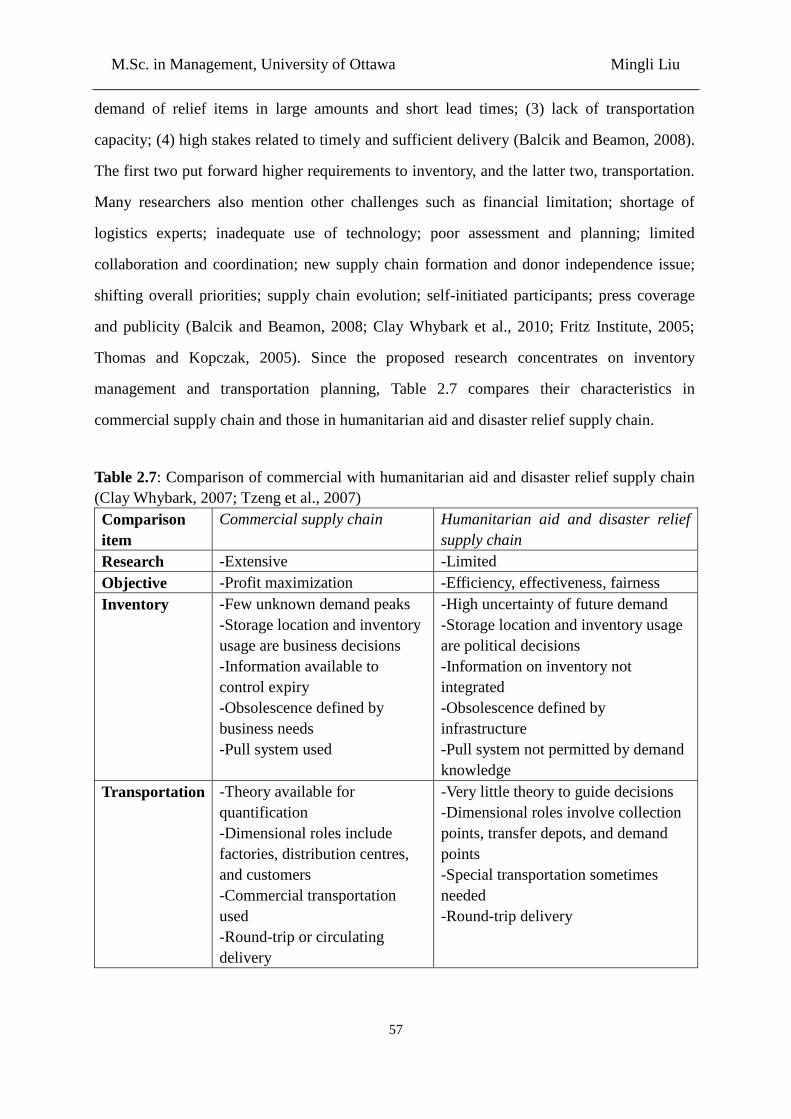
M.Sc. in Management, University of Ottawa Mingli Liu
57
demand of relief items in large amounts and short lead times; (3) lack of transportation
capacity; (4) high stakes related to timely and sufficient delivery (Balcik and Beamon, 2008).
The first two put forward higher requirements to inventory, and the latter two, transportation.
Many researchers also mention other challenges such as financial limitation; shortage of
logistics experts; inadequate use of technology; poor assessment and planning; limited
collaboration and coordination; new supply chain formation and donor independence issue;
shifting overall priorities; supply chain evolution; self-initiated participants; press coverage
and publicity (Balcik and Beamon, 2008; Clay Whybark et al., 2010; Fritz Institute, 2005;
Thomas and Kopczak, 2005). Since the proposed research concentrates on inventory
management and transportation planning, Table 2.7 compares their characteristics in
commercial supply chain and those in humanitarian aid and disaster relief supply chain.
Table 2.7: Comparison of commercial with humanitarian aid and disaster relief supply chain
(Clay Whybark, 2007; Tzeng et al., 2007)
Comparison
item
Commercial supply chain Humanitarian aid and disaster relief
supply chain
Research -Extensive -Limited
Objective -Profit maximization -Efficiency, effectiveness, fairness
Inventory -Few unknown demand peaks
-Storage location and inventory
usage are business decisions
-Information available to
control expiry
-Obsolescence defined by
business needs
-Pull system used
-High uncertainty of future demand
-Storage location and inventory usage
are political decisions
-Information on inventory not
integrated
-Obsolescence defined by
infrastructure
-Pull system not permitted by demand
knowledge
Transportation -Theory available for
quantification
-Dimensional roles include
factories, distribution centres,
and customers
-Commercial transportation
used
-Round-trip or circulating
delivery
-Very little theory to guide decisions
-Dimensional roles involve collection
points, transfer depots, and demand
points
-Special transportation sometimes
needed
-Round-trip delivery
M.Sc. in Management, University of Ottawa Mingli Liu
58
Despite not necessarily directly transferrable, many functions in commercial supply chain are
similar to those in humanitarian aid and disaster relief context. Thus, the important challenge
in real humanitarian aid and disaster relief situations is to recognize the most proper concepts
from established commercial frameworks and to refuse those inappropriate ones (Pettit and
Beresford, 2009). The proposed research will focus on how to help humanitarian aid and
disaster relief supply chains learn from commercial ones. Some concepts, such as agility and
leagility can be applied into humanitarian aid and disaster relief operations.
One typically example is about agility which is defined as “the ability to thrive and prosper in
an environment of constant and unpredictable change” (Maskell, 2001, p. 5). Applying it to
the context of humanitarian aid and disaster relief, it means that the supply chain needs to
handle the unstable nature of funding (Bennett and Kottasz, 2000), and to ensure rapid
deployment on demand (Van Wassenhove, 2006). Oloruntoba and Gray (2006) discuss the
extent to which certain concepts of agility in commercial supply chain can apply to
humanitarian aid and disaster relief. They build a model of an agile supply chain in
humanitarian aid and disaster relief. For inventory, there are two strategies: prepositioning
and postpone. Prepositioning is a type of advanced planning, meaning storing supplies at or
near the places where they are likely to be required (Oloruntoba and Gray 2006). On the
contrary, postponement aims to delay inventory commitment until receiving customer orders
(Bowersox and Gloss, 1996).
Overall, humanitarian aid and disaster relief supply chain can indirectly learn from existing
inventory and transportation theory in commercial supply chain (Clay Whybark, 2007): (1)
For acquisition, enterprises make the decision on the time and amount of ordering inventory
by the estimations of future demand, while this logic cannot be applied to disaster relief
inventory. Moreover, the ownership of relief inventory is decentralized. It is difficult to know
the aggregate disaster relief inventory. However, disaster relief inventory can learn from
medicine inventory, because the uncertainty of location and demand. (2) For storage,
choosing the location of relief inventory need to consider the time and cost of transportation
to demand area. Relief inventory can learn from commercial inventory – continuously
M.Sc. in Management, University of Ottawa Mingli Liu
59
monitoring time-dependent inventories such as food and medicine which have expiry dates,
as well as inventories subject to technological obsolescence such as medical and
communication equipment. (3) For distribution, relief inventory cannot use pull system in
commercial situation; instead, it has to be pushed out to the storage locations during disaster
planning activities.
In addition, research in humanitarian aid and disaster relief operations mainly concentrates on
strategic and operative planning issues, such as facility location planning, inventory planning,
vehicle routing, and delivery planning (Rottkemper et al., 2011). Maximum covering models,
various optimization methods, and network flow or shortest path models are adapted to solve
these problems respectively (Rottkemper et al., 2011). Nearly no research integrates these
issues together. One exception is the research of Ukkusuri and Yushimito (2008) which
regards the prepositioning of items as a location routing problem. The reliability of the
ground transportation network is included in their model. However, an integrated approach to
various logistics functions can make a distribution system efficient (Qu et al., 1999). Thus,
more research needs to consider the decisions of warehouse location, stock level, and
transport plan together.
According to Altay and Green (2006), there are three research methods in operations
management: model development, theory development, and application development. Studies
building an analytical model to solve a problem or to estimate an outcome are in the first
group. Articles testing hypotheses, exploring system behaviors, or developing a framework
and advancing our understanding of phenomenon belong to the second group. Research in
which a prototype is developed or a computer tool is produced is placed into the last group.
Corbett and Van Wassenhove (1993, p. 3) state that “the basic disciplines provide knowledge
for the applied sciences to use, whereas the applied sciences signal to the basic disciplines
which areas are in need of deeper research”. The area of research combining theory with
application carries the true spirit of operations research, but it is well underpopulated in
humanitarian aid and disaster relief context (Corbett and Van Wassenhove, 1993). The
community of operations research recognizes the importance of using new research to solve
M.Sc. in Management, University of Ottawa Mingli Liu
60
the problems in humanitarian aid and disaster relief. Therefore, the proposed research will use
both model development and application development.
Humanitarian aid and disaster relief is a large-scale process requiring the coordination and
collaboration of various organizations. For instance, in Canada, participants involve Public
Safety Canada, Public Health Agency of Canada, Transport Canada, Canadian Forces,
Canadian Red Cross and so on. Usually, they operate in a complex environment.
Unpreparedness may cause the inability to handle chaos, and therefore increase the number of
deaths. In the emergency management system of Canada, municipal governments are key
players. The quality and comprehensiveness of local disaster preparedness largely determines
the effectiveness of response efforts when disaster occurs (Henstra, 2011). The major
objectives of community disaster operation management are to protect people and property
from disasters, to minimize losses related to disasters, and to ensure a swift and effective
recovery from disaster (Henstra, 2011). Thus, Canadian community is the concentration in
this proposed research.
This chapter has reviewed a wide breath of publications on disaster management, supply
chain management, humanitarian aid and disaster supply chain management, community
relief application. The summary above captures those key references that are most pertained
to the proposed research. These references provide the foundation of the research
methodology described in the next chapter.
3. Methodology
The purpose of this chapter is to propose a research methodology to evaluate and improve the
effectiveness of preparedness for humanitarian aid and disaster relief in Canadian
communities. Specifically, the approach is as follows: (1) define performance measurement
and CSFs for humanitarian aid and disaster relief supply chain management; (2) demonstrate
the relationship between performance measurement and CSFs; (3) identify the specific
M.Sc. in Management, University of Ottawa Mingli Liu
61
enablers or strategies that can help achieve an outstanding performance level on a certain
CSF; (4) analyze the current situation of Canadian communities and define a developmental
model.
To start with, on the basis of knowledge in commercial supply chain area, a conceptual
framework of performance measurement and CSFs in humanitarian aid and disaster relief
supply chain management is defined in section 3.1. The performance measurement is used to
measure the efficiency, effectiveness, and fairness of the whole chain. Then, specific
indicators of the measurement are selected for this proposed research in section 3.2.
Meanwhile, the focus is narrow down to the preparedness of inventory and transportation. In
addition to determining the inventory and transportation plan, the proposed research takes one
step further and aims to apply the results to Canadian communities. Thus, modeling approach
is illustrated in section 3.3 which is followed by the definition of a centralized example
problem in section 3.4. Finally, section 3.5 presents the method of evaluation and decision
making.
3.1. Development of Conceptual Framework
Establishing a set of proper performance measurement is a critical component in the design
and analysis of a supply chain. It is because performance measurement can be used to
determine the efficiency and effectiveness of an existing system, or to compare competing
alternative systems (Beamon, 1998). Moreover, it can help design the proposed system by
determining the values of decision variables which yield the most desirable level of
performance (Beamon, 1998). In order to achieve higher performance level, successful
factors need to be explored and improved. In the second chapter of literature review, 3 types
of performance measurement and 9 CSFs have been identified for humanitarian aid and
disaster relief supply chain management.
Since the 9 CSFs can influence each other, improving one or more of them can optimize the
M.Sc. in Management, University of Ottawa Mingli Liu
62
effectiveness of the whole chain. For the preparedness for humanitarian aid and disaster relief,
two basic components are the need to efficiently use resources and the need to have an
effective delivery plan. They respectively correspond to two identified CSFs: inventory
management and transportation planning. According to the previous analysis and research
focus, the proposed conceptual framework just demonstrates part of the relationships among
all the elements, as shown in Figure 3.1.
Strategic planning takes a view from the overall organization. It helps evaluates the strengths,
weaknesses, opportunities, and threats in an organization; thus, the round-trip information
flow can encourage the positive interaction between strategic planning and continuous
improvement. No matter what kind of humanitarian aid and disaster relief efforts is needed,
there will be a budget limitation. Adopting proper supply chain strategies can help make the
most use of financial sources (Personal Communication, March 21, 2013; Personal
Communication, March 26, 2013). Without strategic planning, strategies on individual
aspects of humanitarian aid and disaster relief such as supply chain management cannot be
fully achieved (Pettit and Beresford, 2009). Specific supply chain strategies can help achieve
the other 6 CSFs in the ellipse, such as cooperate strategy (outsourcing non-core activities),
location of distribution centres (centralized or localized), resource deployment (relief items
and personnel), and effective use of organizational capacity.
Among the 6 factors in the ellipse, the effective use of information technology can help build
a platform for knowledge sharing which can enhance participative management and improve
relationship development. Subsequently, collaboration both intra- and inter-organization can
assist in maximizing the use of capacity. Given that capacity planning has an effect on
decisions about numbers of warehouses, distribution centres, vehicles, employees, and other
equipment, there is a close relationship between it and the management of inventory and
transportation.
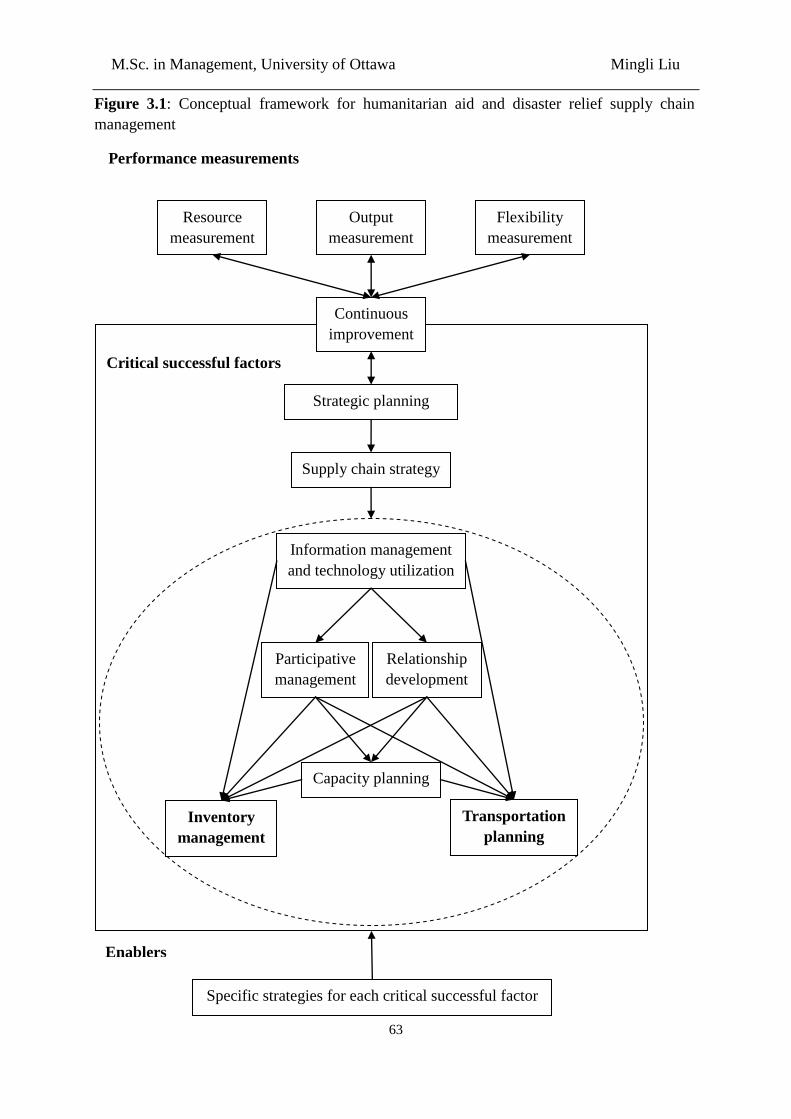
M.Sc. in Management, University of Ottawa Mingli Liu
63
Figure 3.1: Conceptual framework for humanitarian aid and disaster relief supply chain
management
Continuous
improvement
Strategic planning
Supply chain strategy
Participative
management
Information management
and technology utilization
Capacity planning
Relationship
development
Inventory
management
Transportation
planning
Resource
measurement
Output
measurement
Flexibility
measurement
Specific strategies for each critical successful factor
Enablers
Critical successful factors
Performance measurements
M.Sc. in Management, University of Ottawa Mingli Liu
64
As a result, among all the 9 CSFs, the most basic factors are inventory management and
transportation planning. Except the relations mentioned above, there are some other direct
influences on inventory and transportation. First, since it is necessary to find an optimal plan
for assigning resources in space and time to the affected area, information technology can
help assess and process all incoming information in an adequate manner, as well as track and
trace relief items and delivery vehicles. Second, participative management can assist in
controlling human resources including relief personnel related to inventory and transportation.
Finally, relationship development may help coordinate relief items and vehicles. In
consequence, exploring the specific enablers for the basic two factors can improve the
performance of the whole chain.
3.2. Selection of Indicators for Performance Measurement
There are many performance measures for commercial supply chain management. However,
unique characteristics and additional complexity of humanitarian aid and disaster relief
supply chain make some of them not suitable for it. According to the conceptual framework
built in Figure 3.1, three broad types of performance measurement are defined: resource
measurement, output measurement, and flexibility measurement. Each of them contains
various indicators. In order to make them fit the proposed research, specific indicators are
selected for each type.
First of all, in the proposed research, resources include two parts: relief items and relief
personnel. Ideally, cost is the least important factor in humanitarian aid and disaster relief
situation because people may think the goal in it is different from that in commercial supply
chain which is maximizing profits. Nevertheless, any relief effort is constrained by specific
budgets in practice. For instance, the research conducted by Balcik and Beamon (2008)
shows the effects of pre- and post-disaster relief funding on relief performance in terms of
satisfied demand proportion and response time. Since poor supply chain management will
cause additional costs, the proposed research will choose cost as an indicator for resource
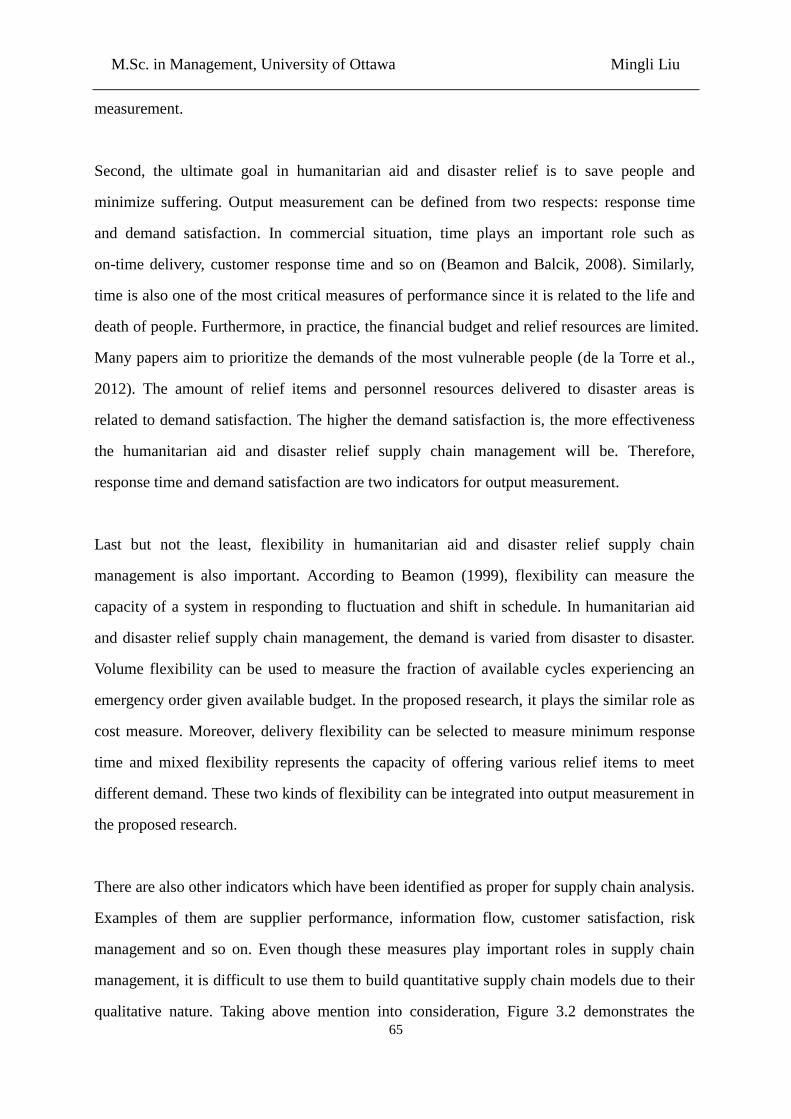
M.Sc. in Management, University of Ottawa Mingli Liu
65
measurement.
Second, the ultimate goal in humanitarian aid and disaster relief is to save people and
minimize suffering. Output measurement can be defined from two respects: response time
and demand satisfaction. In commercial situation, time plays an important role such as
on-time delivery, customer response time and so on (Beamon and Balcik, 2008). Similarly,
time is also one of the most critical measures of performance since it is related to the life and
death of people. Furthermore, in practice, the financial budget and relief resources are limited.
Many papers aim to prioritize the demands of the most vulnerable people (de la Torre et al.,
2012). The amount of relief items and personnel resources delivered to disaster areas is
related to demand satisfaction. The higher the demand satisfaction is, the more effectiveness
the humanitarian aid and disaster relief supply chain management will be. Therefore,
response time and demand satisfaction are two indicators for output measurement.
Last but not the least, flexibility in humanitarian aid and disaster relief supply chain
management is also important. According to Beamon (1999), flexibility can measure the
capacity of a system in responding to fluctuation and shift in schedule. In humanitarian aid
and disaster relief supply chain management, the demand is varied from disaster to disaster.
Volume flexibility can be used to measure the fraction of available cycles experiencing an
emergency order given available budget. In the proposed research, it plays the similar role as
cost measure. Moreover, delivery flexibility can be selected to measure minimum response
time and mixed flexibility represents the capacity of offering various relief items to meet
different demand. These two kinds of flexibility can be integrated into output measurement in
the proposed research.
There are also other indicators which have been identified as proper for supply chain analysis.
Examples of them are supplier performance, information flow, customer satisfaction, risk
management and so on. Even though these measures play important roles in supply chain
management, it is difficult to use them to build quantitative supply chain models due to their
qualitative nature. Taking above mention into consideration, Figure 3.2 demonstrates the
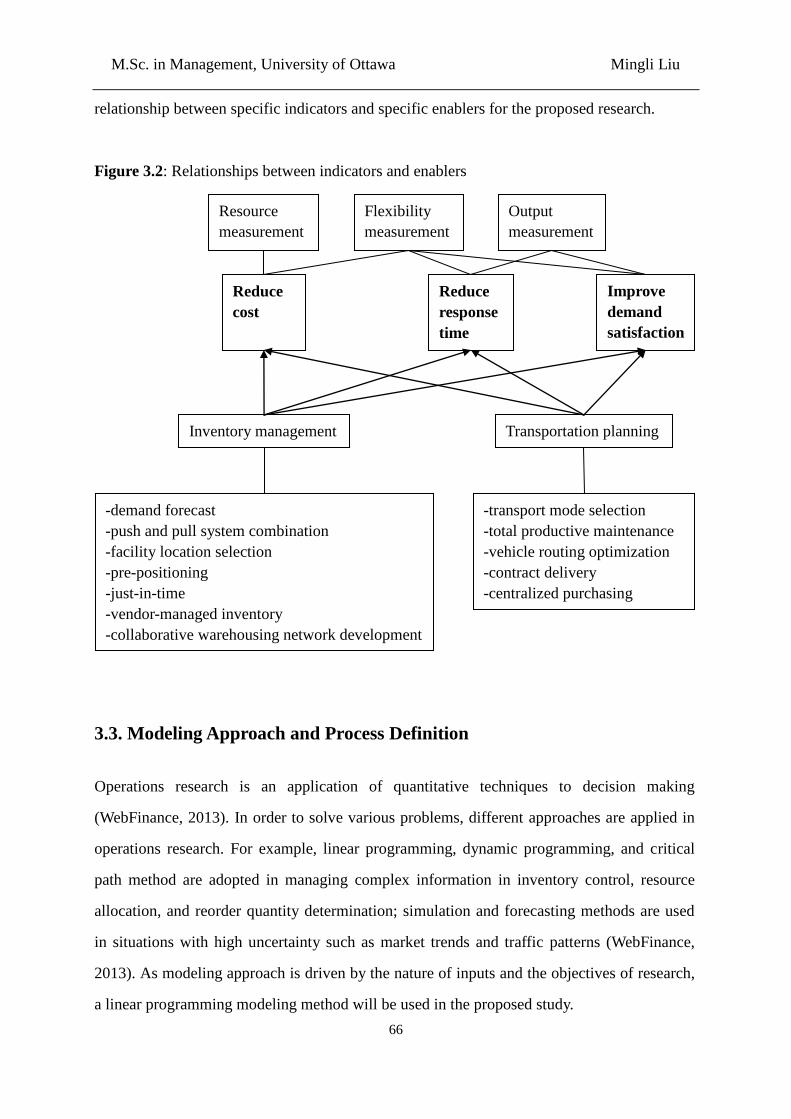
M.Sc. in Management, University of Ottawa Mingli Liu
66
relationship between specific indicators and specific enablers for the proposed research.
Figure 3.2: Relationships between indicators and enablers
3.3. Modeling Approach and Process Definition
Operations research is an application of quantitative techniques to decision making
(WebFinance, 2013). In order to solve various problems, different approaches are applied in
operations research. For example, linear programming, dynamic programming, and critical
path method are adopted in managing complex information in inventory control, resource
allocation, and reorder quantity determination; simulation and forecasting methods are used
in situations with high uncertainty such as market trends and traffic patterns (WebFinance,
2013). As modeling approach is driven by the nature of inputs and the objectives of research,
a linear programming modeling method will be used in the proposed study.
Resource
measurement
Output
measurement
Reduce
response
time
Improve
demand
satisfaction
Reduce
cost
Inventory management Transportation planning
-demand forecast
-push and pull system combination
-facility location selection
-pre-positioning
-just-in-time
-vendor-managed inventory
-collaborative warehousing network development
-transport mode selection
-total productive maintenance
-vehicle routing optimization
-contract delivery
-centralized purchasing
Flexibility
measurement
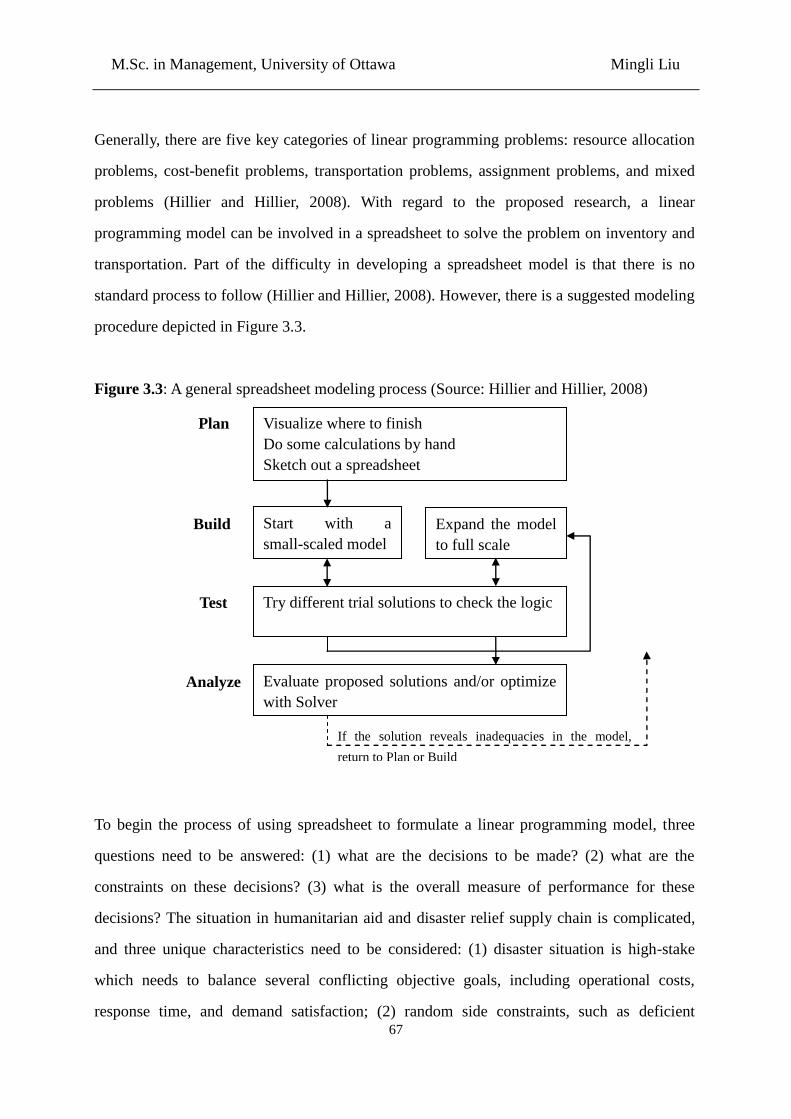
M.Sc. in Management, University of Ottawa Mingli Liu
67
Generally, there are five key categories of linear programming problems: resource allocation
problems, cost-benefit problems, transportation problems, assignment problems, and mixed
problems (Hillier and Hillier, 2008). With regard to the proposed research, a linear
programming model can be involved in a spreadsheet to solve the problem on inventory and
transportation. Part of the difficulty in developing a spreadsheet model is that there is no
standard process to follow (Hillier and Hillier, 2008). However, there is a suggested modeling
procedure depicted in Figure 3.3.
Figure 3.3: A general spreadsheet modeling process (Source: Hillier and Hillier, 2008)
To begin the process of using spreadsheet to formulate a linear programming model, three
questions need to be answered: (1) what are the decisions to be made? (2) what are the
constraints on these decisions? (3) what is the overall measure of performance for these
decisions? The situation in humanitarian aid and disaster relief supply chain is complicated,
and three unique characteristics need to be considered: (1) disaster situation is high-stake
which needs to balance several conflicting objective goals, including operational costs,
response time, and demand satisfaction; (2) random side constraints, such as deficient
Start with a
small-scaled model
Try different trial solutions to check the logic
Evaluate proposed solutions and/or optimize
with Solver
Build Expand the model
to full scale
Visualize where to finish
Do some calculations by hand
Sketch out a spreadsheet
Plan
Test
Analyze
Build
If the solution reveals inadequacies in the model,
return to Plan or Build
M.Sc. in Management, University of Ottawa Mingli Liu
68
preparation budgets, limited relief items, fixed vehicle fleets, and restricted delivery time, are
exist; (3) preparedness plans of natural disasters have to be robust with regard to different
scenarios because natural disasters are inherently stochastic and unpredictable (Van
Hentenryck et al., 2010).
Since it is hard to decide how to start, visualizing where to end up is helpful at this point. For
instance, what commodities need to be shipped (people, blankets, clothes, water, food,
medical, etc.)? What are the shipment sources (warehouses, distribution centres, etc.) and
destinations (shelters, hospitals, hotels, etc.)? What kinds of vehicles are involved (trucks,
cars, boats, helicopters, etc.)? The answers to these questions can lead to the heart of the
problem and help get the modeling procedure started. Then, hand calculation can clarify what
formulas are needed for the result (Hillier and Hillier, 2008). Before using EXCEL and
blindly entering various elements, it will be useful to sketch a layout of spreadsheet. Usually,
a logical progression begins with data on the top left and moves through the calculations
toward the target cell on the bottom right (Hillier and Hillier, 2008).
In the stage of building the model, it is better to work out correctly for the small version
before expanding it to the full scale. Governments and volunteer relief organizations identify
two major important categories of inventory: single-use perishable items and multi-use
non-perishable items (de la Torre et al., 2012). In the proposed research, personnel resources
will be taken into account since no research considers this kind of resources. However, the
small-scaled model will only consider one type of inventory with one type of transportation
mode during one period. In order to test the small version of the model, the numbers will be
entered in the changing cells where researchers know the values of the output cells should be.
The model cannot be expanded to full-scale size until a small version of the spreadsheet has
been tested to make sure all the formulas are correct and everything works properly (Hillier
and Hillier, 2008). Similarly, it is also important to test the full version of the model by the
same procedure followed for the small version.
After building a full-scale model, the last step is to evaluate the proposed solutions or
M.Sc. in Management, University of Ottawa Mingli Liu
69
optimize it with Solver dialogue box to specify the target cells, the changing cells, and the
constraints. In supply chain modeling, performance measurement is expressed as function of
one or more decision variables (Beamon, 1998; Beamon, 1999). Thus, the proposed model
needs to optimize one or more performance measurement in humanitarian aid and disaster
relief supply chain, given a set of physical or operational system constraints. If the solution
reveals any inadequacy of the model, it will be necessary to go back to the plan or build
phase.
3.4. Establishment of Base Case Model
Any time there is a significant disaster, it is wise to do a post-operational review to make the
emergency response system stronger (Government of Alberta, 2013a). With the aim to create
a framework and build a model for Canadian communities, an inductive approach will be
adopted. After examining the specific base case scenario, a generalized framework can be
summarized. Making an analysis of the base case scenario can help the community to have a
better understanding about its current situations and know how to improve the existing
system.
Narrowing down the scope to a linear programming model, there are two missions in the
flooding response process: one is the delivery of relief commodities and personnel; the other
is the transportation of evacuated people. Since many roads are destroyed by the flood,
transportation means include helicopters and trucks. In order to maximize demand
satisfaction, all provincial resources are brought together to respond to the flood via the
Alberta Emergency Management Agency. The current goal of humanitarian aid and disaster
relief supply chain in Canada is represented as a network aiming to find the best routes to
transport expected rescued survivors as well as deliver required commodities and personnel.
In March of this year, the federal government restricted itself to writing cheques after damage
is done rather than help Canadians prepare for disasters (Kenny, 2013). The federal
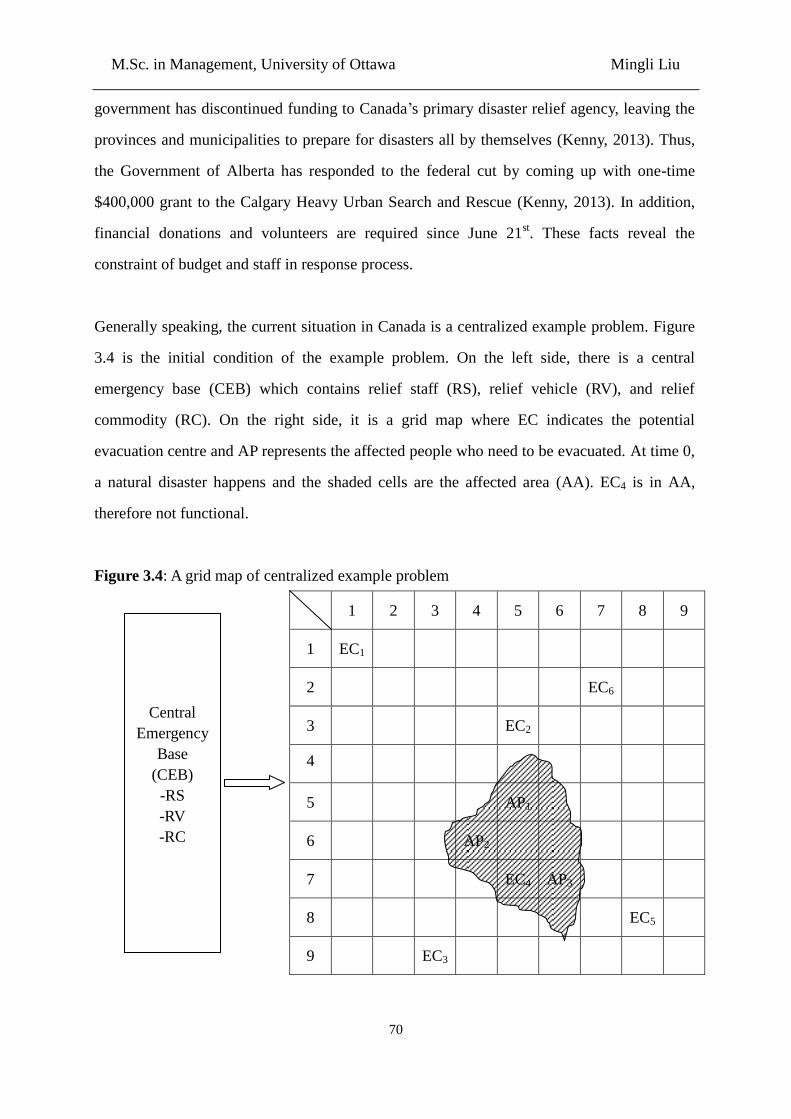
M.Sc. in Management, University of Ottawa Mingli Liu
70
government has discontinued funding to Canada’s primary disaster relief agency, leaving the
provinces and municipalities to prepare for disasters all by themselves (Kenny, 2013). Thus,
the Government of Alberta has responded to the federal cut by coming up with one-time
$400,000 grant to the Calgary Heavy Urban Search and Rescue (Kenny, 2013). In addition,
financial donations and volunteers are required since June 21st. These facts reveal the
constraint of budget and staff in response process.
Generally speaking, the current situation in Canada is a centralized example problem. Figure
3.4 is the initial condition of the example problem. On the left side, there is a central
emergency base (CEB) which contains relief staff (RS), relief vehicle (RV), and relief
commodity (RC). On the right side, it is a grid map where EC indicates the potential
evacuation centre and AP represents the affected people who need to be evacuated. At time 0,
a natural disaster happens and the shaded cells are the affected area (AA). EC4 is in AA,
therefore not functional.
Figure 3.4: A grid map of centralized example problem
1 2 3 4 5 6 7 8 9
1 EC1
2 EC6
3 EC2
4
5 AP1
6 AP2
7 EC4 AP3
8 EC5
9 EC3
Central
Emergency
Base
(CEB)
-RS
-RV
-RC
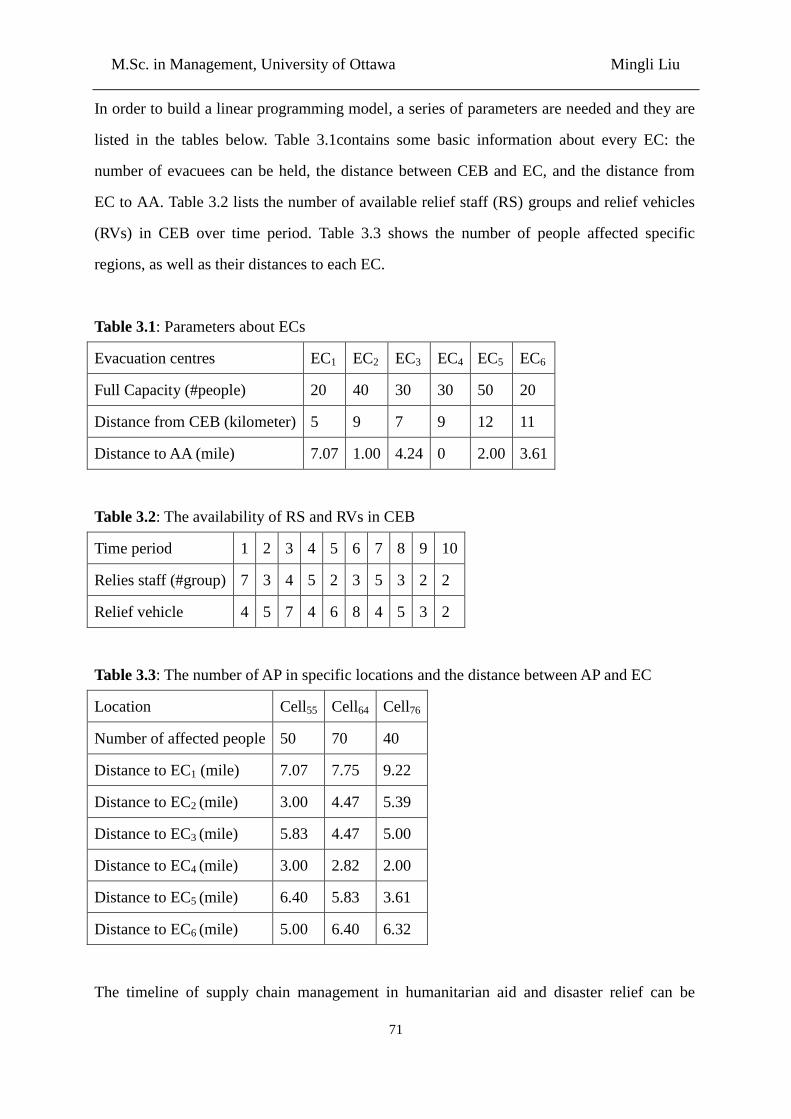
M.Sc. in Management, University of Ottawa Mingli Liu
71
In order to build a linear programming model, a series of parameters are needed and they are
listed in the tables below. Table 3.1contains some basic information about every EC: the
number of evacuees can be held, the distance between CEB and EC, and the distance from
EC to AA. Table 3.2 lists the number of available relief staff (RS) groups and relief vehicles
(RVs) in CEB over time period. Table 3.3 shows the number of people affected specific
regions, as well as their distances to each EC.
Table 3.1: Parameters about ECs
Evacuation centres EC1 EC2 EC3 EC4 EC5 EC6
Full Capacity (#people) 20 40 30 30 50 20
Distance from CEB (kilometer) 5 9 7 9 12 11
Distance to AA (mile) 7.07 1.00 4.24 0 2.00 3.61
Table 3.2: The availability of RS and RVs in CEB
Time period 1 2 3 4 5 6 7 8 9 10
Relies staff (#group) 7 3 4 5 2 3 5 3 2 2
Relief vehicle 4 5 7 4 6 8 4 5 3 2
Table 3.3: The number of AP in specific locations and the distance between AP and EC
Location Cell55 Cell64 Cell76
Number of affected people 50 70 40
Distance to EC1 (mile) 7.07 7.75 9.22
Distance to EC2 (mile) 3.00 4.47 5.39
Distance to EC3 (mile) 5.83 4.47 5.00
Distance to EC4 (mile) 3.00 2.82 2.00
Distance to EC5 (mile) 6.40 5.83 3.61
Distance to EC6 (mile) 5.00 6.40 6.32
The timeline of supply chain management in humanitarian aid and disaster relief can be
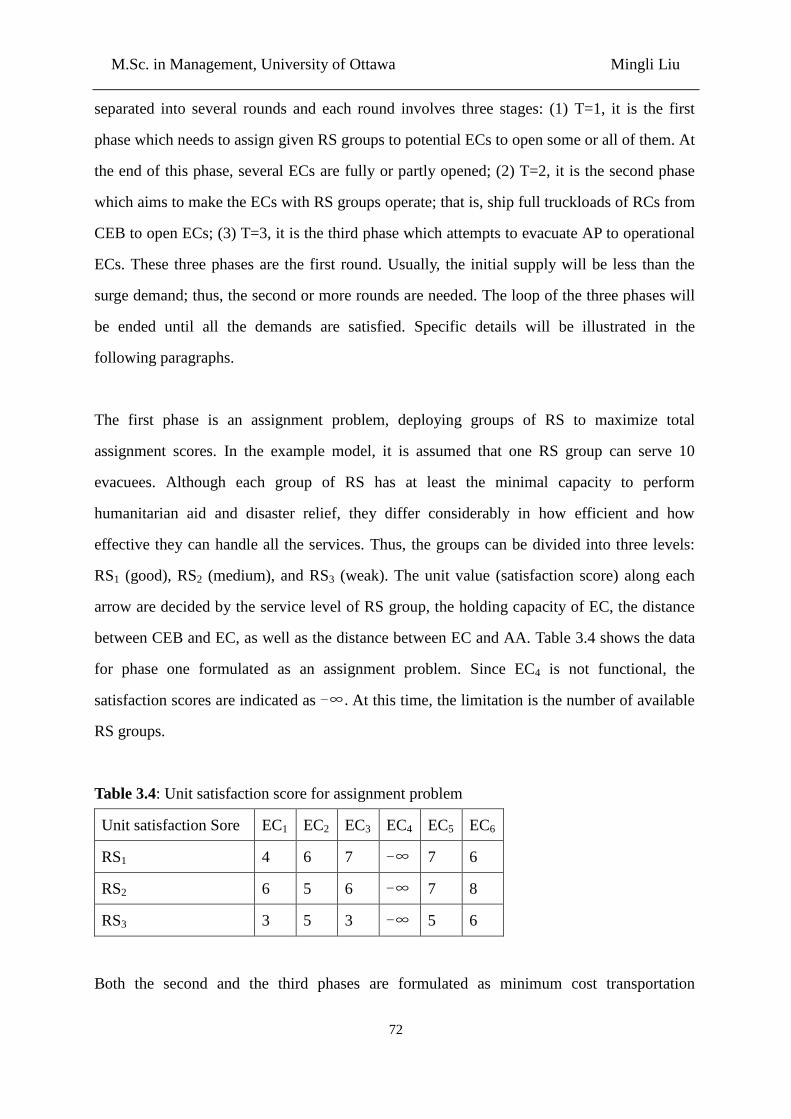
M.Sc. in Management, University of Ottawa Mingli Liu
72
separated into several rounds and each round involves three stages: (1) T=1, it is the first
phase which needs to assign given RS groups to potential ECs to open some or all of them. At
the end of this phase, several ECs are fully or partly opened; (2) T=2, it is the second phase
which aims to make the ECs with RS groups operate; that is, ship full truckloads of RCs from
CEB to open ECs; (3) T=3, it is the third phase which attempts to evacuate AP to operational
ECs. These three phases are the first round. Usually, the initial supply will be less than the
surge demand; thus, the second or more rounds are needed. The loop of the three phases will
be ended until all the demands are satisfied. Specific details will be illustrated in the
following paragraphs.
The first phase is an assignment problem, deploying groups of RS to maximize total
assignment scores. In the example model, it is assumed that one RS group can serve 10
evacuees. Although each group of RS has at least the minimal capacity to perform
humanitarian aid and disaster relief, they differ considerably in how efficient and how
effective they can handle all the services. Thus, the groups can be divided into three levels:
RS1 (good), RS2 (medium), and RS3 (weak). The unit value (satisfaction score) along each
arrow are decided by the service level of RS group, the holding capacity of EC, the distance
between CEB and EC, as well as the distance between EC and AA. Table 3.4 shows the data
for phase one formulated as an assignment problem. Since EC4 is not functional, the
satisfaction scores are indicated as -∞.At this time, the limitation is the number of available
RS groups.
Table 3.4: Unit satisfaction score for assignment problem
Unit satisfaction Sore EC1 EC2 EC3 EC4 EC5 EC6
RS1 4 6 7 -∞ 7 6
RS2 6 5 6 -∞ 7 8
RS3 3 5 3 -∞ 5 6
Both the second and the third phases are formulated as minimum cost transportation
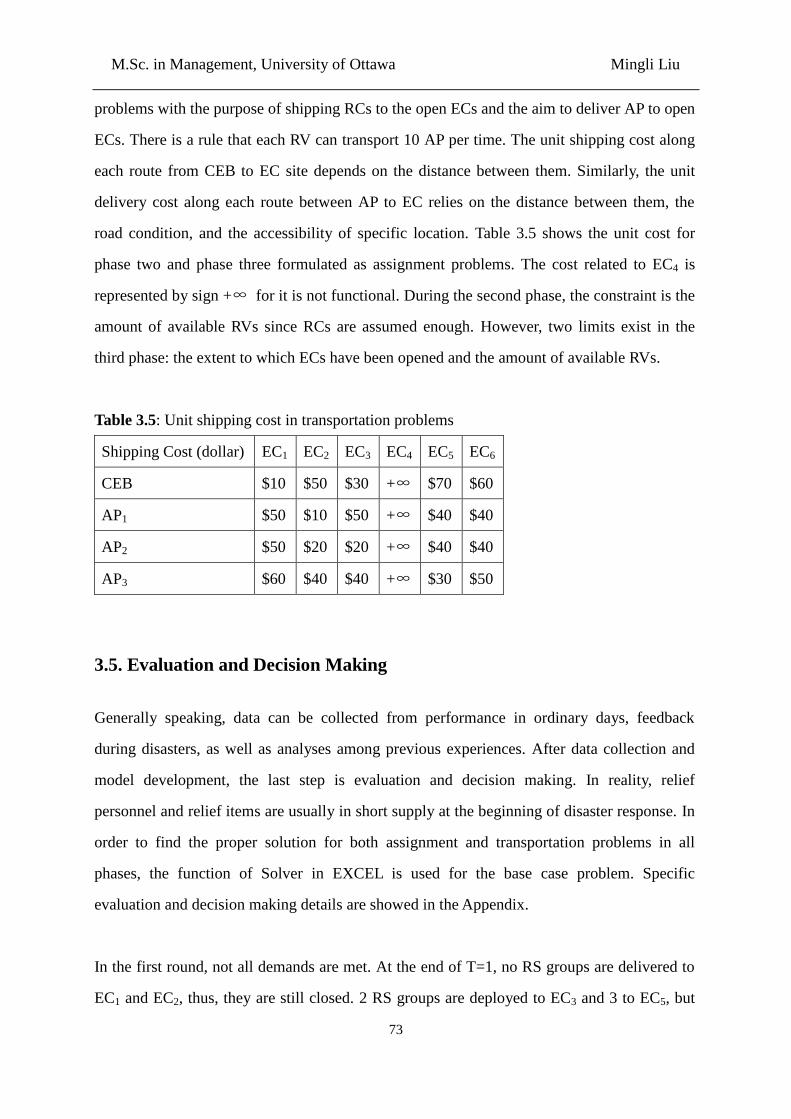
M.Sc. in Management, University of Ottawa Mingli Liu
73
problems with the purpose of shipping RCs to the open ECs and the aim to deliver AP to open
ECs. There is a rule that each RV can transport 10 AP per time. The unit shipping cost along
each route from CEB to EC site depends on the distance between them. Similarly, the unit
delivery cost along each route between AP to EC relies on the distance between them, the
road condition, and the accessibility of specific location. Table 3.5 shows the unit cost for
phase two and phase three formulated as assignment problems. The cost related to EC4 is
represented by sign +∞ for it is not functional. During the second phase, the constraint is the
amount of available RVs since RCs are assumed enough. However, two limits exist in the
third phase: the extent to which ECs have been opened and the amount of available RVs.
Table 3.5: Unit shipping cost in transportation problems
Shipping Cost (dollar) EC1 EC2 EC3 EC4 EC5 EC6
CEB $10 $50 $30 +∞ $70 $60
AP1 $50 $10 $50 +∞ $40 $40
AP2 $50 $20 $20 +∞ $40 $40
AP3 $60 $40 $40 +∞ $30 $50
3.5. Evaluation and Decision Making
Generally speaking, data can be collected from performance in ordinary days, feedback
during disasters, as well as analyses among previous experiences. After data collection and
model development, the last step is evaluation and decision making. In reality, relief
personnel and relief items are usually in short supply at the beginning of disaster response. In
order to find the proper solution for both assignment and transportation problems in all
phases, the function of Solver in EXCEL is used for the base case problem. Specific
evaluation and decision making details are showed in the Appendix.
In the first round, not all demands are met. At the end of T=1, no RS groups are delivered to
EC1 and EC2, thus, they are still closed. 2 RS groups are deployed to EC3 and 3 to EC5, but
M.Sc. in Management, University of Ottawa Mingli Liu
74
the demand of RS groups in both of them are still not satisfied; therefore, they two are partly
opened. Only EC6 are totally opened since its demand is fully met. The results in assignment
problem help decide the number of AP that can be delivered to each EC in phase three.
After assigning RS groups, RCs need to be shipped to the open ECs. In the example problem,
there is an assumption that RCs are enough in CEB because emergency agency can bring all
provincial resources together. Hence, the only limitation is the amount of available RVs.
During T=2, there are five RVs and the demand is greater than the supply. At the end of this
period, the demands in EC3 and EC6 are fully met, while the needs in EC5 just partly satisfied
and the unsatisfied needs (2 full truckloads of RCs) will be added to phase two in the second
round.
With deployed RS groups and RCs, AP can be transported to operational ECs. Based on the
extent to which each EC is opened, the supplies in T=3 are determined. In addition, the
number of AP that can be evacuated also depends on the amount of available RVs. At the end
of T=3, no AP in Cell55 are evacuated and part of AP in Cell64 and Cell76 are evacuated
successfully. Thus, second or more rounds are proceeded following the above three phases.
Similar three phases are conducted in both round 2 and round 3. At the end of round three, all
ECs are opened and the demands of RCs in each EC are satisfied. However, due to the
shortage of available RVs in T=9, not all AP are evacuated successfully. In consequence, it is
necessary to do round 4 and only conduct phase 3. After round 4, the humanitarian aid and
disaster relief effort is done.
4. Analysis and Expected Results
Recent events in Canada have uncovered the deficiencies of existing supply chain system in
humanitarian aid and disaster relief in the face of large-scale natural disasters. First, in
Canada, the most important objective is to satisfy the current demands of affected people
M.Sc. in Management, University of Ottawa Mingli Liu
75
because it is not proper to have relief items lay idle in the system to save costs or time (Tzeng
et al., 2007). Second, due to the finance constraint, cost minimization is weighted as an
objective along with other objectives. Third, since the preposition sites of inventory are
dispersed, more efforts are needed to coordinate and transport relief commodities through
transshipment centres. These shortcomings cause long response time, which in turn lead to
the delay of expected evacuation and commodity delivery, and even the death of potential
survivors. The proposed research intents to improve the whole system from two aspects:
inventory and transportation.
In the aspect of inventory management, strategic prepositioning is critical. However, it is not
possible to place relief commodities and relief personnel everywhere. Two approaches appear
reasonable: one is prepositioning inventory close to the probable affected areas in which
natural disasters may occur; the other one is scattering inventory facilities to enable partial
coverage of multiple affected areas by a facility and full coverage of every affected area by
multiple facilities (En Shen, 2006). In the example problem, scattered inventory will be
aggregated in one centralized emergency base and then be deployed. Therefore, the situation
with several decentralized emergency bases or even no emergency base might be considered
and evaluated in the proposed research.
When it comes to transportation planning, instead of maximizing demand satisfaction, the
objective of the proposed linear programming model is to minimize response time. It is
because each second wasted in the situation of humanitarian aid and disaster relief may
increase the mortality rate. This goal may be realized by decreasing the total operation rounds
or reducing the operation time of each phase. At the same time, cost and demand are two soft
constrains. However, their values are not expressed in the same units, making it challenging
to combine them into a single objective function (Van Hentenryck et al., 2010). Thus, penalty
cost can be used to measure unsatisfied demand.
The proposed research aims to build a model to improve the existing supply chain
management in humanitarian aid and disaster relief in Canadian communities. Although a
M.Sc. in Management, University of Ottawa Mingli Liu
76
majority of the above reviewed literature uses optimization in the end, the proposed research
will use evaluation instead of optimization; that is, the primary function of the proposed
model is not to identify a single optimal plan, but to explore a range of feasible and effective
plans. Transshipment modeling under alternative designs (decentralized vs. centralized) will
be finished first. Furthermore, multi-criteria is more suitable for humanitarian aid and disaster
relief supply chain management, because shorter response time will be at the cost of higher
operation costs. EXCEL will be adopted to assist in data analysis and the expected results will
include:
1. An effective conceptual framework for humanitarian aid and disaster relief supply chain
management.
2. A description of base case scenario in Canada.
3. A detailed Canadian community profile.
4. An inventory-transportation linear programming model for flood disaster.
5. Expected Recommendation and Consideration for Future Research
To start with, future analyses and testing may improve the model and data to achieve further
realism. The proposed research uses either the historical data or data from disaster damage
scenario modeling software. Future study can try to collect data from survey to first
responders because limited data collection can hinder the real goal of distributing goods.
Currently, the aim is to minimize response time subjected to certain cost and demand. Other
plausible objectives could be minimizing operational costs given a desired level of response
time and demand satisfaction.
In addition, since the proposed model is used to create local operational procedures, future
study can integrate this model into a comprehensive decision support system for humanitarian
aid and disaster relief. Meanwhile, a graphical user interface could be offered to facilitate the
input of data and display of outcomes. Then, the model may be used by personnel who are
not familiar with evaluation techniques.
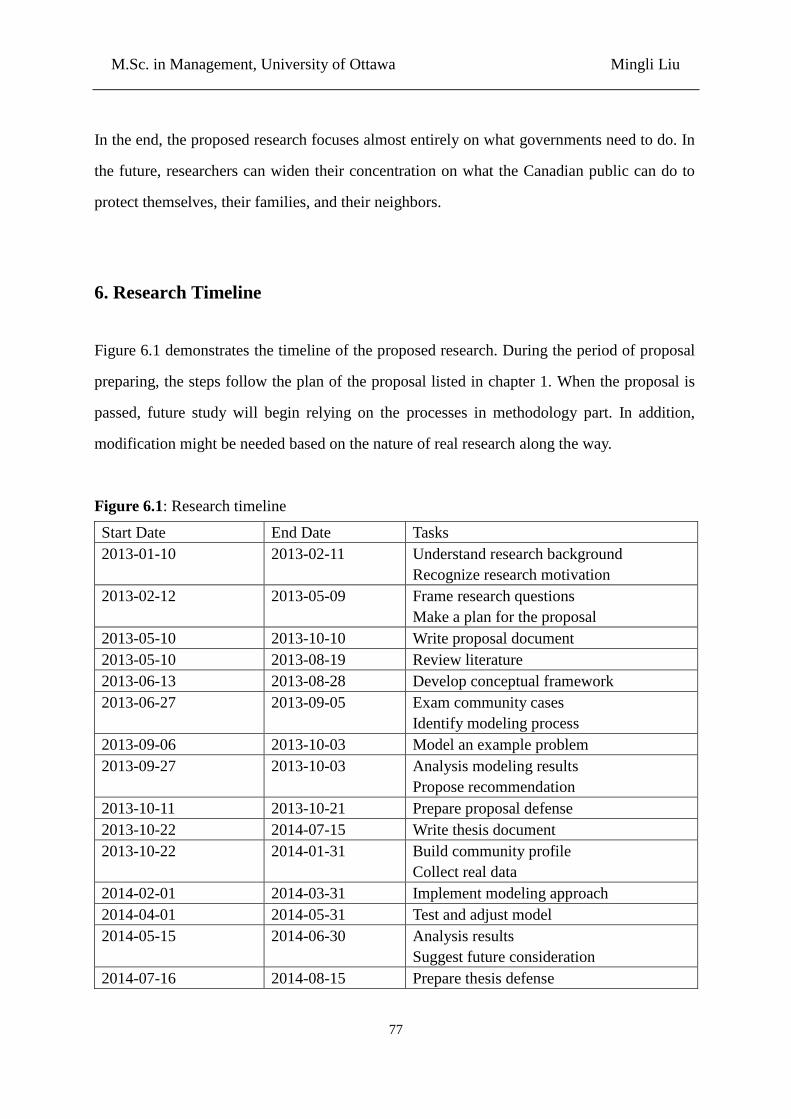
M.Sc. in Management, University of Ottawa Mingli Liu
77
In the end, the proposed research focuses almost entirely on what governments need to do. In
the future, researchers can widen their concentration on what the Canadian public can do to
protect themselves, their families, and their neighbors.
6. Research Timeline
Figure 6.1 demonstrates the timeline of the proposed research. During the period of proposal
preparing, the steps follow the plan of the proposal listed in chapter 1. When the proposal is
passed, future study will begin relying on the processes in methodology part. In addition,
modification might be needed based on the nature of real research along the way.
Figure 6.1: Research timeline
Start Date End Date Tasks
2013-01-10 2013-02-11 Understand research background
Recognize research motivation
2013-02-12 2013-05-09 Frame research questions
Make a plan for the proposal
2013-05-10 2013-10-10 Write proposal document
2013-05-10 2013-08-19 Review literature
2013-06-13 2013-08-28 Develop conceptual framework
2013-06-27 2013-09-05 Exam community cases
Identify modeling process
2013-09-06 2013-10-03 Model an example problem
2013-09-27 2013-10-03 Analysis modeling results
Propose recommendation
2013-10-11 2013-10-21 Prepare proposal defense
2013-10-22 2014-07-15 Write thesis document
2013-10-22 2014-01-31 Build community profile
Collect real data
2014-02-01 2014-03-31 Implement modeling approach
2014-04-01 2014-05-31 Test and adjust model
2014-05-15 2014-06-30 Analysis results
Suggest future consideration
2014-07-16 2014-08-15 Prepare thesis defense
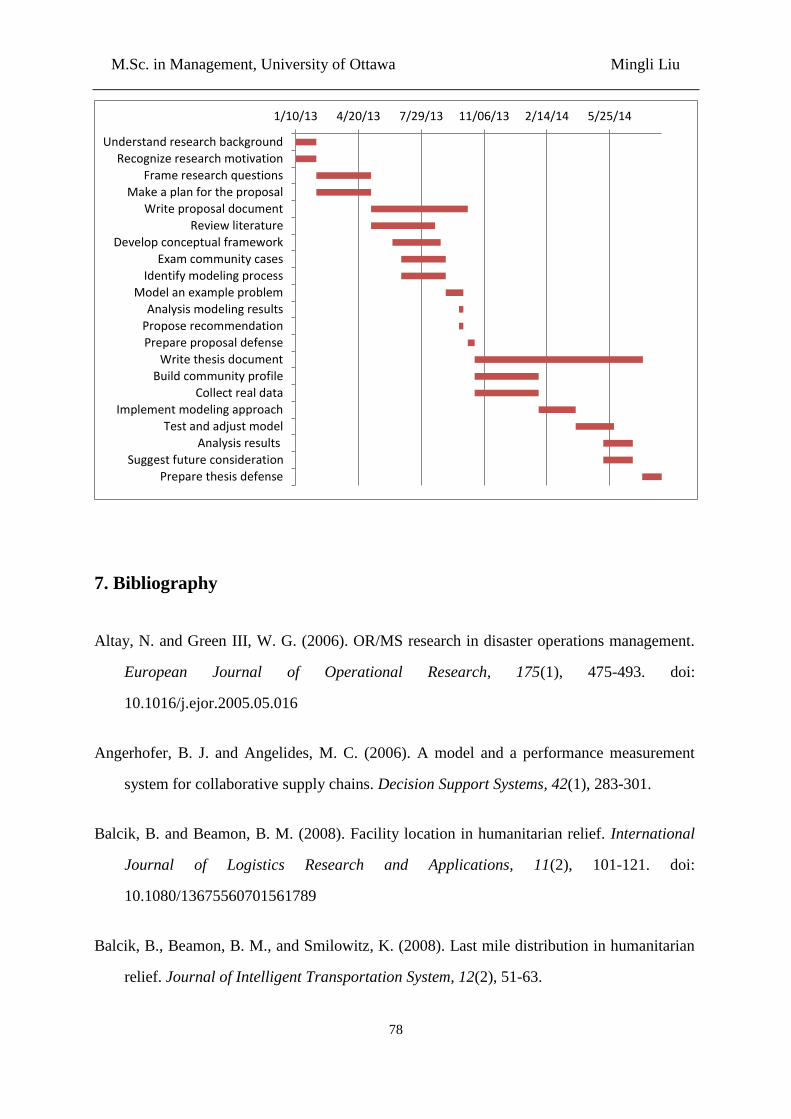
M.Sc. in Management, University of Ottawa Mingli Liu
78
7. Bibliography
Altay, N. and Green III, W. G. (2006). OR/MS research in disaster operations management.
European Journal of Operational Research, 175(1), 475-493. doi:
10.1016/j.ejor.2005.05.016
Angerhofer, B. J. and Angelides, M. C. (2006). A model and a performance measurement
system for collaborative supply chains. Decision Support Systems, 42(1), 283-301.
Balcik, B. and Beamon, B. M. (2008). Facility location in humanitarian relief. International
Journal of Logistics Research and Applications, 11(2), 101-121. doi:
10.1080/13675560701561789
Balcik, B., Beamon, B. M., and Smilowitz, K. (2008). Last mile distribution in humanitarian
relief. Journal of Intelligent Transportation System, 12(2), 51-63.
1/10/13 4/20/13 7/29/13 11/06/13 2/14/14 5/25/14
Understand research background
Recognize research motivation
Frame research questions
Make a plan for the proposal
Write proposal document
Review literature
Develop conceptual framework
Exam community cases
Identify modeling process
Model an example problem
Analysis modeling results
Propose recommendation
Prepare proposal defense
Write thesis document
Build community profile
Collect real data
Implement modeling approach
Test and adjust model
Analysis results
Suggest future consideration
Prepare thesis defense
M.Sc. in Management, University of Ottawa Mingli Liu
79
Barbarosoğlu, G. and Arda, Y. (2004). A two-stage stochastic programming framework for
transportation planning in disaster response. The Journal of the Operational Research
Society, 55(1), 43-53.
Beamon, B. M. (1998). Supply chain design and analysis: Models and methods. International
Journal of Production Economics, 55(3), 281-294.
Beamon, B. M. (1999). Measuring supply chain performance. International Journal of
Operations & Production Management, 19(3), 275-292.
Beamon, B. M. and Balcik, B. (2008). Performance measurement in humanitarian relief
chains. The International Journal of Public Sector Management, 21(1), 4-25. doi:
10.1108/09513550810846087
Beamon, B. M. and Kotleba, S. A. (2006a). Inventory modeling for complex emergencies in
humanitarian relief operations. International Journal of Logistics: Research and
Applications, 9(1): 1-18.
Beamon, B. M. and Kotleba, S. A. (2006b). Inventory management support systems for
emergency humanitarian relief operations in south Sudan. The International Journal of
Logistics Management, 17(2), 187-212.
Bechtel, G. A., Hansberry, A. H., and Gray-Brown, D. (2000). Disaster planning and resource
allocation in health services. Hospital Materiel Management Quarterly, 22(2), 9-17.
Bennett, R. and Kottasz, R. (2000). Emergency fundraising for disaster relief. Disaster
Prevention and Management, 9(5), 352-359.
Berman, O., Krass, D., and Menezes, M. B. C. (2007). Facility reliability issues in network
p-median problems: Strategic centralization and co-location effects. Operations
Research, 55 (2), 332-350.
M.Sc. in Management, University of Ottawa Mingli Liu
80
Borade, A. B., Kannan, G., and Bansod, S. V. (2013). Analytical hierarchy process-based
framework for VMI adoption. International Journal of Production Research, 51(4),
963-978.
Bordens, K. S. and Abbott, B. B. (2011). Research design and methods: A process approach
(8th
ed.). New York, NY: McGraw-Hill.
Bowersox, D. J. and Closs, D. J. (1996). Logistical management: The integrated supply chain
process. New York, NY: McGraw-Hill.
Campbell, A. M. and Jones, P. C. (2011). Prepositioning supplies in preparation for disasters.
European Journal of Operational Research, 209(2), 156-165. doi:
10.1016/j.ejor.2010.08.029
CBC News. (2013a). Premier estimates Alberta flood costs to top $5B. Retrieved August 23,
2013 from
http://www.cbc.ca/news/canada/calgary/story/2013/08/20/calgary-flood-numbers-alberta
-w.html
CBC News. (2013b). Toronto’s July storm cost insurers $850M: Insurance damage costs
expected to go higher, industry group warns. Retrieved August 23, 2013 from
http://www.cbc.ca/news/business/story/2013/08/14/business-insurance-flooding.html
Centre for Research on the Epidemiology of Disasters (CRED). (2013). Disaster data: A
balanced perspective. Cred Crunch, 31. Retrieved June 28, 2013 from
http://cred01.epid.ucl.ac.be/f/CredCrunch31.pdf.
Chan, F. T. S. and Qi, H. J. (2003). An innovative performance measurement method for
supply chain management. Supply Chain Management: An International Journal, 8(3),
209-223.
M.Sc. in Management, University of Ottawa Mingli Liu
81
Chang, M. S., Tseng, Y. L., and Chen, J. W. (2007). A scenario planning approach for the
flood emergency logistics preparation problem under uncertainty. Transportation
Research Part E, 43(6), 737-754. doi: 10.1016/j.tre.2006.10.013
Chopra, S. and Sodhi, M. S. (2004). Managing risk to avoid supply-chain breakdown. MIT
Sloan Management Review, 46(1), 53-61.
Chow, G., Heaver, T. D., and Henriksson, L. E. (1994). Logistics performance: Definition
and measurement. International Journal of Physical Distribution & Logistics
Management, 24(1), 17-28.
Christopher, M. (2000). The agile supply chain: Competing in volatile markets. Industrial
Marketing and Management, 29(1), 37-44.
Church, R. L. and Scaparra, M. P. (2007). Protecting critical assets: The r-interdiction median
problem with fortification. Geographical Analysis, 39(2), 129-146. doi:
10.1111/j.1538-4632.2007.00698.x
Clay Whybark, D. (2007). Issues in managing disaster relief inventories. International
Journal of Production Economics, 108(1-2), 228-235. doi: 10.1016/j.ijpe.2006.12.012
Clay Whybark, D., Melnyk, S. A., Day, J., and Davis, E. (2010). Disaster relief supply chain
management: New realities, management challenges, emerging opportunities. Dicision
Line, 41(3), 4-7.
Corbett, C. J. and Van Wassenhove, L. N. (1993). The nature drift: What happened to
operations research? Operations Research, 41(4), 625-640.
da le Torre, L. E., Dolinskaya, I. S., and Smilowitz, K. R. (2012). Disaster relief routing:
Integrating research and practice. Socio-Economic Planning Science, 46(1), 88-97.
Daniel, D. R. (1961). Management information crisis. Harvard Business Review, 39(5),
111-121.
M.Sc. in Management, University of Ottawa Mingli Liu
82
Daskin, M. S. (1983). A maximum expected covering location model: Formulation,
properties and heuristic solution. Transportation Science, 17 (1), 48-70.
Davidson, A. L. (2006). Key performance indicators in humanitarian logistics (Master’s
thesis). Retrieved June 20, 2013 from
http://www.fritzinstitute.org/pdfs/findings/xs_davidson_anne.pdf
deJong, G. and Ben-Akiva, M. (2007). A micro-simulation model of shipment size and
transport chain choice. Trandportation Research Part B: Methodological, 41(9),
950-965.
Dekle, J., Lavieri, M. S., Martin, E., Emir-Farinas, H., and Francis, R. L. (2005). A florida
county locates disaster recovery centres. Interfaces, 35(2), 133-139.
Department of Defense. (2005). Dictionary of military and associated terms. USA:
University Press of the Pacific.
Drezner, Z. (1987). Heuristic solution methods for two location problems with unreliable
facilities. Journal of the Operational Research Society, 38 (6), 509-514.
Duran, S., Gutierrez, M. A., and Keskinocak, P. (2011). Pre-positioning of emergency items
worldwide for CARE international. Informs. doi: 10.1287
EM-DAT: The OFDA/CRED International Disaster Database. Retrieved February 10, 2013
from www.emdat.be.
En Shen, T. (2006). Optimized positioning of pre-disaster relief force and assets (Master’s
thesis). Retrieved September 15, 2013 from
http://oai.dtic.mil/oai/oai?verb=getRecord&metadataPrefix=html&identifier=ADA46269
6 (ADA 462696)
M.Sc. in Management, University of Ottawa Mingli Liu
83
Ergun, O., Karakus, G., Keskinocak, P., Swann, J., and Villarreal, M. (2010). Operations
research to improve disaster supply chain management. Retrieved January 10, 2013 from
http://ca.wiley.com/WileyCDA/Section/id-397133.html
Esper, T. L. and Williams, L. R. (2003). The value of collaborative transportation
management (CTM): Its relationship to CPFR and information technology.
Transportation Journal, 42(4), 55-65.
Fiedrich, F., Gehbauer, F., and Rickers, U. (2000). Optimized resource allocation for
emergency response after earthquake disasters. Safety Science, 35(1-3), 41-57. doi:
10.1016/S0925-7535(00)00021-7
Fritz Institute. (2005). Logistics and the effective delivery of humanitarian relief. Retrieved
June 25, 2013 from
http://www.fritzinstitute.org/PDFs/Programs/tsunamiLogistics0605.pdf
Giunipero, L.C. and Eltantawy, R.A. (2004). Securing the upstream supply chain: A risk
management approach, International Journal of Physical Distribution & Logistics
Managament, 34 (9), 698-713.
Government of Alberta. (2013a). More protection for Albertans in emergencies. Retrieved
September 9, 2013 from
http://alberta.ca/release.cfm?xID=34170A33913BF-C3F2-32FE-FAAD698D27DD4BE
C
Government of Alberta. (2013b). Retrieved September 9, 2013 from
http://alberta.ca/FloodNews.cfm
Government of Canada. (2008). Emergency preparedness in Canada. Government of Canada,
Standing Senate Committee on National Security and Defence. Volume 1. 2nd
Session,
39th
Parliament.
M.Sc. in Management, University of Ottawa Mingli Liu
84
Government of Canada. (2011a). An emergency management framework for Canada:
Ministers responsible for emergency management (2nd
ed.).
Graves, S. C. and Willems, S. P. (2000). Optimizing strategic safety stock placement in
supply chains. Manufacturing & Service Operations Management, 2(1), 68-83.
Gunasekaran, A. and Ngai, E. W. T. (2003). The successful management of a small logistics
company. International Journal of Physical Distribution & Logistics Management, 33(9),
825-842.
Gunasekaran, A., Patel, C., and Tirtiroglu, E. (2001). Performance measures and metrics in a
supply chain environment. International Journal of Operations & Production
Management, 21(1/2), 71-87.
Haghani, A. and Oh, S. (1996). Formulation and solution of a multi-commodity, multi-modal
network flow model for disaster relief operations. Transportation Research Part A:
Policy and Practice, 30(3), 231-250. doi: 10.1016/0965-8564(95)00020-8
Hale, T. S. and Moberg, C. R. (2003). Location science research: A review. Annals of
Operations Research, 123(1-4), 21-35.
Heizer, J. and Render, B. (2004). Operations management (7th
ed.). Upper Saddle River, NJ:
Prentice Hall.
Henstra, D. (2011). Municipal emergency management. Retrieved September 6, 2013 from
http://www.coastalchange.ca/images/stories/Documents_Tab/henstra______municipale
mergencymanagement.pdf
Hillier, F. S. and Hillier, M. S. (2008). Introduction to management science: A modeling and
case studies approach with spreadsheet (3rd
ed.). New York, NY: McGraw-Hill.
M.Sc. in Management, University of Ottawa Mingli Liu
85
Hoque, M. A. and Goyal, S. K. (2000). An optimal policy for a single-vendor single-buyer
integrated production-inventory system with capacity constraint of the transport
equipment. International Journal of Production Economics, 65(3), 305-315.
Hua, Z., Yang, J., Huang, F., and Xu, X. (2009). A static-dynamic strategy for spare part
inventory systems with nonstationary stochastic demand. The Journal of the Operational
Research Society, 60(9), 1254-1263. doi:
http://dx.doi.org.proxy.bib.uottawa.ca/10.1057/palgrave.jors.2602656
Huang, M., Balcik, B., and Smilowitz, K. (2010). Models for relief routing: Equity,
efficiency and efficacy (expanded version). Retrieved July 26, 2013 from
http://www.iems.northwestern.edu/docs/working_papers/michael_huang_dec10.pdf
Kapucu, N. (2007). Non-profit response to catastrophic disasters. Disaster Prevention and
Management, 16(4), 551-561. doi: 10.1108/09653560710817039
Kenny, C. (2013, July 11). Canada’s disaster response in crisis. Ottawa Citizen. Retrieved
September 17, 2013 from
http://www.ottawacitizen.com/opinion/op-ed/Canada+disaster+response+crisis/8646574/
story.html
Klose, A. and Drexl, A. (2005). Facility location models for distribution system design.
European Journal of Operational Research, 162(1), 4-29. doi:
10.1016/j.ejor.2003.10.031
Knott, R. P. (1988). Vehicle scheduling for emergency relief management: A
knowledge-based approach. Disasters, 12(4), 285-293.
Korpela, J. and Tuominen, M. (1996). Benchmarking logistics performance with an
application of the analytic hierarchy process. IEEE Transactions on Engineering
Management, 43(3), 323-333.
M.Sc. in Management, University of Ottawa Mingli Liu
86
Kovács, G. and Spens, K. M. (2007). Humanitarian logistics in disaster relief operations.
International Journal of Physical Distribution & Logistics Management, 37(2), 99-114.
doi: 10.1108/09600030710734820
Lai, K., Ngai, E. W. T., and Cheng, T. C. E. (2002). Measures for evaluating supply chain
performance in transport logistics. Transportation Research Part E: Logistics and
Transportation Review, 38(6), 439-456. doi: 10.1016/S1366-5545(02)00019-4
Lee, S. (2001). On solving unreliable planar location problems. Computers and Operations
Research, 28(4), 329-344. doi: 10.1016/S0305-0548(99)00120-3
Lee, H. W. and Zbinden, M. (2003). Marrying logistics and technology for effective relief.
Forced Migration Review, 18, 34-35.
Leidecker, J. K. and Bruno, A. V. (1984). Identifying and using critical success factors. Long
Range Planning, 17(1), 23-32.
Lodree Jr, E. J. and Taskin, S. (2008). An insurance risk management framework for disaster
relief and supply chain disruption inventory planning. Journal of the Operational
Research Society, 59(5), 674-684. doi: 10.1057/palgrave.jors.2602377
Lodree Jr, E. J. and Taskin, S. (2009). Supply chain planning for hurricane response with
wind speed information updates. Computers Operations Research, 36(1), 2-15. doi:
10.1016/j.cor.2007.09.003
Martha, J. and Vratimos, E. (2003). Creating a just-in-case supply chain for the inevitable
next disaster, Mercer Mngt J, 14, pp. 70-77.
Mathbor, G. (2007). Enhancement of community preparedness for natural disasters: The role
of social work in building social capital for sustainable disaster relief and management.
International Social Work, 50(3), 357-369.
Maskell, B. (2001). The age of agile manufacturing. Supply Chain Management, 6(1), 5-11.
M.Sc. in Management, University of Ottawa Mingli Liu
87
Mattsson, S. (2007). Inventory control in environments with short lead times. International
Journal of Physical Distribution & Logistics Management, 37(2), 115-130.
McGinnis, M. A. (1989). A comparative evaluation of freight transportation choice models.
Transportation Journal, 29(2), 36-46.
Meixell, M. J. and Norbis, M. (2008). A review of the transportation mode choice and carrier
selection literature. The International Journal of Logistics Management, 19(2), 183-211.
Mete, H. O. and Zabinsky, Z. B. (2010). Stochastic optimization of medical supply location
and distribution in disaster management. International Journal of Production Economics,
126(1), 76-84. doi: 10.1016/j.ijpe.2009.10.004
Michel-Kerjan, E. and Slovic, P. (2010). A more dangerous world: Why we misunderstand
risk. Newsweek Magazine. Retrieved June 28, 2013 from
http://www.thedailybeast.com/newsweek/2010/02/18/a-more-dangerous-world.html
Naim, M. M., Portter, A. T., Mason, R. J., and Bateman, N. (2006). The role of transport
flexibility in logistics provision. The International Journal of Logistics Management,
17(3), 297-311.
Namit, K. and Chen, J. (1999). Solutions to the <Q, r> inventory model for gamma lead-time
demand. International Journal of Physical Distribution Logistics Management, 29(2),
138-154.
Naylor, J. B., Naim, M. M., and Berry, D. (1999). Leagility: Integration the lean and agile
manufacturing paradigms in the total supply chain. International Journal of Production
Economics, 62(1-2), 107-118.
Neely, A., Gregory, M., and Platts, K. (1995). Performance measurement system design: A
literature review and research agenda. International Journal of Operations & Production
Management, 15 (4), 80-116.
M.Sc. in Management, University of Ottawa Mingli Liu
88
Office of U. S. Foreign Disaster Assistance (OFDA). (1984). A glossary of international
disaster assistance terms.
Oloruntoba, R. (2010). An analysis of the Cyclone Larry emergency relief chain: Some key
success factors. International Journal of Production Economics, 126 (1), 85-101.
Oloruntoba, R. and Gray, R. (2006). Humanitarian aid: An agile supply chain? Supply Chain
Management, 11(2), 115-120. doi: 10.1108/13598540610652492
Owen, S. H. and Daskin, M. S. (1998). Strategic facility location: A review. European
Journal of Operational Research, 111(3), 423-447. doi:
10.1016/S0377-2217(98)00186-6
Ozbay, K. and Ozguven, E. E. (2007). A stochastic humanitarian inventory control model for
disaster planning [PDF document]. Retrieved August 22, 2013 from
http://www.rits.rutgers.edu/files/disasterplanning.pdf
Özdamar, L., Ekinci, E., and Küçükyazici, B. (2004). Emergency logistics planning in natural
disasters. Annals of Operations Research, 129(1-4), 217-245. doi:
10.1023/B:ANOR.0000030690.27939.39
Pan American Health Organization and World Health Organization (PAHO/WHO). (2001).
Humanitarian supply chain management and logistics in the health sector. Retrieved
June 29, 2013 from http://www.who.int/hac/techguidance/tools/LSS.pdf
Parker, C. (2000). Performance measurement. Work Study, 49(2), 63-66.
Pedraza Martinez, A. J., Stapleton, O., and Van Wassenhove, L. N. (2011). Field vehicle fleet
management in humanitarian operations: A case-based approach. Journal of Operations
Management, 29(5), 404-421. doi: 10.1016/j.jom.2010.11.013
Personal Communication. (2013, March 21). Interview with Brouillette, D, chief of
Emergency Preparedness and Response in Public Health Agency of Canada.
M.Sc. in Management, University of Ottawa Mingli Liu
89
Personal Communication. (2013, March 26). Interview with Poirier, M., senior manager of
logistics in the Canadian Red Cross.
Persson, F. and Olhager, J. (2002). Performance simulation of supply chain designs.
International Journal of Production Economics, 77(3), 231-245.
Petrovic, D., Roy, R., and Petrovic, R. (1998). Modeling and simulation of a supply chain in
an uncertain environment. European Journal of Operational Research, 109(2), 299-309.
Pettit, S. and Beresford, A. (2009). Critical success factors in the context of humanitarian aid
supply chains. International Journal of Physical Distribution Logistics Management,
39(6), 450-468. doi: 10.1108/09600030910985811
Power, D. J., Sohal, A. S., and Rahman, S. (2001). Critical success factors in agile supply
chain management – An empirical study. International Journal of Physical Distribution
& Logistics Management, 31(4), 247-265.
Public Health Agency of Canada (PHAC). (2012). National Emergency Stockpile System.
Retrieved July 20, 2013 from http://www.phac-aspc.gc.ca/ep-mu/ness-eng.php
Public Safety Canada. (2013). Floods. Retrieved September 1, 2013 from
http://www.publicsafety.gc.ca/cnt/mrgnc-mngmnt/ntrl-hzrds/fld-eng.aspx
Qu, W. W., Bookbinder, J. H., and Iyogun, P. (1999). An integrated inventory-transportation
system with modified periodic policy for multiple products. European Journal of
Operational Research, 115(2), 254-269.
Quesada, H., Gazo, R., and Sanchez, S. (2012). Critical factors affecting supply chain
management: A case study in the US pallet industry. In Groznik, A. (Ed.), Pathways to
supply chain excellence, (pp. 33-56). InTech. Retrieved July 10, 2013 from
http://www.intechopen.com/books/pathways-tosupply-chain-excellence/critical-success-
factors-for-supply-chain-management-in-wood-industry
M.Sc. in Management, University of Ottawa Mingli Liu
90
Rao Tummala, V. M., Phillips, C. L. M., and Johnson, M. (2006). Assessing supply chain
management success factors: A case study. Supply Chain Management: An International
Journal, 11(2), 179-192.
Razzaque, M. A. and Sheng, C. C. (1998). Outsourcing of logistics functions: A literature
survey. International Journal of Physical Distribution & Logistics Management, 28(2),
89-107.
ReVelle, C. S. and Eiselt, H. A. (2005). Location analysis: A synthesis and survey. European
Journal of Operational Research, 165(1), 1-19. doi: 10.1016/j.ejor.2003.11.032
Rockart, J. F. (1979). Chief executives define their own data needs. Harvard Business Review,
57(2), 238-241.
Rottkemper, B., Fischer, K., Blecken, A., and Danne, C. (2011). Inventory relocation for
overlapping disaster settings in humanitarian operations. OR-Spektrum, 33(3), 721-749.
doi: 10.1007/s00291-011-0260-5
Salas, L. C., Cárdenas, M. R., and Zhang, M. (2012). Inventory policies for humanitarian aid
during hurricanes. Socio-Economic Planning Sciences, 46(4), 272-280. doi:
10.1016/j.seps.2012.02.002
Samii, R., Van Wassenhove, L. N., Kumar, K., and Becerra-Fernandez, I. (2002). IFRC:
Choreographer of disaster management: Preparing for tomorrow’s disasters. Retrieved
June 30, 2013 from
http://www.fritzinstitute.org/PDFs/Case-Studies/Hurricane%20Mitch.pdf
Sampson, T. (2007). Proceeding of the Standing Senate Committee on National Security and
Defence [Hearing transcript]. Retrieved June 28, 2013 from
http://www.parl.gc.ca/Content/SEN/Committee/391/defe/09evc-e.htm?Language=E&Par
l=39&Ses=1&comm_id=76
M.Sc. in Management, University of Ottawa Mingli Liu
91
Scholten, K., Scott, P. S., and Fynes, B. (2010). (Le)agility in humanitarian aid (NGO) supply
chains. International Journal of Physical Distribution Logistics Management, 40(8),
623-635. doi: 10.1108/09600031011079292
Sezen, B. (2006). Changes in performance under various lengths of review periods in a
periodic review inventory control system with lost sales: A simulation study.
International Journal of Physical Distribution & Logistics Management, 36(5), 360-373.
Shepherd, C. and Günter, H. (2006). Measuring supply chain performance: Current research
and future directions. International Journal of Productivity and Performance
Management, 55(3/4), 242-258.
Slack, N. (2005). The flexibility of manufacturing systems. International Journal of
Operations & Production Management, 25(12), 1190-1200.
Snyder, L. V. and Daskin, M. S. (2005). Reliability models for facility location: The expected
failure cost case. Transportation Science, 39(3), 400.
Stevenson, W. J. and Hojati, M. (2004). Operations management (2nd
ed.). Canada:
McGraw-Hill Ryerson Higher Education.
Swenseth, S. R. and Godfrey, M. R. (2002). Incorporating transportation costs into inventory
replenishment decisions. International Journal of Production Economics, 77(2),
113-130.
Taskin, S. and Lodree Jr, E. J. (2010). Inventory decisions for emergency supplies based on
hurricane count predictions. International Journal of Production Economics, 126(1),
66-75. doi: 10.1016/j.ijpe.2009.10.008
Taskin, S. and Lodree Jr, E. J. (2011). A bayesian decision model with hurricane forecast
updates for emergency supplies inventory management. Journal of the Operational
Research Society, 62(6), 1098-1108. doi: 10.1057/jors.2010.14
M.Sc. in Management, University of Ottawa Mingli Liu
92
TheStar. (2010, September 22). Hurricane Igor rips into Nfld., washing out roads, toppling
trees. Retrieved February 8, 2011 from
http://www.thestar.com/news/canada/article/864119--hurricane-igor-rips-into-nfld-washi
ng-out-roads-toppling-trees
Thomas, A. S. (2007). Humanitarian logistics: Enabling disaster response. Retrieved May 28,
2013 from
http://www.fritzinstitute.org/PDFs/WhitePaper/EnablingDisasterResponse.pdf
Thomas, A. S. and Kopczak, L. R. (2005). From logistics to supply chain management: the
path forward in the humanitarian sector. Retrieved June 12, 2013 from
http://www.fritzinstitute.org/pdfs/whitepaper/fromlogisticsto.pdf
Tufekci, S. and Wallace, W. A. (1998). The emerging area of emergency management and
engineering. IEEE Transactions on Engineering Management, 45(2), 103-105.
Tzeng, G. H., Cheng, H. J., and Huang, T. D. (2007). Multi-objective optimal planning for
designing relief delivery systems. Transportation Research Part E, 43(6), 673-686.
Ukkusuri, S. V. and Yushimito, W. F. (2008). Location routing approach for the humanitarian
prepositioning problem. Transportation Research Record: Journal of the Transportation
Research Board, (2089), 18-25. doi: 10.3141/2089-03
Umble, E. J., Haft, R. R., and Umble, M. M. (2003). Enterprise resource planning –
implementation procedures and critical success factors. European Journal of
Operational Research, 146(2), 241-257.
United Nations. (1992). Glossary: Internationally Agreed Glossary of Basic Terms Related to
Disaster Management. UN International Decade for Natural Disaster Reduction,
Geneva.
M.Sc. in Management, University of Ottawa Mingli Liu
93
Van Hentenryck, P., Bent, R., and Coffrin, C. (2010). Strategic planning for disaster recovery
with stochastic last mile distribution. Retrieved September 26, 2013 from
http://vidiowiki.com/media/paper/hfc7xay%20hfc7xay.pdf
Van Wassenhove, L. N. (2006). Blackett memorial lecture humanitarian aid logistics: Supply
chain management in high gear. Journal of the Operational Research Society, 57(5),
475-489. doi: 10.1057/palgrave.jors.2602125
Voss, M. D., Page, T. J., Keller, S. B., and Ozment, J. (2006). Determining important carrier
atttibutes: A fresh perspective using the theory of reasoned action. Transportation
Journal, 45(3), 7-19.
WebFinance, Inc. (2013). BusinessDictionary.com. Retrieved August 5, 2013 from
http://www.businessdictionary.com/aboutus.php
Williams, B. D. and Tokar, T. (2008). A review of inventory management research in major
logistics journals: Themes and future directions. The International Journal of Logistics
Management, 19(2), 212-232.
Wilson, R. (2006). Embracing security as a core business function [PDF document]. 17th
annual state of logistics report. Council of Supply Chain Management Professionals,
Lombard, IL.
Wong, K. Y. (2005). Critical success factors for implementing knowledge management in
small and medium enterprises. Industrial Management & Data Systems, 105(3),
261-279.
World Economic Forum. Disaster Management. Retrieved February 9, 2013 from
http://www.weforum.org/issues/disaster-management
Yang, J., Qi, X., and Yu, G. (2005). Disruption management in production planning. Naval
Research Logistics, 52(5), 420-442. doi: 10.1002/nav.20087
M.Sc. in Management, University of Ottawa Mingli Liu
94
Yao, Y. and Dresner, M. (2008). The inventory value of information sharing, continuous
replenishment, and vendor-managed inventory. Transportation Research: Part E, 44(3),
361-378.
Yi, W. and Kumar, A. (2007). Ant colony optimization for disaster relief operations.
Transportation Research Part E, 43(6), 660-672. doi: 10.1016/j.tre.2006.05.004
Zhang, X. F. (2013). Inventory management. Beijing: Peking University Press.
Zolin, R. (2002). Swift trust in hastily formed networks. Retrieved August 25, 2013 from
http://www.nps.edu/cebrowski/docs/swifttrust100302.pdf
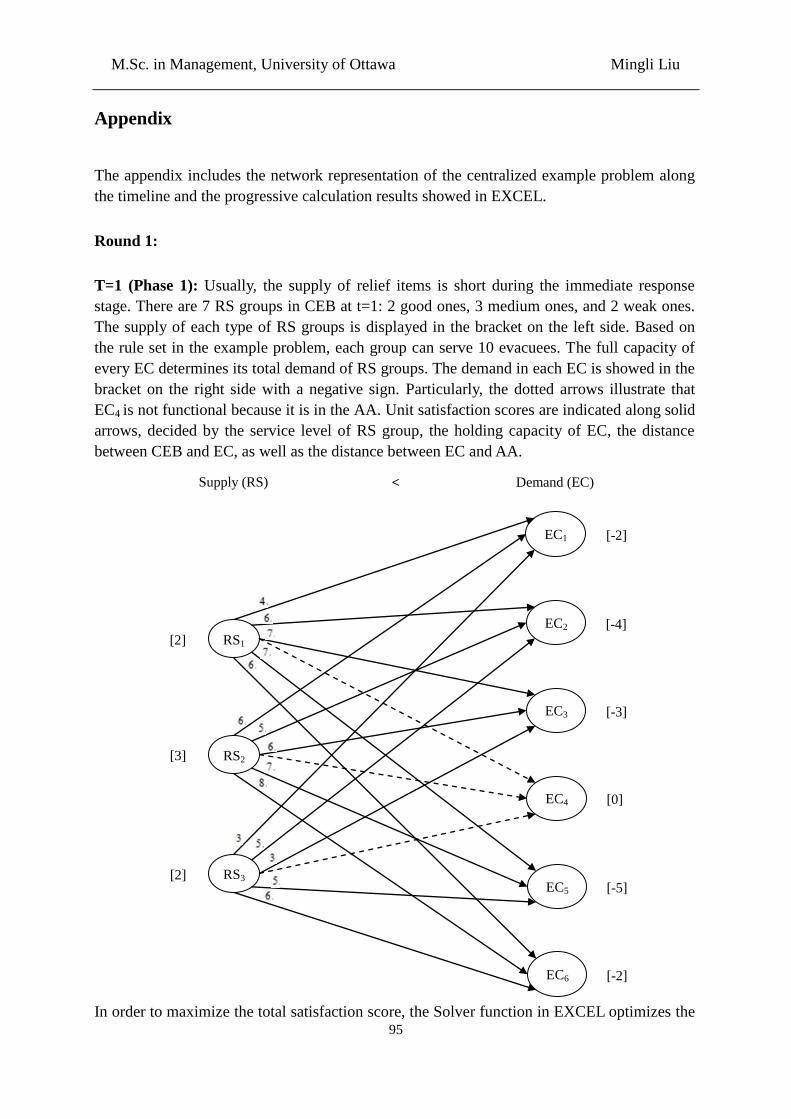
M.Sc. in Management, University of Ottawa Mingli Liu
95
Appendix
The appendix includes the network representation of the centralized example problem along
the timeline and the progressive calculation results showed in EXCEL.
Round 1:
T=1 (Phase 1): Usually, the supply of relief items is short during the immediate response
stage. There are 7 RS groups in CEB at t=1: 2 good ones, 3 medium ones, and 2 weak ones.
The supply of each type of RS groups is displayed in the bracket on the left side. Based on
the rule set in the example problem, each group can serve 10 evacuees. The full capacity of
every EC determines its total demand of RS groups. The demand in each EC is showed in the
bracket on the right side with a negative sign. Particularly, the dotted arrows illustrate that
EC4 is not functional because it is in the AA. Unit satisfaction scores are indicated along solid
arrows, decided by the service level of RS group, the holding capacity of EC, the distance
between CEB and EC, as well as the distance between EC and AA.
In order to maximize the total satisfaction score, the Solver function in EXCEL optimizes the
RS1
RS2
RS3
EC1
EC2
EC3
EC5
EC4
EC6
Supply (RS) Demand (EC)
[2]
[3]
[2]
[-2]
[-4]
[-3]
[0]
[-5]
[-2]
<
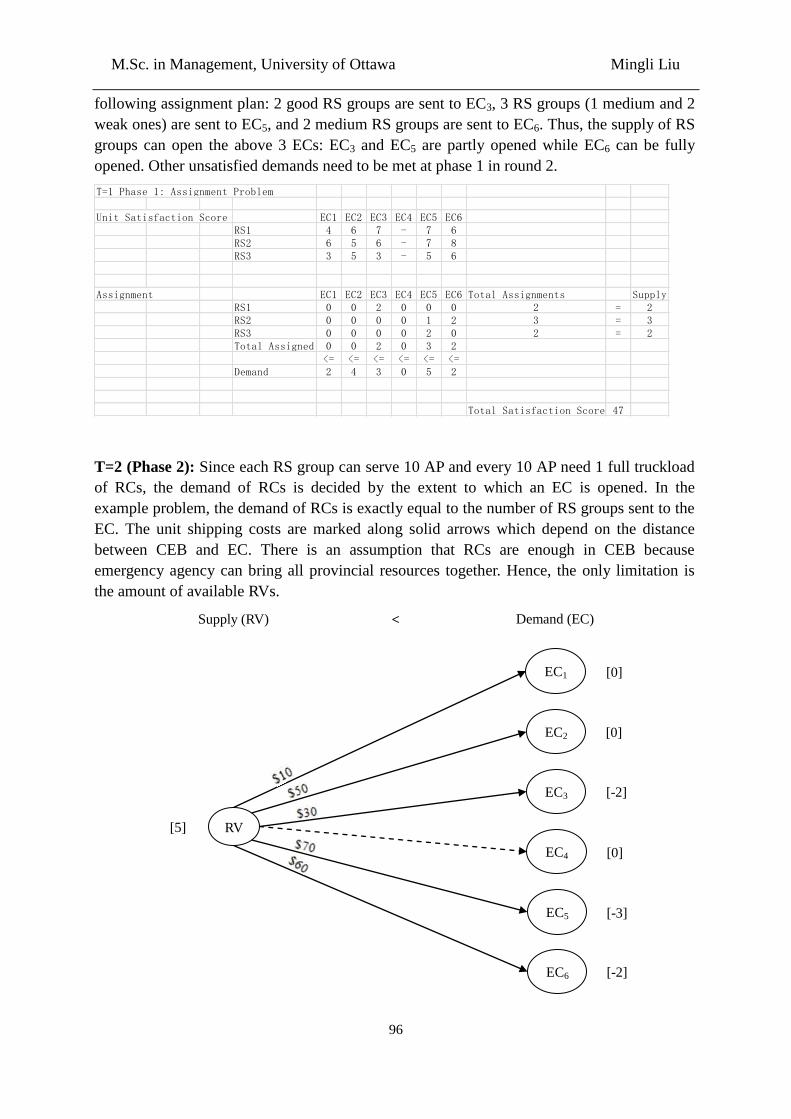
M.Sc. in Management, University of Ottawa Mingli Liu
96
following assignment plan: 2 good RS groups are sent to EC3, 3 RS groups (1 medium and 2
weak ones) are sent to EC5, and 2 medium RS groups are sent to EC6. Thus, the supply of RS
groups can open the above 3 ECs: EC3 and EC5 are partly opened while EC6 can be fully
opened. Other unsatisfied demands need to be met at phase 1 in round 2.
T=2 (Phase 2): Since each RS group can serve 10 AP and every 10 AP need 1 full truckload
of RCs, the demand of RCs is decided by the extent to which an EC is opened. In the
example problem, the demand of RCs is exactly equal to the number of RS groups sent to the
EC. The unit shipping costs are marked along solid arrows which depend on the distance
between CEB and EC. There is an assumption that RCs are enough in CEB because
emergency agency can bring all provincial resources together. Hence, the only limitation is
the amount of available RVs.
Unit Satisfaction Score EC1 EC2 EC3 EC4 EC5 EC6RS1 4 6 7 - 7 6RS2 6 5 6 - 7 8RS3 3 5 3 - 5 6
Assignment EC1 EC2 EC3 EC4 EC5 EC6 Total Assignments SupplyRS1 0 0 2 0 0 0 2 = 2RS2 0 0 0 0 1 2 3 = 3RS3 0 0 0 0 2 0 2 = 2Total Assigned 0 0 2 0 3 2
<= <= <= <= <= <=Demand 2 4 3 0 5 2
Total Satisfaction Score 47
T=1 Phase 1: Assignment Problem
RV
EC1
EC2
EC3
EC5
EC4
EC6
Supply (RV) Demand (EC)
[5]
[0]
[0]
[-2]
[0]
[-3]
[-2]
<
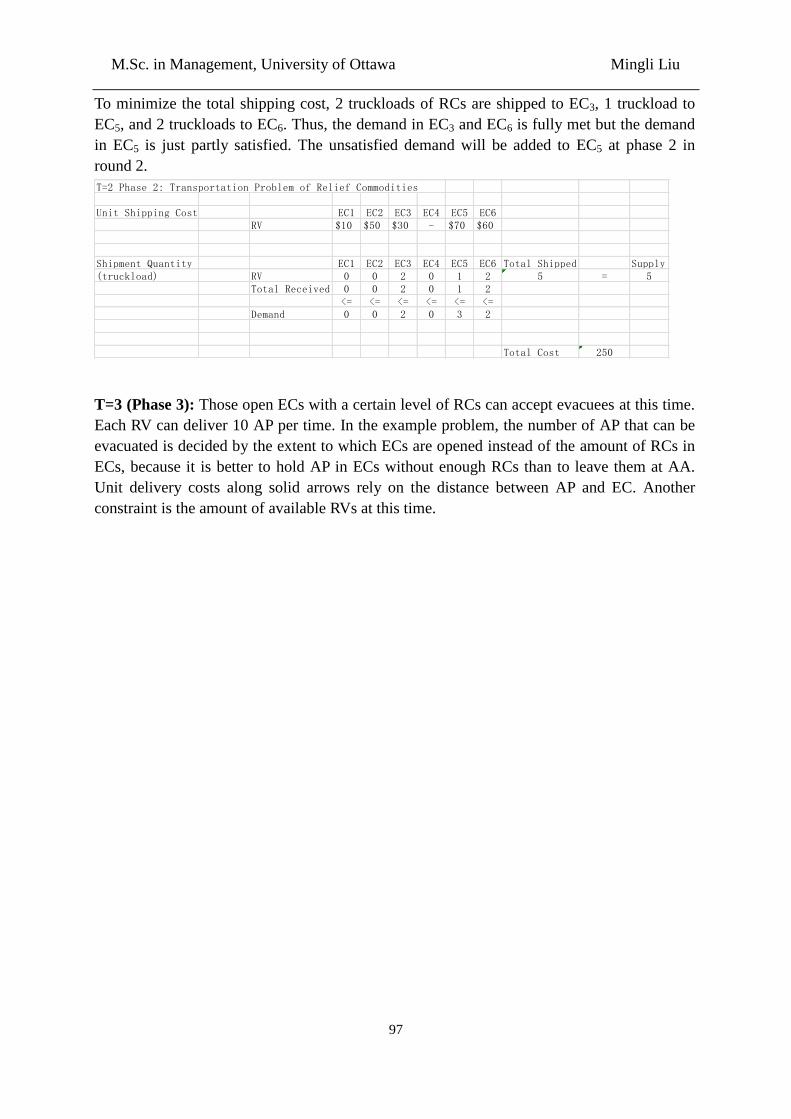
M.Sc. in Management, University of Ottawa Mingli Liu
97
To minimize the total shipping cost, 2 truckloads of RCs are shipped to EC3, 1 truckload to
EC5, and 2 truckloads to EC6. Thus, the demand in EC3 and EC6 is fully met but the demand
in EC5 is just partly satisfied. The unsatisfied demand will be added to EC5 at phase 2 in
round 2.
T=3 (Phase 3): Those open ECs with a certain level of RCs can accept evacuees at this time.
Each RV can deliver 10 AP per time. In the example problem, the number of AP that can be
evacuated is decided by the extent to which ECs are opened instead of the amount of RCs in
ECs, because it is better to hold AP in ECs without enough RCs than to leave them at AA.
Unit delivery costs along solid arrows rely on the distance between AP and EC. Another
constraint is the amount of available RVs at this time.
T=2 Phase 2: Transportation Problem of Relief Commodities
Unit Shipping Cost EC1 EC2 EC3 EC4 EC5 EC6RV $10 $50 $30 - $70 $60
Shipment Quantity EC1 EC2 EC3 EC4 EC5 EC6 Total Shipped Supply(truckload) RV 0 0 2 0 1 2 5 = 5
Total Received 0 0 2 0 1 2<= <= <= <= <= <=
Demand 0 0 2 0 3 2
Total Cost 250
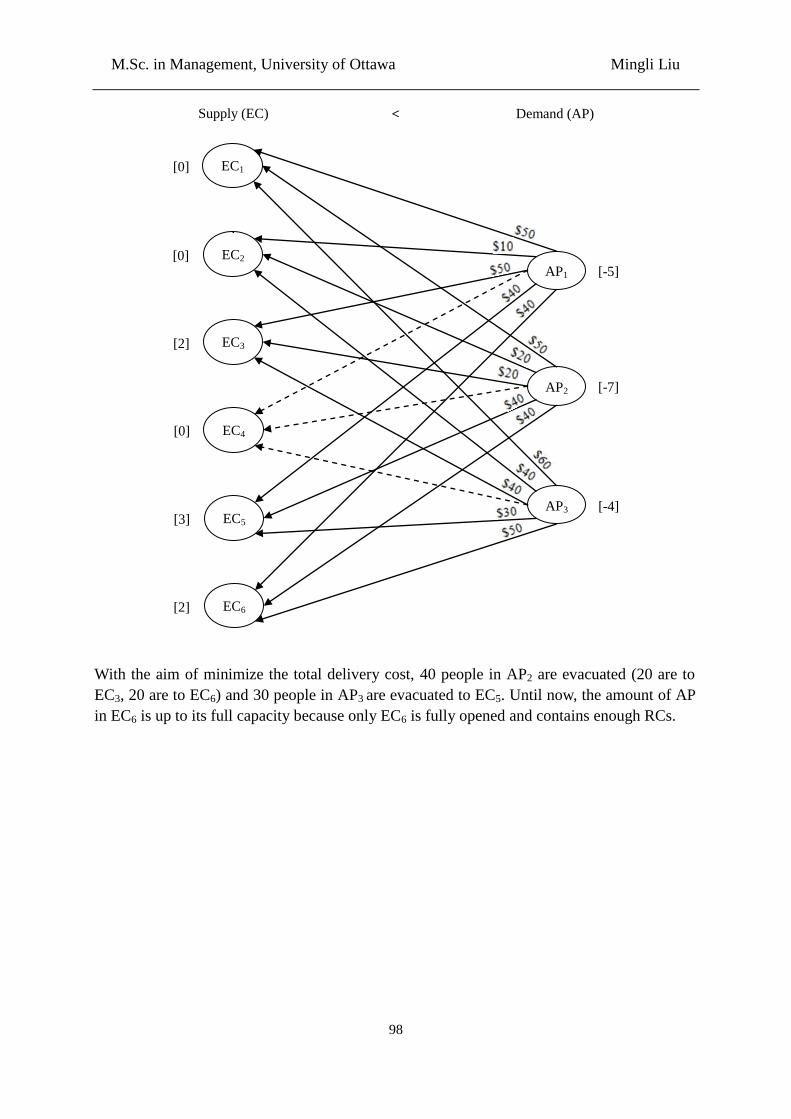
M.Sc. in Management, University of Ottawa Mingli Liu
98
With the aim of minimize the total delivery cost, 40 people in AP2 are evacuated (20 are to
EC3, 20 are to EC6) and 30 people in AP3 are evacuated to EC5. Until now, the amount of AP
in EC6 is up to its full capacity because only EC6 is fully opened and contains enough RCs.
AP1
AP2
AP3
EC1
EC2
EC3
EC5
EC4
EC6
Supply (EC) Demand (AP)
[-5]
[-7]
[-4]
[0]
[0]
[2]
[0]
[3]
[2]
<
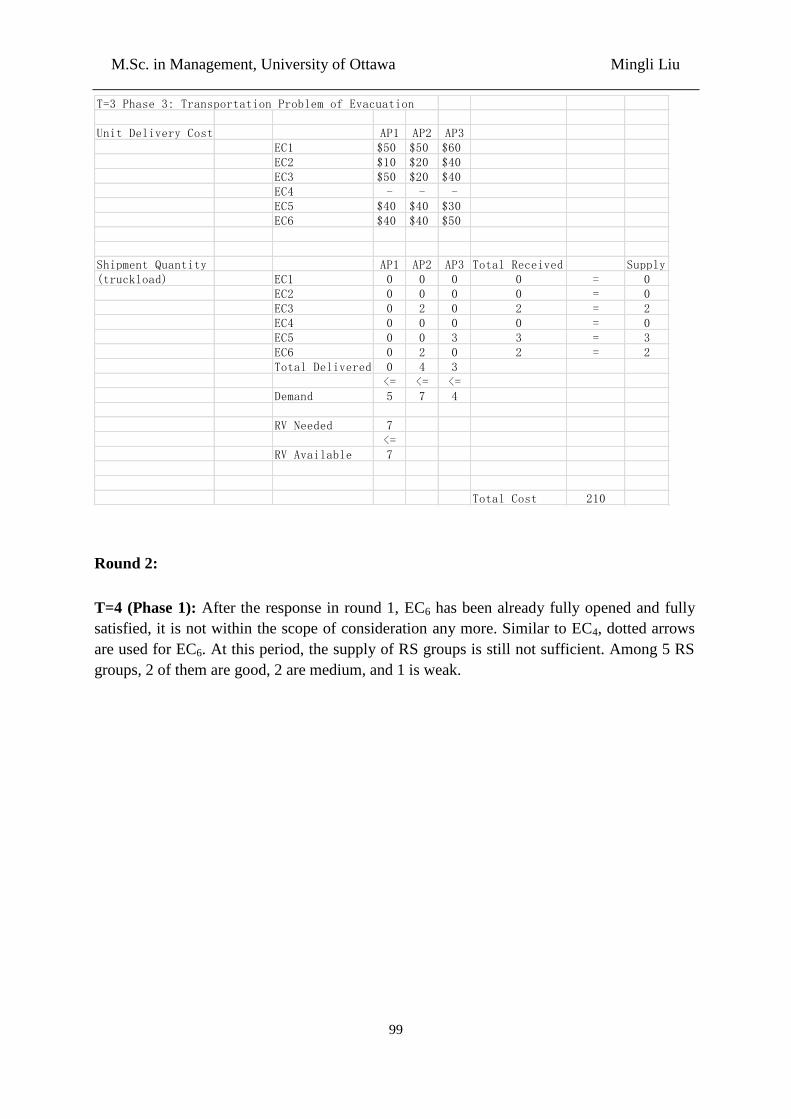
M.Sc. in Management, University of Ottawa Mingli Liu
99
Round 2:
T=4 (Phase 1): After the response in round 1, EC6 has been already fully opened and fully
satisfied, it is not within the scope of consideration any more. Similar to EC4, dotted arrows
are used for EC6. At this period, the supply of RS groups is still not sufficient. Among 5 RS
groups, 2 of them are good, 2 are medium, and 1 is weak.
T=3 Phase 3: Transportation Problem of Evacuation
Unit Delivery Cost AP1 AP2 AP3EC1 $50 $50 $60EC2 $10 $20 $40EC3 $50 $20 $40EC4 - - -EC5 $40 $40 $30EC6 $40 $40 $50
Shipment Quantity AP1 AP2 AP3 Total Received Supply(truckload) EC1 0 0 0 0 = 0
EC2 0 0 0 0 = 0EC3 0 2 0 2 = 2EC4 0 0 0 0 = 0EC5 0 0 3 3 = 3EC6 0 2 0 2 = 2Total Delivered 0 4 3
<= <= <=Demand 5 7 4
RV Needed 7<=
RV Available 7
Total Cost 210
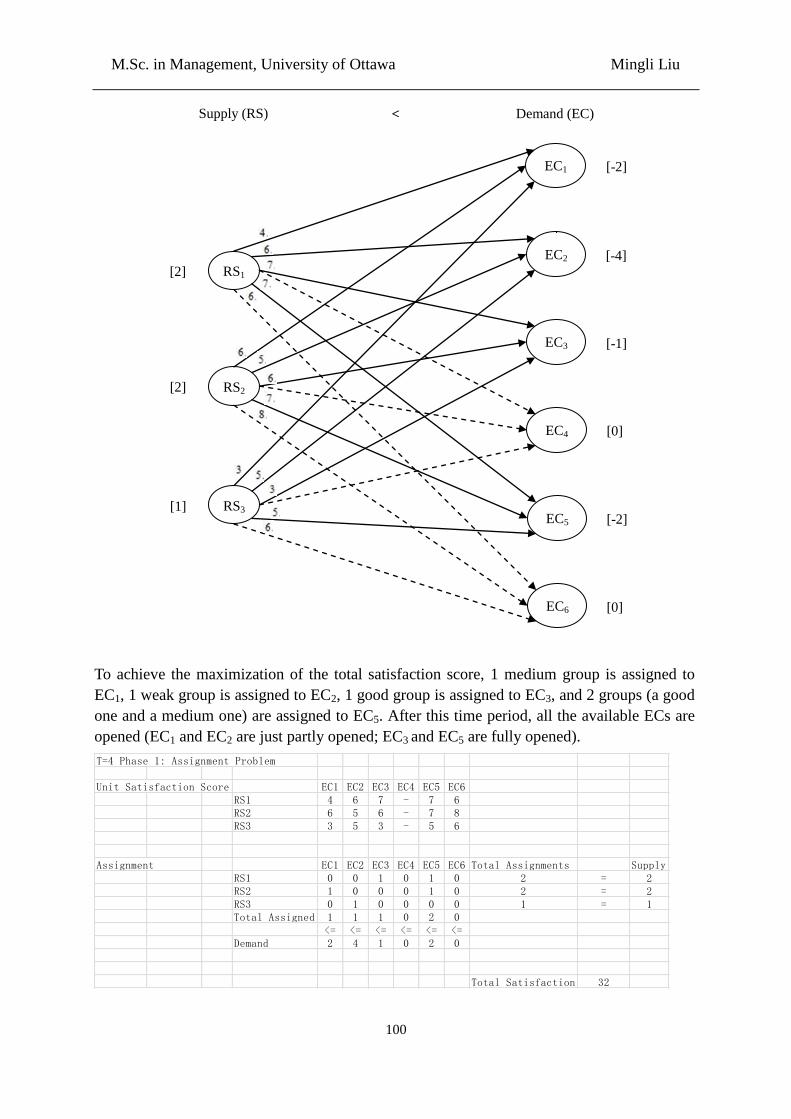
M.Sc. in Management, University of Ottawa Mingli Liu
100
To achieve the maximization of the total satisfaction score, 1 medium group is assigned to
EC1, 1 weak group is assigned to EC2, 1 good group is assigned to EC3, and 2 groups (a good
one and a medium one) are assigned to EC5. After this time period, all the available ECs are
opened (EC1 and EC2 are just partly opened; EC3 and EC5 are fully opened).
T=4 Phase 1: Assignment Problem
Unit Satisfaction Score EC1 EC2 EC3 EC4 EC5 EC6RS1 4 6 7 - 7 6RS2 6 5 6 - 7 8RS3 3 5 3 - 5 6
Assignment EC1 EC2 EC3 EC4 EC5 EC6 Total Assignments SupplyRS1 0 0 1 0 1 0 2 = 2RS2 1 0 0 0 1 0 2 = 2RS3 0 1 0 0 0 0 1 = 1Total Assigned 1 1 1 0 2 0
<= <= <= <= <= <=Demand 2 4 1 0 2 0
Total Satisfaction Score32
RS1
RS2
RS3
EC1
EC2
EC3
EC5
EC4
EC6
Supply (RS) Demand (EC)
[2]
[2]
[1]
[-2]
[-4]
[-1]
[0]
[-2]
[0]
<
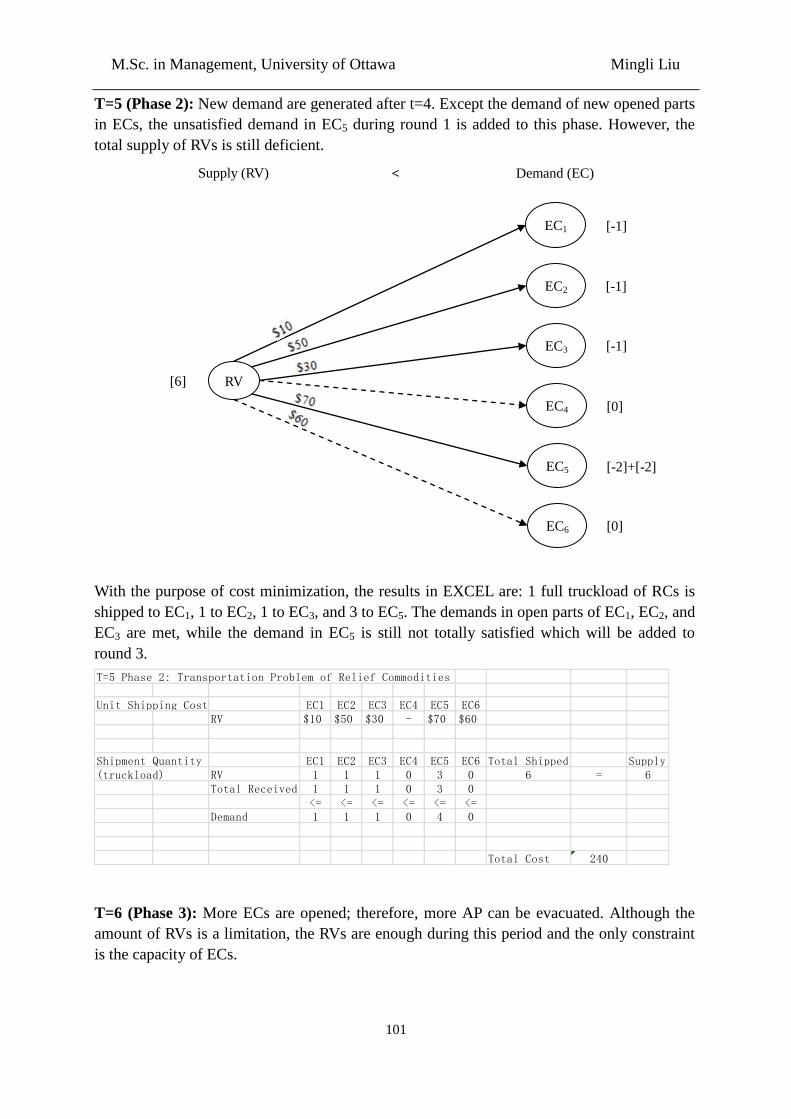
M.Sc. in Management, University of Ottawa Mingli Liu
101
T=5 (Phase 2): New demand are generated after t=4. Except the demand of new opened parts
in ECs, the unsatisfied demand in EC5 during round 1 is added to this phase. However, the
total supply of RVs is still deficient.
With the purpose of cost minimization, the results in EXCEL are: 1 full truckload of RCs is
shipped to EC1, 1 to EC2, 1 to EC3, and 3 to EC5. The demands in open parts of EC1, EC2, and
EC3 are met, while the demand in EC5 is still not totally satisfied which will be added to
round 3.
T=6 (Phase 3): More ECs are opened; therefore, more AP can be evacuated. Although the
amount of RVs is a limitation, the RVs are enough during this period and the only constraint
is the capacity of ECs.
T=5 Phase 2: Transportation Problem of Relief Commodities
Unit Shipping Cost EC1 EC2 EC3 EC4 EC5 EC6RV $10 $50 $30 - $70 $60
Shipment Quantity EC1 EC2 EC3 EC4 EC5 EC6 Total Shipped Supply(truckload) RV 1 1 1 0 3 0 6 = 6
Total Received 1 1 1 0 3 0<= <= <= <= <= <=
Demand 1 1 1 0 4 0
Total Cost 240
RV
EC1
EC2
EC3
EC5
EC4
EC6
Supply (RV) Demand (EC)
[6]
[-1]
[-1]
[-1]
[0]
[-2]+[-2]
[0]
<
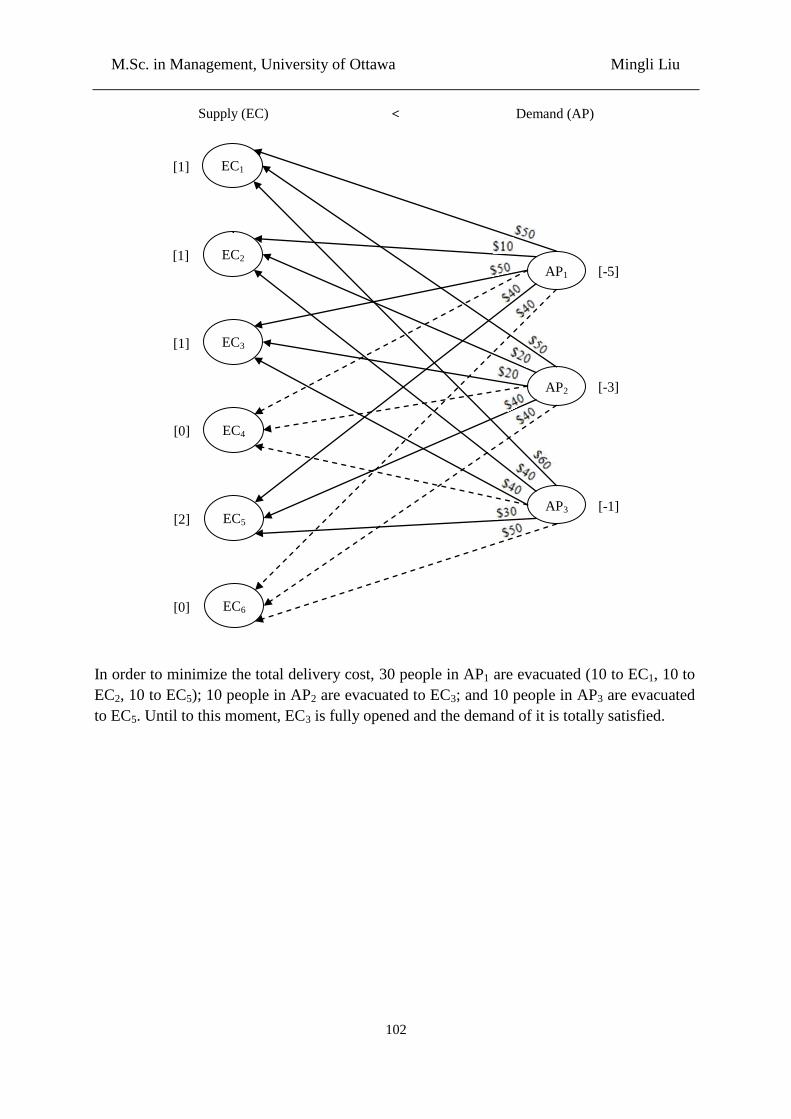
M.Sc. in Management, University of Ottawa Mingli Liu
102
In order to minimize the total delivery cost, 30 people in AP1 are evacuated (10 to EC1, 10 to
EC2, 10 to EC5); 10 people in AP2 are evacuated to EC3; and 10 people in AP3 are evacuated
to EC5. Until to this moment, EC3 is fully opened and the demand of it is totally satisfied.
AP1
AP2
AP3
EC1
EC2
EC3
EC5
EC4
EC6
Supply (EC) Demand (AP)
[-5]
[-3]
[-1]
[1]
[1]
[1]
[0]
[2]
[0]
<
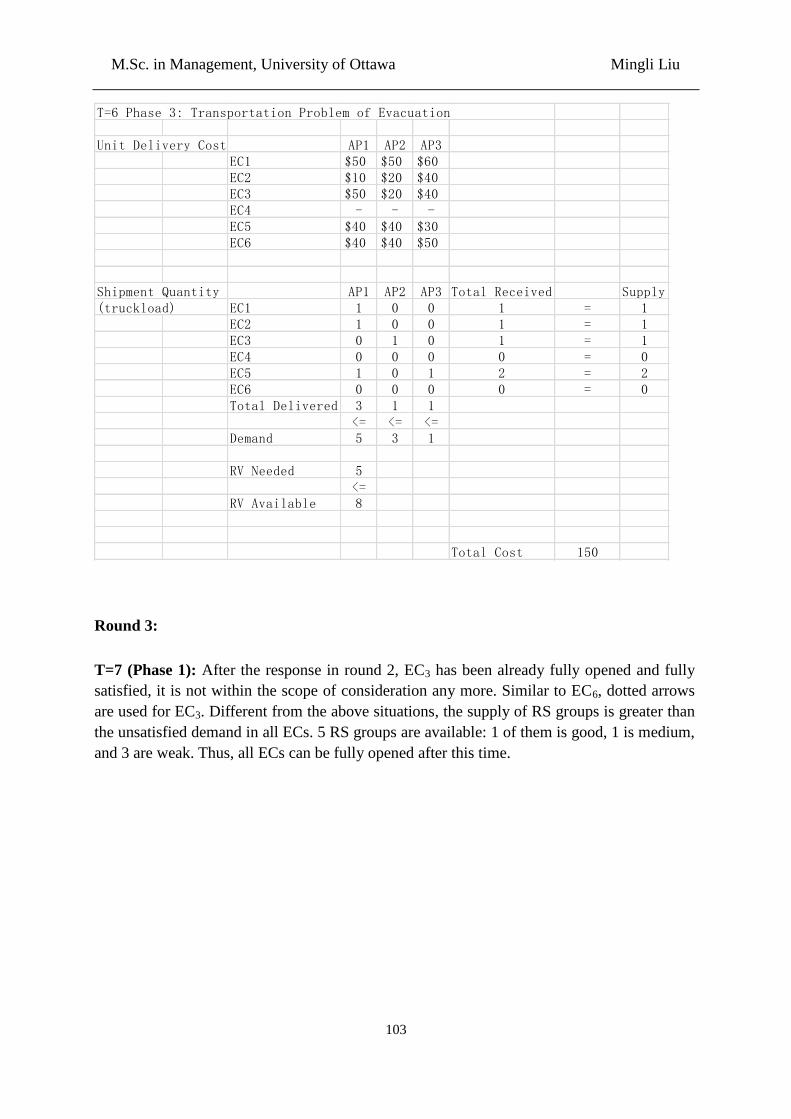
M.Sc. in Management, University of Ottawa Mingli Liu
103
Round 3:
T=7 (Phase 1): After the response in round 2, EC3 has been already fully opened and fully
satisfied, it is not within the scope of consideration any more. Similar to EC6, dotted arrows
are used for EC3. Different from the above situations, the supply of RS groups is greater than
the unsatisfied demand in all ECs. 5 RS groups are available: 1 of them is good, 1 is medium,
and 3 are weak. Thus, all ECs can be fully opened after this time.
T=6 Phase 3: Transportation Problem of Evacuation
Unit Delivery Cost AP1 AP2 AP3EC1 $50 $50 $60EC2 $10 $20 $40EC3 $50 $20 $40EC4 - - -EC5 $40 $40 $30EC6 $40 $40 $50
Shipment Quantity AP1 AP2 AP3 Total Received Supply(truckload) EC1 1 0 0 1 = 1
EC2 1 0 0 1 = 1EC3 0 1 0 1 = 1EC4 0 0 0 0 = 0EC5 1 0 1 2 = 2EC6 0 0 0 0 = 0Total Delivered 3 1 1
<= <= <=Demand 5 3 1
RV Needed 5<=
RV Available 8
Total Cost 150
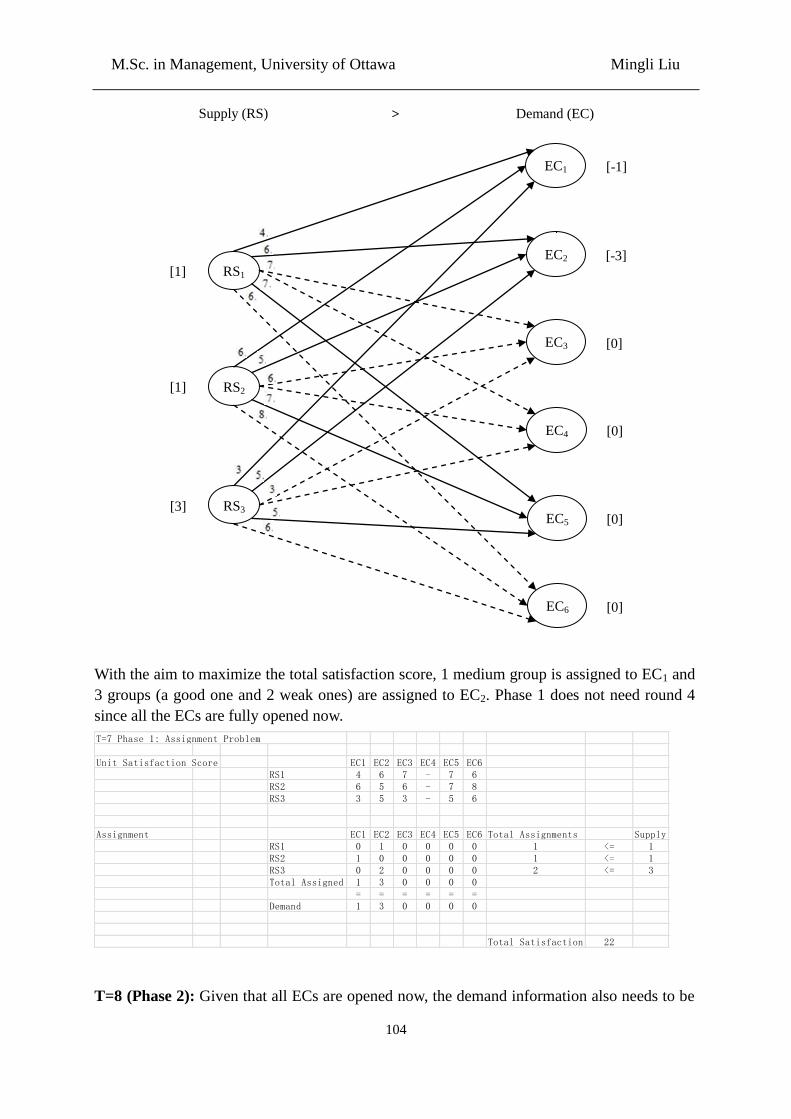
M.Sc. in Management, University of Ottawa Mingli Liu
104
With the aim to maximize the total satisfaction score, 1 medium group is assigned to EC1 and
3 groups (a good one and 2 weak ones) are assigned to EC2. Phase 1 does not need round 4
since all the ECs are fully opened now.
T=8 (Phase 2): Given that all ECs are opened now, the demand information also needs to be
Unit Satisfaction Score EC1 EC2 EC3 EC4 EC5 EC6RS1 4 6 7 - 7 6RS2 6 5 6 - 7 8RS3 3 5 3 - 5 6
Assignment EC1 EC2 EC3 EC4 EC5 EC6 Total Assignments SupplyRS1 0 1 0 0 0 0 1 <= 1RS2 1 0 0 0 0 0 1 <= 1RS3 0 2 0 0 0 0 2 <= 3Total Assigned 1 3 0 0 0 0
= = = = = =Demand 1 3 0 0 0 0
Total Satisfaction Score22
T=7 Phase 1: Assignment Problem
RS1
RS2
RS3
EC1
EC2
EC3
EC5
EC4
EC6
Supply (RS) Demand (EC)
[1]
[1]
[3]
[-1]
[-3]
[0]
[0]
[0]
[0]
>
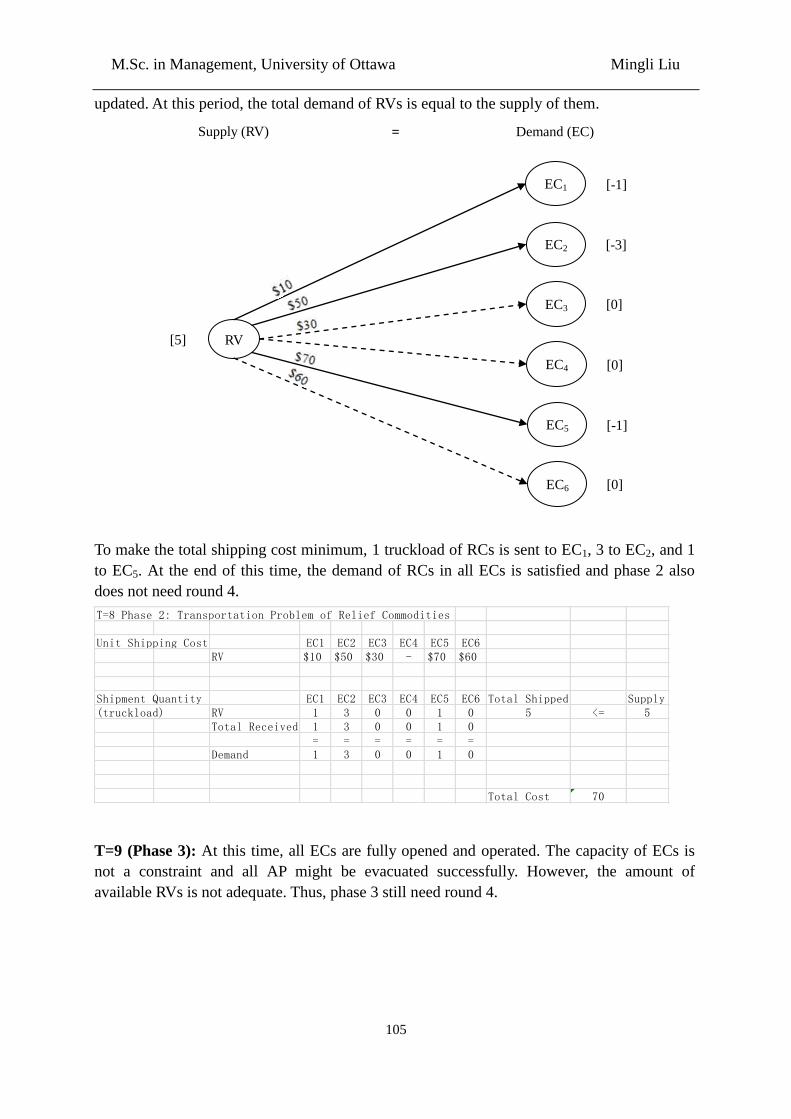
M.Sc. in Management, University of Ottawa Mingli Liu
105
updated. At this period, the total demand of RVs is equal to the supply of them.
To make the total shipping cost minimum, 1 truckload of RCs is sent to EC1, 3 to EC2, and 1
to EC5. At the end of this time, the demand of RCs in all ECs is satisfied and phase 2 also
does not need round 4.
T=9 (Phase 3): At this time, all ECs are fully opened and operated. The capacity of ECs is
not a constraint and all AP might be evacuated successfully. However, the amount of
available RVs is not adequate. Thus, phase 3 still need round 4.
T=8 Phase 2: Transportation Problem of Relief Commodities
Unit Shipping Cost EC1 EC2 EC3 EC4 EC5 EC6RV $10 $50 $30 - $70 $60
Shipment Quantity EC1 EC2 EC3 EC4 EC5 EC6 Total Shipped Supply(truckload) RV 1 3 0 0 1 0 5 <= 5
Total Received 1 3 0 0 1 0= = = = = =
Demand 1 3 0 0 1 0
Total Cost 70
RV
EC1
EC2
EC3
EC5
EC4
EC6
Supply (RV) Demand (EC)
[5]
[-1]
[-3]
[0]
[0]
[-1]
[0]
=
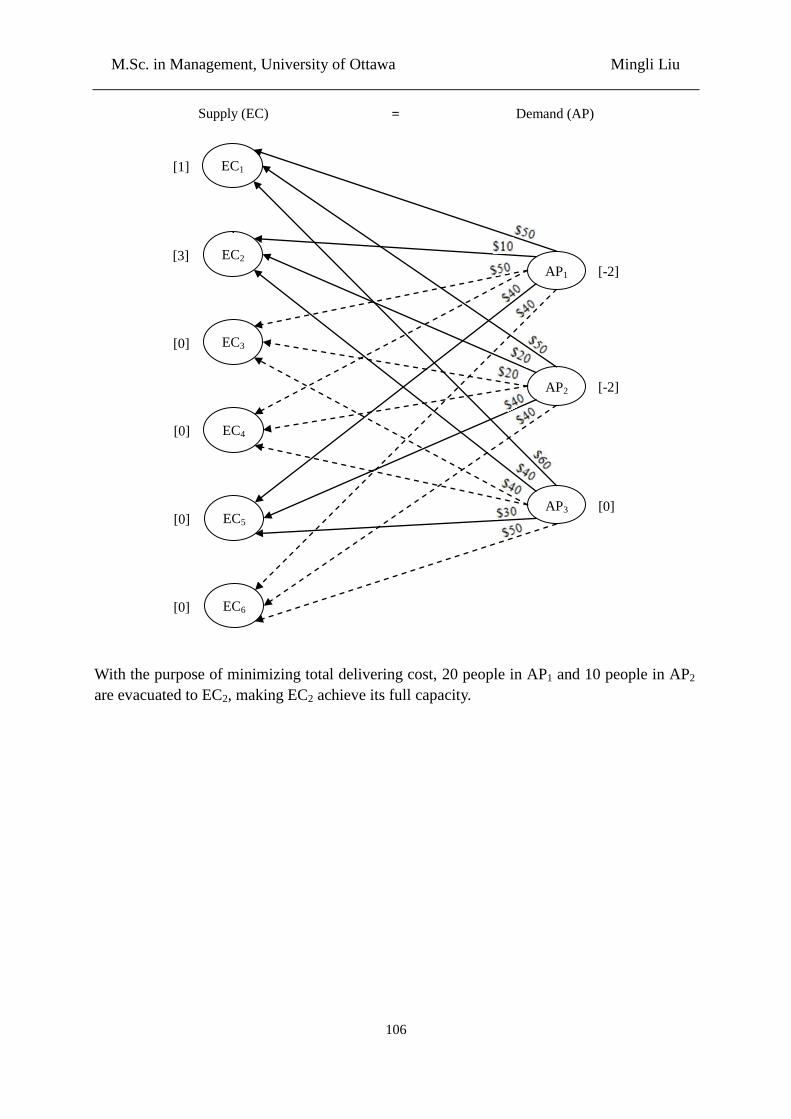
M.Sc. in Management, University of Ottawa Mingli Liu
106
With the purpose of minimizing total delivering cost, 20 people in AP1 and 10 people in AP2
are evacuated to EC2, making EC2 achieve its full capacity.
AP1
AP2
AP3
EC1
EC2
EC3
EC5
EC4
EC6
Supply (EC) Demand (AP)
[-2]
[-2]
[0]
[1]
[3]
[0]
[0]
[0]
[0]
=
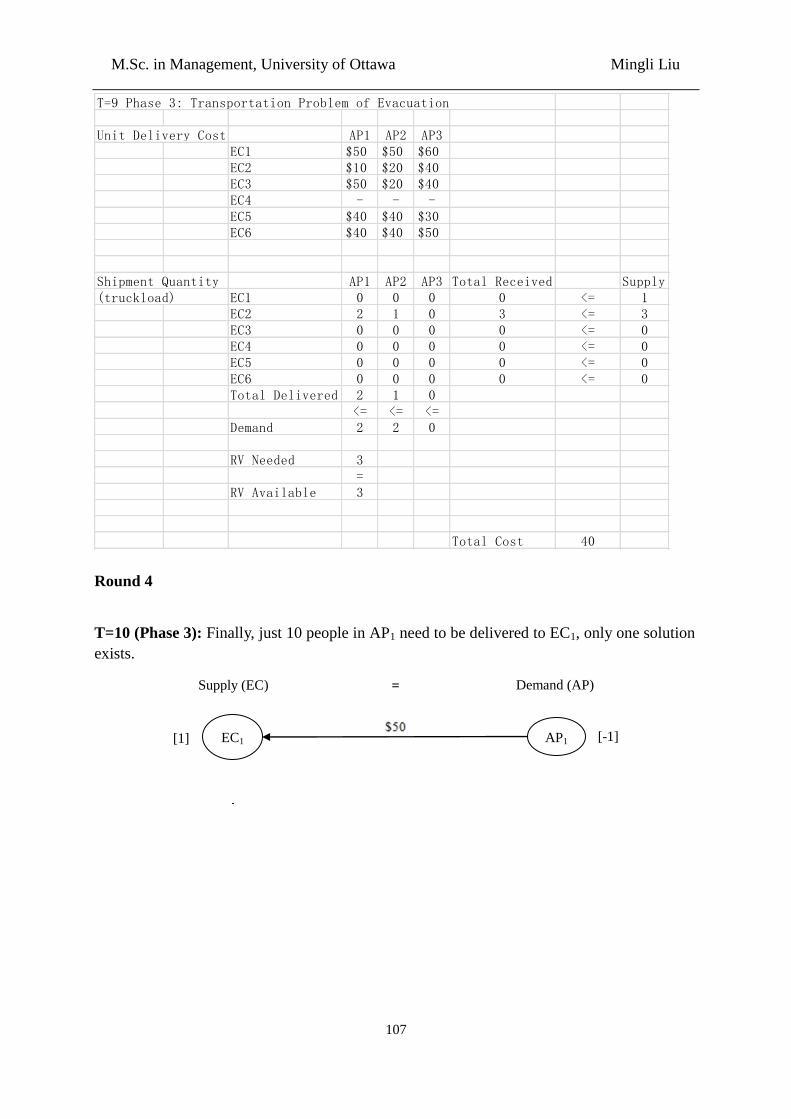
M.Sc. in Management, University of Ottawa Mingli Liu
107
Round 4
T=10 (Phase 3): Finally, just 10 people in AP1 need to be delivered to EC1, only one solution
exists.
T=9 Phase 3: Transportation Problem of Evacuation
Unit Delivery Cost AP1 AP2 AP3EC1 $50 $50 $60EC2 $10 $20 $40EC3 $50 $20 $40EC4 - - -EC5 $40 $40 $30EC6 $40 $40 $50
Shipment Quantity AP1 AP2 AP3 Total Received Supply(truckload) EC1 0 0 0 0 <= 1
EC2 2 1 0 3 <= 3EC3 0 0 0 0 <= 0EC4 0 0 0 0 <= 0EC5 0 0 0 0 <= 0EC6 0 0 0 0 <= 0Total Delivered 2 1 0
<= <= <=Demand 2 2 0
RV Needed 3=
RV Available 3
Total Cost 40
AP1 EC1
Supply (EC) Demand (AP)
[-1] [1]
=
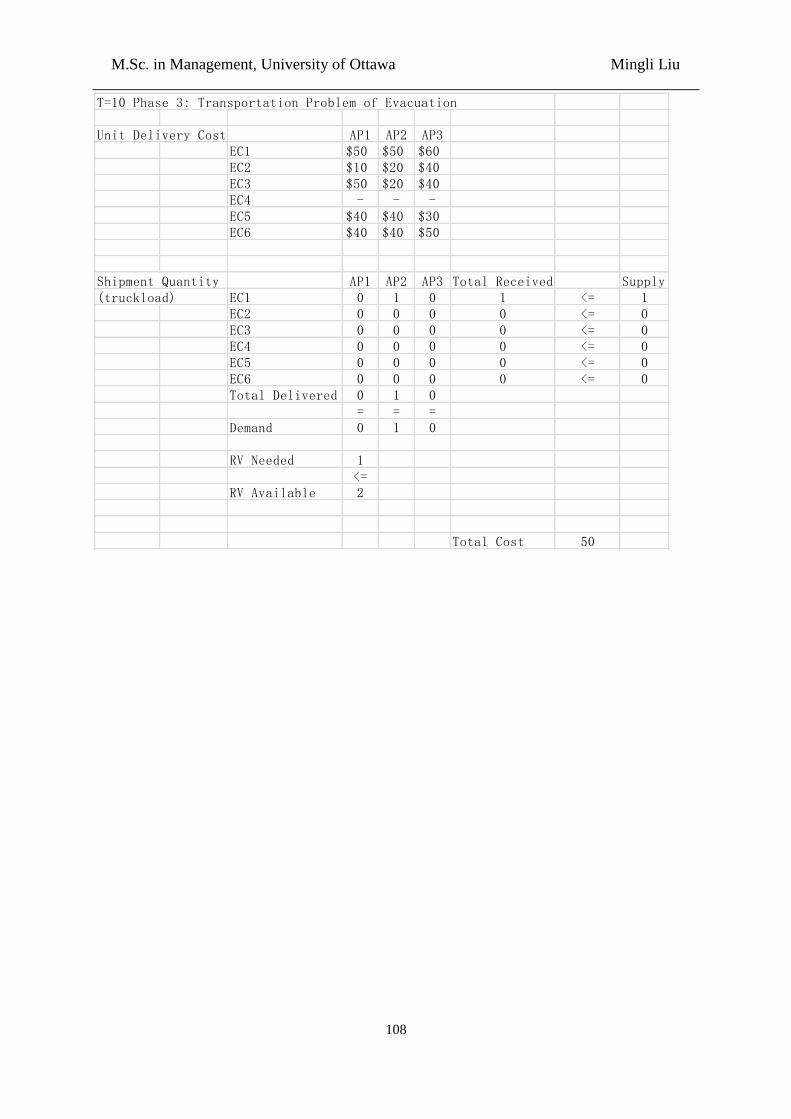
M.Sc. in Management, University of Ottawa Mingli Liu
108
T=10 Phase 3: Transportation Problem of Evacuation
Unit Delivery Cost AP1 AP2 AP3EC1 $50 $50 $60EC2 $10 $20 $40EC3 $50 $20 $40EC4 - - -EC5 $40 $40 $30EC6 $40 $40 $50
Shipment Quantity AP1 AP2 AP3 Total Received Supply(truckload) EC1 0 1 0 1 <= 1
EC2 0 0 0 0 <= 0EC3 0 0 0 0 <= 0EC4 0 0 0 0 <= 0EC5 0 0 0 0 <= 0EC6 0 0 0 0 <= 0Total Delivered 0 1 0
= = =Demand 0 1 0
RV Needed 1<=
RV Available 2
Total Cost 50