(Thesis M.S.--Cornell)
99
7 #V{~OPAID * aegcy Prn ~Ygrnay~ow~ USEONLY waMIoO . 0. C. 811111 SISUOGEAPHC (INPUT SHIET I. ,,JECT |Foodproduction and nutrttio AF25-000-GG50 Soil fertility, fertilizers, and plant nutrition--Tropics . TiTl- AND SUBTITLE Assessment of the nitrogen mineralization potential of a Brazilian oxisol 8. AUTNORI5) Showers,K.B,. 4. DOCUMENT CATE F NUMBER OF PAGES 6. ARC NUMBVR . dicle. AMC 1977 I 7. REFERENCE ORGANIZATION NAME AND AUDRES, Cornell A. SUPPLEMENTARY NC'ES (Sponewing Ortqn(vaolfa. PsulWa#oh Avwasablifty) (Thesis M.S.--Cornell) 9. ABSTRACT 10. CONTROL NUMBER It. PRICE OF DOCUMENT ,'I8DESCftIPTOR ; Asse~sments Brazil Chemical analysis '1 tro~e I Tropics * - I1. PROJECT NUMBER ,k._ __C_..___ Res. IS. TYPE OF DOCUMENT
Transcript of (Thesis M.S.--Cornell)

7 #V{~OPAID* aegcy Prn ~Ygrnay~ow~ USEONLY
waMIoO . 0. C. 811111SISUOGEAPHC (INPUT SHIET
I. ,,JECT |Foodproduction and nutrttio AF25-000-GG50
Soil fertility, fertilizers, and plant nutrition--Tropics . TiTl- AND SUBTITLE
Assessment of the nitrogen mineralization potential of a Brazilian oxisol
8. AUTNORI5)
Showers,K.B,.
4. DOCUMENT CATE F NUMBER OF PAGES 6. ARC NUMBVR
. dicle. AMC1977 I 7. REFERENCE ORGANIZATION NAME AND AUDRES,
Cornell
A. SUPPLEMENTARY NC'ES (Sponewing Ortqn(vaolfa. PsulWa#oh Avwasablifty)
(Thesis M.S.--Cornell)
9.ABSTRACT
10. CONTROL NUMBER It. PRICE OF DOCUMENT
,'I8DESCftIPTOR ;Asse~sments
Brazil Chemical analysis
'1 tro~e I
Tropics
* -
I1. PROJECT NUMBER
,k._ __C_..___Res. IS. TYPE OF DOCUMENT

N~-M-A -303
ASSEGSM OF Tim NITROGEN
MINERALIZATION POTENTIAL OF A BRAZILIAN OXISOL
A Thesis
Preseniie to the Faculty of the Graduate School
of Cornell University
In Partial Fulfillment for the Degree of
Master of Science
by
Kate larger Shovers
August 197T

ABSTRACT
Topsoil and subsoil samples vere collected from the check (0 nitro
fertilizer experiment with maize located gen added) plots of a nitrogen
on land which had been on an Oxsol in the Central Plateau of Brazil
for theirrecently brought into cultivation. The samples vere evaluated
to a standard incubation techniquepotential to supply nitrogen a crop by
a predictiveand by a chemical procedure vhich had shown some promise as
The results vere compared with nitrogentool for other tropical soils.
these soils. A long termuptake data available for a maize crop grovn on
also conducted in order to characterize the nitrogenIncubation study vas
release pattern of these soils.
All samples vere extracted vith 1 N KC1. The chemical test proce
dure, vhich measured a fraction of the extractable organic and inorganic
NH4, Involved the digestion of extracts with concentrated H2 SO4 and
analysis for NH+ by steam distillation. Extracts from incubated and non
for mineral nitrogen by steam distillaincubated soil vere also analyzed
tion. Difficulties vere encounter';d in the analysis of these dark red
Oxisols by the macro-Kjeldahl procedure.
The number of samples vas insufficient for a satisfactory inter
pretation of the correlations betveen the chemical soil test and crop
nitrogen uptake data. The only strong relationship in the soil test data
Thiswas that betveen Amineralizable nitrogen and digest nitrogen.
vould lend some support to the hypothesis that the digest nitrogen does
some portion of the soil nitrogen vhich is potentially availablemeasure
to plants. The incubation studies shoved a difference betveen topsoils
and subsoils in their patterns of release of NH, and N03; the topsoils
shoved rapid increases in the amowuts of N0 snd rapid decreases in KH+
vhlle the subsoils shoved an initial accumulation of NH+ and decrease in
NO-. The values of Amineralizable nitrogeu from thij;r study vere similar 3.
to those reported in the litermture from incubation studies of soils with
similar chemical properties from temperate and tropical regions. It can
not be con,I.udP t"at these Oxisols from the Central Plateau of Brazil
have the same potential for nitrogen production as temperate region soils,
for the cropping histories of th&various temperate and tropical soils
vere different.

BIOPHICAL MTCH
Kate Barger Showeim van born am February 22, 1919. She graduated
from Rldgevood High School, Ridgevood, Nv Jersey in 1966 and entered
Kalaszoo College, Kalamazo Michigan. In 1968 she vorkd c the Cheyenne;
River Indian Reservation, LaPlant, South, lalota and in 196S-1969 was a
foreia student at NJala. University College, University of 'ierra Yeone,
Sierra Leone, West Africa. In 1970 the author received a Bachelor of
Arts degree frcm the Departmnt of Anthropology and Sociology, Kelmac-)
College. After working for two years, the autimr enrolled in the Depsart
mant of Soil Science, Michigan State East Lansing, Michigan,
She received a tihelor of Science degree in 1974. In August 197 the
author began her .S./Ph.D. progrm .In the AgronoW Department, Cornell
Uiversity.
ii

The energ represented by
this wrk Is dedicated to
Dr. Kay 14. fperry'
Dr. Edith K, Ligeti
Mary Jackson
11U

Mi4n people helped mike this project possible. Special thanks go
to Dr. Dougla J. LAthvell, vho provided the project and served as
special Committee chairman. The author is also indebted to Dr. Williw C.
Kelly for his help on the comittee, for his encouragement Vhen things got
rough. Professor Milt Barnett spent mny hours with the author, giving
advice and encouragfment, and being a.friend. Certain graduate students
were particularly helpful to the author, and without their aid, the
project vould have been diffimult, if not impossible: Paul Bloom, who
patiently taught a novice about laboratory work, Jim Rundle, who helped
the author with way useful suggestions and lots of encouragement, and
Mario Rodriguez, who helped unveil some of the mysteries of data analysis,
and vho alveys had a good supply of smiles, and answers to questions.
This work could not have been finished in time if it vere not for the
careful and consciencious work of Kelli Jones, Terrie Duffy, Louise Miles
and Charles Byrda of the sil test lab. Many thanks to Karen Rhodev for
helping vit? computer work and data analysis. To= Greveling and Ron
Clayton both were helpful with laboratory equipment, supplies and mainte
nance. The author wishes to express gratitude to Dr. K. Dale Ritchey,
Dr. David R. Bouldin and Dr. George C. Naderman for providing the author
with data and observations about the experiment In Brazil. Theaks are
also due to Dr. Matthew C. Droadoff for providing informtion and answer-
Lng questione. The author would also like to express appreciation to
Illeen Callinan for assistance with the graphics and to Linda Red=n& for
being a good friend and patient typist. There are many people who helped
iv
in less concrete but no los important vays; they helped the author min
tain sos mnoblance of sanity. She thus oe a good deal of thanks for
support and encouragement to: Peter Adams, a fellow traveller from
:rociology to agronovr; Martha L. Mitchell, who shared many & half gallon
of toe cream; " Lasberts, who helped with several bottles of rm; Fred
Mouncler who asked good questions; Juan Jose Pena CaOiallos and Doralind
Guzman de Pen,;, who have always been encouraging; Don and Maria Kas who
gave me help and kept me laughing; John Davis and John Brittain who remim
me that the rest of the vorld exists, Seth Dabney, who was always support
ive and helpftl; Rich Ksyzstyniak who also worked long hours .n the lob,
and Tom Nolan, Steve Krc-ft, Anne Marie Baranowski and Carol Burns who
were such good housemates. Most of all, the author wishes to thank Dr.
Henry D. Foth, of Michigan State University, who first sho~ed me how exci
ing the realm of plants and soils is, and who first enccw'aged me to
return to school and then to continue in graduate school.
Old friends are good friends, and a word of thanks must 'ju to
Cynthia Calvert, Cynthia Turner, Jean Berolzheiner, Connie Hubenthal,
Kathy Schantz Duna, Nancy Ball, Leslie Zordervan Droz, and Kay and Jimm
Hollers for their love and faith in me. Ultimately it is one's family
which gives the necessary mtional support; I would like to thank wf
eotbr, Dr. Kay X. Sperry, my father, Paul C. Shovers, my aunt, Dr. Edith
K. Ligeti and my adopted aunt, Mary Jackson. There are many others who
helped e so much, and without whom this effort could never have been
mpleted. I thank thm all.
Thanks must go to MID for providing me with financial support du
ing this project, and the agronos department for providing me with finan
cial support and tuition assistance.
v

TABLE OF CONTEITS
Introduction.. . I
LiteratureReviev . .0 . . . • •s . • . • • • . • . • . .
The Experluentel Site, Uperiaental Design, and Dicussion of Vegetaticn and Soils .. . ... . . 2
Purpose, Nkterial, and Methods . . . ... 35
Chmical and Biological Test Metbods . . . . . .... . . . . 38
Soil Tests and Meauuraent of Crop Yield . . . ..... . . . 50
Incubation Study . . . . . . . . . . . . *. a . . a 0 . *. . 65
Sumary and Conclusions . . . . . . . . . . . . . . . . . . • * T9
Bibliog*pb . . . . . . . . . . . . . . . . . . . . . . . . 82
vi

LIST OF TA!I.
Table Pue
1 Soil profile descri ption.................. 2T
2 Relationship between type of native vegetation and averge topsoil properties in the Cerrao . .... 33
3 Storage of Puerto Ricanlm ..... .......... 8
Value of mineralization determined for Oxisols compared with values reported for some temperate and tropical soils ......... ...... TO
5 Sw m r . . . . . . . . . . . . . . . . . . . . . . . . . T2
6 Soil characteristics, Typic Haplustox, Planaltina, Brail 73
vii
LISN OF ILLSTRATIOB
1 Digest N vs haineralisable N. November 1973 soils, 2, 4, and 8 week Incubation, topsoil and subsoil . . . . . 39
2 Digest N ve Amineralizable N for average 1974 solis, 2, 3, 8, 39veeks Incubation. . .. . ... . • • *• 40
3 Alinerlizable N Vs Adigeut N ite' different lengths of incubation, November 1973 and Augut1974 ssaplea . e e . e # e • 9 e e . *._ . . .. . 42
. A ineralisable N vo Adigest N, August 1974 samples
and soil A,Novmber9T . . . *....... . . * 43
5 Mneralizable N To Adigest N,Novembe 1973 soils . . . . . 44
6 N uptske by grain vso A neraliable N and digeet . . . .. 51
7 N uptake by stover vs AmIneralisable N sad digest N (topsoils) . . . . . . . . .. .. . . . . . . . . . . . 52,
8 N uptake by grain + stoer vs AAineralisable N and digest N . .0. . . . . . . . . . . . . .0. .* . * * 53
9 N uptake by grain, stover, and grain + starer vs Amineralisable N (8 week incubation); topsoil and subsoil . • • .• a . . • .• • • • •. •. • .• * . 54
10 Grain yield vs digest Naad Anineralizable N . . . . . . . . 56,;
11 Stover yield vs digest N and Amineralizable N . . . . . . . 57
12 Yield of grain + stover vs digest N and haineralizable N . . 58
13 Yield of grain, stover, grain + stayer vs 8 week Anineralizable N, topsoil and subsoil.. •* . * • •e e• 59
14 Grain yield vs fertilizer application, P analtina, Brasil .1972-73-197 6 -77 • • e.• • • • • • • • • a• • 63
15 AN and IM+ production vs length of incubation, N ;veber 1 73 and August 1974, topsoil samples A & B. . . 66
16 £10 and ANN+ production vs length of incubation, eamber 1973 and August 197, topsoil samples C &D.,. 67
17 ANO1and MM production vs length of incubation,
N ber l73 and August 19T, topsoil smple E . . . . . 68
viii

18 AN-O and ANI production vs length of Incubation, . . . 699yvier T3 subsoils . . . .. .. .
ix

INTRODUCTION
irogen is a major element required by all plants for growth, and
although it In present in the biosphere in large quantities, much of the
N is in forms which are unavailable to plants. Today N can be supplied
to plants from two maj.or sources: the natural processes of N fixation,
rainwater introduction and mineralization, and the technological processes
of N fixation in the manufacbure of nitrogenous fertilizers. The capac
ity of the natural systems to supply N to crops is more limited than the
capacity of people to mnufacture nitrogenous fertilizers. Therefore,
with the advent of relatively inexpensive and abundant fertilizer sup
plies, research interest shifted from the utilization of natural supplies
of N to the manipulation of technologically producei fertilizers in plant
production. Recent concern about environmental degradation due to in
appropriate uses of fertilizers, the increasingly high cost of fertilizer
production, and the realization that many farmers in the world do not
nov and will not soorn have access to commercial fertilizers has lead to a
renewed interest in the sources of N in the biosphere. Precise recom
mendations for fertilizer rates and management schemes which maximize the
resources of the land for those farmers without access to N fertilizers
cannot be developed without an understanding of the processes of r.cir
culation in the soil systen.
Nitogen exists in the soil system in many forms, andboth organic
inorganic. The organic forms are subject to transformation to inorganic
forms in a microbial process cal]ed mineralization, and inorganic forms
my be transformed to organic forms by the process of Immobilization.
1
2
Organic. I enters.the .sil- systm throug the additions-of.-pljat -d .nimml
residues and through the fixation of I by symbiotic and non-symbiotic
organim in the soil. 1icroorganisms are responsible for recycling the
N by degrading organic matter and converting it to +l.b0, and 10. The
process, being a biological one, is influenced by the physical, cheamical,
and environmental conditions of the soil. Physical factors which affect
water supply mad aeration, chemical factors such as 1 mad the presence
or absence of essential nutrients or toxins, and environmental factors
such u climate ad the presence of an onergy source affect the growth
and onaposi tion of the microbial commnity. The nature of the microbial
com ity will determine the type of activities carried out, ad thus the
forms of N in the soil system. Factors such as desiccation affect the
nitrifying bacteria more than the eminifiern , resultin&in an accuAula
tion of ii1 in drought or dry seasons, while an excess of vpter will
favor the growth of anaerobic orgaisms which reduce NO- to 102 ad N2
gasses. Under conditions of moderate pH. moisture, oxygen supply, and
energy source, organic form of N are converted to N% which is oxidized
rapidly to NO. Under most conditions, most of the N in the soil is in
organic coabinatiou, and the N which is Inorgmaic Is either in + or103
form.
Avaoniu may be fixed in the clay minerals in the soil or held on
the cation exchange sites. Under any conditions, however, most iii is
nitrified to NO- Nitrate may be held on the anion exchange sites of the
soil system, but mst is thought to be in the soil solution. As it is in
the soil solution, NO- is available for plant uptake and loss by leaching
as the solution percolates through the soil, Nitrate can also be
utilized by microorganisms, either through the conversion to orgsanic

f is or as qg -oure, resulting in theIn microbial tisem an con
vers o to a psous fbr Iiea if lost hem the soil system.
The nitrogen antes within the soil Is a dumdie one with changes
in fors occurring cotinuous3y. The developmnt of procedures for study
ing the N supply of a given *oil met involve consideration of all of the
I fractions and the interaction between eviromental factors, the N
system and the uicroorganim. The deveioment of techniques to quntify
suh a complez sste= Is necessarily djt cult. Today a reat deal is
still =knom about the nature of the form of nitrogen in the soil and
their interction with the plbsicel system of the soil components and the
microbial ommity. Problems of technique we also related to the
humeral nature of the various .fm of 1: they change even as one
attempts to measure the.. Mhe decision concerning vhich fraction of N
to mese when estinting the soil supply of available N must be largely
based upon empirical measurements, because so little is known about the
nature of the I in organic cmbination.
The mt direct measure of plant available N supplied by the soil
''is the analysis of the N content of a plant pron without N fertilizer
(Beckwith, 1963). If other ftctors are not limiting, then the plant
would theoretically take up all of the I vhich is available during the
gowing Wmson. In practice, it is difficult to grow a plant in an
encment h vhich no other factor is limiting. Greenhouses provide
the opportuiity to control some variables, but they do not ofrfir a
totally controllable eoviromnt. It is impossible to control wriabil
ity in the field. Less direct methods of estiuting the ability of a
sonl to suWy I chmimal d tests in the laboratory.inv3lve .a-biologcal
"W resomina beaind this approach Is to find a rocedure which

consistently Voduces result which can be correlated with the N uptake
by plan grown in controlled environments and in the field, when no
oth.- _ijtors Ui liait.r. A procedure which demonstrated close correla
tions over a range of soil conditions could possibly be used to predict
the mount of N that might reasonably be expected to be released by the
soil in a growing season. This would aid In making fertilizeriand
management recommnde4ions. The soil test procedures proposed to date
have had mixed and limited success in N prediction. The procedure which
is most generally accepted as reliable involves the incubation of soil
samples for varying periods of time, and the measurement of N mineralized
during the time of incubation. As this biological procedure in both time
and space consming, efforts have been made to develop more rapid chemical
methods.
In this thesis, soil samples of an Oxisol from the central plateau
of Brazil were eval.ated by a standard incubation technique and by a
chemical procedure which bad shown some promise as a predictive tool on
other tropical soils. The results were compared with nitrogen uptake
data available for a corn crop grown on the soil. A long term incubation
study was also conducted in order to try to characterize the N release of
these soils. I/

LITERATURE MIN
The objectives of soil testing have been stated by amny authors
(Meisted, 1967; Tisdale, 1967; Hanvay, 1973; Welch and Wiese, 1973) in
various ways, but in general the objective@ are to provide a method for
rapidly and easily determining the nutrient status of a soil and to pro
vide a basis for making recomendations for fertilizer and soil maage
ment practices in term of plant yield response to fertilizers applied.
An ideal test would describe the nutrient status of the soil and the exact
yield response to fertilizers, thus providing a basis for an economic
interpretation of the fertilizer reccomendation. These objectives cannot
be met with precision, for crops are part of a biological system of which
nutrient status is only one of mny intervening variables.
The development of a soil test, in the broad sense defined above,
has two aspects: first, the development of a procedure which provides
numerical values that are related to some measure of plant growth and
second, the establishment of a predictive relationship between the test
values and crop response to added increments of nutrients. In the liter
ature different words are used for these rather distinct aspects of the
soil test process, which has lead to lack of clarity.some Welch and
Wiese (1973) call for the use of the term correlation "to express the
relationship between the mount of nutrient extracted by laboratory tests
and uptake by plants in the greenhouse or field" and the reservation of
the term calibrate for "the relationship between laboratory roll test
values and yield response from inermental rates of the nutrient applied
in the field." A soil test which is highly correlated may not be well
5

6
calibrated, so that criticism of the calibration may instead be leveled at
the actual laboratory test method. Rovever, it is important for research
ers to be sure that highly correlated tests can also be well calibrated.
A farmer, after all, is interested in yield response.
The development of soil test for N has been particularly diffia
cult due to the behavior of x in the soil. A desirable test procedure is
one which is simple, precise, and applicable over a wide range of soil
conditions (Stanford and Smith, 1972). Because the N system in the soil
is biologically controlled, the factors which affect the microbial process
are those which affect the N supply. Furthermore, because there are so
many forms of N in the soil, it has been difficult to determine which
fraction should be measured. A laboratory soil test for N, then, must
either describe some aspect of the process of N mineralization, or else /'I
measure some of the the soil andfraction N in assume tt at it is propor
tional to that N which becomes available to the crop during a growing
season. The former approach is a biological one, the latter a chemical
approach. There are advantages and dir advantages to both approaches;
neither one has yet produced a simple, quick method which is applicable
over a broad range of conditions.
The advantages and disadvantages of the biological approach stem
from the sme fact: the techniques involve direct work with the biologi
cal system which Is responsible for the mineralization of N in the soil.
The advantage is that if the environment can be controlled to reduce the
sources of variation, a direct measure of the mxum amount of I which
can be mineralized from a given soil system is obtained. The disadvan
tapes are that the optimal conditions of the lab or geenhouse make
extrapolation to the field difficult, and variation in field experiments

T
due to uncontrolled factors make data collection and interpretation diffi
cult, if not impossible.
Biological approaches to the measurement of available N involve
the determination of the rate of mineraliration (Harmsen and VanSchrevan,
1955). This can be attempted through the use of various laboratory
procedures including studies of microbial cultures and incubation of soil
sample., and by greenhouse and field plot experimentation. In microbial
culture tests, sicroorganisms are grown in a nitrogen-free medium and a
soil sample. Since N Is essential for microbial growth, and the soil is
the only source of N, the activity of the microorganisms in taken to be a
measure of the availability of the soil N (Cornforth, 1966). The measure
ment of CO2 evolution by a microbial population has also been used as a
measure of N mineralization based on the assumption that the rate of CO2
evolution in dependent upon the amount of N available for microbial
activity (Cornforth, 1966). This is true only if N in the limiting
factorlto microbial growth (Cornforth, 1966).
Incubation methods are based on the fact that the N which is re
leased in the soil during the cropping season is released by the same
organisms which release N upon the incubation of soils under laboratory
conditions (Bremner, 1965; Cornforth, 1966). This technique is consido.
ered to be a direct measurement as it involves the actual organims which
are responsible for N release. The technique has been widely used, and
is considered to be the most satisfactory procedure available (Harmsen
and Vanmohrevan, 1955; Brmner, 1965). The procedures most widely used
are based upon the aerobic incubation techniques developed by Stanford
and Hanvy (1955), Stanford and Smith (19T2) and the anaerobic incubation
chnique~ Introduced by Waring and Bremer (19"6). Incubation techniques

8
vary tremendously; each variation in technique to an attempt to create
laboratory conditions which are closer to the ideal for microbial growth.
What is desired i the elimination of factors influencing mineralization
other than the supply of aveilable forms of organic N. to provide a
measure of the potential of the soil to supply mineral N. thus permitting
a rankirg of soils based upon N availability. Since factors such as
date of sampling and treatment of samles prior to incubation can affect
the mineralization measured (Harmsen and VanSchrevan, 1955; Eagle and
Mathews, 1958; Cornforth, 1971). it is necessary for the techniques to be
standardized if there is to be any possibility of comparison (Bremner,
1965). One of the problems with incubation studies is that they are both
time and space consuming. Various other aspects of incubation technique
have been discussed and criticized in such review articles as Harmsen and
VanSchrevan (1955), Bremner (1965), Black (1968). Dahnke and Vasey (1973).
The chief objections to the incubation techniques are umsrized by
Harnsen and VanSehrevan:
.it must be formulated that reliable results, sufficiently correlated with the N requirement of field crops, can be expected only hen ,the incubation technique is restricted to one soil type, one climate zone, and one farming system and when all samples are collected within one season, preferably during the early spr:1.i. For each set of conditions the interpretation oA results must be developed separately.... Besides these limitations of the incubation method the results and their interpretation certainly will vary from one year to another, owing to uncontrollable and often unpredictable variations of the weather conditions. So the method should never be overestimated, and consequently the determination of the N requirement of soil presumably never will reach the same accuracy as the determination of P and K requirements.
Researchers in both temperate and tropical regions have related in
cubation results to N uptake by a crop and to crop yield. In research

with tropical soils, good correlations were reported between mineralize
able N and tobacco quality in Nov Zealand (Ross, 1960), between mineral
izable N and both N uptake and yield of dry matter by 6 week old tomato
plants grown on a variety of East African soils in the greenhouse
(Robinson, 1968). Good correlations were also reported between mineral
izable N and N uptake by crops of maize and sorghum grown in 10 Puerto
Rican soils in the greenhouse (Lathvell, 1972). Fair correlations were
reported between mineralizable N and the N content of maize plants at
tasseling which were grown in farmers' fields in Western Tanzania.
The alternative to laboratory experimentation vith the components of
the biological supply system isolated from the grcving plant is to include
a plant in the system being studied. Greenhouse experiments are a type of
incubation experiment, with the plant added to the system. Here the
environment can be largely controlled, the volume of soil explored by the
roots Is limited, so that the measured N uptake can be expressed in terms
of a given amount of soil, and sny interactions between plant roots and
microorganisms (supply of growth factors, etc.) are included n the
experiment. Good correlatiors should be expected between this system
and a laboratory incubation technique, and in fact such correlations have
been widely reported (Gasser, 1961; Gasser and Jephcott, 1964; Robinson,
1968; Cornforth and Waluley, 1971; Lathvell, 1972).
The varip,A4an introduced by adding a plant to the stes provides
an intirmediate step between the controlled conditions of the laboratory
end the variability of th- field. The fact of the addition of a plant
to the soil system shoull not mislead the researcher to believe that
there is reason to extrapolate from greenhouse results to the field.
Since r.eenhouse conditionsare more or less controlled, the pot system

10
bears only slight resemblance to the soil system in the field,. Field
experimentation as an initial tool is uuvieldy due to the large require
ments of land, labor, time, expense, and the unpredictability of the
environmental conditions. The object of a field experiment should be to
characterize and quantify the entire set of conditions in the field
(Hanvay, 1973). A test procedure which is vell correlated vit;h nutrient
uptake in a controlled environment must be tested for predictive value
under field iconditions. Once the correlation is established with the
field data, field research for purposes of calibration can be conducted.
According to Melsted (1967), "it is a basic principle of soil test.
ing that simple, rapid chemical analytical procedures can be designed to
accurately meaure or be a measure of the level of available nutrients".
The advantages of chemical soil tests compared vith biological tests are
that comercial tests are generally more rapid and more convenient
(Keeney and Bremner, 1964; Bremner, 1965). simpler, more reproducible,
and more suitable for routine soil testing (Cornforth, 1966). It vas
assumed that chemical tests vere less suoject to influence by previous
treatment, such as date of sampling end type of storege, but according to
Bremer (1965) there is little evidence to support this assumption.
The disadvantages of chemical methods are numerous. T.A major
body of crl.ticisu of the chemical apprcsh stems from the facts that
chemical aethods are completely empirical in nature and can make no alloy
ance for the fact that the supply of imineralizable N is depeadent upon
the microbial community vhich is affected by factors such s crop resi
dues vith a high C:N ratio (Keeney and Evaner, 1964; Bremner, 1965;
Cornforth, 1966). It is unlikely that a chemical reagent will b found
that can simulate the adtivities of soil microorganism or that coin

release selectively the fraction of the soil N which is made available for
plant growth by organisms (Bremner, 1965). Furthermore, chemical methods
which depend upon surface soil samples cannot be expected to integrate
the various soil-plant interactions which affect the release and uptake of
I and grovth of the plant (Bremer, 1965). Changes in nutrient concen
tration which occur in soil solutions also are not reflected in chemical
soil tests (Beckwith, 1963). Since soils are not homogeneous, there
probw&Ly are areas, in the soil where the rate of release of I is greater
than in others; this variability cannot be adequately expressed in
chemical procedures (Beckwith, 1963). Finally, most of the research U
been performed on temperate region soils; the complications introduced
by tropical conditions of extreme weathering, and the variations due to
different soil moisture and temperature regimes are largely unstudied.
Despitlb the sa problems associated vith chemical test methods, however,
fairly good relationships between chemical estimates of N availability
amd crop data have been reported- these relationships are usually found
for soils belonging to similar groups or series (Cornforth, 1966).
Of the many extraction techniques described in the literature, only
a few of the major viethods used in recent years will be described to
illustrate the type of work done and the problems encountered. Truog
Pirst proposed (Richard, Attoe,*oskal, Truog, 1960; Keeney and Bremner,
1966) a method for extracting the readily oxidized organic N with
alkaline permanganate, based on the procedure already established for
evaluation of the N status of organic measures Subbiah and Asija, 1956;
Richard et al., 1960). Modifications of the procedure by Subbiah and
Asija (1956), accompanied by sme high correlation values for ihAt and
rice on Indian soils, stimulated interest in this procedure, ('Subsequent

12
research has produced mixed results. Richard et al. (1960) found highly
significant correlations between the test results and the N uptake
response of maize grown on Wisconsin soils in the greenhouse; the corre
lation coefficients accounted for 72 percent of the variation. Oluon
et al. (1960) tested the method against the N response of oats grown in
the greenhouse and with yields of wheat and oats in the field in
Nebraska and found no significance in either relationship. Tahane and
Subbiah (1962), reporting a compilation of previously unreported %ata
from undescribed experiments shoved highly significant correlations be
tveen the alkl-Iine pernanganate test and yield response to N by wheat
and paddy rice in greenhouse experiments and in the field on various
Indian soils. The reported correlations accounted for as much as 77 per
cent of the variation. Keeney and Brenner (1966) modified Subbiah and
Asijals method slightly and compared results with N uptake by the 2nd
and 3rd cuttings of ryegras on Iowa mol and found significance at the
5 percent level, but correlations which accounted for only 18 percent of
the variation. Jenkinson (1968) working In Great Britain using Keeney
and Bremer's modification of Subbiah and Asija's modification of the
alkaline permnganate method found low correlation with N uptake by all
cuts of ryegrass, accounting for only 18 percent of the variation.
Cornforth and Valmley (1971) working with 154 soils from 6 islands in
the West Indies reported slightly significant correlations between
Truog's method and N uptake by 35 day old maize plants. The correla
tions, however, only accounted for 1 percent of the variation. When
taken on an island by island basis, there were some islands for which
the test could account for 58 percent of the variation. Walmaley,
Tyford and Cornforth (1971) reported no correlation between the soil
test and yield of bananas grown in the field on the Windward Islands.
Nerliy (1972) used a modification of the method by Kresge and Merkle
(1957), and Peterson, Attoe, Ogden (1960) in a study of the variation in
N availability under two different crop rotations in Ireland. The
correlations between the values ot the alkaline permanganate test and
those of the nitrogen mineralization experiments were significant but
low after the first year of the experiment. The test was therefore not
used in subsequent years.
In 1960 Cornfield proposed the measurement of easily hydolyzed N
released by alkaline hydrolysis of soil in a diffusion cell. Cornfield
(1960) reported a high correlation between the values derived from this
technique and those of N mineralization experiments using soils from
England, but cautioned that individual variations were very high, making
the test only approximate in the prediction of the N supply of a specific
soil. Keeney and Bremner (1966) found very low and insignificant corre
lations between the method and N uptake by the 2nd and 3rd cuts of rye
grass in pot experiments with Iowa soils. Cornforth and Walmsley (1971)
measured N uptake byA5 day old maize plants in West Indian soils in a
greenhouse and found that total N and Cornfield's method were the only
two chemical procedures used that not only had significance at the 10
percent level of probability but also accounted for more than 50 percent
of the variation. When .he soils were broken down into various groupings
by properties, Cornfield's method was found to be particularly good when''
the CEC Vag 30 ma./l0O Sm. soil, and when the percent base saturation
vas between 80 and 99 percent, Walmley, Tvyford and Cornforth (1971)
found no signiecant correlation between 1W2 yielil of bananas in the
field and the test values determined by Cornfield's technique. Keeney
14
and Bremner (1966) found the values of N obtained by this method to change
between moist and air dried samples.
Keeney and Bremner (1966) proposed a method"of extraction which
based upon that of Livens (1959) involving the extraction of N withvea
boiling water and K2SO09 and subsequent digestion of the extract with
sulfuric acid. Keeney and Bremer claimed improved ease of filtration
and the reduction of the size of the soil csmple which was required with
found to bethis modification of the procedure. The proposed method was
significantly correlated at the .1 percent level of probability, and
accounted for 62 percent of .he variation of N uptake by the second and
third cuts of ryegrass grown on soils representative of the major s#il
types of Iowa. Jenkinson (1968), using British soils, reported signifi
cant correlations between both N extracted by boiling water and N
mineralized by aerobic incubations, and different cuts of ryegrass grown
in pots in the greenhouse. Only 42 percent of the variation was
accounted for, however. Values obtained by this method were shown to
Stanford (1968)be unaffected by whether the soil was moist or air dry.
proposed a modification of the boiling water technique, substituting 0.10
M Cacd2 for water, arguing that the salt concentration is near that of
the soils, that the pH tends to hold constant even with successive
leachings, and that the soil does not become dispersed. Ryan, Sims, and
Peaslee (1971) found significant relationships between the procedure
and the third harvest of sorghum from pot experiments with 15 soils frcm
Kentucky, but the correlations could only account for 3T percent of the
(1972) found signifi,ant correlations bevariation. Lathvell et al.
tween extractions by this method and the uptake of N by maize and
sorghum grown in pots in 10 different soils from Puerto Rico.

15
Stanford (1968) used different concentrations and different
numbers of extractions with sodium pyrophosphate, and found that extrac
tions vith dilute Na-pyrophosphate were related to the readily mineral
izable portion of the soil organic T. Lathwell et al. (1972) modified
this procedure and found correlations which vere significant at the 1
percent level and accounted for up to 81 percent of the variation vith N
uptake by maize and sorghum grown on Puerto Rican soils in pots. Various
other methods have been used to extract one fraction or another of the
soil organic N and to relate it to mineralizable N or plant uptake.
Stanford and Dema- (1969) found correlations betveen total distillable
NH+ extracted by boiling NaOH and aerobic mineralization. Cornf)rth and
Walmley (1971) had limited success correltting acid hydrolyzable N with
uptake by young maize plants grown on West Indian soils in the greenhouse.
Smith and Stanford (1971) found a high correlation between Convay dis
.tillale N and anaerobic incubations using 39 soils from different loca
tions inthe United States.
Jenkinson (1968) attempted to break from the notion of measuring
some fraction of the available soil N supply and developed a test based
upon earlier work of Hobson and Page (1932) and Paul and Schmidt (1960)
using cold dilute Ba(OH)2 in an attempt to meaure the soil biomass. He
argued that "by taking the size of the soil biomass as a measure of the
mineralizing porer of a soil, some allowance can be made for the N min
eralized from slowly decomposing fractions and that from labile ones. If
it is assumed, therefore, that a soil maintaining a large biomass miner
alizes more N per unit time than one maintaining a small biomass, and
that Da(OH) 2 extractable organic matter is correlated closely with the
amount of biomass In a soil, then Ba(OH) 2 extractable organic matter

should serve as a measure of the N mineralization pawer of the soil."
Jenkinson measured both non-NO--N extracted by ha(OH) 2 and hexoses deter32 mined by the rnthroue method, termed glucose equivalent or "glucose" ex
tracted by h(OH)2. The results of theme tests vere correlated with the
N uptake data frm ryegrass grown in the greenhouse and reported by
Gasser (1961) and Gasser and Jephcott (1964) and vith yield data from
field experiments vith barley reported by Gasser (1961). Correlations
between non-NO3-N extracted and ineralizable N were significant, but
accounted for only 32 percent of the variation, and were not significantly
correlated with N uptake by ryegrass in the greenhouse. Keeney and
Bremer (1966) found that the amount of N extracted by this method vas
affected by the status of the soil moirture; air dry samples gave higher
values than wet samples. Ba(O) 2 extractable "glucose" van found to be
highly significantly correlated with mineralizable N, accounting for 61
percent of the variation, and vas highly significantly correlated with N
%ptakeby ryegraus, although accounting for only 52 percent of the varia
tion (Jenkinson, 1968). Ba(OH) 2 extractable "glucose" wan highly signif
icantly correl ated with the yields of unfertilized barley fields, and the
correlation coefficient accounted for 69 percent of the variation
(Jnkinson, 1968). Robinson (1968) tested the Ba(OH) 2 extractable "glu
coe" method with N uptake by 6 week old tomato plants grown on various
lut Africaa soils in the greenhouse and found no signIficLnt relationship.
Cornforth and Walmaley (1971) vorking vith 154 West Indian soils in the
greenhouse, found a correlation with N uptake by maize plants which was
significant at the .1 percent level, but could account for less than 50 per
cent of the variation when the soils were separated on the basis of percent
base saation. Those solls with a base saturation between 80-99 percent

had a good correlation betveen the extractable "glucose" and I uptake
-r-aaise. The W(ON) 2 extrectable "glucose" method van mdified by using
N I6O 3 Inutead of 0.015 W(O) 2 by Valemal Tvyfard and Cornforth
(1971) for use with the analysis of yields of bananas. So useful cone
lation vas found.
Various other methods have been proposed and tried, and afl have
met with the same varable fate as the methods discussed. Because each
author either modified a technique or used one of a variety of parameters
to eveluate the test methods, such as N value, N uptake, yield, percent
yield response to fertilizer, it is difficult to compare the results of
the various researchers with respect to the evaluation of one test
procedure. Further, and most seriously, a nber of papers reported in
comlete infortion, questionable experimental desigs, or poor tech
niques for data anai'*Is which makes interpretation of the data in the
pape difficult, if not ispossible.
Several of the papers do not detail the properties of the soils
being tested-' Samnder (1957) only describA the texture of the soils,
and Rbinson (1968) gave ranges of soil properties, suggesting that
Interested readers commnieate with him for details. Nether Subbiaa
and Asija (1962) nor Tuhane and Subbish (1962) in their ;su ry article
ave the properties of the soil used in their original alkaline perman
gante exprluentl work. WMn et al. (1960), similarly, did not
describe the soil being studied. Most researchers simply gave the pg,
total N, and organic C. When the soil yopertlies ere mentioned, and in
detail, mineralogical charteristics were not described. (o'tdrth and
Valalesi (1971) using 54s oils fro , Cwibbfean slan, mntioned that
the sois$ were formed on vary diffemr M-teriae (coral .lmestoe,
iv
volcanic materials , igneous rack and mixed alluvia) but did not use this
lnfoimatin in their interpretation of the test results. Valmsley,
Tvyford and Cornforth (1971) reported the failure of chemical tests to
predict yields of bananas grn on volcanic soils. While it was noted
that "surprisingly, response (to N) increased with average mounts of N
in the three groups of soil and vas independent of pH." It would have
been helpful to have had a discussion of the Influence of an analysis of
the allophane content of the soils, and an interpretation of the results
of the chemical tests in light of the relationship between allophane
and organic matter content (Buol, Hole and McCracken, 1973; Sanchez,
1976). Very few of the papers a6ve the classification of the soils being
studied, so that the reader has ldifftculty deteraning the general nature
of the soils. Lathwell et al. (1972) were exceptional for including
great group and soil order as well a series names.
Once the soil was sapled, the handling of the soil was quite
W ed by different researchers. Early workers did not consider the ,/.possibility of the effects// of handling and pre-treatment on subsequent
laboratory study. Gasser (1961) froze and then thawed his soils to inW
prove the physical structure, and ade no mention of the N flush which
could result from such a procedure!. Although Jankinsa. (1968) studied
the offects of length of storage on soil tests, he correlated his soil
test results with yield data from the work of Gasser (1961) and Gasser
and Jepbeott (1961), wh had used the freezing-thawing technique. Other researchers did not mention the nature of the handling at all (eubblah
and Asija, 1956; Richard, 1960; Tnne and 8ubbiah, 1962). Althouh
may authors did note the type of handling and storage, did notses
consider the influence of a I flush resulting froi wetting a dried soil

19
on the growth of plants in pic. Bsearchers using crops vith multiple
harvests did separate out the first crop or cut from the others (Keeney
and Bremer, 1966; Gasser, 1960; Lathwell, 1972) In the correlation york
in en attempt to recognize the N flush phenomenon. Robinson (1968)
developed a pretreatment system of vetting and drying the soil which was
supposed to give all soils a uniformity of pretreatment, and Ryan, Sims,
and Peaulee (1971) placed moist soils in pots in the greenhouse for 6
veeks before plenting grein sorghum. The variety of treatment of moils
not only influences N uptake by plants but also the amount of N measured
by the different chemical and biological methods. Keeney and Bremner
(1966) evaluated several test ietheds for change in amount of N measured
from fresh, air dried, and air dried plus stored samples and found that
different procedures were effected in different was. The variety of
treatment of the soils, then, makes it difficult to compare conditions of
the soil, and thus test results.
Once the soil is put in pots in the greenhouse,, all sorts of var
ation in experiental design and procedure is introduced. One author did
not detail greenhouse procedure at all (Olson et al. , 1960), while others
gave incomplete inforIation (Subbish and Asija, 1956; Tahene and Subbiah,
1962; Keeney and Bresner, 1966). Plant density in the pots is variable,
ranging from 1 plant to several plants per pot; the ratio of plant to
soil volme is also variable. Robinson grew one tomato plant per pot,
using the micro-pot method of Chenery (1953). Richard et al. grew 3
Mle 1lrats per pot of 3 kg soil, Cornforth and Walsmley (1971) grew 4
mise plants per pot containing 1 kg soil and Lathwnel et al. (1972) grew
wime plants per pot containing 1600 g soil. Ryegrass density was
siuliarly varlable, with 1 &x of seed sown in each pot containing 3 kg

20
soil by Caser (1961) and Caser and Jephcott (1964) approximately 100
seeds sovn in a pot containing layers consisting of 2 kg sand, 1 kg soil
and 500 kg sand by Keeney and Brenr (1966). Ryan, Sims and Peaslee
(1971) grew 5 sorghum plants in 1500 g soil pisced between layers of
quartz sand, vhile Lathwell et a. (1972) grew 6 plants in 1600 g soil.
Not one article discussed the possibility of interplant competition for
light,, water, and other nutrients which might affect N uptake by the
plants. In no paper was the growth habit or nutrient uptake pattern of
the test crop described; it is, therefore, difficult to know hoy to com
pare data concerning the I uptake by ryegrass, and maize, sorghum, or
tomtoes. The rationale behind the choice of the test crop plant ws nol
discussed in any paper; one van not whether the plantssure were chosen
because of known physiological response, the importance of the crop to
the area being studied, or due to some factor of convenience. It van not
clear, then, whether the researcher wished to extrapolate from greenhouse
crop to similar crops in the field, or from a particular greenhouse crop
to a variety of plant species.
The age of the crops at harvest for analysis was u varied an the
plant density and variety of crops gpam. Researchers have reported
correlations between various soil tests and N uptake by maize plants that
were 3 and 4 weeks old from seeding (Lathwell, 1972), 35 days frus plant
ing (Cornforth, 1971), 50 and T5 days from planting (Richard et al.,
1960). Correlations have been reported for 3 cuts of ryeraus, all at
different length@ of groving time. Thus Gauser (1951) reported the first
cut 33 days after planting, the second 37 days after the first cut and
the third 56 days after the second cut in one experiment and 28, 35, and
49 days in the second. fuser and Jepcott (1961) reported cuts at 35,

21
33L and 39 day. hile Keeney and Brenner (1966) reported cuts at 32, 26
and 44 days. In all cases the first cut listed is days after seeding, and
thus includes the time required for germination and emergence. ljan, Sima
and Peaslee (1971) harvested grain sorghum 3 times at 6 week intervals for
N uptake studies while Lathvell et al. (1972) harvested ar.d analyzed 4
week old plants. Robinson (1968) measured N uptake in tcato plant. six
weeks after sowing the seed. In no ease did the researcher discuss the
possible effects of the stage of development of the plant on either rate
or smount of i uptake. Hanvay (1963) discussed the growth stages of
maize varieties adapted to Iowa conditions in relationship to the uptake
of N. P and K and the accumulation of dry matter. In varieties studied
by Hanvayg at 30 days after emergence the maize plants had produced
approximately 5 percent of their total dry matter and had taken up less
than 10 percent of their total N. at 45 days after emergence they had
accumulated approximately 15 percent of their dry matter and had taken up
about 30 percent of the total N and by 70 days after emergence the plants
had accumulated approximately 45 percent of their total dry matter and
about 70 percent of their total N. Since there is evidence that the
amount and rate of N uptake at a given time after emergence varies with
different varieties grown in the same location (Rodriguez,19)TTX it may not
be possible to extrapolate from hanvay's data to all of the maize in the
aforementioned experiments, and certainly there is no Justification for
the extrapolation to ryegrass, tomtoes, and sorghum. However, the data
of Ha y and Rodriguez clearly shows that the rate and amount of N up
take by maize is small in the first month of corn growth, and changes as
the plant ages. It i reasonable to suspect that plants other than
maize sho differences in rate and amount of nutrient uptake in the
course of their development.
Since the N uptake is different by plants at different stages of
their development, it becomes difficult to compare results of data col
lected from several plants of the same species at different stages of
their growth, and it is extremely hard to determine what meaning can be
drawn from a comparison of two entirely different plant species at some
stage of imturity. With the nutrient requirements of a young plant be
ing relatively low, little stress is being placed on the capacity of the
soil to supply nutrients. All that can be measured is the rate at vhich
the soil can supply N relative to the needs of a plant at a given stage of
growth. It is entirely possible to have soils with the same rate of
mineralization and very different amounts of mineralizable N; plants
grown on the soils for a short time might not reflect the difference in
potential, as the demand of the ismature plants could be met by the rate
of mineralization, and the supply would not be used up before the harvest
of a crop. The situation becomes more complicated when more than one
plant is grown in a pot,, for the plant-plant interactions and competition
for light, nutrients and water will confound the measurement of N release
in the system. Finally, some of the soils in the various studies were
air dried or frozen before being used in the pot experiments, and the
resultant N flush could be adequate to supply the N needs of young plants
grown for a short period of time. In this instance, the plants might
not in their lifetime ever draw upon the mineralizable N which would
normally be made available to a crop during the growing year. In the
tropics, where vet/dry climates produce an initial N flush, much of the N
released in the flush is leached out of the profile before plant roots
are sufficiently developed to utilize it (Sanchez, 1976).

23
Field experiments should serve two purposes-to make sure that the
text procedures developed with greenhouse studies perform under field
test values with yield responseconditions and to calibrate the chemical
to fertilizer applications. In order to fulfill the first purpose, it
would be logical to use the some crop in the field as was used in the
greenhouse. Using a different crop in the field experiment would intro
duce a nev source of possible variation and error. In many of the field
experiments reported in the literature, which follow up greenhouse work
a different crop from the one used in the greenhouse is planted. Thus,
Gasser (1961) and Gasser an4 Jephott (1964) used HI ryegrass in the
greenhouse and barley and potatoes in the field; Robinson (1968) used 6
week old tomato plants in the greenhouse and maize at tasseling in the
field; and Walnmley, Twyford and Cornforth (1971) reported the failure of
a number of chemical tests to predict yield of bananas in the field by
tests which had been evaluated for their relationship to N uptake by 35
day old maize plants in the greenhouse (Cornforth and Walsley, 1971).
While it might be argued that a test is needed for a wide range of
conditions and plants, in the process of developing a new test, it is
important to control as many variables as possible in order to evaluate
the sources of error and weakness. Once a test is dete-rmined to have
some success with a field experiment, then subsequent trials can be con
ducted to e8 ablish the utility of the test over @'range of crops and
soil conditions.
The reporting of data and data analysis in the literature also has
some arean of weakness. YAW authors simply reported correlation coeffi
cients without reproducing the data in a va that a reader could manipu
late the data to verify the authors' conclusions (Olsen et al., 1960;

Jenkinson, 1968; Robinson, 1968; Cornforth ad Wa ,,ley, 1971; Ryan * Sin
and Peaslee, 1971), Other authors reported correlations with the means of
several crops (Gasser, 1961; Lathvell, 1972). There is nothing wrong with
such a reporting system, except that when means are the population used
for the correlation calculations, extrapolations from the data only
apply to populations of means. Since the function of soil tests Is to
determine the requirements of a given soil, it might be best to be sure
to clarify to which population the correlation coefficients apply.
Misuses of the correlation coefficient has lead to misinterpreta
tions of data. In a regression calculation, if there are a cluster o
points and an outlying point, the cluster of points acts as one point and
the one outlying point is given a greater value in determining the slope
than any single point in the cluster (Daniel and Wood, 1971). The sme
holds true for two clusters of points; the individuals within the
clusters contribute less than the cluster as a unit. These types of
situations lead to very high r values, approaching 1. Lack of considera
tion of this fact ha lead several researchers to report high correlation
coefficients which were actually artifact (Subbiah and Asija, 1956;
Gasser, 1961). Some authors seemed to misunderstand the linear natvre of
the simple regression function and fitted linctar relationships to apparent
curvilinear sets of points (Gauser, 1961). Gasser and Jephcott (1961),
and Robinson (1968a, 1968b) simply presented regression lines vith their
equations drm on a set of ms without any points. This is no better
than a table of correlation coefficients. For the work of Cuser and
Jephcott the omission of the data points Is particularly suspect, as the
experiments reported in this paper were a continuation of the data
reported n 1961 where st*L lines were drum thmih curvilinear data

25
and outlying points and clusters were analysed with linear regression.
Sas of the papers shoved a lack of consideration of the meaning of
a correlation coefficient; the value of r is important, and so are
statistical significaLce at .01, .1 and .5 levels of probability, but it
estimate of how much variation has beenis the value of r 2 which gives an
for by the particular test under consideration. Cornforth andaccounted
level of r 2 for a given test procedureWlusley (1971) used the minimal
of .50 and argued that a test accounting for less than 50 percent of the
Many authors have not establishedvariation was not particularly helpful.
minimum levels of r 2 which are acceptable. Many of the proposed mebhods
than 60 percent of the variation.with promise do not account for more
Chemists working with chemical and biological procedures only,
seemed to present the data most completely and clearly (Keeney and Bremne,
1966; Stanford and Smith, 1972). Unfortunately, the laboratory work is
only one part of the process of soil test development. Given the great
and plants,variability in experimental design, treatment of soil samples
for this author toand complexity of data analysis, it is difficult
art is in the area of developing adetermine just what the state of the
soil test procedure which is useful for prediction of fertilizer needs of
crops grow to the harvestable state In the field.

THE EXPERINDTAL SITE, EXPERIMENTAL DESIGN,AND DISCUSSION OF VEGETATION AND SOILS
The experimental site was located on the grounds of the Estacao
Experimental de Brasilia in the north central part of the Federal
District, near the municipality of Planaltina, approximately 40 kilo
meters from Brasilia. The location is between 15° 31*' 30" and 15 37' 30"
south latitude and the meridians 470 41' 30" and 470 45' 30" vest longi
tude. The climate corresponds to the type Aw in Kloppen's system of
classification (Boletim Technico No. 8, 1966), with a wet season gener
ally from October through April and a dry season from Nay to September
(Feuer, 1956). The wet season is often interrupted by periodic dry
spells, called veranicos, of varying duration. Veranicos of 10 days may
occur one year in two, and veranicos of two weeks or more may occur one
year in five (Wolf, 1975)o. These veranicos can be a serious problem to
crops grown without irrigation.
The soil of the site is classified as Latosol Vermelho Escuro
distrofico, textura arsilona, fase Cerradao (Dark Red Latosol, dystrophoc,
clayey texture, Cerradso phase) by the Brazilian classification system
(Boletim Technico No. 8, 1966). These soils would most likely be classed
as Typic Haplustox, fine, isohyperthermic, kaolinitic in the U.S. Soil
Taxonomy (Mine and Buol, 1973). For a profile description, see Table 1.
The soils of the experimental site are friable, porus, permeable, and
highly aggregated (Mine and Buol, 1973). The maximum amount of water
which can be stored in these soils to a depth of 30 cm is about 50 =
(Wolf, 1975). Since evapotranspiration can be 7 = or more per day,
26

Table 1. Soil Profile Description.
-1micipio: Distrito FederalPerfil: 1 (~Micipality)(profile)
Local: Estscao Experimental de Brasilia
(site) de Mapemento: Latosol Vermelho Escuro Distrofico textura argilosa fase cerradao.
Unidade (Mapping vnit)
Classitficcao: (Claifilcation)
(Sample, air dry) Eqsivalen-
Amostra HORIZONTE ANOSTRA SECA AO AR
de Lab. (Horizon) ()to do
n.P rofundi- (Stones) (Gravel) Unidade KC1 N (moisturdade ca Calhuas Cascalho agua(Sawle Simbolo
cm) 20 - 20-2 um (vater) (N KCl) equivalent)number) (a---ol) (Depth,
x 4.9 4.2 222258 Ap 0 - 10
0 x 4.8 4.3 2359 A3 - 35
x 4.9 4.2 2360 B1 - 7u 0
61 B21 -150 0 x 5.0 4.2 22
62 B2 -2604 0 x 4.6 4.h 20
(Attacked by) (Density 1.&7)
ATAQUE POR H2s0o14 D - 1,47 Al 0 2Pkrki 203 ppm2 1203 Fe203 T102 P205 Mao
3.35 20.05 1.54 1.1911.2 15.7 7.1. 0.38 1.51 1.16 3.31 17.8 0.32 0.414.7 16.5
0.4 1.55 1.20 3.147 x 15.1 16,6 7.5 0.38
1.47 1.15 3.63 x15.3 17.7 7.6 0.35 0.04 14.4 16.2 7.5 0.31 0.03 1.51 1.17 3.38 x
(continued)

Table 1. (continued)
++ FN
o.4 0.10 0.2 0.05 0.2 0.03 0.2 0.01 0.2 0.02
CC% N% N
1.76 0.21 8 1.16 0.08 15 0.91 0.05 18 O.73 0.05 15 0.32 0.03 11
SOURCE: Bolettu Tecnico No. 8 Experisentacao, Equipe
CONPLEXO SORTIV0 (Absorption cmplex) V
(em E/100 g)_(MQ) ( Bas.e 00.Al
+satura- 4 A1 S S Al H T tion)
0.02 0.5 1.9 7.8 10.2 5 T9 0.03 0.3 2.0 5.8 8.1 14 87 0.03 0.3 1.6 5.2 7.1 14 84 0.01 0.2 1.5 4.4 6.1 3 88 0.02 0.2 0.7 2.7 3.6 6 78
(Partial size distribution)
coMosico GRANUL~MTCA (%) Dispersao con NaOH (Clay) (degree) (Silt)(Disp~ersed with WaOH) Arglla Grau de Slite
Arela Arels natural flocula- Argila
grossa fina Silte Arglla % cao (clay) 2-0,20 0,20-0,05 0,05-0,002 0,002m- (of floccu(course (frne (silt) (clay) lation) sand) sand) 16 17 23 44 13 70 0.52 13 17 22 48 22 54 0.46 14 19 21 46 22 52 0.46 114 19 21 46 22 52 0.46 16 20 22 142 0 100 0.52
(1966). nitel'io da Agricultura, Escritorio de Pesquisas e de Pedologia e Fertilidade do Solo.
to

29
water -stres is likely after one week without rain if the rooting depth
is no more than 30 ca (Wolf, 197T5). Field observations reported in the
19T2 Annual Report state that corn shoved wilting after 6 days without
rain (Annual Progress Report, 1972-1973). In the area of the experiment,
the duration of thot veranicos Isvariable, but the regularity of their
occurrence makes them an important factor in crop production.
The history of the experimental site prior to clearing for the N
experiment is uncertain. It apparently vas used by researchers affiliated
vith an animal science group (Bouldin, pers. con.). It is possible that
the land had some lime applied to it 4 or more years previous to the
advent of the nitrogen experiment. When the land was cleared for the
experiment, the project technician noted "one spot perhaps 5-10 feet in
diameter in which it appeared perhaps a vheelbarrow load or so of lime
aight have been dumped and never thoroughly distributed. In fact, we
removed that lime material and the upper inch or so of soil and excluded
it from the plot as best we could" (Naderman, pers. corn.). The area had
a number of termite mounds which could contribute to the heterogeneity of
the site (Bouldin, 1977). Since the occurrence of termite mounds is
widespread in the Federal District (Feuer, 1956), the presence of the
mounds would serve to make the site more, rather than less, representa
tive of the region.
The experimental design was a randomized block with 5 replications
of 10 levels of N fertilizer application. The plots were 5 x 10 meters,
with 6 rows per plot and a plant population equal to 50,000 plants/ha.
A locally produced mise variety, Caraill l, was grown in all years.
The rates, sources, and times of application of N were changed over the
course of the experiment in an attempt to get an appropriate set of

30
rates for developing a response curve. The first year there were no zero
N check plots -- the check had 20 kg/ha N applied at planting. However,
the check plot received no N fertilizer each year folloving 1972-73. The
consistent rates of N applied in the experiment were 60, 80, 100, lh0,
and 200 or 220 kg/ha, applied in various combinations of split applica
tions. Phosphorus, K and minor elements were applied, and the rate ad-
Justed as more was learned of this particular soil system. The most
critical change was in the application o2 P. It was shown in the P
experiment that, contrary to expectations, P applied as a broadcast
fertilizer gave greater yield response than the same amount of P applied
in the band (Annual Progress Report, 1972-19T3). In accordance with
these findings, the P applications were changed fran 200 kg P205 in the
band and 200 kg broadcast in 1972 to 300 kg/ha broadcast and 80 kg/ha in
the bank in 1973 and finally Just 100 kg/ha in the band in 197. 'It is
noted in the 1972 annual report that maxim yields of 8000 kg/ha were
achieved on the P experiment with 100 kg N in split application of 20-40
40, but top yields of the nitrogen experiment that year were only 6310
kg/ha. The lower mxmum yields of the N experiment were attributed to
the suboptimal application of P. Lime coutaining 10 percent Mg was
applied at the rate of 4T/ha and plowed in when the experiment was
established. No further lime additions have been made. In addition 50
kg/ha WgO .H 2 0 and 50 kg/ha of sodium molybdate were plowed down with1 .
the lime. There was debate as to whether the 1975-76 crop suffered from
micrnutrient deficiencies of Cu and Zn; the 1975-76 crop did not show
7,I esponse to applications of Cu and Zn (Ritchey, pers. coo.). Irriga
tion was used the first year (1972-T3) during a veranco. but us not
used in subsequent years.

31
thought to be "typical of eZI-e si" vas seleeW becauM it was
Progress Reportq 1972-73).in the Campo Cerrado" (Amamteasive areas
Th site my not, however, be representative of the Intended ares. One
to a confusion in terminol. "CaMPo"of the reasons for this amy be due
covered by scrub savannah can be a gsnra2 tern referring to an arm
,jed to denote the centralCerrado" is often(Feuer, 1956) and "Campo
-area reportedly enceqasing 600,000enplateau or F11!ts of Brazil,
end Lobto, 1977; Roam, ~Lobato, Gonzalez and1,800,000 Km (R'itchey
savannah, how-Within the broad classification of scrub
Iaderm i, 19T5).
recognized and desever, various vegetational associations have been
e ibel (1948), described three types Thus, Feuer (1956), citing Wcribed.
11 Sm Craoiof cempo: cn !Serrado can subo and cav
by Feuer (1956) as consisting of dense stands of small, 12characteriled
30 (!ot tvisted trees with thick bark and leathery hairy leaves and a
C J is to be3 to 6 feet tall.dense understory growth of grases
that the Iiees are shorter and morecerrdo indistinguished from cN
widely spaced in cm sub than in csamo cee C. l. is,
The Brazilian Ministryreferred to as a steppe, with no trees at all.
soil survey bulletin describing the Federal District of Agriculture's
6 categories of vegetation in go. 8, 1966) distinguishes(Boletia Toebulco
and cnoo the district, including 5 types of campo. While caeeee
de2 . o , c.... cerradao, ceLadloo,Ln not listed, e.n
de altitude are itemized. ____n
, _ abeeaira de ravine and;c!mpe de
and c eerrado re similar to those givenThe descriptions of cerrtl,
typical of the upper story vegetation are by Feer (1956), above. 91ecIes
Q l m p, while undert ry Vgetati, . t alpp, Ano C, , an

32
caonly consists of Aristida'pallens, Attales exigm, and Melinis
minutiflora. Cmp Cerradao vegetation Is bigger than cs.o cerrado
vegetation, reaching heights of 10-12 meters, with tree trunks which are
less twisted than those of the co cerrado (Boletim Technico No. 8,
1966). Csao de varzea occurs in flood plains (Dos Santos, pers. con.),
Campo de cabecira de ravina at the head of ravines and csapo altitude
occurs on the highest land surfaces. VanWambeke (1971) distinguishes
between cp cerrado and c cerradao on the basis of the density of
trees - cmpo cerradao being those regions in which the desnity of trees
is great enough to prevent the passage of a jeep.
Attempts have been made to explain the variation in vegetation.
Feuer (1956) suggested that the variation was due to repeated burning in
some areas, with the taller and denser stands of trees existing in those
areas where the burning was minimal. Cline and Buol (1973) mentioned
that local tradition ascribed higher soil fertility status to those areas
with Cerradao vegetation than those areas with cerrado vegetation, and
Don Kass, Maria Kass, Dos Santos (pers. con.) suggested that improved
water status might explain the vegetational differences. Lopes (North
Carolina Ltate University, 197) collected 528 composite topsoil samples
from under natural vegetation of 5 different types: camo limps, cmpo
cerrado, cerrado, cerradso and forest. The data is reproduced in Table
2. Itcan be seen that the soils taken from under the Cerrada. vegeta
tion had greater values for exchangeable K and extractable P, Zn, Ca ,
Mg, and had a larger effective CEC than did those sampled from under the
mampo cerrado,vegetation. Cerrado soil samples were intermediate in properties between co e d d ao.cerrado and
The water status of these vegetational eas my also differ.

33
Table 2. Relationship betvsen type of native vegetation and average topsoil properties in the Cerrado. Nusbers of samples for each vegetation clms in parantheses.
Campo Campo Limpo Cerrado Cerrado Cerradmo Forest
Soil Property (64) (118) (255) (45) (16)
pH (K20) 4..87a 4.94ab 5.00b 5.14b 5.28c ApH -0.71b -0.69a -0.76bc -0.82dc -0.93d
Organic matter () 2.21s 2.33a 2.35 2.32s 3.14b Exch. Ca* (Msq/lO0 cc) 0.20a 0.33ab 0.45b 0.69c 1.50d Zxch. Me* (meq/l00 cc) 0.06a 0.13a 0.21b 0.38c 0.55d Extr. (meq/l00 cc) 0.08a 0.10@b O.Ub 0-13b 0.17c Exch. Al (.eq/lO0 cc) 0.7. 0.63a 0.66a 0.61a O.T8a
Eff. CEC (meq/l00 cc) 1.08a 1.19a 1.3b 1.81c 3.00d
Al saturation (%) 66a 58b 54b 4C e400
Extr. PO* (ppm) 0.5a 0.5a 0.9b 2.1b 1 . 4c Extr. Zn*# (pM) 0.58a 0.61a o.66b 0.6T 1.11c ZEtr. Cu"e (ppm) 0.60a O.79ab 0.9.b 1.32c 0.95bc
eExtr. WOi (ppa) 5.ha 10-3b 15.9c 22.9d 24.1d
Extr. Fee (ppm) 35.7a 33.9a 33.0a 27.1b 37.2c
Cly () 33a 36a 34a 32a 37a
Silt () 20a 16b 15b 16b 16b
Sand (4) 16a 48a 51a 53a 4.7a Hue 7.3YRa (;.TYR& 5.I4YRb 1.IThYRc 4.5YRc
Value 4.3a 4,.2a 3.8b 3.5c 3.6be
Chrama 4.5& 4.7a 4.9a 4.Ta 5.Tb
Means for each line not followed by the sam letter are significantly different at the 0.05 probability level. *Extracted by 0.05l HCl 0.02520ok
es00xtracted vith neutral KC .
SOURCE: Agranoic-Zeonamte Research on Tropical Soils, 19T. Annual Report for 19T, Soil Science Department, North Carolina State thiversity, Raleigh, NC.

Dos Santos (per@. con.) reported that etrao, vegetational associations
are predominately found at the base of an escarment. Cline and Duol
(1973) mentioned that the field plots for the experimental site at
Planaltina are located on a gently sloping geomorphic surface vhich Is
about 850-900 meters from the base of a sharp escarpment that rises to an
older erosion surface. "Questions could be raised about bow representa
tive the site m be of extensive areas of the central plateau. The
position of the site relative to the escarpment to higher land could sug
gest moisture relationships atypical of much of the plateau" (Cline and
Duol, 1973).
The experimental site, then, is not typical of canyo errado soils
in the strict sense of soils which occur under cerrado or ! cerrado
vegetation, and as the Cerrado and cappo cerrado vegetation dominate the
region loosely termed "the S cerrado" of Brazil, the experimental
site cannot be said to typify this region. The distinctions recognized
by the various names for different vegetational associations appear to be
correlated with differences in the soils upon which the vegetation grown.
How important these differences would be in high input agricultural sys
tems Is not known.

PUPOS, MATERIAL, AD MODS
Purpose
was to study the relationship baeveen aThe objective of this work
maize crop grown in the field and a chemical soil test. The soil test
had shown promise in relating soil test values of N with uptake by
maize and sorghum grown in pots in the greenhouse (Lathwell et al., 1972).
aTwo procedures were employed - the chemical soil test which measured
organic and inorganic smonium and an incubationfraction of extractable
evaluation of the chemicalprocedure which provided a standard for the
soil test. If the two methods were comparable, the values of the two
methods should have been significantly correlated with each other as well
or yield of the crop. The soil test value should alsoas with N uptake
account for much of the variation in yield or N uptake from pliA to plot
to be useful as a soil test procedure for the evaluation of the ability
during season.of a particular soil to supply nitrogen to a crop a growing
The aount of mineral nitrogen produced over time in incubations could
help to characterize these soils in relation to the wide range of soils
studied by other researchers.
Materials and Methods
The Soil: Soil samples were collected from the zero-N check plots of a
at the Estcao Experimental de Brasilia,nitrogen fertilizer experiment
Brasil in November 1973 and August, 1974. Topsoil samples (0-15 cm) and
subsoil samples (15-30 cm) were collected in November 1973 and only top
soil saples (0-15 ca) were collected in August 1974. The samples were
35

air dried in a greenhouse and stored in plastic bags, first in Brasil and
then in Ithaca, New York at room temperature until the time of analysis.
The Crop: The locally produced maize variety Cargill 111 was grown. The
crop was planted on November 28, 1973 and harvested on May 6 and 7, 19T4.
Incubations: 50 gram samples of air dry soil were placed in 250 al
Erlenmeyer flasks, brought to field capacity with distilled water and
covered with Parafilm, T. The flasks were put on a lab bench and allowed
to sit, undisturbed, at room temperature (222 degrees C) for the specified
amount of time. All November 1973 topsoil samples were incubated for 2,
4, and 8 weeks, 2 of the November 1973 topsoil samples were incubated for
39 weeks, the November 1973 subsoil samples were incubated for 2 or 4 and
8 weeks, and the August 1974 topsoil samples were incubated for 2, 3, 4,
8, 16, and 39 weeks. There were duplicate incubations of all samples
except for one 39 week incubation of a November 1973 topsoil sample. The
quantity of soil available for analysis determined the number of time
intervals each sample could be incubated.
Analytical methods:
Soil: 1 N KC1 extracts of the incubated and non-incubated soils were
analyzed for inorganic amonium and nitrate by the steam distillation
procedure using MgO and Devarda's alloy, as described by Bremer (1965).
Extracts of the soil samples were also analyzed for total extractable
amonium nitrogen by acid digestion and then stem distillation with
10 N 1N, as described by Lathwell et al. (1972).
Total N was determined by the macro-KJeldabl procedure (Oreveling,
1976) as mnll as with a selumiim etalysed auto analyzer procedure
(Oreveling, 1976). Difficulties were encovutered In replicating the
37
resulta. The values seemed to vary according to sample size. Since the
for total N determinemacro-lieldahl procedure is the standard procedure
tion, the values obtained by this method vere used in the study under dis
cussion. Total C and organic C were determined by the methods of Allison
(1961). Due to the difficulties associated with the determination of
asthe N, the values calculated for the C:N ratio should be regarded
rough approximations rather than accurate estimations.
Soil pH vas taken ina l:l soil to rater suspension and in a 1:2
soil to 0.01 MCaCl 2 solution, as described by Greveling and Peech (1965).
Terminology:
The amount of mineral N measured after a period of incubation will
be referred to as mineralizable nitrogen, and the difference betveen the
amount of mineral nitrogen found at the end of a period of incubation and
that vhich existed before incubation vill be referred to as Amineraliz
able nitrogen. The nit.-,gen fraction recovered by the acid digestion
technique vill be referred to as digest nitrogen (to be consistent ith
Lathvell at al., 1972) and the difference betveen the amounts of digest
nitrogen found in incubated and nonincubated soil sample extracts ill be
referred to as Adigest nitrogen.

CHEMICL AND BIOLOGICAL TEST METHODS
Results
Figure 1 shows the relationship between digest N and Amineralizable
N for the November 1973 samples after various periods of incubation. The
relationship improves with length of time of incubation, and is most im
proved by the inclusion of subsoil values as well as topsoil values after
8 weeks of incubation. The correlation coefficients also show that
although the test values did not account for more than 32 percent of the
variation when only topsoil samples were considered, 75 percent of the
variation was accounted for when top and subsoil samples vere considered
together.
Figure 2 shows plots of the same variables for the August 1974
samples. No significant relationship existed and no trend towards a rela
tionship over time existed. Since no subsoil samples were available from
this sampling date, the effect of the inclusion of their values on the
correlation remains unknown. The scatter diagram for the 39 eek incuba
tions shows that there is no association at this time interval. The data,
however, my reflect the water status of the soil samples more than the
possible relationship betveen these tvo test procedures. No water was
added to the soils once the incubations i-re established, and the soils
appeared to be drier at 39 weeks than at 4 or 8 weeks. The 29 week samples
were also on the bottom layer of a set of samples, with a glass plate
separating the two layers. Conceivably, the glass plate could have in
hibited gas exchango, thus subjecting these soils to a different gaseous
atmosphere than the isoils incubated for a shorter period of time which
38

39
43
Figure 1. Digest N vs A-ineralizable N, November 1973, 2, 41, 8 weeks incubation, topsoil and subsoil
25 0 25 20 0 20
2 0 0
015 P15
1010
- 5
R u .5646 R .5465 I I II
0 20 40 0 20 4o Amin N ppm 2 week incubation topsoil
Amin N ppm 4 week incubation topsoil
25 25
20 20
15 A1
5 5
R .4699 R * .8687
0 20 4o d" TO 80 Amin N ppm ain N 8 week incuba-. 8 week incubation topsoil tion, topsoil and subsoil
R a .9500 for significance at 5% with 4 pointsR a .8783 for nignificance at 5% with 5 points

Figure 2. Digest N vs aninerTllzable N tor August 1974 soils- 2. 3, 8 39 week Incubation.
30 30
20 20
4
10 10
R - .2264 R - .5262
I I
10 20 10 20 Amin N 2 veek ppm Amin N 3 veek ppm
30 30
U V
20 0020
U 43
41
10 10
R .1.888 B .0559
0 20 30 1555 65 LAmin N.8 veek incubation Amin 3, 39 reek Incubation
R * .8054 for significance at 5% vith 5 points.

were on top of the glass shelf and thus able to have freer gas exchange
through the Pamfil. T.
It should be noted that some of the graphs contain only four
points, requiring a higher value of r than those vith 5 or more points for
significance at the 5 percent level. For purposes of orientation, it
should be noted that significance at the 10 percent level requires values
of .8054 for 5 points and .9000 for four points.
Figurc 3 shows the plot of hmineralizable N and Adigest N after 2,
4 and 8 weeks of incubation for November 1973 topsoils and after 2, 3, 8,
and 16 veeks for August 19T samples. Again, there was no apparent rela
tionship. Figures 4 and 5 show plots of a-ineralizable N against Adigest
N for all incubation periods for each soil. In these figures a definite
trend towards significance is apparent. Although these data show no rela
tionship between Amineralizable N and digest nitrogen at any given incuba
tion time because of the variation from soil to soil combined vith the few
number of data points, they suggest that digest N measurements were related
to the reservoir of N available to microbial populations for the production
of mineral nitrogen.
Discussion
From the small number of data points it was impossible to conclude
anything about the value of the two test procedures for the Dark Red
Latosols of the experiment station in Brazil. There is no simple explana
tion for the lack of correlation between the chemical test and the incuba
tion procedure. Lathwell et &1. (1972) reported a highly significant
relationship using 10 Oxisols and Ultisols from Puerto Rico, vhile Assa
(1973) reported correlation coefficients with and without significance

.2
Figure 3. Amineralizable N vs Adigest N after different lengths of incubation, November 1973 and August 1974 samples.
2 week incubation ) week incubation 8 week incubation Noverber 1973 November 1973 November 1973
60 60 60
50
4o
50
4Io 00( % 50
.o
0-30
0 30 0 30
.20 00 20 0
, - ,'I
-20 -10 Adigest N
"10
5 -20
'l
-10
10
I
-30 -20 Adigest N
I
-10
O
2 week incubation August 1974 60
8 week 4 week incubation incubetion August 1974 -60 Aug.1974
16 week incubation
-5 Aug.3974 -60
50 -50 50 50
.4o
30
.10
.0
3U
00 ,0
CP 0
0
.0
!0"
0
0 000
0
- 0
00
00
A
-30 -20 -10 0 30 -20 -10
Adigest N
0 20 10 0
It
20 10

/, 43
1ure 4. A-inerslizable N vs AdIgest N, Augut 197average November 1973 ssaples and soil
Soil A soil B Soil C TO "70 70
60 -60 60
50 50 50
.40 1.0 10
030 30 30 00
00 0 .0 .2 6-20 0 -20
0 200
10 10 - 10
p I I I I pI
-30 -20 -10 0 -30 -20 -10 0 -30 -20 -10 0
digest N ppm
Soil D Soil E Soil A 11/73
7o 70 70
60 M60 - 60
50 - 50 - 50
0 O -40 6) - 0
0 0 3
M020 20 0 0 20 0 20
0 0
10
0 10 10
-30 -20 -10 0 -30 -20 -10 0 -30 -20 -10 0
Adigest N ppm

Figumre 5@. Aineralizable N ys Adigest N, November 1973 soils.
Soil B Soil C Goi2. D
70 TO 70
60 6o 60
0
50
40 0 0
50
.40
-50
- 0
0 30 0-30 0 30
0 20 -20 - 20
-30
p p
-20 -10
Soil E
-10
.
0
70
I I
-30 -20 -10
Adigest N ppm
-10
0
______i__
-30 -20 -10
-10
0
60
0
0 o4
0 0
50
030
-20
- 10
-30 -20 -10 0
Adigeet N ppm
10

.45
betveen the values of digest N and the values for uineralizable N at 2,
4, and 8 weeks, ,,uing a -Lin Silt Loa soil frm Aurora, Nov York.
Anng the factors which could have inflaenced the relationship between
the tvo sets of test values are the condtio,,l of the soil at sspling and
the length of storage before analysis.
The sils In thin study were air dri.d in a greenhouse and stored
in plastic bags for 2 1/2 yee.s before analysis. There are n6 data
available about the effecta of air-drying of soil semples on the values
obtained by the 1 N KC1 extzsction plus acid digestion test procedure
vhich was wed in this study, or -ahat the effect of air drying might be
on the properties of the specific Oxisols used in this study. Various re
searchers have reported data concerning the response of a variety of soils
to air-drying, and the effect *f air dtfing and storage on various
analytical procedures. Eagle and Hathews (1958), working with nine soils
from Ontario, Canada, stated that there was no effect of air-drying on
soil test results. They did not, however, present a"y jata to support
this statement. Birch (1960) reported that drying profoundly affected
the anonifying and nitrifying organism in the soil. Keeney and Breer
(1966b), using 25 soils from Iowa, studied the effects of air drying on
the analytical results of 6 soil test methods and reported a distinct
effect on values of ' of the 6 test procedures. In all cases of a change,
the reported means of the 25 soils increased. Since the data on the
Individual soils vas not reported, it is impossible to d4 terolue what the
nature of the variation in response was by individual soils, or by groups
of soils with similar properties. Jenkinson (1968) studied the effects
of air drying on zineralizable N and on Ba(ON) 2 extractable "glucose"
values of some Iglish soils. Air dting was found to increase both the

16
mineralizable nitrogen and the "glucose" values. Hesse (1971) reported
that the water soluble organic nitrogen fraction increased with time and
temperature of drying. Lathvell et &l. (1972) used freshly air dried @oil
samples in their study and reported highly significant correlations be
tween digest nitrogen values and mineralizable nitrogen values. There in
not clear evidence, then, that air drying the Brazilian soil samples
influenced the values of digest nitrogen and minerslizable nitrogen
sufficiently to cause a lack of correlation between the two soil tests.
There are reports in the literature on the effects of lengths and
temperature of stor: e on soil test results. Eagle and Mathews (1958)
reported that prolonged store& of soil samples before testing caused an
increase or decrease in the measured ability of the soil to supply
nitrate nitrogen. Keeney and Bremner's 1966 study comparing the effects
of field moist, freshly air dried, and air dried 'lus stored samples on
the results of six soil test metho,. noted a trend towards increased
values for sm test methods after 8 weeks of storage compared with
values for freshly air dried smples, although the increases were not as
large as those between field moist and freshly air dried samples.
Jenkinson (1968), working with British soils, found an increase in the
mineralizable nigrogen values, but little, if any, in the values for the
Ba(OH) 2 extractable "glucose" after 3 1/2 or 10 years of storage. Newo
and Hagin (1966) were cited in Hesse (1971) a having found that changes
during the first three months of dry storage were independent of micro
organism, and that the major factor involved Va a change in the ybysico'*
structure of the organic fraction. Chalk and Waring (1970) reported that
storage at room temperature was the main factor in the change. They
further reported that the response of soil to storage wa not consistent
aoing methods nor predictable vithin methods. Freney and Simpson (1969) studied the effects of drying soils at three different temperatures and
concluded that there was an increase of nitrogen released with an increase
in temperature.
The type of container used to hold the soil in storage my also
influence soil test results. Olson at al. (1960) compared the change in
amonium nitrogen status of four soils before and after incubatioa when
stored in glass Jars or paper sacks. They reported that the amonium
values vero higher for soil. stored in sacks than in Jars, and that soils
with pH of 5.4 and 5.7 had a greater accumulation of amonium when stored
in the sacks than did soils of pH 7.8 or 8.0. These increases in smorn
ium likely reflect contamination from the storage environment. Hesse
(1971) noted the possibility of pollution from certain kinds of plastic
containers. In a study of montmorillonite clays, it was found that
organic complexes passed from the plastic into the clay minerals, result-
Ing in fundamental changes in the minerals.
Incubation studies and tests for digest N were conducted in 1975
on 4 soils which were samples of the original soils used by Lathvell at
al. (1972). The soils had been stored in an air dry state in tightly
capped plastic bottles at room temperature for 3 1/2 years. Table 3
shows the PlI. nitrogen determined in the original study and by this
author in 1975. Inspection of the data lead to a conclusion that there
was, in general, no effect of storage. An independent T test performed
on the data supported this conclusion. However, there were changes in
test values for some soil samples. The lip@ soil (Typic Acrorthox)
showed a definite increase in pin N mineralized at both Incubation times
after storage, and the Cialitos (Orthoxic Tropohumult) showed a marked
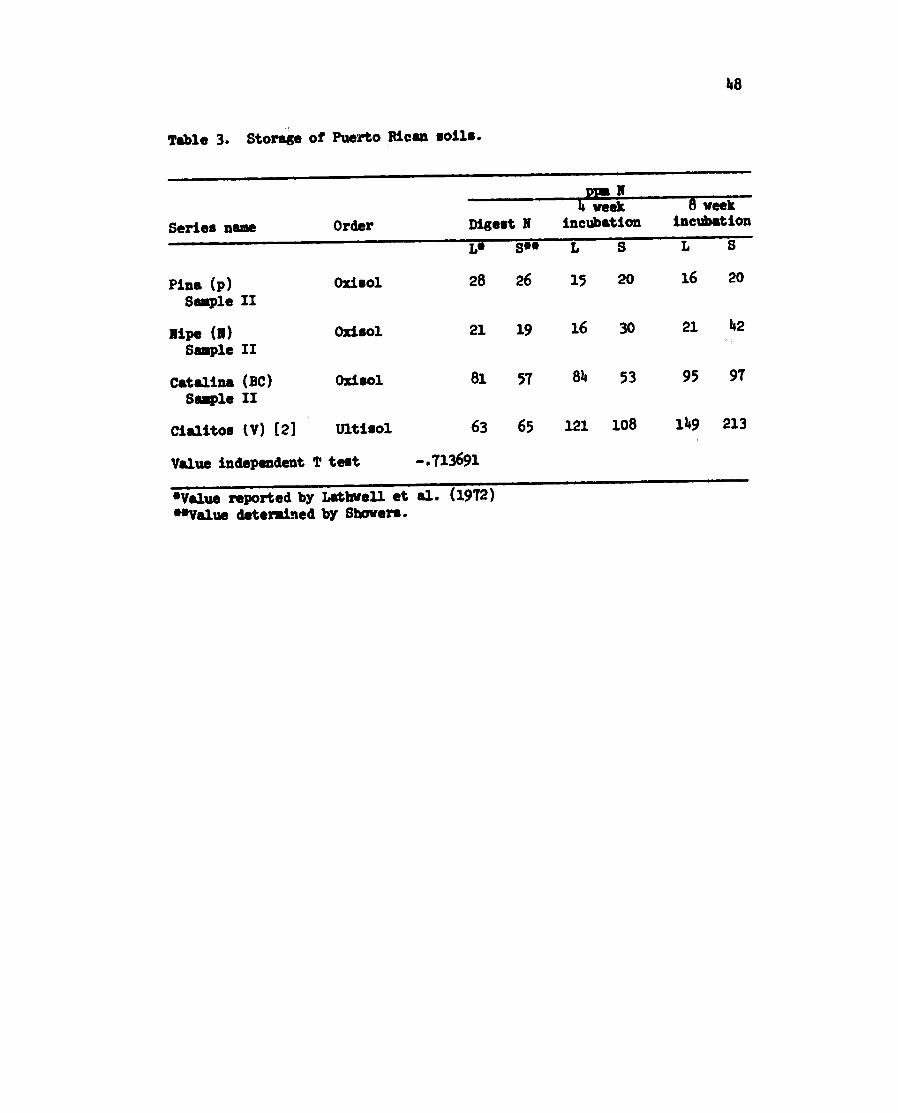
18
Table 3. Storage of Puerto Rican soils.
Series name Order Digest N
L* Sao
pM N w.veek
incubation
L S
8 veek incubation
L S
Pins,(p) Sample II
Nipe (N) Sample II
Catalina (BC) Sample II
Cialitos (V) [21
Oxisol
Oxisol
Oxisol
Ultisol
28
21
81
63
26
19
57
65
15
16
84
121
20
30
53
108
16
21
95
149
20
42
97
213
Value independent T test -.713691
*Value reported by Lsthvell et **Value determined by Shovers.
al. (1972)

"9
of incubation. The CatalinaIncease In -ineralizsble N after 8 veeks
soil (Typic Haplorthox) hoved a maked difference betveen the values for
digest N of freshly air dried and air dried plus stored for 3 1/2 years
also Oxisols, although they belongsamples. The samples from Brazil are
to the Great Group Typic Haplustox.

SOIL TEBTS AND M1WUREMEITS OF CROP YIELD
Results
Figures 6 through 9 illustrate the relationship between values
from the chemical and biological test procedures and nitrogen uptake by
the maize crop. As shown In Figure 6, there vas no relationship betveen
digest N and N uptake by the grain. A trend towards significance vith
length of incubation is shown by Figure 6, although the r values do not
reach significance at the 5 percent level and the R values account for,
at most, 60 percent of the vsaiution. The data in Figure 7 shows there
vas no relationship betveen digest N values and values for nitrogen uptake
by the stover, and no significant relationship betveen any of the incuba
tion times and N uptake by the stover. There is no explanation other
than chance for wlj there vas an increase in correlation for 2 and 4
weeks and a decrease in correlation vith the 8 week incubation time.
Figure 8 shows the plots of digest nitrogen and mineralization values
against nitrogen uptake by grain plus stover, iind, as might be expected
from the preceding two figures, there vas no relationship of significance
vith either test. Figure 9 shov the affect of the inclusion of subsoil
incubation data in the values for the 8 week incubation experiments
when plotted against grain nitrogen uptake, stover nitrogen uptake, and
grain plus stover nitrogen uptake. There are only four data points be
cause there were only four subsoil samples available for analyses. The
required r value for significance at the 5 percent level is .9500; in no
instance is this value approached.
Figures 10 through 13 depict the relationship between the tvo test
50
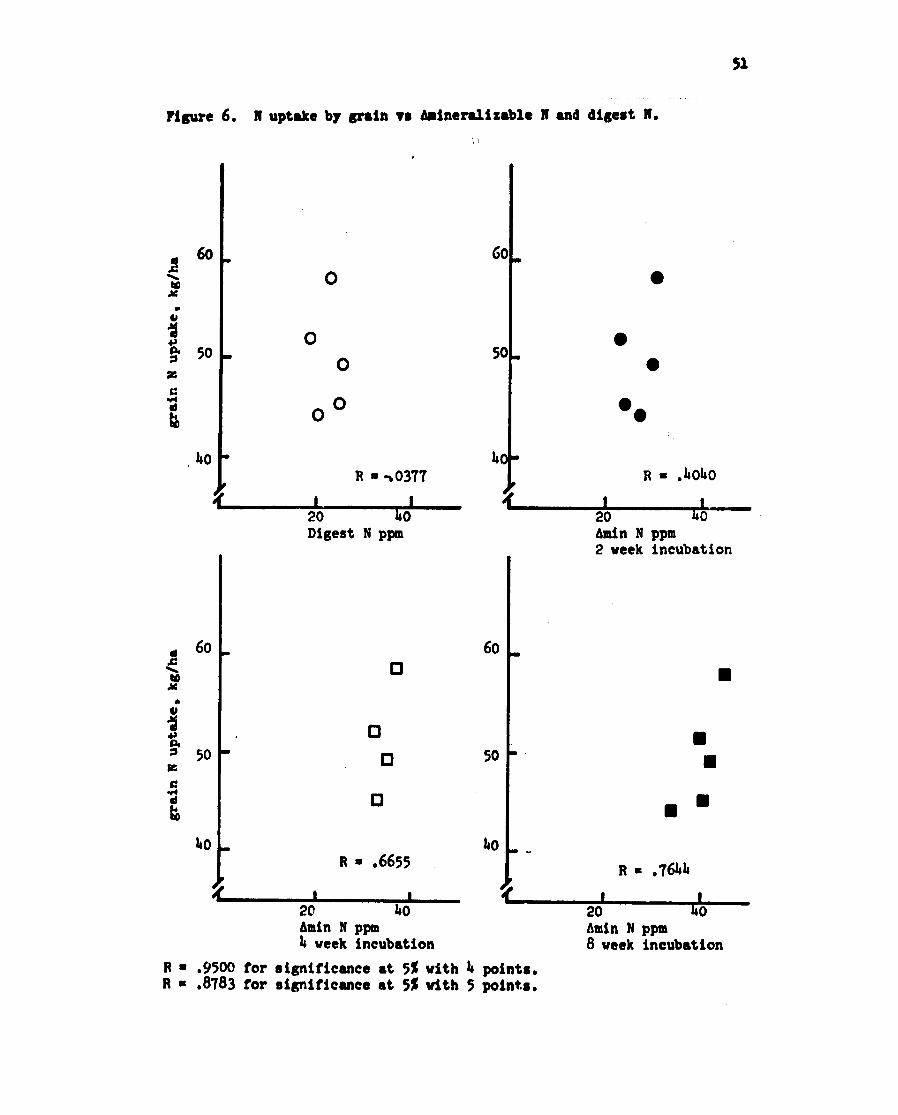
Figure 6. N uptake by grain vs Anineralizable N and digest N.
S6o 60. 0
0050 0 50 0
0 0
140 14 R a-b0377 R .4014o0
20 40 20 40 Digest N ppm Amin N ppm
2 week incubation
6o 60
50 050 00
140 140 iRu.6655 R u.764h
20 W4 20 40 Aumi N ppm Aumi N ppm. 14week incubation 8 week incubation
B u .950C0 for significance at 5%with 14points.R .8783 for significance at 5%with 5 points.

Figure 7. Nitrogen uptake by stover vs-aIneralizable N and- digest N (topsoils)
. 60 60
a 3
4o,70' 0.0
o 4o
•1. 00 0
20 0 20 R m -.0668 R u .7137
40 20 1.0 digest N ppm ain N ppm
2 week incubation
d 60 60
ho )"o
10 on
20- 20 R . .8196 R = .3283
Ain N ppm wweek incubation
Amin N ppm8 week incubation
R a .9500 for significarce at 5% with 4 points.R n .8783 for significance at 5%vith 5 points.

53 Figure 8. N uptake by grain + stover vs Amineralizable I and digest N
d
o80 "80 0.0
0 00 ° 0
R =-.0589 R .6316
0 0020 80 20 40 Digest N ppm Amin N ppm
2. reek incubation
100 "100"
P''I 4 I I
o80 0 800
60 R 08 60 R .5313
20 40 20 4o Ain 1t Amin N
veek incubation
R for significance 10950Oat 5% vith 4 points,
R 0 .8783 for significance at 5% vith 5 points.

5)' Figure 9. N1uptake by grain, stover, and grain + stover vs hAinerals
able N (8 week incubation); topsoil and subsoil.
60
50
0
0 00
0 6o
I° -5o
043 50
4o0
0
R * .2509
0
R -.0185
TO 80 70 80
d
100
4'
0
8o0
80 (
E3
w 6o R m .0969
R * .9500
70 80
for significancext 5%vith 4 points.

methods and various measurements of crop yield. Figure 10 shows the
scatter diagram for the test values of the two test procedures and the
yield of grain. There was no relationship between digest N and grain
yield. There vas, however, a trend of increasing correlation with length
of time of incubation, culminating in a highly significant relationship
between the mineralization values obtained after 8 weeks of incubation and
the grain yield. The correlation coefficient is .9213, which exceeds the
required r value of .8783 for significance at the 5 percent level, and
accounts for 85 percent of the variation. Figure 11 shows that there were
no relationships between values obtained by digestion or incubation for
any of the three lengths of time and stover yields. Thus, it is of little
surprise that Figure 12 shows no relationship between digest or incubation
values for grain plus stover yields. Figure 13 shows that, as with
nitrogen uptake in Figure 9, inclusion of the subsoil incubation values
did not improve the correlation with yield data.
Discussion
The data presented in Figures 6 through 13 show some trends towards
correlation but, with the exception of values for grain yield and 8 week
incubations, no significant relationship vas shown to exist. A major
factor limiting the interpretation of the data from this study is the
smal number of data points. With only four or five data points, it is
difficult to determine a trend or a relationship; individual points can
vary considerably from a regression line. Further, since there is a high
probability of four or five points indicating a relationship when there
Is none, the value of r for significance at the 5 percent level must be
extremely high. However, the attainment of a high and significant r
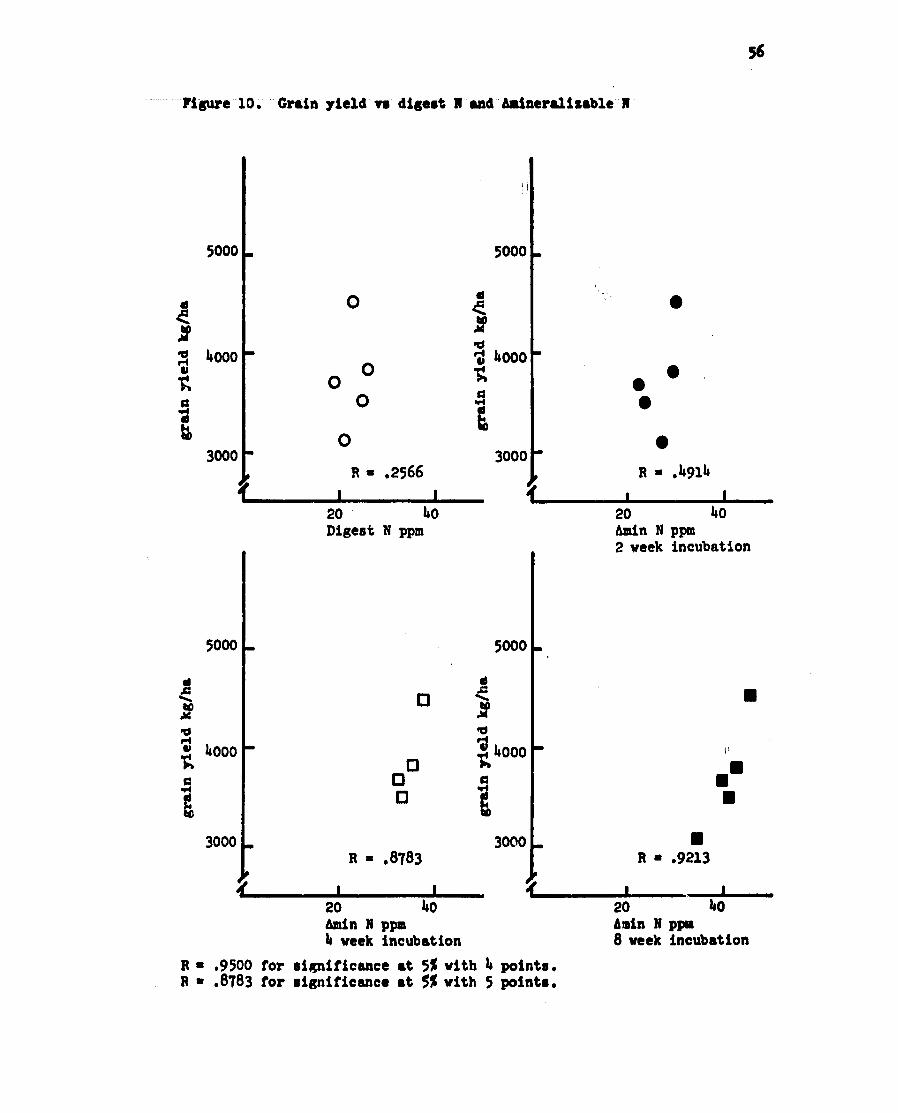
56
Figure 10, Grain yield-ve digest N and Maneralisable I
5000 5000
a0
d d S
O4OO 0 000 " 0 0y
A 0a
t0 3000 3000
R a .2566 R -.4914II I I
20 4o 20 40 Digest N ppm Azin N ppm
2 week incubation
5000 5000
° N
4000 '94000
a E3
3000 3000 U R -.8783 R * .9213
20 40 20 40 Amin N ppm Amin N pp. 1 week incubation 8 week incubation
R a .9500 for significance at 5%with 4 points. R a .8783 for significance at 5$with 5 points.

5T
Figure 11. Stover yield vs digest N and Aninerulizable N.
6000 00 6000
0
5000 5000
0 0 'A4
.,4 4
1.00 1O00 R a ,0970 R * .5119
II p p
20 4o 20 40 digest N ppm Amin N ppm
2 week incubation
0U A 5000- go00
5000 5000
*1*0 to .p.4
000.. Wo00 R .5444.r R- .5101
, I _! p
20 1o 20 10 Amin N ppm week incubation
Amin N ppm8 week incubation
R " .9500 for significance at 5% with 4 points. .R .8783 for significance at 5% with 5 points.

vs Amin. I ud digest N.Figure 12. Yield of grain + stover
13000 .13000 0
d d
-- 1200012000
VV
+o 1'0000 -+ a 10000
0 *1 +" 10000 -,.,1000
0 00
80000 0S8000 R .5901•5149R .
20 .020 140 Amin N (ppm)Digest N (ppm) 2 week incubation
13000 0 13000 U
A
° • +10000.+ 10000
5454
h(3
V 01000 V+ 8000.8
P R .5243R a .5731 20 4020 40
Amin N (ppm) Amin N (ppm) 8 week incubation4 week incubation
R = .8054 for signific nce at 10% with 5 points.

59
I
.. e stover, graIn-t tover vs 8 veek hmlaeralis-Fi 13. .Yield of grain,ble x, topsoil mA subsoil.
50oo 6000.
0
a ooo0 • 500o0 00 0V
3000 0 10oo
3. .531.2 R *-.14.32
8 TO 80 Ain N ppr, 8 veek incubation, Lain 1 ppm, 8 week ii :ubatopsoil and subsoil tion, topsoil and. subsoil
13000
12000
a '10000
ba
8000 0 0
R * .2001
70 80 Amin N pp., 8 week incubation topsoil cI subsoil
R * .9500 for significance at 5% with 4 points.

60
value is not enough evidence to demonstrate the existence of a useful rela
tionship. When evaluating the meaning of the significant r value for the
relationship between yield of grain and Amineralizable N at 8 ree*s, it is
important to consider the slope of the line. The steepness of the slope
of the line in this relationship is such that a small error in the x value
AmIneralizable N vould mean a large error in the y value (yield of grain).
Thus, the relationship vould be of little use in predicting grain yields
if there vas any possibility of variation in the soil test value. It is
also quite likely that this significant relationship is not a reflection
of reality but rather an example of data that appears to demonstrate a
relationship but in fact is only reflecting a cha.nce configuration of
points. Factors other than nitrogen measured may have been more important
in determining crop growth, but with only four or five data points and
sparse data about the crop environment and handling of the field experi
ment, it vas impossible to perform ary data analysis which would take into
consideration these other potentially mediating factors.
Several factors may have influenced the values for the soil tests,
crop yield and their relationship to each other: time of sampling,
pretreatment of the soil sample, growth of the crop in the field and
error in analysis. The time of sampling has been mentioned as a critical
factor in obtaining meaningful relationships tetveen soil test values and
crop yields. It has been reported that the mineralizable nitrogen content
of the soil varies in the course of a year in tropical situations
(Cornforth, 1971) as vell as in temperate regions (eagle and Mathevr,
1958; Olson, 1960; Ass&, 1973). It has been suggested that sampling
should be done in the spring or late fall in temperate regions, in order
to obtain a reliable estimate of the nature of the soil nitrogen reserve.

61
The best time of the year for sampling has not bem suggested for regions
like the central plateau or Planalta of Brasil which have a wet/dry
moisture regime. Cornforth (1971) studied the variation in mineralization
of samples collected at monthly intervals on the island of Trinidad and
concluded that mineralizable nitrogen was related to the moisture content
of the soil at the time of sampling and to the previous month's rainfall,
and therefore that there was no Justification for using mineralizable
nitrogen in a soil sampled in one season to indicate the mount of avail
able nitrogen in that soil in a different season. Lathvell at al. (1972)
introduced a drying period into the cropping sequence in the greenhouse,
thus measuring nitrogen flush after a period of drying. They suggested
that laboratory and greenhouse techniques might be devised to account for
the problem of time of sampling.
In the earlier discussion of factors affecting soil test procedures,
air drying and storage vere suggested as influences on the values obtained
by various tests. In the study by Keeney and Brener (1966), storage
effects were found on the values of various soil test procedures, but the
change in values did not affect the correlation of the soil test with
N uptake by the crop. Chalk and Waring (1970) similarly found storage
effects on test values but no effect of room temperature storage on the
correlation between biological or chemical tests and nitrogen uptake.
There was no opportunity to investigate the difference between fresh, air
dried, and air dried plus stored samples of the Dark Red Latosol from
Brasil.
Another factor which my have influenced the relationship between
soil test values and crop yield or nitrogen uptake was the environment of
the crop in the field, and its affect on crop growth. According to the

62
3974 annual report (North Carolina State University), the 1973-197 year
was notable for the second highest ammt of rainfall in 47 years of
record keeping In September, high rainfall which was well distributed
throughout the rest of the growing season, low solar radiation due to the
cloud cover in September and March, and high incidences of disease and
insect damage. This damage was largely due to Northern and Southern Leaf
Blight (Heluinthosporium app) and ear vorm and stalk borer (Heliotis zea);
insecticide applications were vahd out by the daily rains, and the
weakened plants vere susceptible to wind damage (North Carolina State
University, 1974). The nitrogen experiment was reported to have been
particularly severely damaged. It m!ght be suggested, then, that the
crop performance vas low due to environmental conditions, and thus did not
reflect the potential of the soil to supply nitrogen, which the tests
neasure. Figure 14 shovs the yields of maize from all plots for the last
5 years. While it is apparent that the crops receiving nitrogen suffered
greatly in the 1973-T7 growing season, it is also apparent that there was
no significant difference between the yield of the check plots in 1973
and in 19T4-75, which was considtred to be a year with excellent field
conditions.
There Is one factor in tb experiment which my modify the seeming
high ability of the soil to supply nitrogen to the check plots. Bouldin
(pen. com.) and Ritchey (pars. com.) report that the rooting habit of
the umize variety grown is such that, combined with the small plot size,
the maize plants in the outside rows of the check plots were able to
utilize nitrogen applied to adjacent plots receiving nitrogen treatments.
These outside rows grew taller than the inside ros, providing some
shade. What affect the interaction of the additional nitrogen and the

63 Figure 1. Gaim yield va fertilizer aplwication,
1972-73 1976-77. Pnaealtina, Brazil
7000
5000
7000g
3000
6000
1000
(
U.
o *I S19T2 1973
S19T3 - 19T4 19T.4 -19T5
r'i 19T5,,- 19T/6
0 29T6 - 1977
20 4O 6 8 100 10
N fertilizer, Kg/l
200 220

64.
shading had on the crop yields of the zero nitrogen check plots is not
known. Thus, it is possible that the soil samples did not reflect the
nitrogen supply vhich was available to the plants for growth.
Further possibilities for the lack of correlation between crop
growth and the soil tests is error in determining the yield of the crop
and in the laboratory analyses of the soils and crops. Kass and Droadoff
(1970) discuss possible sources of error in various N measurement pro
cedures.
INCBATION SJDY
Results
Figures 15 through 17 show the amount of 10 N and NH* N produced
over tim by the topsoil samples taken in November 1973 and August 19714.
For all soils, the momunt of NH, N declined from the levels
originally present in the soil, and disappeared after two or three weeks.
Nitrate N shoved a sharp increase, with the auimam rate of production in
the first 8 weeks. It is evident that in all plot@ sampled, the November
1973 samples produced more mineral nitrogen than the August 1974 samples.
Figure 27 shows the amounts of NO- N and IH+ N produced over time by the
subsoils. In contrast with the topsoils, there was a sharp increase in
NH+ N production for the first fev weeks, concurrent decrease in4 and
10 N, followed by a rapid decrease in NH+ and increase in NO- N. Table 4
shows the average values of mineral nitrogen produced by the Brazilian
soils, and the names, some characteristics, and amounts of nitrogen
mineralized upon incubation by 29 other soils vhich were reported in the
literature. Table 5 gives the means of the amount of nitrogen mineralized
by various groups of the soils from Table 4. Table 6 gives characteris
tics of the Individual soils from Brazil.
Discussion
The reasons for the difference in the amount of nitrogen mineralized
by the samples from the two sampling dates is not clear. The difference
could reflect nitrogen uptake by the crop, a change in the energy source
available to the microorganism after a crop, or the seasonal variation in
potentially mineralizable nitrogen. The August samples were taken 3 1/2
mnths after the crop was harvested; it vould, therefore, be unlikely that
65

g 1ANO 3 vs length oftoosollsamplesNovemberfigur e 15. ad AN4 production1973 ead August 197, incubation, A + B
60 Soil A
50
l x .0A30 / 0 November 1973
0 // 0 NO August 1974 0 /C E NH4 November 19T3
2o / r Nit August 1974
110
234 8 6 39 weeks of incubation
Soil B
60
50
140
U0
30 /20t
10
3- 39
weeks of Incubation

&30' and AH: production vs length of incubation, November 67 Figure 16. 1973 and August 1974, topsoil samples C & D.
Soil C
Go
50
1.0
0• NO- November 1973
30 / 0 140 3 Agust 1974
U NH+ November 1973 20 3 NH August 1974
10
2 3 8 16 39 veeks of incubation
Soil D
060
50
40
S30
20
10(
weeks of Incubation
68
Figure IT. AN10 and ANHdproduction vs length of incubation, November i97 and Augst 19Th. topsoil sample E.
6!0
6o- soil E
50 0 00
40. 0 OHo3 November 1973
m 30 "0
0
* NO
NH 4
August 197
November 1973
13 NH+ August 1974 20
10
2r3 8 16 39
veeks of incubation

Figure 18. ANC0 ad ANH production vs length of Incubation, November3 1
1973 subsoils. TG-
Subsoil A60
70
60- Subsoil B
I o
50
I 50
2~,10 20 -~q
0 234 8 2 8
length of incubation length of incubation
Subsoil C Subsoil D
50 50
o/
L0 +~ 30 +* 30
20 a 20
10 10
2314 8 2 4 8 length of incubation length of incubation
Lines are for ease of reading graph. No fun-ctional relationship is intended.

7o
Table 4. Value of mineralization determined for Oxisols compared vith values reported for some temperate and tropical soils.
Amin N. pinm
Soil/source pH
H20 CaC12 Org C Total N C/N 3
week + week
8 week
Shovers (1977) Planaltina, Brazil
November 1973 top (0-15 cm) sub (15-30 cm)
6.29 5.20
5.83 4.74
1.89 1.55
.114
.0975 16.58 15.9
41.66 43.85 52.93
50.3 53.2
August 1974 top (0-15 cm)avg. 6.07 5.60 1.79 .116 15.43 29.03 31.60 10.6
Boletim Technico #8 (1-966) Planaltina, Brazil top (0-10 cm) sub (10-35 cm)
4.9 4.8
1.76 1.16
.21
.08 8 14.5
Stanford & Smith (1971) Cecil SL, Ga. 5.8
6.2 .68 .714
.0h9
.051 13.88 14.51
50.14 56.4
6.5 .36 .031 ii.61 29.7
Goldsboro SL, S.C. Greenville FSL, Ala.
5.3 5.4 6.4
.66
.86
.92
.039
.0149
.0148
16.92 17.55 19.16
18.5 20.3 27.6
Grenada SiL, Miss. 5.9 6.4
1.17 1.149
.116
.141 10.09 10.57
77.4 96.9
Kranzburg SiL, S. Dak. Lakeland LS, S.C. Lock Kill SiL, Pa. Norfolk FSL, S.C. Palouse SiL, Wash. Pullman SiCL, Wash. Ritzville SiL, Wash.
6.2 5.6 5.6 5.5 6.0 5.8 6.5
2.38 .26
1.51 o.45 1.82 1.06 .72
.231
.031
.115
.030
.135
.110
.068
10.30 8.39
13.13 15.0 13.148 9.63
10.59
75.9 13.1 87.8 16.8 51.8 65.8 214.7
Gasser (1961) Sand Silt Loam Fine Sandy Clay Loam Fine Sandy Clay Loam
5.5 6.4 5.9 5.3
.82 1.62 2.37 2.38
.094
.1143
.256
.262
8.7 11.3 9.3 9.1
10 26 43 36
Lathwell. et al. (1972) Puerto Rico Nipe, Typic Acrorthox 5.7 1.145 .100 14.5 16 21
Pings, Pswsentic Haplorthox 4.9 .71 .072 9.86 15 16
Catalina, Typic Haplorthox 5.4
Cialitos (28], Orthoxic Tropohumult 6.2
2.92
1.01
.28o
127
i0.
7.95
-84
7
95
11
Cialitos (4], Orthoxic 142 531.67 .196 8.52Tropohumult 5.0
(continued)

71
Table 1(continued)
' &nin W.nppm PH 3 4
Soil/source H20 CaC12 Org C Total N C/N week week week
Cialitos [3], Orthoxic Tropohumult 5.9 2.24 .238 9.41 22 32
Humatas, Typic Tropohtmult 4.9 2.50 .220 11.3 58 69
Cialitos [21,, Orthoxic Tropohumult 6.4 3.26 .335 9.73 121 149
Cialitos (], Orthoxic Topohuuult
Los Guno., Typic Tropohtult
5.8
4.9
3.26
3.66
.320
.328
10.2
11.2
99
189
118
193

72
Table 5. Su=arY
ANin, ,,;m % %1 3 4 8
Group soils pH(H20) Org C Total N C/N week week veek
mean of all soils 32 5.8 1.57 .142 11.1
mean of 4week inc 28 5.8 1.54 .162 9.51 -- 53
mean of 3 week inc 6 5.9 1.81 .164 11.7 31 -
mean of 8 week inc (tropical soils) 13 5.6 2.15 .196 1.6 -- 69
mean of Oxisols, Puerto Rico 3 5.3 1.69 .151 11.6 - - 44
Brazil samples
Topsoil, 11/1973 5 6.29 1.89 .114 16.6 42 44 50
Topsoil, 8/1974 5 6.07 1.79 .116 15.4 29 32 41
Subsoil, 11/1973 4 5.20 1.55 .0975 15.9 -- 53 53

73
Table 6. Soll characteristics _Trlc Iaplustox, p1-a-ltia, DBna.
pHp20 CdC12 %Org c % OC/N
Topsoil 11/73
A 6.15 5.63 1.64 .11 14.9
6.38 5.92 1.88 .10 18.8
C 6.30 5.90 2.13 .11 19.4
D 6.31 5.88 1.95 .11 17.T
E 5.79 5.31 1.83 .11 16.6
Subsoil
A 4.93 4.47 1.69 .08 21.1
B 5.11 4..89 1.66 .08 20.8
C 5.22 4.78 1.66 .09 18.4
D 5.23 4.80 1.20 .09 13.3
Z no sample available
Topsoil 8/T.
A 5.79 5.30 1.88 .10 18.8
B 6.18 5.69 1.68 .09 18.7
C 6.22 5.73 1.82 .11 16.5
D 6.30 5.90 L.74 .10 17.4
Z 5.86 5.38 1.82 .12 15.2

74
these smples reflected the condition of the soil at the end of the crop
ping season. It is morr likely that these soil samples, when revetted
after being air dried, produced a nitrogen flush similar to that which
occurs at the beginning of the rainy season. It ight be more plausible
to consider the affect of residues from the crop on the energy supply of
the soil microorganisms. It could be hypothesized that root and other
crop residues contributed to the carbon supply of the soil, decreasing the
amount of mineral nitrogen vhich vould be released to the soil system.
Hovever, Table 6 shows that the means of the carbon to nitrogen ratios of
all of the plots remained essentially the same. Individual plot to plot
variations are likely a reflection of error in sampling and analysis. It
has been reported in the literature that acid soils in the temperate
region demonstrate a seasonal variation ir their ability to produce
mineral nitrogen (Olson et al., 1960) and Cornforth (1971) has noted
monthly variation in mineralizable nitrogen produced by incubating soils
of 2 different moisture regimes, vhich vere collected at monthly intervals
for one year on the island of Trinidad. He concluded that the mineraliza
tion of nitrogen vas related to the moisture content of the soil at the
time of sampling and to the previous month's rainfall. The rainy season
generally starts in October in the region in which the experiment station
is located. In 1973 the rains began early and the amount of rain vas
greater than usual. The monthly precipitation was 180 w for November
30 = for August, 194 (North Carolina State University, 19T4;1973 and
1975). According to Cornforth's theory, samples taken in November 1973
reflected the high amount of rainfall in the preceeding month and, poss
ibly, a high moisture content at the time of sampling, while those samples
taken in August 197 reflected the conditions of the dry seaon. It is

75
-not possible to determine, from, this data, whether the Brazil samples
really did follov Corforth's model, for Coinforth'sasamples were frozen
until the time of analysis (within one year of collection), while the
Brazil samples were air dried and stored for several years. It is not
known whether the effects of date of sampling would persist through air
drying and storage.
The val.ues in Table 5 show the means of mineralization values re
ported in Table 4, which were taken from the literature. The soils dis
cuabed in the literature were all handled in different ways, and incuba
tions were not conducted according to a standard procedure. Also, error
estimates ver' not reported with all values, making it impossible to
determine the variance. Thus, comparisons of the exact numerical values
in the literature is not meaningful, and these values should not be used
for other than generally descriptive purposes. The striking feature of
the data in Table 5 is the similarity of the values obtained from such a
geographically diverse group of soils. Differences in experimental
techri.que and sampling error would likely account for any apparent differ
ences. It would be tempting to conclude that there is no difference in
the potential of tropical and temperate region soils to supply nitrogen
to a crop.
It is important, hovever, to consider the cropping history of a
soil as well as its mineral properties. It is widely accepted that culti
vation of a virgin soil disturbs the organic matter equilibrium, inducing
an increase In the decomposition of organic matter, with a consequent
greater rate of N release. After a given piece of land has been culti
vaed uder a particular management scheme for a period of time, a nev
4equilibrium l4vel is reached n which the rate of organic matter
76
-decomposition and N release is much lower than when the land was first
a loverbrought into cultivation. The new equilibrium level represents
level of both organic matter and organic N than existed in the virgin
asoil. Further, it has been reported that additions of nutrients and
change in pH can also affect the decomposition of organic matter, leading
to increased N mineralization. Sanchez (1976), citing unpublished data
from North Carolina State University, reported that P and Ca additions
from Brazil which was extremelyincreased N mineralization in an Oxisol
low in these nutrients.
When comparing N mineralization values of different soils, it is
to know whether the soils at the time of sampling were atthus important
after the second year of croppingtaken before and
an equilibrium or not, and if so, which one. The soils described in
Tables 4,and 5 had varied cropping histories. The Brazilian samples were
at a location which had
no known history of cropping. The samples used by Stanford and Smith
ARS field locations in the United States;(1971) were collected at various
with a history of having been cropped.most likely these were areas
samples were taken from experimental fields in FnglandGasser's (1961)
on the growth of barley,where rates of N fertilizer were being evaluated
Of the 10 soils studied by Lathvell et al. potatoes, kale, and grass.
were in pasturefrom cultivated fields (two(19T2), 9 of the samples came
at the time of sampling) and one sample was taken from a field that had
not been recently cultivated.
The soils in Tables 4 and 5 can thus be divided into two major
a history of extensive cultivation and those groups: those which have
with no known history of cropping. The Brazilian samples fall into the
all of the other soils fall into the former category.latter category, and

77
from the variou cultivatedassume that samplesOne might reasonably
respect to organic matter at or near their equilibrium withfields were
N mineralizationat & somehat stableand organic N content, and thus vere
of this study, however, more likely reflect level . fte Brazilian samples
the dynamic transition time betveen the stable equilibrium of a virgin
Taken soil system and the equilibrium attained under sustained cropping.
would conclude that the potential of cerradso soils, in this light, one
taken from the Planaltina site the second year of cultivation, to
a variety of to the N mineralization potential of
mineralize N was equal
soils with similar pH, and organic C and N values which temperate region
state under cultivation.were at an equilibrium
to raise vould be, how does the The next reasonable question
with theat cultivated equilibrium comparepotential of eerad&-. soils
atsoils with similar pH organic C and N levels
potential of temperate
answer this quescultivated equilibrium. There is no data at this time to
for these Cerradso soils, tion. However, if the general theory holds true
N and organic matter of the equilibrium under then the levels of organic
than the amount at equilibrium in the virginbe lesscultivation will
the potential for N mineralization of cerradao soils just soils. Thus, if
regi-nbrought under cultivation is equal to the potential of temperate
to suspect that the soils at cultivated equilibrium, it is reasonable
N will be 1.ess for the Cerradap soils than the potential to mineralize
equilibrium of cultivation.temperate region soils at the
were likely at cropping systemThe soils from Puerto Rico which
equilibrium showed an N mineralization potential similar to both the gm
soils. Althoughand the group of temperate regionof Brazilian samples
0xisols and Ultisols from a are highly weatheredthe Puerto Rican soils

78
tropical climate, it vould not be justified to use data from these soils
for the prediction of the performance of the cerradso soils under exten
data available for the N mineralizesive cultivation. Since there ikino
wider virgin conditions, nothtion potential of the Puerto Rican samples
ing can be stated about the change in the N mineralization potentiml of
these soils over time vith cropping.

SU....Y AND COCLUSIONS
someCertain problems vere associated vith the collection of of the
sections of results and discussion.data presented in the preceding three
The factor of storage of the soil samples has been adequately discussed
the author did not participate in the conducting of theelsewhere. As
and condishe has no direct information as to the naturefield experiment,
Certain problems arosetion of the crop, and therefore of the crop data.
in the laboratory technique. The 39 week samples vere drier, by visual
a shorter period of time.inspection, than those samples incubated for
Thus, the amount of N mineralized after 39 reeks of incubation is not
for shorter incubation times. Also,directly comparable to the values
may not be suitable for long-termthe incubation in bottles technique
end Bremer (1966) reported gaseous losses of N durincubations. Keeney
ing the long-term incubations vhich they conducted. The decrease in
reflectnitrate in the subsoil data presented in this pa~ar, if real, may
reportedsuch losses. Stanford (1972) citing Allison and Sterling (1949),
"appreciable drops in pl" during 23 week incubations, and Harasen and
noted the possibility of the accumulation of toxins inVan Schrevan (1955)
then could have inlong-term incubations in bottles. These factors,
in the determinafluenced the incubation data. One further problem vas
tion of the percent total nitrogen. The soils vere analyzed five differ
ent times, rresulting in five different sets of values. The values seemed
to be dependent upon vampla size. The values used in this paper vere those
of the macro-Kjeldhal digestion procedure, vhich vere vithin 1.02 of the
values reported by the autoanalyzer. Because the percent total nitrogen
79

80
values may be in doubt, the carbon to nitrogen values may also be suspect.
The number of samples clearly limited the interpretation of this
data. The only strong relationship seemed to be that between mineraliz
able nitrogen and digest nitrogen over time within one plot. This would
lend some support to the hypothesis that digest nitrogen does measure some
portion of the potentially available nitrogen in the soil. Another
observation of possible interest was the difference in the pattern of
nitrogen release for the topsoil and subsoil samples from November 1973.
To what extent the behavior of soils incubated in the laboratory is a
reflection of conditions in the field is not known. However, the behavior
of subsoils, and their contribution to the mineral nutrition of plants,
especially in areas of low nutrient status soils, is an important area for
further Investigation. A further point of interest was the similarity of
values reported for iucubated soils from tropical and temperate regions.
Interpretation of this uimilarity must include a consideration of the
history of the land use; the Brazilian samples were taken from land
recently brought under cultivation while the other soil samples came from
land with a long history of cropping.
It is difficult to determine whether the chemical method used in
this study had any more or any less promise then other chemical test
procedures proposed in the literature. Since there is so much variation
in the pretreatment of soils, and suggestion that time of sampling and
condition of the soil at sampling influence the values of soil tests, it
might be worthwhile for a team to conduct a series of experiments under
uniform conditions in order to evaluate several test procedures. The tem
should have a minimal composition of a biometrician, an agronomist with
knowledge of soils, a plant physiologist and a chemist. The role of the

81
biometrician is obvious, the chemist would be needed for the laboratory
processes and evaluation of techniques, and the physiologist should, among
other things, investigate the utility of grouping plants by their patterns
and rates of nutrient uptake. It is conceivable that the final calibra
tion of the test methods will require a grouping of both soils and plants,
and an interpretation of the interaction of the potential of the soils and
the needs of plants. Clearly, the role of the agronomist in such work is
one of synthesis. Field trials should ultimately be conducted with a vidv
range of crops, on a wide range of soils, in many locations so as to
evaluate the effectiveness of the various procedures under different
mineralogical and meteorological conditions.

BIBLIOGRAPHY
Allison, L. E. 1960. Wet combustion apparatus and procedure for organic and inorganic carbon in soil. Soil Sci. Soc. Amer. Proc. 24: 36-40.
Allison, F. E. and L. D. Sterling. 1949. Nitrate formation from soil organic matter in relation to total nitrogen and cropping practices. Soil Sci. 67: 239-252.
Annual Progress Report for the Period July 1, 1972 - June 30, 1973. Soil fertility requirements to attain efficient production of food crop, on the extensive, deep, well-drained but relatively infertile acid soils of the humid tropics. Cornell University, Ithaca, N.Y.
Assa, Ayenou Desire. 1973. Evaluation of procedures for predicting N available to maize under field conditions. Ph.D. thesis. Cornell University, Ithaca, N.Y.
Beckwith, R. S. 1963. Chemical extraction of nutrients in soils and uptake by plants. Agrochimica 7: 296-313.
Black, C. A. 1968. Soil-plant relationships. 2nd edition. John Wiley and Sons, Inc. New York.
Boletim technico no. 8. 1966. Levantamento semidetalhado dos solos de areas do ministerio da agricultura no distrito federal. Ministerio da Agricultura. Escritorio do Pesquisas e Fertilidade do Solo. Rio de Janeiro, Brazil.
Buol, S. W., F. D. Hole, and R. J. McCracken. 1973. Soil Genesis and
Classification. Iowa State University Press. Ames, Iowa.
Bremer, J. M. 1965. Nitrogen availability indexes. Pp. 1324-1345
in C. A. Black, Ed in chief, Methods of Soil Analysis, part 2, Ajronos 9. Amer. Soc. Sci. Agron., Madison, Wisconsin.
Chalk, P. M. and S. A. Waring. 1970. Evaluation of rapid tests for assensing N availability in wheat fields. 2. Effect of factors associated with field sampling, sample treatment and laboratory analysis. Aust. J. Exp. Agric. Anim. Husb. 10: 306-312.
E. M. 1953. The Kavanda pot test for measuring soil deficiencies.Chenery, Dept. Agric. Uganda.
Cline, M.G. and S. W. Buol. 1973. Soils of the Central Plateau of Brazil and extension of results of field research conducted near Planaltina, Federal District, to them. Agronomy mimeo 73-13. Agronosr Dept., Cornell University, Ithaca, N.Y.
82

83
Cornell University. 1973. Soil fertility requirements to attain on the extensive, deep, vellefficient production of food crops
of the humid tropics.drained but relatively infertile acid soils 1972 June 30, 1973.Annual progress report for the period July 1, -
Cornell University, Ithaca, New York.
Cornfield, A. H. 1960. Amonia released on treating soils vith N sodium of predicting the N-supplying power of
hydroxide as possible means soils. Nature 187: 260-261.
Estimating N fertilizer requirements. J. Agr.Cornforth, I. S. 1966.
Soc. Trinidad & Tobago 66: 419-428.
Seasonal changes in mineralizable N in TrinidadCornforth, I. S. 1971. soils. Trop. Agric. (Trinidad). 48: 157-162.
and D. Walmley. 1971. Methods of measuring availableCornfoth, I.S. nutrients in West Indian soils 1. Nitrogen. Plant and Soil 35:
389-95.
W. C. and E. H. Vasey. 1973. Testing soils for nitrogen. In LeoDahnke, D. Berton eds., Soil Testing and Plant Analysis,M. Welsh and James
revised edition, Soil Sci. Soc. Amer., Madison, Wisconsin.
1971. Fitting Equations to Data,Daniel, Cuthbert and Fred S. Wood. Computer Analysis for Multifactor Data for Scientists and Engineers.
John Wiley and Sons, New York.
D. J. and B. C. Mathews. 1958. Measurement of NO- supplying powerEagle, of soils by an incubation method and correlation vi&h crop yield
Journal of Soil Science 38: 161-170.response. Canadian
Feuer, Reeshon. 1956. An exploratory investigation of the soils and future federal districtagricultural potential of the soils of the
in the Central Plateau of Brazil. Ph.D. thesis. Cornell University, Ithaca, New York.
Freney, J. R., and J. R. Simpson. 1969. The mineralization of nitrogen
from some organic fractions in soil. Soil Biology and Biochemistry 1: 241-251.
Gasser, J. K. H. 1961. Soil nitrogen VI - correlations between laboratory
usasurements of soil mineral nitrogen and crop yields and responses
in pat and field experiments. J. Sci. Food Agric. 12: 562-573.
Gasser, J. K. R. and B. 1. Jephcott. 1964. Soil nitrogen VIII. Some factors affecting correlations between measurements of soil
nitrogen statut and crop performance. J. Sci. Food Agric. 15: 422
428.
SearchOreveling, Thomas. 1976. Chemical analysis of plant tissue. Agriculture 6, Cornell University Agriculture Experiment Station, New York State College of Agriculture and Life Sciences, Cornell University, Ithaca, New York.

84
Hanvway, J. J. 1963. Growth stages of corn (Zea ways L.) Agronomy Journal 55: 48T-1492.
Hanwy, J. J. 1973. Experimental methods for correlating and calibrating soil tests. Pp. 55-66 in Leo M. Walsh Pad James D. Beaton eds., Soil Testing and Plant Analysis. Revised edition, Soil Sci. Soc. Amer., Madison, Wisconsin.
Hanway, J. J. and Lloyd Dumenil. 1955. Predicting nitrogen fertilizer needs of Iowa soils: III. Use of NOi production together with other
information as a basis for making nitrogen fertilizer recommendations for corn in Iowa. Soil Sci. Soc. Amer. Proc. 19: 77-80.
Harman, G. W. and D. A. Van Schreran. 1955. Mineralization of soil organic nitrogen in soil. In A. 0. Norman, Advances in Agronony vol T. Academic Press, Inc., New York.
Herlihy, M. 1972. Some soil and cropping factors associated with
mineralization and availability of nitrogen in field experiments. Irish Journal of Agricultural Research 11: 271-279.
Hesse, P. R. 1971. A Textbook of Soil Chemical Analysis. Chemical Publishing Co., London.
Hobson, R. P. and H. J. Page. 1932. Studies on the carbon and nitrogen cycles in the soil. J. Agric. Sci. 22: 516-26.
Jenkinson, D. S. 1968. Chemical tests for potentially available
nitrogen in soil. J. Sci.Food Agric. 19: 160-168.
Kass, Donald C. and Matthew Drosdoff. 1970. Sources of nitrogen in tropical environments. Agronomy mimeo 70-9. Department of Agronomy, Cornell University, Ithaca, New York.
Keeney, D. R. and J. M. Bremner. 1964. Effect of cultivation on the nitrogen distribution in soils. Soil Sci. Soc. Amer. Proc. 28: 653-657.
Keeney, D. R. and J. M. Bremner. 1966. Comparison and evaluation of laboratory methods of obtaining an index of soil nitrogen availabil
ity. Agron. J. 58: 498-503.
Keeney, D. R. and J. M. Bremner. 1966. Characterization of mineraliz
able nitrogen in soils. Soil Sci. Soc. Amer. Proc. 30: 714-719.
Kresge, C. B. and.F. G. Merkle. 1957. A study of the validity of
laboratory techniques in appraising the available nitrogen producing capacity. Soil Sci. Soc. Proc. 21: 516-521.
Lathwell, D. J., H. D, Dubey and R. H. Fox. 1972. Nitrogen supplying power of some tropical soils of Puerto Rico and methods for its
evaluation. Agron. J. 64: 763-766.

85
Contribution a 1 etude do l'asote nineralisable duLiven@, J. 1959. sol. Agr. Louvain 7: 2"1-44.
Halated, S. W. 1967. The philosophy of soil testing. Pp. 13-24 in Matthias Stelly in Soil Testing and Plant Analysis part 1, Soil Testing. No. 2 in Soil Sci. Soc. Amer. special publication series. Soil Sci. Soc. Amer., Madison, Wiscoesin.
Nevo, Z., and J. Hagen. 1966. Changes occurring in soil samples during air-dry storage. Soil Science 102: 157-160.
North Carolina State University. 1973. Agronomic-Economic Research on Tropical Soils. Annual Report for 1973. Soil Science Department, North Carolina State University, Raleigh, North Carolina.
North Carolina State University. 1974. Agronomic-Economic Research on for 1974. Soil Science Department,Tropical Soils. Annual Report
North Carolina State University, RaleiEA, North Carolina.
North Carolina State University. 1975. Agronomic-Economic Research on Tropical Soiis. Annur,. leport for 1975. Soil Science Department, North Carolina State University, Raleigh, North Carolina.
Olson, R. A., M. W. Meyer, W. E. Lemke, A. D. Woltemath and R. E. Weiss. 1960. Nitrate production rate as a soil test for estimating fertilizer nitrogen requirements of cereal crops. In Transactions of
Madison, Wisconsin 11:7th International Congress of Soil Science, 463-470.
Paul, E. A. and E. L. Schmidt. 1960. Extraction of free amino acids from soil. Soil Sci. Soc. Amer. Proc. 24: 195-8.
Peterson, L. A., 0. J. Attoe, and W. B. Ogden. 1960. Correlation of nitrogen soil tests vith nitrogen uptake by the tobacco plant. Proc. Soil Sci. Soc. Amer. 24: 205-209.
Richard, T. A., 0. J. Attoe, Stanislaw Moskal, Emil Truog. 1960. A chemical method for determining available soil nitrogen. In Transactions of the 7th International Cognress of Soil Science, Soil Sci. Soc. Amer., Madison, Wisconsin 11: 28-35.
soil nitrogen index IsRobinson, J. B. D. 1968. A simple available Laboratory and greenhouse studies. J. Soil Sci. 19: 269-279.
1968. soil nitrogen index II:Robinson, J. B. D. A simple available Field crop evaluation. J. Soil Sci. 19: 280-290.
Rodriguez P., Mario S. Varietal differences in maize in the uptake of nitrogen and its translocation to the grain. Ph.D. thesis, Cornel. University, Ithaca, Now York.

86
Ross, D. J. 1966. Nitrogen mineralization in soils from WLkatone, New Zealand, in relation to their suitability for growing tobacco. Nev Zealand Journal of Agricultural Research 9: 874-885.
Russell, E. W. 1973. Soil Condition and Plant Growth. 10th edition. Longman Group, Ltd., London.
Ryan, J.A., J. L. Sims, and D. E. Peaslee. 1971. Laboratory methods for estimating plant available nitrogen in soil. Agron. J. 63: 48-50.
Sanchez, Pedro A. 1976. Properties and Management of Soils in the Tropics. John Wiley and Sons, Nev York.
Saunders, D. H., B. S. Ellis, A. Hall. 1957. Estimation of available nitrogen for advisory purposes in Southern Rhodesia. J. Soil Sci. 8: 301-312.
Smith, S. J. and G. Stanford. 1971. Evaluation of a chemical index of soil nitrogen availability. Soil Sci. 111: 228-232.
Stanford, George. 1968. Extractable organic nitrogen end nitrogen mineralization in soils. Soil Science 106: 345-351.
Stanford, George and W. H. Demar. 1969. Extraction of soil organic nitrogen by autoclaving ir water: I. The NaOH-distillable fraction as an index of nitrogen availability in soils. Soil Science 107: 203-205.
Stanford, George, and S. J. Smith. 1972. Nitrogen mineralization potentials of soils. Soil Sci. Soc. Amer. Proc. 36: 465-472.
Subbiah, B. V. and G. L. Asija. 1956. A rapid procedure for the estimation of available nitrogen in soils. Current Science d: 259-260.
Tanhane, R. V. and B. V. Subbish. 1962. Correlation of soil tests vith pot and field trials in the evaluation of soil fertility. So.A Science and Plant Nutrition 8: 5-14.
Tisdale, S. L. 1967. Problems and opportunities in soil testing. Pp. 1-12 in Matthias Stelly, ed., Soil Testing and Plant Analysis pt. 1. Soil Testing. Soil Sci. Soc. Amer., Madison, Wisconsin.
VanWambeke, Armand. 1971. Recherches sur la mise en valeur agricole des sol acides des savanes arborees du Bresil. Pedologie 21: 211-255.
Waibel', T. H. 1948. Vegetation and land use in Planalto Centra. of Brazil. Geogr. Rev. 38: 529-544.
Walmsley, D., I. T. Iyford, and I. S. Cornforth. 197.. An evaluation of soil analysis methods for nitrogen, phosphorus and potassium using banana. Trop. Ag. Trin. 48: 141-155.

87
Virig. 8. A. and J. .," 6mr. 196.. Amonia production in soil mnder vaterlogged conditions an an indez of nitrogen availability. Nature 201: 951-952.
Welch, C. D. and R. A. Viese.' 1973. Opportunities to i r*Ove soil testing progr s. Pp. 1-12 in Leo N. Walsh and Jaes D. Beaton, @4.., oil testing and plant analysis, revised edition. Soil Sl. Soc. Amr., Madison, iscoasin.
Wolf, J. M. 1975. Soil-water relitions In Oxisols from Puerto Rico and Brazil. Pp. 1 5-154 in Blmer Bornamusza and Alfredo Alvarado, oil maagemet in tropical America. Proeedings of a seminar held
at C.I.A.T., Call, Colombia, February l0-14, 197. Soil Sci. Dept., North Carolina State University, Raleigh, North Carolina.


![[THESIS AND DISSERTATION GUIDE] - Cornell Grad Schoolgradschool.cornell.edu/sites/gradschool.cornell.edu/files... · · 2014-12-19[THESIS AND DISSERTATION GUIDE] Formatting requirements,](https://static.fdocuments.us/doc/165x107/5aa6f8857f8b9aee748b7631/thesis-and-dissertation-guide-cornell-grad-thesis-and-dissertation-guide-formatting.jpg)