THESIS MANUSCRIPT
162
CHARACTERISTICS OF UNIVERSITY STUDENT LEADERS by CHRISTINE KAY ANDERSON, B.S. (Northern Illinois University) 2012 EMILY SUZANNE APITZ, B.S. (Eastern Illinois University) 2012 JENNIFER ROSE CONTERIO, B.S. (Purdue University) 2010 COLLEEN ANNE GANDOLFI, B.S. (Benedictine University) 2012 KRISTIN PAGE LAWLER, B.S. (Northern Illinois University) 2012 CARLY MARIE SMITHERMAN, B.S. (Northern Illinois University) 2012 RESEARCH MANUSCRIPT Submitted in partial fulfillment of the requirements for the degree of MASTER OF SICENCE in NUTRITION AND WELLNESS in the College of Education and Health Services, Benedictine University, Lisle, Illinois Research Advisor: Catherine Arnold, M.S., Ed.D.
-
Upload
emily-apitz -
Category
Documents
-
view
349 -
download
1
Transcript of THESIS MANUSCRIPT

CHARACTERISTICS OF UNIVERSITY STUDENT LEADERS
by
CHRISTINE KAY ANDERSON, B.S. (Northern Illinois University) 2012
EMILY SUZANNE APITZ, B.S. (Eastern Illinois University) 2012
JENNIFER ROSE CONTERIO, B.S. (Purdue University) 2010
COLLEEN ANNE GANDOLFI, B.S. (Benedictine University) 2012
KRISTIN PAGE LAWLER, B.S. (Northern Illinois University) 2012
CARLY MARIE SMITHERMAN, B.S. (Northern Illinois University) 2012
RESEARCH MANUSCRIPT
Submitted in partial fulfillment of the requirements for the degree of
MASTER OF SICENCE in NUTRITION AND WELLNESS
in the College of Education and Health Services,
Benedictine University, Lisle, Illinois
Research Advisor:
Catherine Arnold, M.S., Ed.D.
November 2013

A MIXED METHOD STUDY OF STUDENT LEADERS
RESEARCH MANUSCRIPT
by
CHRISTINE ANDERSON
EMILY APITZ
JENNIFER CONTERIO
COLLEEN GANDOLFI
KRISTIN LAWLER
CARLY SMITHERMAN
The Research Manuscript submitted has been read and approved by the Research
Advisor. It is hereby recommended that this Research Manuscript be accepted as
fulfilling part of the Master of Science in Nutrition and Wellness graduate degree in the
College of Education and Health Services at Benedictine University, Lisle, Illinois:
_________________________________ ___________________________________Signature of Catherine Arnold, M.S., Signature of Karen Plawecki, M.S., Ph.D. Ed.D. Director, M.S. in Nutrition and WellnessResearch Advisor APPROVED FOR BINDING
___________________________________Signature of Catherine Arnold, M.S., Ed.D.Chairperson, Nutrition DepartmentAPPROVED COMPLETION OF RESEARCH REQUIREMENT
___________________________________Signature of Alan Gorr, Ph.D., M.P.H.Dean, College of Education and HealthServices
_________________________________ December, 2013 __Date of Oral Defense Intended Graduation Date (Month, Year)
ii

I authorize Benedictine University, 5700 College Road, Lisle, IL 60532, to lend this
Research Report, or reproductions of it, in total or in part, at the request of other
institutions or individuals for the purpose of scholarly research.
________________________________ Student Name (Print)_______________
_________________________________Student Signature and Date___________
________________________________Student Name (Print)_______________
________________________________Student Name (Print) __________ ________________________________Student Name (Print)_______________
________________________________Student Name (Print)_______________
________________________________Student Name (Print)_______________
________________________________Research Advisor Name (Print)_______
________________________________Student Signature and Date__________
________________________________Student Signature and Date__________
________________________________Student Signature and Date__________
________________________________Student Signature and Date__________
________________________________Student Signature and Date__________
________________________________Research Advisor Signature and Date__
iii

© Copyright by
Christine Kay Anderson, Emily Suzanne Apitz, Jennifer Rose Conterio, Colleen Anne Gandolfi, Kristin Page Lawler, Carly Marie Smitherman
2013: All Rights Reserved
iv

TABLE OF CONTENTS
Page
LIST OF TABLES viii
LIST OF FIGURES x
ACKNOWLEDGEMENTS xi
STRUCTURED RESEARCH ABSTRACT xii
CHAPTER 1: INTRODUCTION 1Context of the Study 1Purpose and Research Question 3Methods 4Definition of Terms 4Hypotheses 6
CHAPTER 2: LITERATURE REVIEW 9Leadership Theories by Jennifer Conterio 9Leadership & Volunteerism by Christine Anderson 11Family Dynamics/Environment & Leadership by Colleen Gandolfi 13Leadership & Religious Affiliation by Emily Apitz 18Self-efficacy & Leadership by Carly Smitherman 20Gender & Leadership by Kristin Lawler 24
CHAPTER 3: METHODOLOGY 27Research Study Design 27Participants 27Data Collection Methodology 28Measurement Tools 29Statistical Procedures 41
CHAPTER 4: FINDINGS: IN-CLASS SURVEYS 42Outliers Treatment of the Data 42Descriptive Profile of Participants 42Leadership & Gender (Hₒ1) by Kristin Lawler 44Leadership & Gender (Hₒ2) by Kristin Lawler 47Leadership & Gender (Hₒ3) by Kristin Lawler 47Leadership & Gender (Hₒ4) by Kristin Lawler 47Leadership & Gender (Hₒ5) by Kristin Lawler 47Leadership & Gender (Hₒ6) by Kristin Lawler 47Leadership & Gender (Hₒ7) by Kristin Lawler 48Leadership & Gender (Hₒ8) by Kristin Lawler 48
v

Leadership & Gender (Hₒ9) by Kristin Lawler 48Leadership & Gender (Hₒ10) by Kristin Lawler 48Leadership & Gender (Hₒ11) by Kristin Lawler 49Leadership & Gender (Hₒ12) by Kristin Lawler 50Leadership & Gender (Hₒ13) by Kristin Lawler 50Leadership & Gender (Hₒ14) by Kristin Lawler 51Leadership & Family (Hₒ15) by Colleen Gandolfi 52Leadership & Family (Hₒ16) by Colleen Gandolfi 54Leadership & Religion (Hₒ17) by Emily Apitz 56Leadership & Religion (Hₒ18) by Emily Apitz 58Leadership & Volunteerism (Hₒ19) by Christine Anderson 59Leadership & Volunteerism (Hₒ20) by Christine Anderson 60Leadership & Volunteerism (Hₒ21) by Christine Anderson 63Leadership & Volunteerism (Hₒ22) by Christine Anderson 64Leadership & Volunteerism (Hₒ23) by Christine Anderson 64Leadership & Volunteerism (Hₒ24) by Christine Anderson 64Leadership & Volunteerism (Hₒ25) by Christine Anderson 65Leadership & Leadership Styles (Hₒ26) by Jennifer Conterio 65Leadership & Leadership Styles (Hₒ27) by Jennifer Conterio 67Leadership & Leadership Styles (Hₒ28) by Jennifer Conterio 67Leadership & Leadership Styles (Hₒ29) by Jennifer Conterio 70Leadership & Leadership Styles (Hₒ30) by Jennifer Conterio 71Leadership & Leadership Styles (Hₒ31) by Jennifer Conterio 73Leadership & Leadership Styles (Hₒ32) by Jennifer Conterio 75Leadership & Leadership Styles (Hₒ33) by Jennifer Conterio 77Leadership & Self-efficacy (Hₒ34) by Carly Smitherman 81Leadership & Self-efficacy (Hₒ35) by Carly Smitherman 83Leadership & Self-efficacy (Hₒ36) by Carly Smitherman 84Leadership & Self-efficacy (Hₒ37) by Carly Smitherman 84Leadership & Self-efficacy (Hₒ38) by Carly Smitherman 85Leadership & Self-efficacy (Hₒ39) by Carly Smitherman 85Leadership & Self-efficacy (Hₒ40) by Carly Smitherman 85
CHAPTER 5: DISCUSSION 87Conclusions 87Applications 87Generalizability 89Limitations 89Recommendations 90
REFERENCES 91
APPENDIX A:Permission to use Leadership Self-Efficacy Scale 93APPENDIX B:Leadership Survey plus SLPI (Pretest) 94APPENDIX C:Leadership Survey plus SLPI (Posttest) 97
vi

APPENDIX D:Interview lead and follow-up questions 98APPENDIX E: Letter of Consent 99
vii

LIST OF TABLES
Table Page
1. Impact of Others……………………………………………………........ 30
2. Total Variance Explained……………………………………………….. 30
3. Rotated Component Matrix……………………………………………... 31
4. Cronbach’s Alpha……………………………………………………….. 31
5. Cronbach’s Alpha……………………………………………………….. 32
6. Reliability Statistics……………………………………………………… 32
7. Impact of Participation Before College………………………………….. 33
8. Total Variance Explained………………………………………………... 33
9. Rotated Component Matrix……………………………………………… 34
10. Reliability Statistics……………………………………………………… 35
11. Reliability Statistics……………………………………………………… 35
12. Impact of Previous & Current Experience……………………………….. 36
13. Total Variance Explained………………………………………………… 37
14. Rotated Component Matrix………………………………………………. 39
15. Reliability Statistics………………………………………………………. 39
16. Reliability Statistics………………………………………………………. 40
17. Gender Descriptives………………………………………………………. 43
18. SLPI Results between Males and Females………………………………... 45
19. Independent t-Test between Males and Females…………………………. 46
20. Leadership Self-efficacy Survey of Males and Females………………….. 49
21. Independent t-Test of Leadership Survey between Males and Females….. 49
22. Pearson Correlation-Mother/Father Education and SLPI………………… 53
23. Pearson Correlation-Family Influence and SLPI…………………………. 54
viii

24. Information from Interviews……………………………………………… 56
25. Pearson Correlation-Attendance of Religious Services and Pre-Test SLPI. 57
26. Pearson Correlation-Prayer/Meditation and Pre-Test SLPI………………. 58
27. Spearman-rho-Prayer/Meditation and Pre-Test SLPI…………………...... 59
28. Pearson Correlation-Before College Community Service/Events………... 59
29. Pearson Correlation-Before College and In College…………………….... 61
30. Correlations-SLPI…………………………………………………………. 66
31. Pearson Correlation-Leadership and SLPI………………………………... 68
32. Descriptive Statistics-GPA and SLPI……………………………………... 72
33. Grand Mean……………………………………………………………….. 72
34. Multivariate Tests………………………………………………………… 73
35. Paired Samples Statistics…………………………………………………. 74
36. Paired Samples t-Test……………………………………………………... 74
37. Paired Samples Statistics Male…………………………………………..... 76
38. Paired Samples Test Male………………………………………………… 76
39. Paired Samples Statistics Female…………………………………………. 78
40. Paired Samples Test Female……………………………………………… 79
41. Independent Sample Test-Variance……………………………………….. 82
42. Independent Sample Test-Comparison of Experimental and Match Group. 83
43. Pearson Correlation-Self-Efficacy and Age………………………………. 84
44. Pearson Correlation-Self-Efficacy Posttest and Age……………………... 84
45. Pearson Correlation-Pre and Posttest Self-Efficacy……………………… 85
46. Paired Samples Test-Pre and Posttest Self-Efficacy……………………… 86
LIST OF FIGURES
ix

Figure Page
1. Gender……………………………………………………………………. 43
2. Ethnicity…………………………………………………………………... 44
3. Mother Education Level…………………………………………………... 51
4. Father Education Level……………………………………………………. 52
5. Model the Way…………………………………………………………….. 80
6. Challenge the Process……………………………………………………… 81
ACKNOWLEDGMENTS
x

ABSTRACT OF THE RESEARCH MANUSCRIPTA Mixed Method Study of Student Learners
ByChristine Kay Anderson
Emily Suzanne ApitzJennifer Rose ConterioColleen Anne Gandolfi
Kristin Page LawlerCarly Marie Smitherman
Master of Science in Nutrition and WellnessBenedictine University, Lisle, Illinois
November 2013 Research Advisor: Catherine Arnold
Objectives: To determine the qualities present in student leaders at a Midwestern
university and also the factors and traits that contribute to a person becoming a leader.
Design: A mixed method design using both quantitative and qualitative data was used.
Measures: Quantitative data was gathered using the Student Leadership Practice
Inventory (SLPI) and supplemental surveys. Analysis of the pretest and posttest SLPI
scores and self-efficacy were examined using SPSS. The qualitative data was gathered
through pair interviews examining multiple aspects of leadership.
Subjects: Forty-two undergraduate students identified as student leaders from a
Midwestern university were analyzed (24 females, 18 males).
Statistical Analysis: Pearson Correlations were calculated to determine correlations
between SLPI scores and factors such as family influence, religion, volunteerism and
self-efficacy. When comparing means between genders, between pre-test and posttest
SLPI scores and between experimental and match leadership groups, t-tests were used. A
Spearman rho correlation was calculated to determine the relationship between aspects of
religion and SLPI scores. A one-way MANOVA was calculated to determine the effect of
GPA on pre-test SLPI scores.
Results: Data collected showed that females were significantly higher than males in the
ability to, “enable others to act” and “modeling the way” (t(41) = 1.26, p = .02, d = .20.
No significance was found between parent education level or family influence on SLPI
responses. However, qualitative results support the role of family in leadership
xi

development. There was a significant correlation found between frequency of attending
religious services and SLPI and for pray/meditation and SLPI. Significant correlations
were found between volunteerism before college and event participation before college.
Significant correlations were found between participation in external organizations,
events, college volunteerism and leadership. Community service before college had a
significant correlation with SLPI scores, and the leadership training program had a
significant effect on SLPI scores for “model the way” and “challenge the process”. There
was no significance between experimental and match groups in self-efficacy
characteristics. There was also no significance between self-efficacy pre and posttest
scores and age or pre and posttest self-efficacy characteristic scores.
Conclusions: Gender, religion and volunteerism appear to be major factors in
identifying leadership qualities and in determining who will become leaders. Further
research is needed, but these findings could play an important role in choosing students
for graduate programs as well as dietetic internship programs.
xii

xiii

CHAPTER 1
INTRODUCTION
Context of the Study
The question of whether leaders are born or made has been assessed ten times
over by researchers and scientists alike. Originally, it was believed that individuals were
born with certain innate characteristics or traits favorable for leadership and that these
individuals would become successful leaders (1). Although the answer to this question is
still not definitive, a great deal has been discovered about specific traits and
characteristics that may be learned by individuals to become leaders and the factors that
contribute to leadership development (2, 3). The idea that leadership is a learnable skill
creates the possibility for anyone to obtain these traits and characteristics, opposed to a
select few leaders who are "born that way" (1). However, having these traits does not
automatically make someone a leader. It is known that one must make decisions and take
certain actions throughout their life in order to become an effective leader (2, 3).
There are various factors, or themes, associated with leadership discussed
throughout the length of this report. Prominent leadership theories, volunteerism, family
dynamics/environment, religious affiliation, self-efficacy, and gender play a role in
leadership development and therefore were included in the research for this study. This
study was meant to provide the research team with valuable information regarding
student leaders and how these specific themes contributed to their personal decisions to
lead.
Two main leadership theories were common amongst the literature; constructive
developmental theory and transformational leadership theory. These theories help us to
understand the processes involved in leadership development along with the
characteristics favorable for leadership, essentially providing a framework for success.
Leaders exhibit characteristics such as being proactive, being innovative, and being a
visionary. Volunteerism and leadership often go hand in hand. For many leaders,
1

volunteering allows them to utilize these characteristics in a way that not only benefits
themselves, but others as well. Family upbringing (including parental morals/values,
parental leadership styles, parental support, family conflict) and the social environment
one grows up in (socioeconomic status, parental support, parental conflict) have been
known to shape multiple aspects of an individual as well as influence their motivation to
lead and their leadership style. Religious affiliation is often an important characteristic
for many people. Religion and religious beliefs can be influential in the way one lives,
including their decision to lead. Self-efficacy strongly correlates with leadership as seen
in multiple studies. Further investigations regarding leadership and self-efficacy will
continue to divulge how the skills and attributes of one, impact the other. Gender
stereotypes have previously idealized males as a stronger leader than females and the
percentage of current female managers is shockingly low. Characteristics of feminine
personalities are associated with traits necessary for a transformational leader and
evidence that transformational leadership is effective in the management world continues
to accumulate.
The concept of higher education institutions and their role in developing socially
responsible leaders began gaining much attention in the early 1990's (3). Since then,
campus leadership practices have expanded from approximately 700 leadership
programs existing on college campuses to over 1,000 programs nationally today (3).
Research suggests that throughout colligate years, students are capable of, and often do,
hone their leadership skills (3). In fact, the findings from a national study conducted by
Dugan and Komives demonstrated that college experiences accounted for 7% to 14% of
the overall variance in leadership outcomes (3). Many factors are thought to contribute to
this phenomenon. Environmental factors such as living away from home, student-student
interactions, student-faculty interaction, campus involvement, intramural sports,
volunteer work, acting as a tutor, group projects, and class presentations are all thought to
positively impact leadership development (2). Background factors such as age, sex, grade
point average, and personality factors such as intelligence, self-efficacy, extroversion,
and self-confidence are also influential elements for student leadership development (2).
Colleges and universities aim to provide students with a variety of learning and service
opportunities in order to enhance their leadership abilities and qualities (1).
2

Dugan and Komives thoroughly examined the factors associated with leadership
development in college students using a multi-institutional national study involving 55
universities and over 165,000 students (3). One aspect of this study was to examine how
students' perceptions on leadership changed over time. The students' perceptions of
leadership positively increased for consciousness of self, congruence, collaboration,
common purpose, citizenship, change, and leadership efficacy; with the greatest
magnitudes of change being consciousness of self and leadership efficacy (3). Although
these changes occurred during the college years, it is difficult to say whether these
changes were the result of the college environment or other influences. This study also
assessed the role and degree to which demographics, pre-college experiences, and college
experiences such as mentoring, campus involvement, acts of service, holding positional
leadership roles, and formal leadership programs have on leadership development (3).
From this study, it was determined that short, moderate, and long-term leadership training
experiences all had significant effects on leadership efficacy (in comparison with no
training) (3).
Purpose and Research Question
Research has shown that leadership characteristics and traits are becoming
increasingly important for an individual to possess. The National Association of Colleges
and Employers’ Job Outlook 2012 survey, as cited in the IRB, noted that nearly 80
percent of respondents “search for evidence that the potential employee can work in a
team", and more than three-quarters indicated they "want the résumé to show the
candidate has leadership abilities.” Our study will be able to determine which qualities
are present in students currently identified as leaders by our university. Using the data
obtained, we may then be able to promote the development of leadership in
nutrition/dietetics students, as well as students of other fields. The purpose or goal of our
study is to explore the primary guiding question:
o How do university students develop as leaders?
Additionally, we will explore numerous variables that may impact development
and current leadership scores of the student leaders, to answer questions such as:
o Do males and females differ? Do leaders differ across other demographic
characteristics?
3

o Is there a relationship between self-efficacy and leadership?
o Is there a connection between campus involvement, volunteerism, and
leadership?
o Can past involvement activities (or pre-college participation in clubs, teams,
or activities), volunteerism, and/or leadership experiences predict leadership
attributes and/or leadership self-efficacy?
o What are common experiences prior to college that influence leadership?
o What is the influence of family or faith on leadership?
Methods
Our experimental group was comprised of current students from the selected
Midwestern University identified as leaders who participated in a leadership- training
program in April 2013 by invitation from the university's Director of Student
Engagement and Leadership. This leadership program targets the development of
leadership skills measured on the Student Leadership Practice Inventory (SLPI), and was
delivered by this director. Current university students identified as leaders who were not
participating in a leadership training program in April were the match group.
There was two types of data analyzed, qualitative and quantitative data.
Quantitative data was gathered using the Student Leadership Practice Inventory and
supplemental surveys. Analysis of the pretest and posttest SLPI scores and self-efficacy
were examined using SPSS.
The qualitative method used in our research was pair interviewing. This
qualitative method was used to gain a better understanding of participant's experiences in
life and why they chose to become a leader. Pair interviewing was used for increased
validity and word credibility. Interviews were also voice recorded by the interviewing
pair, or graduate students. Data was gathered encompassing multiple aspects of
leadership and comparison of data and methods was performed at several intervals during
data collection.
Definition of Terms
Several terms used throughout the study are described here so that the reader will
understand topics being referenced. The terms and their definitions are listed below.
4

Leadership:"the ability to inspire and guide others toward building and achieving
a shared vision. Association leaders shall model the way with a mindset for
transformation, innovation, invention, adaptability, empowerment and risk-taking. This
leadership mindset will enable the Association and its members to embark on a path
toward a successful future"(The Academy of Nutrition and Dietetics).
Leadership Program:"college-sponsored experience with student participants who
attend in order to learn about and develop individual leadership traits and characteristics"
Transformation leadership: "leadership by empowerment. Comprised of four
components consisting of idealized influence, inspirational motivation, intellectual
stimulation, and individualized consideration" (Walumbwa 2011, Zacharatos, 2000).
Leadership Role Occupancy: "the extent to which individuals have occupied or
are now occupying positions of formal leadership in organizational settings" (Zhang,
2009).
Socioeconomic Status (SES): "describes an individual's or a family’s ranking on
hierarchy according to access or control over a combination of valued commodities such
as wealth, power, and social status. This also serves as an overall measure of the level of
possible resources available to adolescents when they grow up" (Zhang, 2009).
Family Environments: "include the level of financial resources and the parental
support offered via emotional understanding, family involvement in the individual's
activities, and financial funding of interests of the individual" (Zhang, 2009).
Social Environments: "include neighborhood, school, peers, safety, and
availability of leadership programs and involvement opportunities" (Zhang, 2009).
Enriched Environments: "having a higher family socioeconomic status, higher
perceived parental support, and lower perceived conflict with parents or social
environments" (Zhang, 2009).
Inspirational Motivation: "the ability to inspire and motivate others to
demonstrate appropriate behavior" (Sahgal, 2007).
Supportive Parenting: "providing careful attention, guidance, and support which
instills and sets the foundation in children that they can be special and feel valued"
(Sahgal, 2007).
5

Self-efficacy: "defined as the belief in oneself to have the personal capabilities
and resources to meet the demands to perform specific tasks" (McCormick 2002).
Occupational self-efficacy: "reflects the belief of a person that he/she can execute
behaviors relevant to complete their own work" (Schyns 2010).
Gender: "male or female based on possession of male or female reproductive
organs"
Fortune 500 company: "yearly list of the largest 500 industrial companies in the
U.S
“Manager, Leader, and Boss will be used interchangeably in this report"
Hypotheses
Hₒ1: There is no significant difference between self-reported skills of “modeling the
way” between males and females based on the SLPI.
Hₒ2: There is no significant difference between self-reported skills of “inspiring a shared
vision” between males and females based on the SLPI.
Hₒ3: There is no significant difference between self-reported skills of “challenging the
process” between males and females based on the SLPI.
Hₒ4: There is no significant difference between self-reported skills of “enabling others to
act” between males and females based on the SLPI.
Hₒ5: There is no significant difference between self-reported skills of “encouraging the
heart” between males and females based on the SLPI.
Hₒ6: There is no difference between the percentile score for “modeling the way” between
males and females.
Hₒ7: There is no difference between the percentile score for “inspiring a shared vision”
between males and females.
Hₒ8: There is no difference between the percentile scores for “challenging the process”
between males and females.
Hₒ9: There is no difference between the percentile scores for “enabling others to act”
between males and females.
Hₒ10: There is no difference between the percentile scores for “encouraging the heart”
between males and females.
6

Hₒ11: There is no difference between the self-efficacy levels of ability to perform
managerial leadership tasks reported between males and females.
Hₒ12: There is no difference between the self-efficacy levels of the ability to perform
charismatic leadership tasks reported between males and females.
Hₒ13: There is no difference between the self-efficacy levels of the ability to perform
leadership tasks that require taking action reported by males and females.
Hₒ14: There is no difference between the self-efficacy levels of the ability to perform
personalization leadership tasks reported by males and females.
Hₒ15: Mother and father education level is not related to the ability to “model the way”,
“inspire a shared vision”, “challenge the process”, “enable others to act”, or
“encourage the heart” in terms of leadership.
Hₒ16: Family influence is not related to the ability to “model the way”, “inspire a shared
vision”, “challenge the process”, “enable others to act”, or “encourage the heart” in
terms of leadership.
Ho17: Attending religious services is not related to the ability to “model the way”,
“inspire a shared vision”, “challenge the process”, “enable others to act”, or
“encourage the heart” in terms of leadership.
Ho18: Participating in prayer and/or meditation is not related to the ability to “model the
way”, “inspire a shared vision”, “challenge the process”, “enable others to act”, or
“encourage the heart” in terms of leadership.
Ho19: There is no relationship between community service participation before college
and event participation before college.
Ho20: There is no relationship between community service participation in elementary
school and participation in college sports.
Ho21: There is no relationship between participation in external organizations in college
and participation in community service before college.
Ho22: There is no relationship between participation in external organizations in college
and community leadership in college.
Ho23: There is no relationship between participation in events (sports/activism) before
college and participation in college sports.
7

Ho24: There is no relationship between school-related community service and
community leadership in college.
Ho25: There is no relationship between school-related community service and
community leadership before college.
Hₒ26: There is no relationship between participating in community service activities
prior to college and SLPI response scores.
Hₒ27: There is no relationship between participating in sporting/activism events prior to
college and SLPI response scores.
Hₒ28: There is no relationship between frequency of seeking out leadership opportunities
and SLPI response scores.
Hₒ29: There is no relationship between frequency of acting as a group leader and SLPI
response scores.
Hₒ30: Individuals’ GPA does not have any effect on SLPI scores.
Hₒ31: The leadership training program will have no effect on pre-test to posttest SLPI
scores.
Hₒ32: The leadership training program will have no effect on pre-test to posttest SLPI
scores in males.
Hₒ33: The leadership training program will have no effect on pre-test to posttest SLPI
scores in females.
Hₒ34: There is no difference between Group 111 (experimental group) and Group 222
(match group) and self-efficacy scores.
Hₒ35: There is no relationship between the self-efficacy pre-test scores and age.
Hₒ36: There is no relationship between the self-efficacy posttest scores and age.
Hₒ37: There is no difference between the pre and posttest scores for SE1:
managerial/administrative in relation to leadership.
Hₒ38: There is no difference between the pre and posttest scores for SE2: charisma in
relation to leadership.
Hₒ39: There is no difference between the pre and posttest scores for SE3:taking action in
relation to leadership.
Hₒ40: There is no difference between the pre and posttest scores for SE4:personalization
in relation to leadership.
8

CHAPTER 2
LITERATURE REVIEW
Leadership Theories
As the definition of leadership continues to develop and change over time, so do
the theories and models used to describe and categorize leadership behaviors and
processes (4). The Academy of Nutrition and Dietetics defines leadership as, "the ability
to inspire and guide others toward building and achieving a shared vision. Association
leaders shall model the way with a mindset for transformation, innovation, invention,
adaptability, empowerment and risk-taking. This leadership mindset will enable the
Association and its members to embark on a path toward a successful future" (5). While
this definition provides ideal leadership characteristics, it does not identify the leadership
processes used to provide this end result. When looking at the literature, the amount on
leadership alone seems to be unlimited while leadership as it relates to the field of
dietetics is minimal. Through our extensive research, we were able to find two main
leadership theories that seem to be the most prominent within the dietetics profession;
Constructive Developmental Theory and Transformational Theory (4, 5, 6, 7).
Constructive Developmental Theory
Constructive developmental theory focuses on the mindset of the individual, not
specific traits or characteristics of the individual. Constructive developmental theorists
believe that "persons move through qualitatively different ways of knowing who they are,
how the world works, and how they know what they know" and that "leaders as
individuals develop over the life course and do so in predictable ways" (6). The origin of
the constructive developmental theory is Jean Piaget's theory of cognitive development
(6). The process of how human beings "come to know" and the stages of mental growth
we travel through acquiring this ability of "abstract symbolic reasoning" is what this
theory is centered upon (6). Human development is both horizontal and vertical (6).
Horizontal growth is what we see most in adults and consists of learning new skills, new
9

methods, new facts, or pursuing advanced degrees (6). A person may grow horizontally
in knowledge acquisition, while their vertical development remains the same (6). Vertical
growth focuses on how people tend to reason and behave in response to their experiences.
Vertical development is illustrated as a spiral of developmental stages. An individual
lives through the earlier stages before progressing to the later stages and once one has
journeyed through a stage, it becomes part of that individual (6). However, most humans
do not grow through the entire spiral and will settle in the stage that is most comfortable
for them (6). Developmental psychologists agree that the stage of vertical development is
what differentiates leaders, rather than their personality or philosophy of leadership (6).
The stages of vertical development can better be described as Action Logics. The Action
Logics model is separated into three tiers, pre-conventional, conventional, and post-
conventional. The pre-conventional tier contains the earlier stages of change and the post-
conventional tier contains the later stages of change (6). In the field of dietetics,
individuals in the later post-conventional stages can provide proficient leadership to the
profession and serve as leadership mentors (6). Conventional leadership theory can
identify the stage of vertical development in leaders within the profession to help to
understand the factors that contribute to the movement from one stage to the next (6).
Transformational Theory
New leadership theories have begun to emerge within the last decade,
transformational theory being one of them. Transformational leadership does not replace
the well-known theory of transactional leadership, but enhances it (5). The characteristics
of a transformational leader are described as one who is inspiring, energetic, is
enthusiastic in nature, has a vision, and is passionate (4, 5, 7, 8). Charisma is another
known trait of a transformational leader. However, a charismatic leader is not always
transformational as they may not place emphasis on the development of their followers.
A transformational leader supports the development of self-reliance with the main goal of
transforming their followers and the organization itself (8). Avolio and Bass described
the skills of a transformational leader as the four I's: idealized influence, inspirational
motivation, intellectual stimulation, and individualized consideration (8). Idealized
influence represents the followers' confidence and appreciation which is necessary for the
acceptance of changes within the organization (8). Inspirational motivation is the ability
10

to inspire and motivate followers to demonstrate appropriate behaviors (8). Intellectual
stimulation is the process of stretching the followers' competencies in order to drive
change in their way of thinking about issues and their performance (8). Individualized
consideration is the leader's ability to observe, analyze and predict the needs and wishes
of followers (8). Although there is not much literature on leadership relating to the field
of dietetics, the existing literature shows that dietetic students as well as registered
dietitians exhibit many qualities of a transformational leader (4, 5, 7).
Leadership & Volunteerism
Volunteerism is a trait exhibited by many leaders. It is thought to be an important
factor both in determining what makes a good leader, and also in determining the types of
individuals who will take on leadership roles at some point in their lives. Many factors
can contribute to a person’s decision to become a volunteer, including their familial
influence, their religion, and the culture in which they live. It is important to note that
these factors are often introduced during childhood or adolescence and will continue to
influence a person throughout their entire life. Another thing that might influence a
person’s decision to become a volunteer is school. Many colleges and universities are
now requiring their applicants to have some volunteer experience to even be considered
for admission. A further look into some of these factors can help identify what leads to
volunteerism and how it is related to leadership.
Family Influence and Youth Volunteerism
Many studies have been done to help determine why a person makes the decision
to become a volunteer. According to studies conducted by Dunham et al., many people
who become volunteers were raised in a household where one or both parents were
volunteers. Therefore, the parents served as role models for youth volunteerism.
Oftentimes, these parents would participate in volunteer activities with their children.
This taught them at a young age to become community oriented (9, 10).
Many children and adolescents are involved in groups such as 4-H. Children who
are involved with these types of groups at a young age are more likely to take on
leadership roles and are more likely to be involved in volunteer activities as they move
into adulthood (11).
Religion and Culture
11

Cultural beliefs are often based on religion, and both are linked to volunteerism.
Some cultures are more egocentric, whereas others are more altruistic. Cultures that focus
more on the society as a whole tend to have ideals that are more in line with those seen in
volunteerism (12). People who are members of an organized religion are more likely to
become volunteers than people who are not affiliated with a religion. An article from
Louis Penner states that 80% of people who were organized religion members
participated in volunteer activities, while only 62% of people who were not members of a
particular religion participated in volunteer activities. Another interesting finding in this
study was that volunteers scored higher on a religiosity measure than non-volunteers,
meaning they considered themselves to be more religious.
Religion was also significantly correlated with other factors, such as the number
of organizations they volunteered for and also the length of time they spent volunteering
for these organizations. The higher a person scored on the religiosity measure, the more
organizations they tended to be involved with and the more time they spent at these
organizations. Religion, although not the focus of this particular study, showed the
strongest correlation with volunteer activities when compared with factors like
personality or socio-economic status. Therefore, it is noted that religion should continue
to be looked at in future studies involving volunteerism (13).
Demographics of Volunteers
According to the Bureau of Labor Statistics from 2012, there was little change in
the total number of volunteers for the year. Women continue to volunteer more than men
(29.5% vs. 23.2%) and this was true for all ages, levels of education, and other
demographics. The age group that is most likely to volunteer is the 35-44 year old group.
The group with the lowest volunteer rates was the 20-24 year old group. Also, after age
45, the volunteer rate began to taper off. When looking at race, whites volunteer at a rate
higher than blacks, Hispanics, and Asians, with little change in the rates of each group
over the year. Also interesting to note was that married people tend to volunteer at a
higher rate than those of other marital statuses (14).
Motivation
People tend to have particular motivators that play a role in their decision to
volunteer. A study by Clary and Snyder explored different motivators people have, and
12

how these motivators can impact the length of volunteerism. They broke it down into six
“functions” served by volunteering: values, understanding, enhancement, career, social
and protective. Some of these are based on the desire to help oneself, and some are based
on the selfless desire to help others. Based on responses to a survey asking people to
indicate their personal motivators, the researchers discovered that most people’s
motivators for volunteerism are multifaceted. People want to do something to help others,
but at the same time may be required to volunteer for school or may use it as an escape
from their own troubles. With this in mind, it is important for recruiters to target their
messages to people whose motivators are in line with the nature of the volunteer work.
The researchers also found that college students who felt that their volunteer work
fulfilled a particular motivation or function were more likely to continue volunteering
(15).
The Organization
The organization itself plays an important role in volunteerism. First of all, the
majority of volunteers are part of an organization. It is far less common for individuals
outside of an organization to engage in volunteerism that is sustained for a significant
amount of time. It is thought that as many as 85% of volunteers are part of an
organization, so how the organization is run has a huge impact on determining if and for
how long they will have volunteers (12). The recruitment process is only the beginning.
Motivators and functions, which were previously mentioned, are not concrete. They may
change over time, and an organization needs to be aware of this in order to maintain its
volunteers. It is also important for the organization to continuously encourage its
volunteers and to remind them that the goal of volunteerism is to better society as a whole
(16).
Family Dynamics/Environment & Leadership
Family structure and dynamics have been shown to shape the way a child grows
and matures throughout his or her life. However, do family dynamics and upbringing
specifically influence the child’s leadership skills or lack thereof? Several studies have
been conducted to address this issue by examining leadership skills as related to family
environment vs. genetic influences, the influence of parent’s leadership skills on the
child’s motivation to lead, and the influence of life experiences in shaping leaders today.
13

The first study conducted by Zhang et al., addresses the controversial question
surrounding the nature of genetic influences on leadership and whether the genetic effects
establish constraints on the effectiveness of leadership development efforts in
organizations and in earlier life. Specifically, it examines whether the heritability of
leadership at work is moderated by individuals’ developmental environment in
adolescence (17).
The study presented two distinct conceptual, yet opposite, arguments for the
moderating effects of the social environment on leadership. First, a more enriched
environment would allow greater influence of genetic differences in leadership capacity,
thus strengthening the heritability of leadership emergence. The second argument is
based on the leadership theory that links overcoming adversity and crises to leadership
emergence. Therefore, a more impoverished social environment, like those involving
interpersonal conflict, would allow the greater influences of genetic differences in
leadership capabilities.
The study examined three family social environmental variables; the first being
family socioeconomic status (SES) including wealth, power, and social status. Second
was perceived parental support (PPS), and last was perceived conflict with parents (PCP).
The subjects were male twins who completed three different surveys including a
background questionnaire, a parental environmental questionnaire, and a leadership
survey (17).
The study reported that the presence of adversity and conflict facilitates the
greater influence of genetic leadership potential. This is also true of individuals from low
SES families. Therefore, “leadership genes” that one is born with, will have a greater
influence on one’s leadership potential in an environment of low SES, negative parental
support, and greater parental conflict. The flip side of this result was also true in that
environments characterized by higher SES, higher levels of perceived parental support,
and lower perceived conflict with parents were associated with a lower heritability of
leadership role occupancy (17).
The study showed that the family economic and social environments experienced
by adolescents have important effects on the magnitude of genetic influences on
leadership exhibited later in life. When an individual came from a family with higher
14
SES, higher parental support or lower conflict with parents, his/her opportunities of
becoming a leader in the workplace were determined more by environmental factors
rather than genetic factors. Therefore, even those born without the “leadership genes”
have the opportunity to become leaders by experiencing an enriched family environment
during their adolescent years (17).
The next study conducted by Hartman et al. examined how parental influence
may shape the leadership process. The study emphasized the ideas offered by behavioral
modeling which suggests that children have the opportunity to observe their parents’
leadership style and adopt the style demonstrated by an admired parent, but reacts against
a parent who is not admired.
The study utilized 195 college students majoring in business administration from
two universities. Each completed the Leadership Behavior Description Questionnaire to
describe their management style. They then completed the same questionnaire to describe
their perceptions of the management style used by a nominated person as an important
early influence (i.e. parent). Finally, the nominated person (i.e. parent) completed the
questionnaire. Correlations among the completed questionnaires were examined. The
researchers hypothesized that students’ reported leadership styles will be positively
correlated with both their perceptions of the parents’ leadership styles and with their
parents’ self-reports of their styles. It was also hypothesized that the students’ perceptions
of their parents’ style will be more closely related to the students’ style than will parents’
self-reports of their own styles (18).
Correlations were positive, indicating that students’ scores were similar to
parents’ scores, supporting the first hypothesis. Correlations were higher between
parents’ perceived scores and students’ scores than between parents’ reported scores and
student’s scores, which supports the second hypothesis. Therefore, the results indicated
that parents’ leadership styles, especially their styles as perceived by their children, were
related to their children’s leadership styles. This suggested that the students learned at
least some aspects of leadership from their parents early in life (18).
A study conducted by Sahgal et al. used a developmental approach to examine the
life experiences that have shaped the lives of leaders who have successfully transformed
organizations. The study attempted to answer these questions: How do leaders develop?
15

Do life experiences or specific events/circumstances make a leader? What are leaders’
self-perceptions and the drivers for their success? (8).
The group consisted of 10 Indian leaders serving in various leadership positions.
Each individual was interviewed and an analysis of the qualitative data was conducted
and classified into nine broad areas (four of these areas being family related, including
supportive parenting, inspiration of the father, relentless pursuit of values, and rising
above adversity) (8).
For supportive parenting, the subject leader received encouragement and positive
reinforcement from parents and significant family members. There was relatively low
direction on achievement of long-term career goals and greater emphasis on family
values and discipline that seemed to have a lasting impact. There was a focus on building
inner strength and confidence. The warmth and support extended by family members
helped in developing respect for elders, tolerance and adaptability. The subjects did not
experience any family pressure to achieve academic excellence or a particular career path
(8).
Most of the subjects stated that their fathers played a key role in their upbringing
and the formation of their core values and principles. While the subjects closely held
humanistic values that had been ingrained in them either by their father or other family
members, there were other instances where early life experiences and hardships also
contributed to their code of values. The respondents shared early personal limitations
such as having to compete with others who were more educated than themselves, coping
with their village/small town background, overcoming family financial constraints, and
facing the trauma of losing loved ones early in life. The leaders were able to withstand
the pressures because of their inherent confidence, unwillingness to compromise with
injustice, and their belief in the value of hard work. All of these values they learned
through early personal experiences at home and contribute to the theme of rising above
adversity. This study concluded that life experiences play a significant role in the
development of leadership (8).
The aim of the study conducted by Zacharatos et al. was to further the
understanding of the development of leadership, transformational leadership in particular,
in children. It was the first stage of a research program to develop an understanding of the
16

origin, development, and emergence of adult leadership behavior. The hypothesis was
that adolescents perceive the extent to which their parents exhibit transformational
behaviors (namely, inspirational motivation, idealized influence, intellectual stimulation
and individualized consideration) during parent-child interactions and adopt similar styles
themselves (19).
To test their hypothesis, the study focused on the leadership behaviors exhibited
by adolescents while participating on sports teams, which provided a naturalistic setting
for examining leadership behaviors. The subjects consisted of 112 athletes who
completed the Multifactor Leadership Questionnaire’s (MLQ) sections pertaining to
transformational leadership. They completed the MLQ separately for their mothers’ and
fathers’ behaviors and completed evaluations of themselves and their teammates (19).
Results of this study confirmed that there were no sex differences with respect to
the perceptions of parents’ transformational behaviors or self, coach, and peer ratings of
transformational leadership. Also, perceptions of their fathers’ transformational
leadership affected the children’s transformational leadership, but not that of their
mothers’. Adolescents perceive the extent to which their fathers use behaviors consistent
with transformational leadership when interacting with them and, in turn, manifest these
behaviors themselves when interacting with peers. Adolescents exhibiting
transformational leadership behaviors appear to be capable of evoking effort from their
peers and of being perceived as effective leaders (19).
In conclusion, all of these studies confirmed that there were strong links between
early family experiences and ultimate leadership qualities and skills. Although these
studies indicated that family influence is not the only factor in the development of
leadership skills, it plays an important role. The results of the various questionnaires
completed in these studies demonstrate that there are strong links between parental
leadership styles and the leadership styles of their children.
Leadership & Religious Affiliation
Several studies have been accounted for regarding religious leadership, but the
question remains whether or not there is a connection between leadership and religious
affiliation. Scholars have previously focused their efforts into studying various types of
leadership styles, which can be based upon a person’s ethical and moral judgment. Webb
17

studied the leadership behaviors of presidents of Christian colleges in North America that
belonged to the Council for Christian Colleges and Universities (CCCU). The degree to
which three different leadership styles were practiced by the presidents of these colleges
was considered as well as the degree of which these leadership styles promoted higher
job satisfaction. The styles considered included transformational leadership, transactional
leadership, and laissez-faire leadership (20). These leadership styles theoretically inspire
followers and enable them to create change within a system (20).
Transformational leaders embody the character of an individual who shows
confidence and positivity towards their followers’ capacity, provides a concise vision of
group goals, encourages creativity through assigning benefits, sets high expectations,
creates an environment that promotes meaning, and forms relationships with their
followers (20). This type of leadership led to the highest job satisfaction within the study.
Each leadership style was measured by the Multifactor Leadership Questionnaire.
Webb argued that transformational leadership involved motivating followers by
producing an exciting environment and persuading followers to act in the best interest of
the group, despite their own interests. In transactional leadership, leaders facilitated an
exchange of equal value to complete assigned duties regardless of the presence political,
psychological or economical motivators. In Laissez-faire leadership, Webb argues that
the leaders hold neither a negative nor positive attitude and avoid any direct personal
interaction or interference (20). These leadership styles were also studied to determine
any successful combination styles of leadership (20).
Webb’s results concluded that followers indicated more job satisfaction and
motivation when following leaders who demonstrated energy, high levels of self-
confidence, strong beliefs and ideals, assertion, and who promoted personal confidence
within their followers (20). It was found that a combination of transactional and
transformational leadership further enhanced satisfaction among employees (20).
Oh, a scholar who has studied the dynamics of leadership, looked closely at the
Motivation to Lead (MTL) concept. MTL assumes that individual traits and sociocultural
values are influential in the performance of leadership behaviors (21). A second concept
that Oh studied is Need for Closure (NFC). This is a person’s need for an immediate
answer rather than ambiguity about a certain topic (21). Oh states that a person with a
18

low need for closure will ponder over and discuss certain decisions. On the other hand, a
person with a high need for closure that will make a snap decision to ease stress and will
not abandon their decision (21).
One of Oh’s hypotheses came from his belief that a person with a higher need for
closure, one that prefers predictability and is uncomfortable with ambiguity, will be
highly motivated to accept a leadership role. He also believes this type of person will
assume a leadership role due to a strong need for structure and predictability, even though
most people look to avoid the responsibility accompanied with a obtaining a leadership
role (21).
In his study, Oh assigned 136 full-time, first year graduate students earning a
Master’s of Business Administration to 40 independent leaderless work teams. After two
months of working in these groups, the students took an online survey that was
comprised of MTL and NFC scales (21). The results showed positive relationships for
each of the variables measured in the study. A higher NFC was correlated with a higher
MTL (21).
An article review by Sweeney and Fry titled, Character Development through
Spiritual Leadership contained many arguments that showed a connection between
leadership and spirituality. The basis of the article inquired about the origin of a leader’s
characteristics (22). It is first noted that character is established through making moral
and ethical decisions in all types of situations. Secondly, it is noted that the actions of
leaders is used to infer values and beliefs of the followers. Thirdly, it was noted that the
groups’ beliefs about virtues and values has a direct effect on their perceptions and
judgments concerning moral and ethical issues. People use their moral values as a
foundation for establishing goals and rules on how to live their lives (22).
Self-efficacy & Leadership
A strong correlation exists between self-efficacy and leadership, as each has been
shown to directly impact the other. It seems what researchers have been characterizing as
effective leadership could also be known as high self-efficacy. Recent studies have been
conducted regarding the impact of self-efficacy and the role it has in leadership and vice
19

versa. Several issues were examined regarding self-efficacy and leadership including
motivation, persistence, goal orientation, resilience, cognitive abilities, resourcefulness,
problem solving, providing feedback, positive reinforcement, and the ability to work well
under pressure.
The first study reviewed by McCormick et al. addressed the concern that high
leadership self-efficacy was needed for leadership performance. The study argued and
discovered that leadership self-efficacy was a deciding factor to determine leaders from
non-leaders. It also addressed topics from prior leadership experience and behavior in
predicting future leaders. The last two decades have shown a consistent trend between
high self-efficacy and individual work performance. Efficacy theory suggests that
personal efficacy impacts the goals people pursue and therefore determines their
leadership capability (23).
Bandura first introduced the concept of self-efficacy in 1977. It was defined as
“the belief one has the personal capabilities and resources to meet the demands of a
specific task” (23). Efficacy theory has found that personal efficacy influences individual
goals based on aspirations, the amount of effort they put into a task, how much time and
effort were put into resolving the given difficulties, obstacles, and disappointments. One
can say that efficacious individuals are highly motivated, persistent, goal oriented,
resilient, and maintain clear and concise thoughts when under pressure. It was no
coincidence that individuals who are successful leaders have been described in similar
manners.
During investigations of effective leaders, characterizations of being committed,
determined, resilient, resourceful, an effective problem solver, and goal oriented were
commonly highlighted. McCormick stated that “regarding these leadership findings in
light of what is known about highly effective efficacious individuals suggest that what
leadership researchers have been describing for years is a person with high self-efficacy”
(23). All major reviews have self-confidence as an essential tool to being an effective
leader. This is also a needed trait in the transformational leadership theory.
While self-confidence and self-efficacy are not identical, self-confidence is a
generalized sense of competence, which is considered a personal trait. Self-efficacy is a
personal belief or self-judgment about one’s specific ability. This, in turn, makes these
20

characteristics closely allied with one another and related to some extent. This means a
highly confident person in a leadership role is influenced by their self-confidence and
thus possesses a high level of self-efficacy. While self-confidence does not guarantee a
successful leader, it is a belief in their ability to complete or perform in a leadership role
that is the key factor.
In his study, McCormick found that participants high in leadership self-efficacy
reported a much higher frequency of taking on a leadership role than participants
categorized as having low leadership self-efficacy. These results indicated that high self-
efficacy could be the key leadership factor. All participants were assessed using an eight-
item questionnaire to rate the self-efficacy with response options ranging from one (no
confidence) to seven (high confidence). They also confirmed the number of leadership
role experiences that had a positive effect on their leadership self-efficacy assessment
(23).
The second study by Walumbwa et al. examined the relationship between
transformational leadership and self-efficacy. The study used employees to gauge
individual’s willingness to take on challenges, ability to be creative, innovative, and
inspiring to achieve the goals of the organization. It specifically reviewed the mediated
relationship between transformational leadership and self-efficacy (23).
It has been found that transformational leadership is related to follower levels of
self-efficacy. The important aspect of this study was to determine the cause for the
followers of transformational leaders’ that show an increased level of self-efficacy. They
proposed that the effect of transformational leadership on follower performance is
realized through employees who come to identify with transformational leaders, and in
turn, show greater self-efficacy and an increase their performance (24). Transformational
leaders influence their followers by instilling and providing them with confidence to
perform beyond their implicit or explicit expectations.
This study hypothesized the relationship as follows: transformational leadership,
to rational identification, to self-efficacy, will affect the followers’ performance.
Transformational leadership consists of leadership by empowerment. It is conceptualized
that transformational leaders include four dimensions: charisma, inspirational motivation,
intellectual stimulation, and individual consideration. Bandura argued that individuals
21

increase self-efficacy through role-modeling (24). Rational identification comes into play
by enabling employees to enact behaviors that are consistent with their abilities, opposed
to mimicking supervisor behavior. Simplified, it allows them to learn from their leader
and acquire new skills, thereby enhancing their self-efficacy.
Previous studies have found a positive correlation between self-efficacy and work
related performance. The reason self-efficacy is positively related to important
organizational outcomes stems from the efficacy beliefs that influence individual’s goal
choices and goal-directed activities, reactions, and persistence in the face of challenges
and/or obstacles (24). This determines individual’s selection of a challenge they believe
they can accomplish. The higher the self-efficacy the more likely they will enter into a
situation in which performance expectation is high. Likewise, a low self-efficacy will
predict an individual’s performance into a lower performance expectation. Therefore,
transformational leaders expect followers with high self-efficacy to accept challenges as
they instill confidence and provide encouragement.
The study utilized 426 employees and their supervisors. Questionnaires and
assessments were utilized to gauge employees’ self-efficacy on a ten-point Likert scale.
The results showed that transformational leadership was positively related to self-efficacy
and performance. Transformational leaders enhanced efficacy by providing opportunities
to learn, providing feedback, delegating duties, and challenging followers to come up
with new solutions. This self-efficacy leads to better performance and supports the
leadership and self-efficacy relationship (24).
The next study by Anderson et al. involved the development of structured
leadership self-efficacy and the reactions to leadership effectiveness. The study derived
key leadership behaviors from executives to serve as a basis for measuring leadership
effectiveness. It was proposed that leaders with higher self-efficacy will enact key
leadership skills and engage more often and with greater effectiveness than those who
possess lower self-efficacy. This study is supported by recent studies conducted by Paglis
and Green that links self-efficacy to effective leadership. Findings in their literature
suggest that people with strong self-efficacy beliefs are likely to be more motivated,
contribute more towards actions, and preserve to a greater degree when faced with
difficulty (25).
22

The key behaviors were chosen from 44 senior to mid-level executives and
managers. A total of 251 participants were selected to participate in the current study.
The study showed the importance and effectiveness of a well-defined leadership self-
efficacy in expanding our understanding of leadership effectiveness. It was determined
that certain leadership measurements can predict and lead to leadership self-efficacy
performance. Such factors included innovation, creativity, problem solving, influential
leadership, and communication (25).
The last study, conducted by Schyns, was the exploration of the relationship
between leadership-relevant attributes and occupational self-efficacy. It is hypothesized
that leadership-relevant attributes are related to high self-efficacy beliefs. Self-efficacy
has been widely applied in the organizational context and is believed to play a central
role to the organization’s performance. Occupational self-efficacy is extremely similar to
self-efficacy, except occupational efficacy behaviors are specific to one’s work (26).
Prior research has found that self-efficacy is positively related to a performance
increase. According to a study by Hannah, effective leadership requires high levels of
agency and confidence; therefore self-efficacy is important for becoming a successful
leader in the future (26). The study was interested in self-efficacy prior to job experience,
which is why the study targeted business majors. They believe that students higher in
occupational self-efficacy will find it much easier to succeed and achieve their desired
tasks. This suggests the development of self-efficacy is mainly linked to mastery
experience and would further support transformational leadership.
The study was composed of 136 students who were assessed for their leadership
attributes. A total of 34 attributes were tested on a four-point scale. Occupational self-
efficacy was then assessed using a self-efficacy scale. The results of the study confirmed
the hypothesis that leadership attributes are positively related to occupational self-
efficacy. Self-efficacy is an important personal resource, and plays a vital role in career
development. The study used self-description scales and assessments. These scales were
of the most importance to people who believed themselves to be confident and motivated
and were likely to rate themselves as highly motivated and confident (26).
The studies confirmed a positive relationship exists between leadership and self-
efficacy. Individuals who are high in self-efficacy will have higher leadership skills.
23

Several common skills or attributes were present in all the studies on the composition of
leadership self-efficacy. Common skills and attributes included motivation, innovation,
critical thinker, problem solver, accepted challenges, etc. (26). Leaders who are
efficacious will also produce and help their followers become more efficacious as well.
It seems apparent that self-efficacy and leadership run hand in hand, as one will directly
influence the other.
Gender & Leadership
Gender equality is a continued battle, even in contemporary America. Currently,
females represent a greater percentage in the workplace in comparison to men (27). It
could be said that the presence of women in the healthcare field is over-powering.
Women are 78% of the healthcare workforce; 92% of nurses, and 48% of physicians. A
staggering 81% of graduate degrees attained in the health fields are received by women
(27). The large number of women qualified to take on a leadership role is one of the
characteristics that strengthens the field (27, 28). Unfortunately, the percentage of
females in leadership positions in the healthcare field is not representative of the vast
majority of females currently working in the field. Research shows that women are more
likely to remain in a middle-management position, proven by the fact that in 2011 a mere
25% of women held chief executive officer (CEO) positions in hospitals (27, 28). This
disparity is not isolated to the healthcare profession; Fortune 500 companies’ executive
positions are comprised of 86% male (28). In fact, 60 Fortune 500 companies do not have
a single female on their board, and 136 do not have a female in their top five executives
(28). Bringing women to the top of the corporate ladder will require development of
leaders and a focus on women leaders (27, 28). Board studies have shown that health
systems perform higher in proportion to having women on the board of executives (27).
A study conducted by Elsesser and Lever found that 8% of women and 21% of men have
never reported to a female boss, in comparison to 3% of women and 1% of men who
have never reported to a male boss (29). Additionally, it is found that women who
achieve an executive position are more likely to mentor their colleagues and aide in
developing future leaders (27, 28, 30). A young woman with aspirations for leadership
should look for at least one mentor and develop leadership skills whenever possible, so
that she may be prepared to seize a leadership position when one arises (28, 30, 31).
24

Gender bias may be one large barrier to women gaining executive positions.
Stereotypically, men are direct, aggressive, assertive, and ambitious, which have
previously also been associated with desirable leadership characteristics (30, 31, 32). On
the other hand, women have personality traits associated with being communal,
nurturing, caring, and sensitive (29, 30, 32). Research shows that more time spent with an
individual results in less stereotyping, however hypothetical situations still show that a
gender bias stereotype exists (29). In a study conducted, there was minimal difference
between genders when workers were asked to rate the leadership skills of their own
bosses, however in a hypothetical situation; the male bosses were preferred (29). A cross-
gender difference was also found between male and female workers (29). Elsesser and
Lever found that women were more likely to prefer a male boss, and individuals who
have previously had a female boss are more likely to admit to preferring to have a female
boss (29). Essay responses to the question ‘why do you prefer a female boss?’ included
desiring an understanding boss that was easier to communicate with, whereas, common
reasons for desiring a male boss included negative adjectives for women opposed to
highlighting the quality of a male boss (29). Other themes that appeared from the study
included women who believed they could use their gender to attain sympathy from their
male bosses and workers and disliking bosses of the gender with which they compete in
their work (29). In the future, women will need to empower each other to climb the
corporate ladder and begin to take charge of leadership positions (27, 28, 29, 30).
Many leadership theories have arrived over the recent years, with
transformational leadership appearing as an effective approach for leaders of the future
(27, 32). Female characteristics fit this leadership style effectively, creating an open and
innovative work atmosphere for employees (27, 32). The leadership path for women was
previously thought of as a labyrinth, with many competing interests and stereotypes that
prevented a female from becoming a leader in her career (27, 28, 32). This labyrinth has
been reshaped into a circular model, where individuals may enter towards leadership
through characteristics of competence, connectivity, service, awareness, creation,
renewal, and wisdom, which have been identified as effective leadership qualities (27, 28,
32). This flattened model has allowed for females to balance their work-life priorities and
become an option for leadership positions that they have previously remained
25

unconsidered (27, 28, 32). The path for females into leadership positions allows for a
future of diverse leadership positions, which will promote creative thinking, innovation,
and improve patient care in the healthcare field in the future (27, 28, 30, 32).
CHAPTER 3
METHODOLOGY
26

Research Study Design
The research design utilized for this study was a quasi-experimental
pretest/posttest design. Tests were conducted before and after a four-week period, where
student leaders attended a weekly leadership program.
The Institutional Review Board Application was approved at an expedited level
with an informed consent in March of 2013. This expedited IRB was also qualified for
category 6 and 7. Category 6 allows for data collection from voice, video, digital or
image recordings made from the research process. Category 7 allows for research on
individual or group characteristics or behavior and research employing survey, interview,
oral history, focus group, program evaluation, human factors evaluation, or quality
assurance methodologies.
Participants
There were two groups involved in this study. The experimental group contained
current Benedictine University students that were identified as leaders. These students
participated in a leadership-training program in April 2013 by invitation from the
Benedictine Director of Student Engagement and Leadership. This leadership program
targets development of leadership skills measured on the Student Leadership Practice
Inventory (SLPI) and is delivered by the Director of Student Engagement and
Leadership. A posttest SLPI was administered to the experimental group following four
leadership training programs. The control group contained current Benedictine University
students identified as leaders who were not participating in a leadership-training program
during this time. The control group was not administered a posttest SLPI.
Student recruitment began with the Director of Student Engagement and
Leadership providing names and contact information for students willing to be involved
in this study. Selection was amongst those receiving leadership scholarships at
Benedictine University. Contact information was received during the last week of March,
where a time for data collection was selected. Students provided written consent prior to
responding to survey or interview questions. Qualitative interviewing and administration
of the quantitative surveys occurred at the beginning of the training sessions. A posttest
SLPI was administered following the fourth training session.
27

The role of students in the study consisted of completion of surveys and
interviews (refer to appendices for question sets). All participants were asked to complete
the self-administered pretest and participate in a semi-structured interview during weeks
1-3. The experimental group was asked to complete the self-administered posttest after
four leadership-training sessions. The SLPI and other items on the quantitative pretest
survey were estimated to take 18-20 minutes to complete. The interviews were estimated
to last for about 30 minutes, depending on the length of individual answers. The final
posttest was estimated to take 10-12 minutes to complete. Those in the experimental
group attended a leadership-training workshop on campus, led by the Director of Student
Engagement and Leadership. The theme was Five Practices of Exemplary Student
Leadership.
A consent form asking for the participant’s signature was provided and collected
before collecting data. Each student responded to the pretest SLPI and a survey
containing the Leadership Self-Efficacy scale developed by Ng, Ang, and Chan (2008)
and questions developed by our research team. Student interviews were conducted in
pairs. The interview times were coordinated between the student and interview pairs and
were offered in person or via Skype. Interviews were recorded and transcribed by the
research pairs.
Data Collection Methodology
Baseline data was collected from March 26, 2013 to April 8, 2013. At this time,
participants completed the SLPI and survey questionnaires. Students in the experimental
group began attending the weekly leadership-training program.
Interviews were conducted from April 9, 2013 through April 16, 2013. Pairs of
graduate students in the research group conducted interviews. All interviews were
completed in person and on the Benedictine University campus, with the exception of one
Skype interview. Interviews were recorded and transcribed verbatim by the interviewers.
The posttest SLPI was administered to the experimental group during the week of
April 30, 2013 following four leadership-training sessions.
The site for this study was the Benedictine University campus. Pre and posttesting
sessions took place in the leadership classrooms. In-person interviews took place in a
campus building and the Skype interview took place in the homes of the participants.
28

Confidentiality was maintained during the testing. Mobile phone communication was the
primary source of communication to confirm interview times between interviewers and
participants. Refer to appendices for interview, pre and posttest questions.
Measurement Tools
Student Leadership Practices Inventory (SLPI)
The SLPI is a 30-item self-instrument which measures leadership practices in five
areas: (a) Challenging the Process (search for opportunities, experiment, and take risks);
(b) Inspiring a shared vision (envision the future, enlist others); (c) Enabling Others to
Act (foster collaboration, strengthen others); (d) Modeling The Way (set the example,
plan small wins); and (e) Encouraging the Heart (recognizing individual contribution,
celebrate accomplishments). The instrument contains six items in each category and uses
a 5-point Likert scale (rarely to very frequently). The reliability and validity is high,
including the predictive validity: “The results make sense to people and, over time, have
proven to predict high-performing leaders and moderate- and low-performing ones”
(source: http://wwww.studentleadershipchallenge.com/Assessment/assessment-
studentLPI-print.aspx). Permission was granted to use this instrument. The university had
purchased paper copies to utilize in this study.
For this data set, the KMO statistic is .47, which is considered an unacceptable
value (greater than 0.5 being acceptable). Further data should be collected.
For this data set, the Bartlett’s test is highly significant (p < .001), and therefore
factor analysis is appropriate (Table 1).
Table 1: Impact of Others
KMO and Bartlett's Test
Kaiser-Meyer-Olkin Measure of Sampling
Adequacy..47
Bartlett's Test of Approx. Chi-Square 60.93
29

SphericityDf 28
Sig. <.01
After rotation the three components together account for 73% of the total variance
(Table 2).
Table 2: Total Variance Explained
Compone
nt
Initial Eigenvalues Extraction Sums of
Squared Loadings
Rotation Sums of
Squared Loadings
Tot
al
% of
Varian
ce
Cumulati
ve %
Tot
al
% of
Varian
ce
Cumulati
ve %
Tot
al
% of
Varian
ce
Cumulati
ve %
13.1
038.68 38.68
3.1
038.68 38.68
2.4
230.25 30.25
21.5
419.29 57.97
1.5
419.29 57.97
1.8
923.63 53.88
31.2
015.05 73.02
1.2
015.05 73.02
1.5
319.15 73.02
4.75
39.413 82.44
5 .60 7.47 89.91
6 .40 4.98 94.89
7 .31 3.92 98.81
8 .10 1.19 100.00
Extraction Method: Principal Component Analysis.
This output allowed us to group these eight variables into three groupings: Group
1 = Teacher, Church, Work Supervisor; Group 2 = Family (Father, Mother, Siblings);
Group 3 = Significant Others, Friends) (Table 3).
Table 3: Rotated Component Matrix
Component
30

Reliability Statistics
Table 4: Cronbach’s Alpha
Cronbach's
Alpha
Cronbach's
Alpha Based
on
Standardized
Items
N of
Items
.81 .82 3
The Cronbach’s Alpha for Group 1 (Teacher, Church, Work Supervisor) is .81, which
indicates good internal consistency among the three items assigned.
Reliability Statistics
Table 5: Cronbach’s Alpha
Cronbach's
Alpha
Cronbach's
Alpha Based
on
Standardized
Items
N of Items
.78 .78 3
The Cronbach’s Alpha for Group 2 (Father, Mother, Siblings) is .78, which indicates
acceptable internal consistency among the three items assigned.
Reliability Statistics
Table 6: Reliability Statistics
31

Cronbach's
Alpha
Cronbach's
Alpha Based
on
Standardized
Items
N of Items
.21 .23 2
The Cronbach’s Alpha for Group 3 (Friends, Significant Others) is .21, which indicates
unacceptable internal consistency among the two items assigned.
For this data set, the KMO statistic is .78, which is considered a middling value
but still acceptable (> 0.5 = acceptable; 0.7 < KMO = middling).
For this data set, the Bartlett’s test is highly significant (p < .001, and therefore
factor analysis is appropriate (Table 7).
Table 7: Impact of Participation Before College
KMO and Bartlett's Test
Kaiser-Meyer-Olkin Measure of Sampling
Adequacy..78
Bartlett's Test of
Sphericity
Approx. Chi-Square 128.44
Df 28
Sig. <.01
After rotation the two components together account for 67% of the total variance
(Table 8).
Table 8: Total Variance Explained
Compone
nt
Initial Eigenvalues Extraction Sums of
Squared Loadings
Rotation Sums of
Squared Loadings
32

Tot
al
% of
Varian
ce
Cumulati
ve %
Tot
al
% of
Varian
ce
Cumulati
ve %
Tot
al
% of
Varian
ce
Cumulati
ve %
1 3.81 47.58 47.58 3.81 47.58 47.58 3.52 43.98 43.98
2 1.54 19.21 66.79 1.54 19.21 66.79 1.83 22.81 66.79
3 .69 8.64 75.43
4 .65 8.08 83.51
5 .44 5.46 88.97
6 .37 4.66 93.63
7 .30 3.72 97.35
8 .21 2.65 100.00
Extraction Method: Principal Component Analysis.
This output allowed us to group these seven variables into 2 groupings (Group 1 =
Amount of community service before college, Participation in clubs/groups/honor
societies before college, Leadership position in community before college, Leadership
position in school before college, Participation in community organizations; Group 2 =
Participation in varsity sports before college, Participation in intramural sports before
college, Participation in activism before college (Table 9).
Table 9: Rotated Component Matrix
Component
1 2
How often before college did
you volunteer or community
service
.86 -.05
Before college how often did
you participate in student clubs,
groups, honor societies
.83 .14
33

Before college how often did
you have a leadership position
in the community
.80 .08
Before college, how often did
you participate in leadership
positions at school?
.79 .13
Before college how often did
you participate in community
organizations (choir, scouts,
youth group)
.73 .19
__________________________
____________
__________
____
__________
____
Before college how often did
you play intercollegiate or
varsity sports
<.01 .88
Before college how often did
you play intramural sports.11 .82
Before college how often did
you participate in activism
(petition, rally, protest)
.54 .55
Extraction Method: Principal Component Analysis.
Rotation Method: Varimax with Kaiser Normalization.
a. Rotation converged in 3 iterations.
Table 10: Reliability Statistics
Cronbach's
Alpha
Cronbach's
Alpha Based
on
Standardized
Items
N of
Items
34

.89 .90 6
The Cronbach’s Alpha for Group 1 (Amount of community service before college,
Participation in clubs/groups/honor societies before college, Leadership position in
community before college, Leadership position in school before college, Participation in
community organizations) is .89, which indicates good internal consistency among the
thesix items assigned.
Table 11: Reliability Statistics
Cronbach's
Alpha
Cronbach's
Alpha Based
on
Standardized
Items
N of
Items
.68 .69 2
The Cronbach’s Alpha for Group 2 (Participation in varsity sports before college,
Participation in intramural sports before college, Participation in activism before college)
is .68, which indicates questionable internal consistency among the two items assigned.
For this data set, the KMO statistic is .61, which is considered a mediocre value
but still acceptable (> 0.5 = acceptable; < 0.5 < KMO < 0.7 = mediocre).
For this data set, the Bartlett’s test is highly significant (p < .001, and therefore factor
analysis is appropriate (Table 12).
Table 12: Impact of Previous & Current Experience
KMO and Bartlett's Test
Kaiser-Meyer-Olkin Measure of Sampling Adequacy. .61
Bartlett's Test of Sphericity Approx. Chi-Square 64.85
Df 21
Sig. <.01
35

After rotation the two components together account for 56% of the total variance
(Table 13).
Table 13: Total Variance Explained
Compon
ent
Initial
Eigenval
ues
Extracti
on
Sums of
Squared
Loadin
gs
Rotation
Sums of
Squared
Loading
s
Total % of
Varianc
e
Cumulat
ive %
Tot
al
% of
Varian
ce
Cumulat
ive %
Tot
al
% of
Varian
ce
Cumulat
ive %
36

1 2.69 38.49 38.492.6
938.49 38.49
2.1
230.27 30.27
2 1.20 17.19 55.681.2
017.19 55.68
1.7
825.41 55.68
3 .96 13.69 69.37
4 .83 11.78 81.15
5 .62 8.88 90.02
6 .47 6.67 96.70
7 .23 3.30 100.00
Extractio
n
Method:
Principal
Compon
ent
Analysis
.
This output allowed us to group these seven variables into two groupings (Group
1 = Number of organizations, Number of volunteer experiences, Number of work
experiences; Group 2 = Number of leadership/professionalism training programs
attended, Number of professional organization/association meetings attended, Number of
courses taken requiring volunteerism, Number of awards/honors/scholarships received
(Table 14).
37

Table 14: Rotated Component Matrixa
Component
1 2
How many organizations have you been involved .84 .11
How many volunteer experiences have you been involved .83 .22
How many different work experiences have you obtained .50 .49
How many times did you attend leadership and/or professionalism training
programs-.43 .72
How many times did you attend a meeting of a professional organization or
association.25 .67
How many courses have you taken in which you completed a community
service or service learning component.31 .51
How many awards, scholarships, and honors received .38 .50
Extraction Method: Principal Component Analysis.
38

Rotation Method: Varimax with Kaiser Normalization.
a. Rotation converged in 3 iterations.
Table 15: Reliability Statistics
Cronbach's
Alpha
Cronbach's
Alpha Based
on
Standardized
Items
N of
Items
.72 .72 3
The Cronbach’s Alpha for Group 1 (Number of organizations, Number of volunteer
experiences, Number of work experiences) is .72, which indicates acceptable internal
consistency among the three items assigned.
Table 16: Reliability Statistics
Cronbach's
Alpha
Cronbach's
Alpha Based
on
Standardized
Items
N of Items
.45 .51 4
The Cronbach’s Alpha for Group 2 (Number of leadership/professionalism training
programs attended, Number of professional organization/association meetings attended,
Number of courses taken requiring volunteerism, Number of awards/honors/scholarships
received) is .45, which indicates unacceptable internal consistency among the 4 items
assigned.
Leadership Self-Efficacy scale
39

The Leadership Self-Efficacy scale was established by Ng, Ang, and Chan (2008)
to assess leadership self-efficacy. Permission was received from the authors to use this
questionnaire. The questionnaire asked respondents to report their confidence in the
ability to perform several aspects of leadership on a Likert scale ranging from 1 to 7,
where 1 indicated ‘not at all confident’ and 7 indicated ‘extremely confident’. Examples
of leadership aspects included: planning, communicating, delegating, and leading a team.
Reliability for leadership self-efficacy mean score was .93.
Survey Questions
Our research group developed additional survey questions based on research
obtained from literature reviews. Questions were selected to highlight themes from
previous leadership research to determine if these themes were consistent amongst our
leadership participants and to uncover potential new themes. To increase the reliability of
the study, all surveys were collected while students were at the same level of completion
of the leadership-training program. All surveys were self-administered per instruction.
Statistical Procedures
Analysis of SLPI using SLPI scoring software was used to print reports providing
an interpretation of individual SLPI results. The statistical software utilized to compute
all statistical procedures was SPSS, including the analysis of pretest and posttest scores
(SLPI and self-efficacy) as well as analysis of variables against SLPI and self-efficacy
scales. The tests used for comparing leadership groups included a paired t-test, Pearson
Correlation, repeated measurement ANOVA, and one-way MANOVA.
40

CHAPTER 4
FINDINGS: IN-CLASS SURVEYS
Outliers Treatment of the Data.
Before running in-depth analysis of the data collected, exploratory and descriptive
data analyses were run to look for errors and outliers. Descriptive statistics were
computed on variables such as ethnicity, age, gender, and the 30 questions of the SLPI
surveys. Examination of the frequencies and descriptive statistics tests that were
performed within the aforementioned parameters were mean, range, and standard
deviation. Some questions in the SLPI were missing pieces of information. These areas
were coded as “999”.
Descriptive Profile of Participants
41

These participants were all identified as student leaders at a selected Midwestern
university. The student leaders were placed into two separate groups, “group 111” and
“group 222.” An SLPI survey was administered to all participants in April 2013. The
SLPI was also administered four weeks later the experimental group received leadership
education. All participants were undergraduate students of various majors. There were
more females then males, a total of 24 (57%) and 18 (43%), respectively (Figure 1). The
age ranged from 18-56 years old(n= 43, m = 22.10, sd = 6.97). The mode for age was 18
years old (n = 10, 25.6%) and the mean age was 22.10 years old. There were 21 students
in the experimental and match groups. Of the 21 students in the experimental group that
filled out the original SLPI, a total of 9 post-SLPI surveys were returned four weeks later.
Figure 1: Gender
42

Table 17: Gender Descriptives
NValid 41
Missing 2
Mean 1.56
Mode 2.00
Std. Deviation .50
The majority of the participants were identified as being of White and Asian
ethnicity (12 of 43, 27.9%). The remaining 19 participants considered themselves to be
either Hispanic (n = 2, 4.65%), Black or African American (n = 6,14%), White Middle
Eastern (n =12, 27.9%), American Indian, Alaskan Native (n = 1,2.33%), or of the mixed
43

minority (n = 3,6.98%) (Figure 2).There were no differences found in the responses of
the SLPI between ethnicities.
Figure 2: Ethnicity
Leadership & Gender
Hₒ1: There is no significant difference between self-reported skills of “modeling the
way” between males and females based on the SLPI.
An independent t-test was used to compare the mean score of modeling the way
scores between males and females. There was no significant difference between modeling
the way skills reported by males and females t(41) = .80, p = .13, d = 0.13. The mean for
females was non-significantly higher than males (Table 18). The null hypothesis is
accepted (Table 18 & 19).
Table 18: SLPI Results between Males and Females
44

Gender N Mean Std. Deviation
Self- Model the Way male 18 23.28 3.91
female 23 24.17 3.30
Self- Inspire a shared vision male 18 24.06 3.40
female 23 24.74 3.82
Self- Challenge the Process male 18 23.78 3.64
female 23 24.96 3.07
Self- Enable Others to Act male 18 25.50 3.24
female 23 26.09 1.78
Self- Encourage the heart male 18 24.61 3.76
female 23 25.39 3.19
Percentile Model the way male 18 54.72 32.82
female 23 66.17 25.59
Percentile Inspire a shared vision male 18 71.00 23.32
female 23 74.35 25.58
Percentile Challenge the process male 18 72.06 25.49
female 23 81.39 21.37
Percentile Enable Others to act male 18 66.56 30.17
female 23 75.43 15.96
Percentile Encourage the Heart male 18 62.22 27.88
female 23 67.61 26.31
Table 19: Independent t-Test between Males and Females
45

Levene's Test for Equality of Variances
F Sig. t Df
Self- Model the Way
Equal variances assumed 2.45 .13 -.80 39
Equal variances not assumed -.78 33.25
Self- Inspire a shared vision
Equal variances assumed .47 .50 -.60 39
Equal variances not assumed -.61 38.28
Self- Challenge the Process
Equal variances assumed 1.35 .25 -
1.13 39
Equal variances not assumed
-1.10 33.22
Self- Enable Others to Act
Equal variances assumed 7.65 .01 -.74 39
Equal variances not assumed -.69 24.92
Self- Encourage the heart
Equal variances assumed .07 .80 -.72 39
Equal variances not assumed -.70 33.35
Percentile Model the way
Equal variances assumed 6.18 .02 -
1.26 39
Equal variances not assumed
-1.22 31.51
Percentile Inspire a shared vision
Equal variances assumed .16 .69 -.43 39
Equal variances not assumed -.44 38.03
Percentile Challenge the process
Equal variances assumed 2.16 .15 -
1.28 39
Equal variances not assumed
-1.25 33.11
Percentile Enable Others to act
Equal variances assumed 8.63 .01 -
1.21 39
Equal variances not assumed
-1.13 24.36
Percentile Encourage the Heart
Equal variances assumed .02 .89 -.63 39
Equal variances not assumed -.63 35.59
46

Hₒ2: There is no significant difference between self-reported skills of “inspiring a shared
vision” between males and females based on the SLPI.
An independent t-test was used to compare means between the self-reported skills
of modeling the way between males and females. There was no significant difference
between inspiring a shared vision between males and females, t(41) = .60, p = .50,d = .10.
There was a non-significant higher mean score for females (Table 18). The null
hypothesis is accepted (Table 18& 19).
Hₒ3: There is no significant difference between self-reported skills of “challenging the
process” between males and females based on the SLPI.
An independent t-test was used to compare means between the skills of
challenging the process between males and females. There was no significant difference
between the mean scores for challenging the way between males and females, t(41) =
1.13, p = .25, d = .18. There was a non-significant higher mean score for females than
males (Table 18). The null hypothesis is accepted (Table 18 & 19).
Hₒ4: There is no significant difference between self-reported skills of “enabling others to
act” between males and females based on the SLPI.
An independent t-test was used to compare means between skills reported for
enabling others to act between males and females. There was a significant difference
between the ability of males and females to enable others to act, t(41) = .74, p = .01, d
= .12. The mean score for males and females (Table 18). The null hypothesis is rejected
(Table 18 & 19).
Hₒ5: There is no significant difference between self-reported skills of “encouraging the
heart” between males and females based on the SLPI.
An independent t-test was used to compare means between skills of encouraging
the heart between males and females, t(41) = .72, p = .80,d = .11. There was no
significant difference between scores for encouraging the heart between males and
females. There was a non-significant higher mean score for females than males (Table
18). The null hypothesis is accepted (Table 18 & 19).
Hₒ6: There is no difference between the percentile score for “modeling the way” between
males and females.
47

An independent t-test was used to compare means between percentile scores of
modeling the way between males and females. There was a significant difference
between the percentile scores of modeling the way between males and females, t(41) =
1.26, p = .02,d = .20. The mean score was higher for females than males (Table 18). The
null hypothesis is rejected (Table 18 & 19).
Hₒ7: There is no difference between the percentile score for “inspiring a shared vision”
between males and females.
An independent t-test was used to compare means between the percentile scores
of inspiring a shared vision between males and females. There was no significant
difference between the percentile scores between males and females, t(41) = .43, p = .69,
d = .07. There was a non-significant higher mean score for females than males (Table
18). The null hypothesis is accepted (Table 18 & 19).
Hₒ8: There is no difference between the percentile scores for “challenging the process”
between males and females.
An independent t-test was used to compare means between percentile scores for
challenging the process between males and females. There was no significant difference
between the percentile scores for challenging the process between males and females,
t(41) = 1.28, p = .15,d = 0.2. There was a non-significant higher mean score for females
than males (Table 18). The null hypothesis is accepted (Table 18 & 19).
Hₒ9: There is no difference between the percentile scores for “enabling others to act”
between males and females.
An independent t-test was used to compare the means between the percentile
scores for enabling others to act between males and females. There was a significant
difference between the percentile score for enabling others to act between males and
females, t(41) = 1.21, p = .01,d = .19. The mean score was higher for females than males
(Table 18). The null hypothesis is rejected (Table 18 & 19).
Hₒ10: There is no difference between the percentile scores for “encouraging the heart”
between males and females.
An independent t-test was used to compare means between the percentile scores
for encouraging the heart between males and females. There was no significant difference
between the percentile scores between males and females, t(41) = .63, p = .89,d = .10.
48

There was a non-significant higher mean score for females than males (Table 18). The
null hypothesis is accepted (Table 18 & 19).
Hₒ11: There is no difference between the self-efficacy levels of ability to perform
managerial leadership tasks reported between males and females.
An independent t-test was used to compare means between the ability to perform
managerial leadership tasks between males and females. There was no significant
difference between the managerial leadership tasks between males and females, t(39) =
2.0, p =.28, d = .31. There was a non-significant higher mean score for females than
males (Table 20). The null hypothesis is accepted (Table 20 & 21).
Table 20: Leadership Self-Efficacy Survey of Males and Females
Gender N Mean Std. Deviation
SE1- Managerial/administrative male 17 5.3882 1.03071
female 22 5.9818 .85503
SE2- Charisma male 17 5.5000 .96014
female 23 5.9130 .89382
SE3- Taking action male 17 5.9412 .91466
female 23 5.8406 1.05825
SE4- Personalization male 17 4.6471 .84344
female 23 5.3261 1.14424
49

Table 21: Independent t-Test of Leadership Survey between Males and Females
Levene's Test for Equality of Variances
F Sig. t Df
SE1- Managerial/administrative
Equal variances assumed 1.19 .28 -
1.97 37
Equal variances not assumed
-1.92
30.89
SE2- Charisma
Equal variances assumed <.01 .93 -
1.40 38
Equal variances not assumed
-1.39
33.17
SE3- Taking action
Equal variances assumed .17 .68 .31 38
Equal variances not assumed .32 36.9
9
SE4- Personalization
Equal variances assumed 1.89 .18 -
2.06 38
Equal variances not assumed
-2.16
38.00
Hₒ12: There is no difference between the self-efficacy levels of the ability to perform
charismatic leadership tasks reported between males and females.
An independent t-test was used to compare the means between the self-efficacy
level of performing charismatic leadership tasks between males and females. There was
no significant difference between the self-efficacy level of males and females, t(39) = 1.4,
p = .93, d = .22. There was a non-significant higher mean score for females than males
(Table 20). The null hypothesis is accepted (Table 20 & 21).
Hₒ13: There is no difference between the self-efficacy levels of the ability to perform
leadership tasks that require taking action reported by males and females.
An independent t-test was used to compare the means between the self-efficacy
levels of the ability to perform leadership tasks that require taking action. There was no
significant difference between the self-efficacy levels between males and females, t(39) =
.31, p = .68,d = 0.05. There was a non-significant higher mean score for males than
females (Table 20). The null hypothesis is accepted (Table 20 & 21).
50

Hₒ14: There is no difference between the self-efficacy levels of the ability to perform
personalization leadership tasks reported by males and females.
An independent t-test was used to compare the mean self-efficacy levels between
the ability to perform personalization leadership tasks between males and females. There
was no significant difference between males and females, t(39) = 2.06, p = .18, d = .32.
There was a non-significant higher mean score for females than males (Table 20). The
null hypothesis is accepted (Table 20 & 21).
Leadership & Family
Frequency Distribution
The majority of the participants identified their mother’s highest education level
as being a bachelor’s degree (12 of 43, 27.9%). The remaining participants identified
their mother’s highest education level to be either some college or associates degree
(n=11, 25.6%), high school, GED, or less (n=8, 18.6%), master’s degree (n=4, 9.3%),
some graduate coursework (n=3, 7.0%), or doctorate, J.D., MD, or pharm D (n=2, 4.7%)
(Figure 3).
Figure 3: Mother Education Level
51

The majority of the participants identified their father’s highest education level as
being a bachelor’s degree (12 of 43, 27.9%). The remaining participants identified their
father’s highest education level to be either some college or associates degree (n=8,
18.6%), high school, GED, or less (n=7, 16.3%), master’s degree (n=6, 14.0%),
doctorate, J.D., MD, or pharm D (n=5, 11.6%), or some graduate coursework (n=2,
4.7%). (Figure 4).
Figure 4: Father Education Level
Hₒ15: Mother and father education level is not related to the ability to “model the way”,
“inspire a shared vision”, “challenge the process”, “enable others to act”, or
“encourage the heart” in terms of leadership.
A Pearson correlation coefficient was calculated for the relationship between
mother highest education level and SLPI pre-test responses (model the way, inspire a
shared vision, challenge the process, enable others to act, and encourage the heart). No
significant correlations (p > .05) were found examining the relationship between mother
highest education level and SLPI responses of model the way (r(40) = .60), inspire a
52

shared vision (r(40) = .68), enable others to act (r(40) = .51), encourage the heart(r(40)
= .60), and challenge the process (r(40) = .95).
A Pearson correlation coefficient was calculated for the relationship between
father highest education level and SLPI responses (model the way, inspire a shared
vision, challenge the process, enable others to act, and encourage the heart). No
significant correlations (p > .05) were found examining the relationship between father
highest education level and SLPI responses of model the way (r(40) = .90), inspire a
shared vision (r(40) = .97), enable others to act (r(40) = .20), encourage the heart (r(40) =
.26), and challenge the process (r(40) = .70) (Table 22).
Based on the results of this data output, the null hypothesis: there is no
relationship between maternal level of education and SLPI response scores is accepted.
The null hypothesis: there is no relationship between paternal level of education and
SLPI response scores is also accepted.
Table 22: Pearson Correlation-Mother/Father Education and SLPI
Mother highest education level
Father highest education level
Self- Model the Way
Pearson Correlation -.09 .02
Sig. (2-tailed) .60 .89N 40 40
Self- Inspire a shared vision
Pearson Correlation -.07 -.01
Sig. (2-tailed) .68 .97N 40 40
Self- Challenge the Process
Pearson Correlation .01 .06
Sig. (2-tailed) .95 .70N 40 40
Self- Enable Others to Act
Pearson Correlation .11 .21
Sig. (2-tailed) .51 .20N 40 40
Self- Encourage the heart
Pearson Correlation .09 .18
Sig. (2-tailed) .60 .26N 40 40
53

Mother highest education level
Pearson Correlation 1 .58**
Sig. (2-tailed) <.01N 40 39
Father highest education level
Pearson Correlation .58** 1
Sig. (2-tailed) <.01N 39 40
**. Correlation is significant at the 0.01 level (2-tailed).
Hₒ16: Family influence is not related to the ability to “model the way”, “inspire a shared
vision”, “challenge the process”, “enable others to act”, or “encourage the heart” in
terms of leadership.
A Pearson correlation coefficient was calculated for the relationship between
family influence and SLPI responses (model the way, inspire a shared vision, challenge
the process, enable others to act, and encourage the heart).
No significant correlations (p > .05) were found when examining the relationship
between family influence on ability to model the way (r(24) = .56), challenge the process
(r(24) = .64), inspire a shared vision (r(24) = .96), enable others to act (r(24) = .76), and
encourage the heart (r(24) = .89).
Based on the results of this data output, the null hypothesis: there is no
relationship between family influence and SLPI response scores is accepted.
Table 23: Pearson Correlation-Family Influence and SLPI
Family
Self- Model the Way
Pearson Correlation -.12
Sig. (2-tailed) .56N 24
Self- Inspire a shared vision
Pearson Correlation .01
Sig. (2-tailed) .96N 24
Self- Challenge the Process
Pearson Correlation -.10
Sig. (2-tailed) .64N 24
54

Self- Enable Others to Act
Pearson Correlation -.07
Sig. (2-tailed) .76N 24
Self- Encourage the heart
Pearson Correlation -.03
Sig. (2-tailed) .89N 24
Family
Pearson Correlation 1
Sig. (2-tailed)N 24
**. Correlation is significant at the 0.01 level (2-tailed).
After interviewing and transcribing the interviews of the students in the
experimental group, common themes were found in their responses regarding the
individual(s) who impacted the student’s development as a leader. The specific questions
that provided the answers to this are as follows: “Did others believe that you would
achieve? If so, who were those people?” “What role does family play in your
development as well as the development of your values?” “How did family impact your
confidence?” “Explain your family’s influence, if any, on your choice to volunteer or on
your choice to lead?” “What role, if any, does friends or significant others play in your
choice to volunteer and to lead?” “Who do you admire or emulate or from whom do you
get your inspiration from?”
As gathered from the interviews, the percentage of students who responded that
their mother influenced their leadership development was 88.9%. The percentage of
students who responded that their father influenced their leadership development was
77.8%. The percentage of students who responded that their mother and father both
influenced their leadership development was 77.8%.The percentage of students who
responded that their grandparents/uncles/aunts/cousins influenced their leadership
development was 22.2%.The percentage of students who responded that their sibling(s)
influenced their leadership development was 16.7%.The percentage of students who
responded that their friend(s) influenced their leadership development was 50%.The
percentage of students who responded that their significant other influenced their
55

leadership development was 0.00%.The percentage of students who responded that their
husband/wife/children influenced their leadership development was 11.1% (Table 24).
Table 24: Information from Interviews
Individual who influenced leadership development
Number of People (as gathered from interviews)
Mother Influence 16/18 (88.9%)Father Influence 14/18 (77.8%)Mother & Father Influence 14/18 (77.8%)Grandparents/Uncles/Aunts/Cousins Influence 4/18 (22.2%)Sibling Influence 3/18 (16.7%)Friend Influence 9/18 (50%)Significant Other Influence 0/18 (0.00%)Husband/Wife/Children Influence 2/18 (11.1%)
Leadership & Religion
Ho17: Attending religious services is not related to the ability to “model the way”,
“inspire a shared vision”, “challenge the process”, “enable others to act”, or
“encourage the heart” in terms of leadership.
A Pearson correlation coefficient was calculated for the relationship between how
often participants attend religious services and SLPI pre-test responses (model the way,
inspire a shared vision, challenge the process, enable others to act, and encourage the
heart).
A strong positive correlation (p < .05) was found between the frequency of
attendance to religious services and self-model the way (r(39) = .35), self-inspire a shared
vision (r(39) = .38), self-challenge the process (r(39) = .37), self-enable others to act
(r(39) = .32), self-encourage the heart (r(39) = .46, p < .01).
Based on the results of this data output, the null hypothesis: there is no
relationship between the frequency of attending religious services and the influence to
lead is rejected (Table 25).
56

Table 25: Pearson Correlation-Attendance of Religious Services and Pre-Test SLPI
How often attend
religious services
Self- Model the Way
Self- Inspire
a shared vision
Self- Challenge
the Process
Self- Enable Others to Act
Self- Encourage the heart
How often attended religious services
Pearson Correlation
1 .35* .38* .37* .32* .46**
Sig. (2-tailed)
.02 .01 .02 .04 <.01
N 41 41 41 41 41 41
Ho18: Participating in prayer and/or meditation is not related to the ability to “model the
way”, “inspire a shared vision”, “challenge the process”, “enable others to act”, or
“encourage the heart” in terms of leadership.
A Pearson correlation coefficient was calculated to determine the relationship
between how often a participant prays or meditates and SLPI pre-test responses (model
the way, inspire a shared vision, challenge the process, enable others to act, and
encourage the heart).
A strong negative correlation (p < .05) was found for the frequency of prayer
and/or meditation and self-model the way (r(39) = -.32), self-inspire a shared vision
(r(39) = -.40), self-challenge the process (r(39) = -.42, p < .01), self-enable others to act
(r(39) = -.35), self-encourage the heart (r(39) = -.52, p < .01).
Based on the results of this data output, the null hypothesis: there is no
relationship between the frequency of prayer and/or meditation and the influence to lead
is rejected (Table 26).
57

Table 26: Pearson Correlation- Prayer/Meditation and Pre-Test SLPI
How often do you pray
or meditate
Self- Model
the Way
Self- Inspire
a shared vision
Self- Challenge
the Process
Self- Enable Others to Act
Self- Encourage the heart
How often do you pray or meditate
Pearson Correlation
1 -.32* -.40* -.42** -.35* -.52**
Sig. (2-tailed)
.043 .010 .006 .026 .001
N 41 41 41 41 41 41
A Spearman rho correlation coefficient was calculated to determine the
relationship between how often prays or meditates and SLPI pre-test responses (model
the way, inspire a shared vision, challenge the process, enable others to act, and
encourage the heart).
A moderate negative correlation (p > .05) was found for the frequency of prayer
and/or meditation and self-model the way (rho (39) = -.46), self-inspired a shared vision
(rho (39) = -.60), self-enable others to act (rho (39) = -.58), and self-encourage the heart
(rho (39) = -.58).
Correlations greater than 0.7 are considered strong, correlations less than 0.3 are
considered weak, and correlations between 0.3 and 0.7 are considered moderate. (Table
27).
Table 27: Spearman rho-Prayer/Meditation and Pre-Test SLPI
58

How often do
you pray or meditat
e
Self- Model the Way
Self- Inspir
e a shared vision
Self- Challeng
e the Process
Self- Enabl
e Others to Act
Self- Encourag
e the heart
Spearman's rho
How often do you pray or meditate
Correlation Coefficient
1.00 -.46 -.60* -.25 -.58* -.58*
Sig. (2-tailed)
. .129 .039 .425 .048 .048
N 41 12 12 12 12 12
Leadership and Volunteerism
Influence of Volunteerism on Participation in Other Activities Before College
Ho19: There is no relationship between community service participation before college
and event participation before college.
A Pearson correlation coefficient was calculated to determine the relationship
between community service activities prior to college and pre-test SLPI response (before
college events) scores.
A positive correlation was found between the two variables, r(40) = .36, p < .05.
Overall, there was a moderate positive correlation between participation in community
service before college and participation in events (sports/activism) before college (Table
28).
Based on the results of the data output, the null hypothesis: there is no
relationship between community service participation before college and event
participation before college is rejected.
Table 28: Pearson Correlation-Before College Community Service/Events
Self- Mod
el the
Way
Self- Inspire a
shared
visio
Self- Challenge the
Process
Self- Enab
le Others to Act
Self- Encourage the heart
Before college
community
service
Before college events
(sports/activism)
59

nBefore college community service
Pearson Correlation
.51** .48** .55** .56** .49** 1 .36*
Sig. (2-tailed) <.01 <.01 <.01 <.01 <.01 .02
N 40 40 40 40 40 40 40
Before college events (sports/activism)
Pearson Correlation
.16 .16 .11 .30 .21 .36* 1
Sig. (2-tailed) .31 .32 .49 .06 .19 .02
N 41 41 41 41 41 40 41
Influence of Volunteerism Throughout Life on Participation in Various College Activities
Ho20: There is no relationship between community service participation in elementary
school and participation in college sports.
A Pearson correlation coefficient was calculated to determine the relationship
between participation in required community service in elementary school and
participation in college sports.
A negative correlation was found between the two variables, r(42) = -.38, p < .05.
Overall, there was a moderate negative correlation between participation in required
community service in elementary school and participation in college sports (Table 29).
Based on the results in the data output, the null hypothesis: there is no relationship
between community service participation in elementary school and participation in
college sports is rejected.
Table 29: Pearson Correlation-Before College and In College
Did your
elementary
Did your high
school
Did any of your
course
Before college commu
nity
Before college events
(sports/a
In college
, commu
In college, exte
In college
,
In college, sport
60
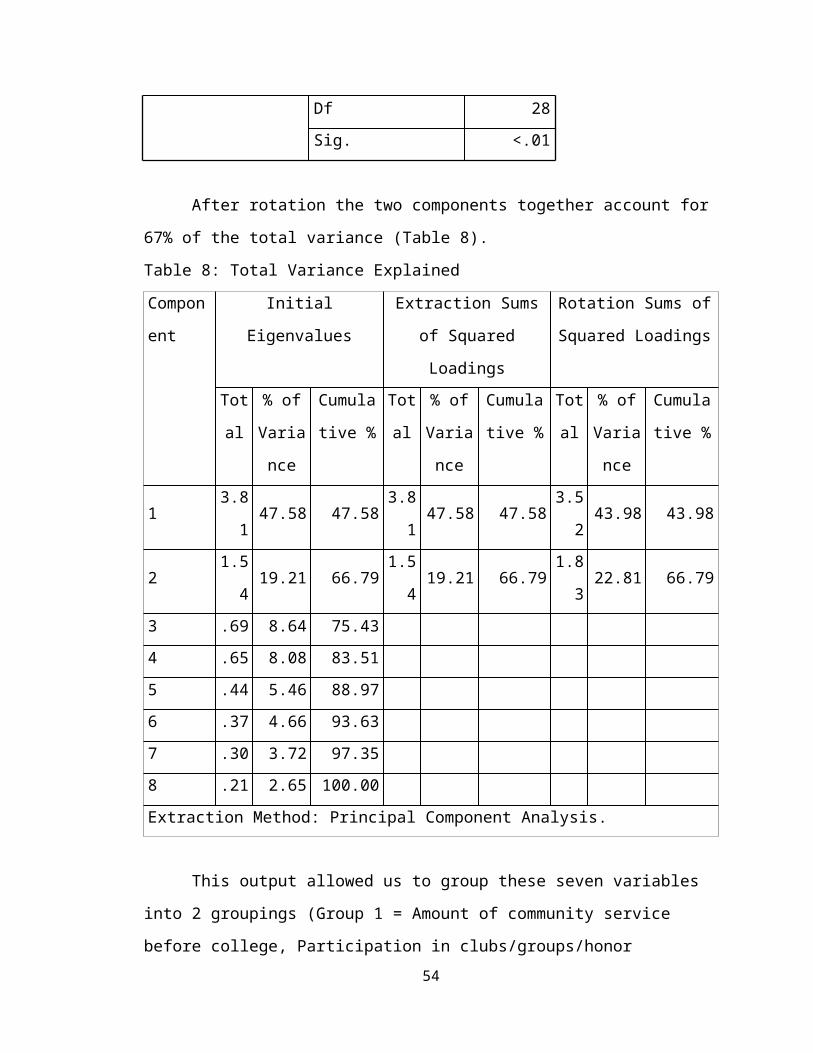
school require commu
nity service
require
community servic
e
s at BU
require
community servic
es
service ctivism) nity leaders
hip
rnal organization
school related
s
Did your elementary school require community service
Pearson Correlation
1 .26 -.13 .02 -.20 -.15 -.12 .28 -.38*
Sig. (2-tailed)
.09 .40 .90 .20 .35 .44 .07 .01
N 42 42 42 40 41 42 42 42 42
Did your high school require community service
Pearson Correlation
.26 1 .14 -.26 .09 -.01 -.06 -.03 -.07
Sig. (2-tailed)
.09 .39 .01 .56 .96 .73 .84 .66
N 42 42 42 40 41 42 42 42 42
Did any of your courses at BU require community service
Pearson Correlation
-.13 .14 1 -.24 -.08 -.09 -.23 -.28 .11
Sig. (2-tailed)
.40 .39 .14 .63 .55 .14 .07 .50
N 42 42 42 40 41 42 42 42 42
61

Before college community service
Pearson Correlation
.02 -.26 -.24 1 .36* .31 .41** .32* .25
Sig. (2-tailed)
.90 .01 .14 .02 .05 .01 .05 .12
N 40 40 40 40 40 40 40 40 40
Before college events (sports/activism)
Pearson Correlation
-.20 .09 -.08 .36* 1 .21 .25 .19 .49**
Sig. (2-tailed)
.20 .60 .63 .02 .19 .12 .23 <.01
N 41 41 41 40 41 41 41 41 41
In college, community leadership
Pearson Correlation
-.15 -.01 -.09 .31 .21 1 .51** .31* -.05
Sig. (2-tailed)
.35 .96 .55 .05 .19 <.01 .04 .77
N 42 42 42 40 41 42 42 42 42
In college, external organization
Pearson Correlation
-.12 -.06 -.23 .41** .25 .51** 1 .26 .09
Sig. (2-tailed)
.443 .7 .14 <.01 .12 <.01 .101 .59
N 42 42 42 40 41 42 42 42 42
In college, school related
Pearson Correlation
.28 -.03 -.28 .32* .19 .31* .26 1 -.03
Sig. .07 .84 .07 .05 .23 .04 .10 .88
62

(2-tailed)
N 42 42 42 40 41 42 42 42 42
In college, sports
Pearson Correlation
-.38* -.07 .11 .25 .49** -.05 .09 -.03 1
Sig. (2-tailed)
.01 .66 .50 .12 <.01 .77 .59 .88
N 42 42 42 40 41 42 42 42 42
Ho21: There is no relationship between participation in external organizations in college
and participation in community service before college.
A Pearson correlation coefficient was calculated to determine the relationship
between participation in external organizations in college and participation in community
service before college.
A positive correlation was found between the two variables, r(40) = .41, p < .01.
Overall, there was a moderate positive correlation between participation in external
organizations in college and participation in community service before college (Table
29).
Based on the results of the data output, the null hypothesis: there is no
relationship between participation in external organizations in college and participation in
community service before college is rejected.
Ho22: There is no relationship between participation in external organizations in college
and community leadership in college.
A Pearson correlation coefficient was calculated to determine the relationship
between participation in external organizations in college and community leadership in
college.
A positive correlation was found between the two variables, r(42) = .51, p < .01.
Overall, there was a moderate positive correlation between participation in external
organizations in college and community leadership in college (Table 29).
63

Based on the results of this data output, the null hypothesis: there is no
relationship between participation in external organizations in college and community
leadership in college is rejected.
Ho23: There is no relationship between participation in events (sports/activism) before
college and participation in college sports.
A Pearson correlation coefficient was calculated to determine the relationship
between participation in events (sports/activism) before college and participation in
college sports.
A positive correlation was found between the two variables, r(41) = .49, p < .01.
Overall, there was a moderate positive correlation between participation in events
(sports/activism) before college and participation in college sports (Table 29).
Based on the results of the data output, the null hypothesis: there is relationship
between participation in events (sports/activism) before college and participation in
college sports is rejected.
Ho24: There is no relationship between school-related community service and
community leadership in college.
A Pearson correlation coefficient was calculated to determine the relationship
between participation in school-related community service in college and community
leadership in college.
A positive correlation was found between the two variables, r(42) = .31, p < .05.
Overall, there was a moderate positive correlation between participation in school-related
community service in college and community leadership in college (Table 29).
Based on the results of the data output, the null hypothesis: there is no
relationship between school-related community service and community leadership in
college is rejected.
Ho25: There is no relationship between school-related community service and
community leadership before college.
A Pearson correlation coefficient was calculated to determine the relationship
between participation in school-related community service in college and community
service before college.
64

A positive correlation was found between the two variables, r(40) = .32, p < .05.
Overall, there was a moderate positive correlation between participation in school-related
community service in college and community leadership before college (Table 29).
Based on the results of the data set, the null hypothesis: there is no difference
between school-related community service and community leadership before college is
rejected.
Leadership & Leadership Styles
Hₒ26: There is no relationship between participating in community service activities
prior to college and SLPI response scores.
A Pearson correlation coefficient was calculated to determine the relationship
between participating in community service activities prior to college and pre-test SLPI
response (model the way) scores. A strong positive correlation was found (r(40) = .51, p
< .05) (Table 30).
Table 30: Correlations-SLPI
Self- Model the Way
Self- Inspir
e a share
d visio
n
Self- Challenge the
Process
Self- Enabl
e Others to Act
Self- Encourage the heart
Before college
community
service
Before college events (sports/activis
m)
Before college community service
Pearson Correlation .51** .48** .55** .56** .49** 1 .36*
Sig. (2-tailed) .001 .002 <.001 <.001 .001 .023
N 40 40 40 40 40 40 40
65

Before college events (sports/activism)
Pearson Correlation .16 .16 .11 .30 .21 .36* 1
Sig. (2-tailed) .310 .315 .488 .057 .193 .023
N 41 41 41 41 41 40 41
A Pearson correlation coefficient was calculated to determine the relationship
between participating in community service activities prior to college and pre-test SLPI
response (inspire a shared vision) scores. A strong positive correlation was found (r(40) =
.48, p < .05)(Table 30).
A Pearson correlation coefficient was calculated to determine the relationship
between participating in community service activities prior to college and pre-test SLPI
response (challenge the process) scores. A strong positive correlation was found (r(40)
= .55, p < .05)(Table 30).
A Pearson correlation coefficient was calculated to determine the relationship
between participating in community service activities prior to college and pre-test SLPI
response (enable others to act) scores. A strong positive correlation was found (r(40)
= .56, p < .05)(Table 30).
A Pearson correlation coefficient was calculated to determine the relationship
between participating in community service activities prior to college and pre-test SLPI
response (encourage the heart) scores. A strong positive correlation was found (r(40)
= .49, p < .05) (Table 30).
Based on the results of this data output, the null hypothesis: there is no
relationship between participating in community service activities prior to college and
SLPI response scores is rejected for model the way, inspire a shared vision, challenge the
process, enable others to act, and encourage the heart.
Hₒ27: There is no relationship between participating in sporting/activism events prior to
college and SLPI response scores.
A Pearson correlation coefficient was calculated to determine the relationship
between participating in sporting/activism events prior to college and pre-test SLPI
66

response (model the way, inspire a shared vision, challenge the process, enable others to
act, encourage the heart) scores. A weak, non-significant correlation was found for model
the way (r(41) = .16, p > .05), inspire a shared vision (r(41) = .16, p >.05), challenge the
process (r(41) = .11, p > .05), enable others to act (r(41) = .30, p > .05), encourage the
heart (r(41) = .21, p > .05)(Table 30).
Based on the results of the data output, the null hypothesis: there is no
relationship between participating in sporting/activism events prior to college and SLPI
response scores is accepted.
Hₒ28: There is no relationship between frequency of acting as a group leader and SLPI
response scores.
A Pearson correlation coefficient was calculated to determine the relationship
between SLPI pre-test response (model the way, inspire a shared vision, challenge the
process, enable others to act, encourage the heart) scores and the frequency of acting as a
group leader. A weak, non-significant correlation was found for model the way (r(42)
= .20, p > .05), inspire a shared vision (r(42) = .20, p > .05), challenge the process (r(42)
= .31, p > .05), enable others to act (r(42) = .13, p > .05), encourage the heart (r(42)
= .22, p > .05) (Table 31).
Based on the results of the data output, the null hypothesis: there is no
relationship between frequency of acting as a group leader and SLPI response scores for
model the way, inspire a shared vision, challenge the process, enable others to act, and
encourage the heart is accepted.
67

Table 31: Pearson Correlation-Leadership and SLPI
Self- Model the Way
Self- Inspir
e a share
d vision
Self- Challeng
e the Process
Self- Enabl
e Others to Act
Self- Encourag
e the heart
How often did you act in the role of
a group leader
responsible for
organizing,
directing, and
motivating others
How often did you seek to be a group leader when the opportunity presents
How often did you
Pearson Correlatio
.20 .20 .31 .13 .22 1 .40**
68

act in the role of a group leader responsible for organizing, directing, and motivating others
n
Sig. (2-tailed) .21 .22 .05 .41 .16 <.01
N 41 41 41 41 41 41 41
How often did you seek to be a group leader when the opportunity presents
Pearson Correlation
.43** .31* .46** .04 .33* .43** 1
Sig. (2-tailed) <.01 .05 <.01 .82 .04 <.01
N 41 41 41 41 41 41 41
Hₒ29: There is no relationship between frequency of seeking out leadership opportunities
and SLPI response scores.
A Pearson correlation coefficient was calculated to determine the relationship
between SLPI pre-test response (model the way) scores and the frequency of seeking to
act as a group leader. A strong positive correlation was found for model the way (r(42)
= .43, p < .05)indicating a significant linear relationship between the two variables (Table
31).
A Pearson correlation coefficient was calculated to determine the relationship
between SLPI pre-test response (inspire a shared vision) scores and the frequency of
seeking to act as a group leader. A strong positive correlation was found for model the
69

inspire a shared vision (r(42) = .31, p < .05)indicating a significant linear relationship
between the two variables (Table 31).
A Pearson correlation coefficient was calculated to determine the relationship
between SLPI pre-test response (challenge the process) scores and the frequency of
seeking to act as a group leader. A strong positive correlation was found for challenge the
process (r(42) = .46, p < .05)indicating a significant linear relationship between the two
variables (Table 31).
A Pearson correlation coefficient was calculated to determine the relationship
between SLPI pre-test response (encourage the heart) scores and the frequency of seeking
to act as a group leader. A strong positive correlation was found for encourage the heart
(r(42) = .40, p < .05) indicating a significant linear relationship between the two variables
(Table 31).
A Pearson correlation coefficient was calculated examining the relationship
between SLPI pre-test response (enable others to act) scores and the frequency of seeking
to act as a group leader. A weak, non-significant correlation was found for enable others
to act (r(42) = .04, p > .05) (Table 31).
Based on the results of this data output, the null hypothesis: there is no
relationship between frequency of seeking out leadership opportunities and SLPI
response scores is rejected for model the way, inspire a shared vision, challenge the
process and encourage the heart but is accepted for enable others to act.
Hₒ30: Individuals’ GPA does not have any effect on SLPI scores.
A one-way MANOVA was calculated to determine the effect of GPA and pre-test
SLPI response (model the way, inspire a shared vision, challenge the process, enable
others to act, encourage the heart) scores. No significant effect was found (Lambda (15,
91.5) = .71, p > .05) (Table 34).
Based on the results of this data output, the null hypothesis individuals’ GPA does
not have any effect on SLPI scores is accepted.
An interesting point to note is the GPA range of 33.49 had the highest mean
across all SLPI sections although no significance was seen.
70
Table 32: Descriptive Statistics-GPA and SLPI
Grade point average
Mean Std. Deviation
N
Self- Model the Way
3.5-4 23.90 3.18 213-3.49 24.00 3.22 112.5-2.99 23.33 4.46 62-2.49 23.00 7.00 3Total 23.78 3.56 41
Self- Inspire a shared vision
3.5-4 24.14 3.68 213-3.49 25.00 2.90 112.5-2.99 24.33 3.08 62-2.49 24.67 7.57 3Total 24.44 3.61 41
Self- Challenge the Process
3.5-4 24.52 3.53 213-3.49 24.55 2.77 112.5-2.99 24.17 3.54 62-2.49 24.00 5.29 3Total 24.44 3.34 41
71

Self- Enable Others to Act
3.5-4 25.29 2.67 213-3.49 25.91 2.55 112.5-2.99 27.33 1.51 62-2.49 26.33 2.52 3Total 25.83 2.51 41
Self- Encourage the heart
3.5-4 24.76 3.77 213-3.49 25.82 2.23 112.5-2.99 24.50 3.62 62-2.49 25.33 5.51 3Total 25.05 3.43 41
Table 33: Grand Mean
Dependent Variable Mean
Std. Error
95% Confidence IntervalLower Bound
Upper Bound
Self- Model the Way 23.56 .74 22.07 25.05Self- Inspire a shared vision 24.54 .75 23.02 26.05
Self- Challenge the Process 24.31 .69 22.91 25.71Self- Enable Others to Act 26.22 .50 25.20 27.23Self- Encourage the heart 25.10 .70 23.68 26.53
Table 34: Multivariate Tests
Effect Value F Hypothesis df
Error df
Sig. Partial Eta Squared
Intercept Pillai's Trace .99 503.46b 5.00 33.00 <.001 .98
Wilks' Lambda .01 503.46b 5.00 33.00 <.001 .99
Hotelling's Trace 76.28 503.46b 5.00 33.00 <.001 .99
Roy's Largest Root 76.28 503.46b 5.00 33.00 <.001 .99
T18A Pillai's Trace .31 .80 15.00 105.00 .68 .10
Wilks' Lambda .71 .80 15.00 91.50 .68 .11
Hotelling's Trace .38 .80 15.00 95.00 .68 .11
Roy's Largest .28 1.96c 5.00 35.00 .11 .22
72

Root
Hₒ31: The leadership training program will have no effect on pre-test to posttest SLPI
scores.
The pre-test for model the way (M = 23.83, sd = 4.09)and the post-test for model
the way (M = 26.33, sd= 3.60). A significant increase from pre-test SLPI scores to
posttest SLPI scores was found (t(11) = 3.51, p < .05).(Table 36)
A paired-sample t -test was calculated to compare the mean pre-test SLPI
response (challenge the process) scores to the mean posttest SLPI response scores. The
pre-test for challenge the process (M = 24.50, sd= 2.94) and the post-test for challenge
the process (M = 26.17, sd= 3.10). A significant increase from pre-test SLPI scores to
posttest SLPI scores was found (t(11) = 2.64, p < .05). (Table36)
A paired-sample t-test was calculated to compare the mean pre-test SLPI response
(inspire a shared vision, enable others to act, encourage the heart) scores to the mean
posttest SLPI response scores. The pre-test for inspire a shared vision (M = 24.92, sd =
3.32), enable others to act (M = 25.75, sd= 2.53), encourage the heart (M = 25.33, sd=
3.08) and the posttest for inspire a shared vision (M = 26.08 sd= 2.91), enable others to
act (M = 26.50, sd= 3.15), encourage the heart (M = 25.92, sd= 4.48). No significant
difference from the pre-test to the posttest was found for inspire a shared vision (t(11) =
2.18, p > .05), enable others to act (t(11) = -.96, p >.05), encourage the heart (t(11) =
-.85, p > .05)(Table 36).
Based on the results of this data output, the null hypothesis: the leadership course
will have no effect on pre-test to posttest SLPI scores is rejected for model the way and
challenge the process but is accepted for inspire a shared vision, enable others to act, and
encourage the heart.
Table 35: Paired Samples Statistics
Mean N Std. DeviationStd. Error Mean
Pair 1 Self- Model the Way 23.83 12 4.09 1.18
Self- Model the Way 26.33 12 3.60 1.04
Pair 2 Self- Inspire a shared vision 24.92 12 3.32 .96
73

Self- Inspire a shared vision 26.08 12 2.91 .84
Pair 3 Self- Challenge the Process 24.50 12 2.94 .85
Self- Challenge the Process 26.17 12 3.10 .89
Pair 4 Self- Enable Others to Act 25.75 12 2.53 .73
Self- Enable Others to Act 26.50 12 3.15 .91
Pair 5 Self- Encourage the heart 25.33 12 3.08 .89
Self- Encourage the heart 25.92 12 4.48 1.29
Table 36: Paired Samples t-Test
Paired Differences Mean Std. Deviation t df Sig. (2-
tailed)Pair 1
Self- Model the Way - Self- Model the Way -2.50 2.47 -3.51 11 .005
Pair 2
Self- Inspire a shared vision - Self- Inspire a shared vision -1.17 1.85 -2.18 11 .052
Pair 3
Self- Challenge the Process - Self- Challenge the Process -1.67 2.19 -2.64 11 .023
Pair 4
Self- Enable Others to Act - Self- Enable Others to Act -.75 2.70 -.96 11 .357
Pair 5
Self- Encourage the heart - Self- Encourage the heart -.58 2.39 -.85 11 .416
Hₒ32: The leadership training program will have no effect on pre-test to posttest SLPI
scores in males.
A paired-samples t-test was calculated to compare the mean pre-test SLPI
response (model the way) scores to the mean posttest SLPI response scores for males.
The pre-test for model the way (M = 22.40, sd= 5.50) and the posttest for model the way
(M = 26.00, sd= 3.74). A significant increase from pre-test SLPI scores to posttest SLPI
scores was found (t(4) = 3.50, p < .05)(Table 38).
A paired-samples t-test was calculated to compare the mean pre-test SLPI
response (challenge the process) scores to the mean posttest SLPI response scores for
males. The pre-test for challenge the process (M = 23.40, sd= 4.16) and the posttest for
challenge the process (M = 25.80, sd= 3.90). A significant increase from pre-test SLPI
scores to posttest SLPI scores was found (t(4) = 2.95, p < .05) (Table 38).
74

A paired-samples t-test was calculated to compare the mean pre-test SLPI
response (inspire a shared vision, enable others to act, encourage the heart) scores to the
mean posttest SLPI response scores for males. The pre-test for inspire a shared vision (M
= 23.60, sd = 3.36), enable others to act (M = 25.40, sd= 3.64), encourage the heart (M =
25.40, sd= 2.79) and the posttest for inspire a shared vision (M = 26.00, sd= 2.83), enable
others to act (M = 27.40, sd= 2.79), encourage the heart (M = 26.60, sd= 3.85). No
significant difference from the pre-test scores to the post-test scores was found for inspire
a shared vision (t(4) = 2.59, p > .05), enable others to act (t(4) = 1.58, p > .05),
encourage the heart (t(4) = 1.00, p > .05) (Table38).
Based on the results of this data output, the null hypothesis: the leadership course
will have no effect on pre-test to posttest SLPI scores in males is rejected for model the
way and challenge the process but is accepted for inspire a shared vision, enable others to
act, and encourage the heart.
Table 37: Paired Samples Statistics Male
Mean N Std. Deviation Std. Error Mean
Pair 1 Self- Model the Way 22.40 5 5.50 2.46
Self- Model the Way 26.00 5 3.74 1.67
Pair 2 Self- Inspire a shared vision 23.60 5 3.36 1.50
Self- Inspire a shared vision 26.00 5 2.83 1.26
Pair 3 Self- Challenge the Process 23.40 5 4.16 1.86
Self- Challenge the Process 25.80 5 3.90 1.74
Pair 4 Self- Enable Others to Act 25.40 5 3.65 1.63
Self- Enable Others to Act 27.40 5 2.79 1.25
Pair 5 Self- Encourage the heart 25.40 5 2.79 1.25Self- Encourage the heart 26.60 5 3.85 1.72
75

a. Gender = male
Table 38: Paired Samples Test Male
Paired Differences Mean Std. Deviation t df Sig. (2-
tailed)
Pair 1 Self- Model the Way - Self- Model the Way -3.60 2.30 -3.50 4 .025
Pair 2 Self- Inspire a shared vision - Self- Inspire a shared vision -2.40 2.07 -2.59 4 .061
Pair 3 Self- Challenge the Process - Self- Challenge the Process -2.40 1.82 -2.95 4 .042
Pair 4 Self- Enable Others to Act - Self- Enable Others to Act -2.00 2.83 -1.58 4 .189
Pair 5 Self- Encourage the heart - Self- Encourage the heart -1.20 2.68 -1.00 4 .374
a. Gender = male
Hₒ33: The leadership training program will have no effect on pre-test to post-test SLPI
scores in females.
A paired- samples t- test was calculated to compare the mean pre-test SLPI
response (model the way, inspire a shared vision, challenge the process, enable others to
act, encourage the heart) scores to the mean posttest SLPI response scores for females.
The pre-test for model the way (M = 24.86, sd= 2.73), inspire a shared vision (M = 25.86,
sd = 3.18), challenge the process (M = 25.29, sd= 1.60), enable others to act (M = 26.00,
sd= 1.63), encourage the heart (M = 25.29, sd= 3.50) and the posttest for model the way
(M = 26.57, sd= 3.78), inspire a shared vision (M = 26.14, sd= 3.18), challenge the
process (M = 26.43, sd= 2.70), enable others to act (M = 25.86, sd= 3.44), encourage the
heart (M = 25.43, sd= 5.13). No significant difference from the pre-test scores to the
posttest scores was found for model the way (t(6) = 1.87, p > .05), inspire a shared vision
(t(6) = -.68, p > .05), challenge the process (t(6) = 1.26, p > .05), enable others to act (t(6)
= .16, p > .05), encourage the heart (t(6 )= -.17, p > .05) (Table 40).
76

Based on the results of this data output, the null hypothesis: the leadership
training program will have no effect on pre-test to posttest SLPI scores in females is
accepted.
Table 39: Paired Samples Statistics Female
Mean N Std. Deviation
Std. Error Mean
Pair 1 Self- Model the Way 24.86 7 2.73 1.03
Self- Model the Way 26.57 7 3.78 1.43
Pair 2 Self- Inspire a shared vision 25.86 7 3.18 1.20
Self- Inspire a shared vision 26.14 7 3.18 1.20
Pair 3 Self- Challenge the Process 25.29 7 1.60 .61
Self- Challenge the Process 26.43 7 2.70 1.02
Pair 4 Self- Enable Others to Act 26.00 7 1.63 .62
Self- Enable Others to Act 25.86 7 3.44 1.30
Pair 5 Self- Encourage the heart 25.29 7 3.50 1.32Self- Encourage the heart 25.43 7 5.13 1.94
77

a. Gender = female
Table 40: Paired Samples Test Female
Paired Differences
Mean Std. Deviation t df Sig. (2-tailed)
Pair 1
Self- Model the Way - Self- Model the Way
-1.71 2.43 -1.87 6 .111
Pair 2
Self- Inspire a shared vision - Self- Inspire a shared vision
-.29 1.11 -.68 6 .522
Pair 3 Self- Challenge the Process - Self-
-1.14 2.41 -1.26 6 .256
78

Challenge the Process
Pair 4
Self- Enable Others to Act - Self- Enable Others to Act
.14 2.41 .16 6 .881
Pair 5
Self- Encourage the heart - Self- Encourage the heart
-.14 2.27 -.17 6 .873
a. Gender = female
Figure 5: Model the Way
79

80

Figure 6: Challenge the Process
Leadership & Self-Efficacy
Hₒ34: There is no difference between Group 111 (experimental group) and Group 222
(match group) and self-efficacy scores.
An independent sample t-test was used to compare the mean scores of self-
efficacy for managerial/administrative, charisma, taking action, and personalization
between the experimental and match leadership groups. The (Sig) p value is greater
than α for all four independent t-tests (SE1 – SE4). We assume the variances are equal
(Table 41).
81

Table 41: Independent Sample Test-Variance
Levene's Test for Equality of Variances
t-test for Equality of Means
F Sig. T df Sig. (2-tailed)
SE1- Managerial/administrative
Equal variances assumed
.02 .90 -.42 38
Equal variances not assumed
-.42 38.00
SE2- Charisma Equal variances assumed
1.03 .32 .21 39
Equal variances not assumed
.21 37.63
SE3- Taking action
Equal variances assumed
.11 .74 .04 39
Equal variances not assumed
.04 36.66
SE4- Personalization
Equal variances assumed
.02 .90 -.62 39
Equal variances not assumed
-.62 38.38
A t-test failed to reveal a statistically significant difference between the mean
number of SE1 that the experimental group had (M = 5.69, sd = .98) and that the match
group had (M = 5.82, sd = 1.0), t(38) = .42, p = .68, α = .05. A t-test failed to reveal a
statistically significant difference between the mean number of SE2 that the experimental
group had (M = 5.80, sd = .83) and that the match group had (M = 5.74, sd = 1.06), t(39)
= .21, p = .84, α = .05. A t-test failed to reveal a statistically significant difference
between the mean number of SE3 that the experimental group had (M = 5.92, sd= .84)
and that the match group had (M = 5.91, sd = 1.14), t(39) = .04, p = .97, α = .05. A t-test
failed to reveal a statistically significant difference between the mean number of SE4 that
the experimental group had (M = 4.98, sd = 1.15) and that the match group had (M =
5.19, sd = 1.07), t(39) = .62, p = .54, α = .05 (Table 42).
82

Table 42: Independent Sample Test-Comparison of Experimental and Match Group
Group # N Mean Std. Deviation Std. Error Mean
SE1- Managerial/administrative 111.00 20 5.69 .98 .22
222.00 20 5.82 .99 .22
SE2- Charisma 111.00 20 5.80 .83 .19
222.00 21 5.74 1.06 .23
SE3- Taking action 111.00 20 5.92 .84 .19
222.00 21 5.90 1.14 .25
SE4- Personalization 111.00 20 4.98 1.15 .26
222.00 21 5.19 1.07 .23
Hₒ35: There is no relationship between the self-efficacy pre-test scores and age.
A Pearson correlation coefficient was calculated to determine the relationship
between self-efficacy pre-test scores and age (SE1: managerial/administrative, SE2:
charisma, SE3: taking action, and SE4: personalization). No significant correlations (p
< .05) were found when examining the relationship between self-efficacy pre-test scores
and age responses of SE1: managerial/administrative (r(37) = .65), SE2: charisma (r(38)
= .69), SE3: taking action (r(38) = .13), and SE4: personalization (r(38) = .96) (Table
43).
Based on the results of this data output, the null hypothesis: there is no
relationship between the self-efficacy pre-test scores and age is accepted.
Table 43: Pearson Correlation-Self-Efficacy Pre-Test and Age
Age
SE1- Managerial/administrative
SE2- Charisma
SE3- Taking action
SE4- Personalization
Age
Pearson Correlation
1 .08 .07 .25 -.01
Sig. (2-tailed)
.65 .69 .13 .96
N 39 37 38 38 38
83

Hₒ36: There is no relationship between the self-efficacy posttest scores and age.
A Pearson correlation coefficient was calculated for the relationship between self-
efficacy posttest scores and age (SE1: managerial/administrative, SE2: charisma, SE3:
taking action, and SE4: personalization). No significant correlations (p < .05) were found
when examining the relationship between self-efficacy posttest scores and age responses
of SE1: managerial/administrative (r(8) = .94), SE2: charisma (r(8) = .70), SE3: taking
action (r(8) = .77), and SE4: personalization (r(8) = .97) (Table 44).
Based on the results of this data output, the null hypothesis: there is no
relationship between the self-efficacy posttest scores and age is accepted.
Table 44: Pearson Correlation- Self-Efficacy Posttest and Age
Age
pSE1- Managerial/administrative
pSE2- Charisma
pSE3- Taking action
pSE4- Personalization
Age
Pearson Correlation
1 .03 .17 .13 -.02
Sig.(2-tailed)
.94 .70 .77 .97
N 39 8 8 8 8
Hₒ37: There is no difference between the pre and posttest scores for SE1:
managerial/administrative in relation to leadership.
A paired-samples t-test was used to compare the mean pre and posttest scores for
self-efficacy (SE1: managerial/administrative). The pre-test for SE1:
managerial/administrative (M = 5.66, sd = 1.19) and posttest for pSE1:
managerial/administrative (M = 6.11, sd =1.19) (Table 45).
Based on the results of this data output, the null hypothesis: there is no difference
between the pre and posttest scores for SE1: managerial/administrative in relation to
leadership is accepted.
84

Table 45: Pearson Correlation-Pre and Posttest Self-Efficacy
Mean N Std. Deviation
Pair 1
SE1- Managerial/administrative
5.66 7 1.19
pSE1- Managerial/administrative
6.11 7 1.19
Pair 2 SE2- Charisma 5.82 7 1.03pSE2- Charisma 6.00 7 .84
Pair 3 SE3- Taking action 5.90 7 .88pSE3- Taking action 5.86 7 .92
Pair 4 SE4- Personalization 5.14 7 1.07pSE4- Personalization 5.79 7 .99
Hₒ38: There is no difference between the pre and posttest scores for SE2: charisma in
relation to leadership.
A paired-samples t-test was used to compare the mean pre and posttest scores for
self-efficacy (SE2: charisma). The pre-test for SE2: charisma (M = 5.82, sd = 1.03) and
posttest for pSE2: charisma (M = 6.00, sd = .84) (Table 45).
Based on the results of this data output, the null hypothesis: there is no difference
between the pre and posttest scores for SE2: charisma in relation to leadership is
accepted.
Hₒ39: There is no difference between pre and posttest scores for SE3: taking action in
relation to leadership.
A paired-samples t-test was used to compare the mean pre and posttest scores for
self-efficacy (SE3: taking action). The pre-test for SE3: taking action (M = 5.90, sd = .88)
and posttest for pSE2: charisma (M = 5.86, sd = .92) (Table 45).
Based on the results of this data output, the null hypothesis: there is no difference
between the pre and posttest scores for SE3: taking action in relation to leadership is
accepted.
Hₒ40: There is no difference between the pre and posttest scores for SE4: personalization
in relation to leadership.
85

A paired-samples t-test was used to compare the mean pre and posttest scores for
self-efficacy (SE4: personalization). The pre-test for SE4: personalization (M = 5.14, sd =
1.07) and posttest for pSE2: personalization (M = 5.79, sd = .99) (Table 45).
Based on the results of this data output, the null hypothesis: there is no difference
between the pre and posttest scores for SE4: personalization in relation to leadership is
accepted.
Table 46: Paired Samples Test-Pre and Posttest Self-Efficacy
Paired Differences t df
Sig. (2-
tailed)Mean Std.
DeviationStd.
Error Mean
95% Confidence
Interval of the Difference
Lower Upper
Pair 1
SE1- Managerial/administrative - pSE1- Managerial/administrative
-.46 .36 .14 -.79 -.12 -3.36 6 .02
Pair 2
SE2- Charisma - pSE2- Charisma
-.18 .19 .07 -.35 -.01 -2.5 6 .05
Pair 3
SE3- Taking action - pSE3- Taking action
.05 .63 .24 -.54 .63 .20 6 .85
Pair 4
SE4- Personalization - pSE4- Personalization
-.64 .63 .24 -1.22 -.06 -2.7 6 .04
86

CHAPTER 5
DISCUSSION
Conclusions
“How do university students develop as leaders?” was the primary guiding
question that initiated our research. To answer this question we focused our research on
current leaders at a university and asked them several questions regarding their age and
gender, as well as questions concerning campus involvement, volunteerism, religion, and
their parent’s involvement in their lives. The nature of our mixed methods approach
offered easy documentation through journal articles, books, and special interest groups
(33). The importance of our study lies in the data collected and analyzed using the SPSS
software.
There were many significant factors encompassing the themes researched that had
an impact on the development of the university leaders. There were significant gender
differences in the self-reported skills of “enabling others to act” as well as the percentile
scores for “modeling the way” and “enabling others to act.” There was a significant
correlation between the attendance frequency of religious services and all of the
leadership categories in the SLPI. Coinciding with their attendance at religious services is
the frequency of prayer and/or meditation, which also had a strong significance for each
leadership category. Also, there is a significant relationship between school-related
community service and community leadership in college.
Applications
All across the country, universities are sifting through applications from graduate
school hopefuls as well as students who are interested in joining an accredited dietetic
internship program. Students applying for these programs strive to make their application
noticeable to those reviewing and making the final decisions for acceptance. Making
87

applications “noticeable” is usually done by volunteering, conducting research, obtaining
leadership positions, and having work experience in the field of interest. Our study on
leadership should be considered for use by admission counselors and board members
alike when choosing applicants for graduate school or specifically, for dietetic
internships. Leadership is not considered a primary focus on current applications for most
institutions, but would benefit both students and universities. Future related research can
further the discussion on the importance of leadership and the acceptance of dietetic
students into dietetic internships. Using similar methods, extending the research to
dietetic students could potentially offer insight into which applicants offer higher success
rates in their future endeavors as registered dietitians.
In a pilot study conducted by Jessica Frein, titled, “Measuring the Impact of
Leadership and Professionalism Training on Dietetic Students at the University of
Wisconsin-Stout,” the effects of a leadership program on dietetic students were
examined. Many similarities regarding methodology and findings are seen between this
pilot study and our study. The students at the university were evaluated using the SLPI
adapted from the LPI. Frein’s study also used demographic data to determine any effects
it may have on leadership characteristics. The findings of this study coincide with our
findings regarding the leadership category “challenging the process.”Frein stated, “the
leadership practice challenging the process, is involved with searching out opportunities
to grow and improve, as well as taking risks and experimenting to learn” (34).
In a study conducted by Dugan and Komives, factors associated with leadership
development in college students utilizing a multi-institutional national study were
examined. Similarities regarding changes in leadership over time were seen between this
multi-institutional study and our study. Students' perceptions on leadership changed over
time as did pre-test to posttest SLPI scores based on the multi-institutional study and our
study, respectively. Based on the results of our study, the leadership training program did
have an effect on pre-test to posttest SLPI scores in the categories of model the way and
challenge the process. According to the findings of the study conducted by Dugan and
Komives, the students' perceptions of leadership positively increased for consciousness of
self and leadership efficacy after completion of the leadership training program (3). The
88

students’ perceptions of leadership also positively increased for congruence,
collaboration, common purpose, citizenship, and change, but to a lesser degree. In
general, it was determined that short, moderate, and long-term leadership training
experiences all had significant effects on leadership efficacy (in comparison with no
leadership training) (3). Although our study did find an increase from pre-test to post-test
SLPI scores (specifically in males), a larger sample size may have provided us with even
more significant results, making the results more generalizable.
Generalizability
The issue of limited generalizability is present in our current study. With a
limited generalizability, applying the results to other colleges and institutions would be
more difficult. Our sample is unique and our research site offers a smaller sample size
due to the size of the institution. The relatively small sample size amongst the
experimental group (pre-test, post-test) also makes our results difficult to apply to the
general population.
Our results from the SLPI are highly generalizable since the SLPI is used
throughout the United States. Therefore, other researchers utilizing the SLPI should be
able to draw conclusions and compare their results with those of our study.
Limitations
There are some limitations within our study that have an effect on future
implications. We gathered quantitative and qualitative data, with the majority of the data
being quantitative. Qualitative data was not able to be analyzed due to unobtainable
NVivo software. This software is used for qualitative and mixed methods research and is
used to collect, organize, and analyze content in order to uncover subtle connections and
justify findings. This software would have been beneficial for analyzing the information
provided from the paired interviews that were conducted during the study.
89

Recommendations
Recommendations for further research include the use of NVivo to further
connect and comprehend the quantitative data output obtained from the SPSS software.
Improvements can also be made on the sample population by ensuring that institutions
conducting future studies have larger student populations. Conducting a study similar to
ours, but on a larger scale, may provide more insight and possible significant findings
surrounding the themes and their impact on the development of university leaders. Also,
it may be beneficial to extend the sample size to individuals other than active leaders,
providing a broader scope of individuals that are included in studies. By doing so, further
connections may be seen existing between leaders and non-leaders. Extensive research
comparing two separate groups (non-leaders and current leaders) may also be beneficial
to examine differences seen in these two groups and how they relate to the leadership
themes researched.
90

REFERENCES
1. Peronja I, Russo A, Zekan S. Linking theory with practice: Students perceptions of leaders and leadership characteristics. Social and Behavioral Sciences. 2012; 41:237-242.
2. Jowkar B, Mozhgan A, Nadergholi G, Parivash J. Student leadership competencies development. Social and Behavioral Sciences. 2011; 15:1616-1620.
3. Dugan J, Komives S. Developing leadership capacity in college students: Findings from a national study. A report from the multi-institutional study of leadership. National Clearinghouse for Leadership Programs. 2007.
4. Frien J. Measuring the Impact of Professionalism and Leadership Training on Dietetic Students at the University of Wisconsin-Stout. [Food and Nutritional Science]. ; 2006
5. Hunter A. Leadership Development of Registered Dietitians. [Nutrition and Health Sciences]. ; 2009.
6. Hunter A, Lewis N, Ritter-Gooder P. Constructive Development Theory: An Alternative Approach to Leadership. Journal of the American Dietetic Association. 2011;111(12):1804-1808.
7. Weaver D. Leadership Characteristics of the Dietetic Professionals in Ohio. [Food and Nutrition]. ; 2008
8. Sahgal P, Pathak A. Transformational Leaders; their socialization, self-concept, and shaping experiences. International Journal of Leadership Studies. 2007;2(3):263-279.
9. Dunham C, Bengston V. The Long-term Effects of Political Activism on Intergenerational Relations. Youth and Society. 1992;24:31-51.
10. Zaff J, Moore K, Papillo A, Williams S. Implications of Extracurricular Activity Participation during Adolescence on Positive Outcomes. Journal of Adolescent Research. 2003;18:599-630.
11. Ladewig H, Thomas J. Assessing the Impact on Former 4-H Members. Texas A&M University; 1987.
12. Weertz D, Ronca J. Characteristics of Alumni Donors who Volunteer at their Alma Mater. Research in Higher Education. 2008;49(3):274-292.
13. Penner L. Dispositional and Orginizational Influences on Sustained Volunteerism: An Interactionist Perspective. Journal of Social Issues. 2002;58(3):447-467.
14. Volunteering in the United States. United States Department of Labor Web site. http://www.bls.gov/news.release/volun.nr0.htm. Updated 2013. Accessed February, 27, 2013.
15. Clary G, Snyder M. The Motivations to Volunteer: Theoretical and Practical Considerations. American Psychology Society. 1999;8(5):156-159.
16. Marte E, Pozzi M. Young People and Volunteerism: A Model of Sustained Volunteerism During the Transition to Adulthood. J Adult Dev. 2008;15:35-46.
17. Zhang Z, Ilies R, Arvey R. Beyong genetic explanations for leadership: the moderating role of the social environment. Organizational Behavior and Human Decision Processes. 2009;110:118-128.
18. Hartman S, Harris J. The role of parental influence in leadership. The Journal of Social Psychology. 2010;132(2):153-167.
91

19. Zacharatos A, Barling J, Kelloway K. Development and effects of transformational leadership in adolescents. Leadership Quarterly. 2000;11(2):211-226.
20. Webb K. Creating Satisfied Employees in Christian Higher Education: Research on Leadership Competencies. Christian Higher Education. 2009;8:18-31.
21. Oh S. Leadership Emergence in Autonomous Work Teams: Who is More Willing to Lead? Society for Personality Research. 2012;40(9):1451-1464.
22. Fry L, Sweeney P. Character DevelopementThrough Spiritual Leadership. Consulting Psychology Journal: Practice and Research. 2012;64(2):89-107.
23. McCormick M, Tanguma J, Lopez-Forment A. Extending Self-efficacy to Leadership: A Review and Imperical Test. J Lead Ed. 2002;1(2):34-47.
24. Walumbwa F, Hartnell C. Understanding Transformational Leadership-Employee Performance Links: The role Relational Identification and Self-efficacy. J Occup Organ Psych. 2011;84:153-172.
25. Anderson D, Krajewski H, Goffin R, Jackson D. A Leadership Self-efficacy Taxonomy and its Relation to Effective Leadership. Leadership Quarterly. 2008:595-608.
26. Schyns B, Sczesny S. Leadership Attributes Valence in Self-concept and Occupational Self-efficacy. Int J Career Manage. 2010;15:78-92.
27. McDonagh K, Paris N. The Leadership Labyrinth: Leveraging the Talents of Women to Transform Health Care. Nurs Admin Q. 2013;37(1):6-12.
28. Fontenot T. Leading Ladies: Women in Healthcare Leadership. Frontiers of Health Services Management. 2012;28(4):11-21.
29. Elsesser K, Lever J. Does Gender Bias Against Female Leaders Persist? Quantitative and Qualititative Data from a Large Scale Study. Human Relations. 2011;64:1555-1578.
30. McDonagh K, Paris N. The Leadership Labyrinth: Career Advancement for Women. Frontiers of Health Services Management. 2012;28(4):22-28.
31. Price A, Howard D. Connect for Success: Social Leadership, Mentorship, and the Female Healthcare Exectutive. Frontiers of Health Services Management [mentorship]. 2012;28(4):33-38.
32. Eagly A. Female Leadership Advantage and Disadvantage: Resolving the Contradictions. Psychology of Women Quarterly. 2007;31:1-12.
33. Creswell J. Research design: Qualitative, quantitative, and mixed methods approaches (3rd ed.) (2009). Thousand Oaks, CA: Sage.
34. Frein J. Measuring the Impact of Professionalism and Leadership Training on Dietetic Students at the University of Wisconsin-Stout. [Master of Science]. Wisconsin: University of Wisconsin-Stout; 2006.
92