
Thesis Draft - SalmaBakr - Feb2012€¦ · Computer Science at Kassel University in Partial...
86
DESIGN, SIMULATION, AND EMULATION OF A RESIDENTIAL LOAD MANAGEMENT ALGORITHM UTILIZING A PROPOSED SMART GRID ENVIRONMENT FOR THE MENA REGION Salma Bakr A Thesis Submitted to the Faculty of Engineering at Cairo University and Faculty of Electrical Engineering and Computer Science at Kassel University in Partial Fulfillment of the Requirement for the Degree of MASTER OF SCIENCE Under Supervision of Mohamed Elsobki Professor in Electric Power Engineering Department Faculty of Engineering, Cairo University CAIRO UNIVERSITY, EGYPT KASSEL UNIVERSITY, GERMANY MARCH 2012
Transcript of Thesis Draft - SalmaBakr - Feb2012€¦ · Computer Science at Kassel University in Partial...

DESIGN, SIMULATION, AND EMULATION OF A RESIDENTIAL LOAD MANAGEMENT ALGORITHM
UTILIZING A PROPOSED SMART GRID ENVIRONMENT FOR THE MENA REGION
Salma Bakr
A Thesis Submitted to the Faculty of Engineering at Cairo University and Faculty of Electrical Engineering and
Computer Science at Kassel University in Partial Fulfillment of the Requirement for the Degree of
MASTER OF SCIENCE
Under Supervision of
Mohamed Elsobki
Professor in Electric Power Engineering Department
Faculty of Engineering, Cairo University
CAIRO UNIVERSITY, EGYPT
KASSEL UNIVERSITY, GERMANY
MARCH 2012

DESIGN, SIMULATION, AND EMULATION OF A RESIDENTIAL LOAD MANAGEMENT ALGORITHM
UTILIZING A PROPOSED SMART GRID ENVIRONMENT FOR THE MENA REGION
Salma Bakr
A Thesis Submitted to the Faculty of Engineering at Cairo University and Faculty of Electrical Engineering and
Computer Science at Kassel University in Partial Fulfillment of the Requirement for the Degree of
MASTER OF SCIENCE
Approved by the Examining Committee:
Prof. Dr. Adel Khalil Member
Prof. Dr. Dirk Dahlhaus Reviewer
Prof. Dr. Mohamed Elsobki Supervisor
CAIRO UNIVERSITY, EGYPT
KASSEL UNIVERSITY, GERMANY
MARCH 2012

ا�حمال �دارة خوارزمية ومحاكاة تصميم
لشبكة مقترح بإستخدام المنزلية
أفريقيا شمال و ا�وسط الشرق لمنطقة ذكية
سلمى بكر
كلية الھندسة و القاھرة جامعةب الھندسة كلية إلى مقدمة رسالة الحصول متطلبات من كجزءجامعة كاسل بعلوم الحاسب الكھربية و
الماجستير درجة على
إشراف تحت
محمد السبكى .د .أ
أستاذ بقسم ھندسة القوى الكھربية
القاھرة جامعة – الھندسة كلية
جمھورية مصر العربية – جامعة القاھرة
ا�تحادية المانياجمھورية –جامعة كاسل
٢٠١٢مارس

ا�حمال �دارة خوارزمية ومحاكاة تصميم
لشبكة مقترح بإستخدام المنزلية
أفريقيا شمال و ا�وسط الشرق لمنطقة ذكية
سلمى بكر
كلية الھندسة القاھرة و بجامعة الھندسة كلية إلى مقدمة رسالة الحصول متطلبات من علوم الحاسب بجامعة كاسل كجزء الكھربية و
الماجستير درجة على
يعتمد من لجنة الممتحنين
عضو أ.د. عادل خليل
مراجع أ.د. ديرك دالھاوس
مشرف أ.د. محمد السبكى
جمھورية مصر العربية – جامعة القاھرة
جمھورية المانيا ا�تحادية –جامعة كاسل
٢٠١٢مارس
i
Table of Contents List of Figures ......................................................................................................................................................... iv
List of Tables .......................................................................................................................................................... vi
List of Abbreviations .......................................................................................................................................... vii
Acknowledgments ............................................................................................................................................. viii
Abstract .................................................................................................................................................................... ix
1 Introduction ................................................................................................................................................ 1-1
1.1 Problem Definition ................................................................................................................................................................. 1-1
1.2 Research Objectives ............................................................................................................................................................... 1-1
1.3 Research Methodology ......................................................................................................................................................... 1-1
1.4 Thesis Layout ............................................................................................................................................................................ 1-2
2 Statistical Profile of the MENA Region............................................................................................... 2-1
2.1 Introduction .............................................................................................................................................................................. 2-1
2.2 Energy Situation ..................................................................................................................................................................... 2-2
2.3 Electricity Sector ..................................................................................................................................................................... 2-3
2.4 Challenges Ahead .................................................................................................................................................................... 2-7
2.5 Conclusion.................................................................................................................................................................................. 2-7
3 Application: Demand Side Energy Management (DSEM) ........................................................... 3-1
3.1 Introduction .............................................................................................................................................................................. 3-1
3.2 Definition ................................................................................................................................................................................... 3-1
3.3 Types of DSEM Practices ...................................................................................................................................................... 3-2
3.3.1 Load Management ...................................................................................................................................................................................... 3-2
3.3.2 Demand Response ....................................................................................................................................................................................... 3-5
3.3.3 Energy Efficiency ......................................................................................................................................................................................... 3-6
3.4 DSEM Practices in the MENA Region .............................................................................................................................. 3-6
3.5 Towards a Smarter DSEM via Smart Grids .................................................................................................................. 3-8
3.5.1 Introduction ................................................................................................................................................................................................... 3-8
3.5.2 Smart Grid Definition ................................................................................................................................................................................ 3-8
3.5.3 Smart Grid Characteristics and Components .................................................................................................................................. 3-9
3.5.4 Smart Grid Benefits .................................................................................................................................................................................. 3-10
3.5.5 Adopting the Smart Grid in the MENA Region .............................................................................................................................. 3-11
3.6 Conclusion................................................................................................................................................................................ 3-11
4 Communication Technology: Power Line Communication (PLC) ........................................... 4-1
4.1 Introduction .............................................................................................................................................................................. 4-1
4.2 Communication Technologies in Low Voltage Distribution Networks .............................................................. 4-1

ii
4.2.1 Power Line Communication .................................................................................................................................................................... 4-2
4.2.2 Internet Communication .......................................................................................................................................................................... 4-3
4.2.3 Public Telephone Network Communication .................................................................................................................................... 4-3
4.2.4 Satellite Communication .......................................................................................................................................................................... 4-4
4.2.5 Optical Fiber Communication ................................................................................................................................................................ 4-4
4.2.6 Wireless Communication ......................................................................................................................................................................... 4-4
4.3 Power Line Communication (PLC) ................................................................................................................................... 4-5
4.3.1 Introduction ................................................................................................................................................................................................... 4-5
4.3.2 PLC Systems ................................................................................................................................................................................................... 4-6
4.3.3 PLC Applications .......................................................................................................................................................................................... 4-7
4.3.4 Narrowband PLC Standards ................................................................................................................................................................... 4-8
4.3.5 PLC Challenges ............................................................................................................................................................................................. 4-9
4.4 Conclusion................................................................................................................................................................................ 4-10
5 Control Technology: Networked Control Systems (NCS) ............................................................ 5-1
5.1 Introduction .............................................................................................................................................................................. 5-1
5.2 Networked Control Systems................................................................................................................................................ 5-1
5.3 Control Network Protocol ................................................................................................................................................... 5-2
5.4 LonWorks Platform ................................................................................................................................................................ 5-4
5.5 Echelon Power Line Communication Evaluation Kit ................................................................................................ 5-5
5.6 Neuron C Programming ....................................................................................................................................................... 5-7
5.7 Conclusion.................................................................................................................................................................................. 5-8
6 Demand Load Management Algorithm ............................................................................................. 6-1
6.1 Introduction .............................................................................................................................................................................. 6-1
6.2 Technical Issues ....................................................................................................................................................................... 6-2
6.2.1 Load Control Approaches ........................................................................................................................................................................ 6-2
6.2.2 Categorization of Appliances ................................................................................................................................................................. 6-3
6.2.3 Load Shifting Algorithm ........................................................................................................................................................................... 6-4
6.3 Socio-Economic Issues .......................................................................................................................................................... 6-9
6.3.1 Electricity Pricing ........................................................................................................................................................................................ 6-9
6.3.2 Electricity Billing ......................................................................................................................................................................................... 6-9
6.3.3 Customer Participation in DSEM Activities.................................................................................................................................... 6-13
6.4 Conclusion................................................................................................................................................................................ 6-15
7 Simulation and Emulation of Load Management Algorithm ..................................................... 7-1
7.1 Introduction .............................................................................................................................................................................. 7-1
7.2 System Design .......................................................................................................................................................................... 7-1
7.3 Software Development ......................................................................................................................................................... 7-2

iii
7.3.1 Java-based Graphical User Interface for Residential Customer Data ................................................................................... 7-2
7.3.2 Matlab-based Development of Load Management Algorithm ................................................................................................. 7-3
7.3.3 Neuron-C based Demonstration of Load Management Algorithm ........................................................................................ 7-3
7.4 Load Profiles for Residential Sector ................................................................................................................................ 7-5
7.5 Results ......................................................................................................................................................................................... 7-9
7.6 Conclusion................................................................................................................................................................................ 7-10
8 Conclusions and Future Work .............................................................................................................. 8-1
8.1 Conclusions ................................................................................................................................................................................ 8-1
8.2 Proposals .................................................................................................................................................................................... 8-2
8.3 Future Work ............................................................................................................................................................................. 8-3
References

iv
List of Figures Figure 2-1: Map of the Middle East and North Africa Region (UNICEF 2012) ................................................................. 2-1
Figure 2-2: Electricity consumption in the World and MENA Region ................................................................................. 2-2
Figure 2-3: Energy efficiency of countries versus their productivity .................................................................................. 2-3
Figure 2-4: Electricity access in different MENA Region countries ...................................................................................... 2-4
Figure 2-5: Electricity consumption per demand sector in Egypt ........................................................................................ 2-4
Figure 2-6: Electricity consumption per demand sector in Algeria ...................................................................................... 2-5
Figure 2-7: Electricity consumption per demand sector in Saudi Arabia .......................................................................... 2-5
Figure 2-8: Electricity consumption per demand sector in Syria .......................................................................................... 2-5
Figure 2-9: Electricity consumption per demand sector in UAE............................................................................................ 2-6
Figure 2-10: Electricity consumption per demand sector in Jordan .................................................................................... 2-6
Figure 2-11: Electricity consumption per demand sector in Morocco ................................................................................ 2-6
Figure 2-12: Electricity consumption per demand sector in Tunisia .................................................................................. 2-7
Figure 3-1: Typical demand load shapes for different demand control activities ......................................................... 3-1
Figure 3-2: Demand load profile before and after load shifting ............................................................................................. 3-3
Figure 3-3: Demand load profile before and after load shedding.......................................................................................... 3-4
Figure 3-4: Demand load profile before and after valley filling ............................................................................................. 3-4
Figure 3-5: Demand load profile before and after peak clipping ........................................................................................... 3-5
Figure 3-6: Demand load profile before and after energy efficient practices .................................................................. 3-6
Figure 3-7: Smart Grid layout illustrating integrated demand and supply sectors (Hitachi) ................................... 3-8
Figure 3-8: Smart Grid Conceptual Framework Diagram ......................................................................................................... 3-9
Figure 4-1: Medium and low voltage power distribution versus high voltage transmission ................................... 4-1
Figure 4-2: In-house Power Line Communication connectivity (Panasonic) ................................................................... 4-6
Figure 4-3: Access Power Line Communication system layout .............................................................................................. 4-7
Figure 5-1: Networked Control System ............................................................................................................................................. 5-1
Figure 5-2: Centralized Control System ............................................................................................................................................ 5-1
Figure 5-3: Diagram of a LonWorks Network ................................................................................................................................ 5-4
Figure 5-4: Echelon Power Line Communication Evaluation Kit........................................................................................... 5-5
Figure 5-5: LonWorks system level diagram (Echelon) ............................................................................................................ 5-6
Figure 5-6 Power Line Communication Smart Transceiver Block Diagram (Echelon) ............................................... 5-6
Figure 6-1: Steps of developing the load management algorithm......................................................................................... 6-5
Figure 6-2: Steps for developing the load management algorithm ...................................................................................... 6-8
Figure 6-3: Electricity pricing block rates for the residential sector in Egypt .............................................................. 6-10
Figure 6-4: Proposed energy charge block sizes for two different meter capacities ................................................. 6-11
Figure 6-5: Percentage savings after applying demand charges for different load reductions ............................ 6-13
Figure 7-1: Diagram illustrating the connection between utility control center and residential customer ...... 7-1
Figure 7-2: Java based GUI for gathering necessary customer data for load management activities ................... 7-2
Figure 7-3: Partially filled Java based customer data GUI ......................................................................................................... 7-2
Figure 7-4: Flow chart of Matlab-based load shifting algorithm ........................................................................................... 7-3
Figure 7-5: Mini Gizmo I/O Board ....................................................................................................................................................... 7-4
Figure 7-6: Demo of connection between LonWorks PLC sensor and actuator.............................................................. 7-5
Figure 7-7: Three steps of building the demand load profile of a residential unit ........................................................ 7-6
Figure 7-8: Typical power demand of a washing machine operation ................................................................................. 7-7

v
Figure 7-9: Typical power demand of a dish washer operation ............................................................................................ 7-7
Figure 7-10: Typical power demand of a tumble dryer ............................................................................................................. 7-7
Figure 7-11: Demand load profile of all assumed household appliances except wet appliances ........................... 7-8
Figure 7-12: Demand load profile of wet appliances having randomly chosen consumption patterns ............... 7-8
Figure 7-13: Residential demand load profile before shifting wet appliances ................................................................ 7-9
Figure 7-14: Residential demand load profile after shifting wet appliances ................................................................... 7-9

vi
List of Tables Table 2-1: Miscellaneous statistical data for the MENA Region ............................................................................................. 2-1
Table 3-1: Perceived needs in demand side management programs for utility and customer ................................ 3-2
Table 3-2: Energy strategies in different MENA countries (energy efficiency and renewable energy targets) 3-7
Table 4-1: Frequency bands range of CENELEC narrowband PLC standard .................................................................... 4-9
Table 5-1: The seven layers of the ISO Open System Interconnection ................................................................................ 5-3
Table 6-1: Categories of load control ................................................................................................................................................. 6-1
Table 6-2: Categories of domestic appliances ................................................................................................................................ 6-4
Table 6-3: Proposed energy charge block sizes with respective bills for different meter capacities ................ 6-11
Table 6-4: Electricity bill for a family household before and after applying demand charges .............................. 6-12
Table 7-1: Appliances/Gadgets found in the assumed residential unit .............................................................................. 7-6
Table 7-2: Old versus new values of peak demand and load factor after applying the algorithm ....................... 7-10
vii
List of Abbreviations
AMI Advanced Metering Infrastructure CPP Critical Peak Pricing DR Demand Response DSEM Demand Side Energy Management EC Energy Conservation EE Energy Efficiency EMI Electro-Magnetic Interference GHG Greenhouse Gas IEA International Energy Agency IED Intelligent Electronic Devices LM Load Management MENA Middle East and North Africa NCS Networked Control Systems PLC Power Line Communication QoS Quality of Service RCREEE Regional Center for Renewable Energy and Energy Efficiency RTP Real Time Pricing SG Smart Grid TOU Time of Use

viii
Acknowledgments
In the name of Allah the Most Gracious, the Most Merciful Gracious; all praise belongs to Him for His continuous blessings upon me throughout my life. My faith in Him kept me strong in tough times and His guidance lead me from one success to another. Thank you my Lord. I would like to thank my supervisor Prof. Dr. Mohamed Elsobki for his continuous support and encouragement, and my reviewer Prof. Dr. Dirk Dahlhaus. Special thanks to Prof. Dr. Adel Khalil, all those who took part in initiating REMENA Master Program, and all those who are still working hard to sustain it. And of course big thanks to DAAD for providing me with the scholarship! Sincere thanks to my lovely parents who have continuously encouraged me throughout the years of my studies and work; I couldn’t have done it without you. Lots of love, thanks, and wishes to my gorgeous husband Shareef who has been such a great support to me; you are a blessing.
~ Towards Negawatts 2.0 ~

ix
Abstract
Due to the increasingly soaring demand for energy, electric utilities tend to develop generation capacities according to peak loads to meet consumer demands. However, this approach results in highly under-utilized systems and irrational consumption behaviors. Electric utilities need to perform a stimulating balancing act between the need to meet customers dynamic load demands, and the necessity of efficiently allocating resources. The ideal way to match demand and supply and make the best use out of available capacities is by deploying demand side management practices on consumer loads either by reducing demand or reshaping the load profile. Demand side management strategies have been used by the industry for many years for managing mainly large and predictable loads. Supply constraints – caused principally by capital intensive costs and geopolitical challenges of building new generation capacities – are convincing utilities to take a new look at the hefty role demand side management can play in controlling the consumption of smaller commercial and residential customers. The objective of this thesis is to shed light on the current electric energy situation and practiced demand side management activities in countries of the MENA Region. It also aims at recommending suitable communication and control technologies for a proposed regional smart grid environment. In addition, in this thesis we develop a load management algorithm which reduces peak electricity consumption in residential units and manages the operation of household appliances according to utility controls and consumers preferences; thus creating efficient resources allocation at consumer premises and consequently improving the load factor of associated generation capacities. Furthermore, we propose some modifications to existing electricity billing schemes to promote more rational electricity consumption patterns.

x
ملخص
, تميل مرافق الكھرباء إلى تطوير قدرات التوليد نظراً �رتفاع الطلب على نحو متزايد للحصول على الطاقةعدم مراعية ل>حمال القسوى حتى تلبى إحتياجات المستھلكين. على الرغم من ذلك, ھذا النھج يؤدى إلى
مرافق الكھرباء يجب أن تقوم المثلى و نشوء سلوكيات إستھ?كية غير منطقية.إستغ?ل النظم بالطرق الطريق اIمثل للوصول إلى التوازن بين بالموازنة بين طلبات المستھلكين و ا�ستھ?ك اIمثل للموارد.
طاقة. أساليب إدارة الطلب على ال العرض و الطلب و ا�ستفادة المثلى من القدرات الموجودة ھو إستخدام
إدارة الطلب على الطاقة قد تم إستخدامھا فى الصناعات لسنوات عديدة من قبل, باIخص �دارة إستراتيجيات التى تسببھا التكاليف الباھظة و التحديات الجغرافية السياسية –اIحمال المتوقعة. القيود على قدرات التوليد
تقنع المرافق الكھربية للنظر إلى الدور الكبير التى تقوم به إدارة الطلب على –لبناء قدرات توليد جديدة الطاقة فى التحكم فى ا�ستھ?ك السكنى أو التجارى.
و ممارسات إدارة إستھ?ك الھدف من ھذه الرسالة ھو إلقاء الضوء على الوضع الحالى للطاقة الكھربية يقيا. و تھدف أيضاً ھذه الرسالة إلى إعطاء توصيات مناسبة الطاقة فى منطقة الشرق اIوسط و شمال أفر
لتكنولوجيا ا�تصا[ت والتحكم لبناء شبكة إقيلمية ذكية. با�ضافة إلى ذلك, فى ھذه الرسالة نقوم بتصميم تقوم بتقليل القوى القصوى المستھلكة فى المنشات السكنية عن طريق إدارة تشغيل اIدوات خوارزميةوفقاُ لمتطلبات مرافق الكھرباء وتفضي?ت المستھلكين, و بالتالى تستھلك الموارد بطريقة منزلية الكھربية ال
فعالة و يتحسن معامل الحمل لمحطات التوليد. و با�ضافة إلى ذلك نقوم بإقتراح تعدي?ت على طريقة حساب فواتير الكھرباء الحالية لتشجيع ا�ستھ?ك الواعى للكھرباء.

1-1
1 Introduction
1.1 Problem Definition
With the increasingly growing demand for energy, utilities tend to develop their generation capacities according to peak loads rather than average power in order to meet the consumers’ demands. This approach, unfortunately, renders power systems highly under-utilized and customers’ consumption patterns increasingly irresponsible. In addition, it has driven utilities to make huge long-term investments in new generation plants which are mostly and typically based on conventional energy sources; such plants – in addition to being capital intensive – lead to increased Greenhouse Gases (GHG) emissions that greatly affect the earth’s temperature, producing in turn changes in weather, sea level and land use patterns.
1.2 Research Objectives
In order to divert from under-utilized systems and make the best use of the available generated power without needing to erect new plants, generated capacities need to be used more efficiently and great care must be taken to optimally allocate available resources. The easiest, cleanest and safest way to improve the match between demand and supply is to deploy demand side management practices on various loads, either by reducing the demand or reshaping the load profile. The objective of this research is to shed light on the current Demand Side Energy Management (DSEM) practices and regulations in countries of the MENA Region. It also aims at developing a load management algorithm which reduces peak electricity consumption in residential units and manages the operation of household appliances according to utility controls and consumers preferences, thus improving households demand profile load factors and consequently the load factor of associated power generation plants (the ratio between the average power and the peak power of a load over a period of time). In addition, we propose some modifications to existing electricity billing schemes to promote more rational electricity consumption patterns. The benefits of load management are numerous: postponing capital intensive investments in new power plants; reducing peak power demands and total consumed energy; lowering energy prices and costs; optimizing system and device utilization; improving power grid reliability, flexibility and robustness; reducing GHG emissions; and supporting the shift towards a “smarter” grid. The work developed in this thesis discusses different aspects of load management in the residential sector: technical; economic; social; and regulatory.
1.3 Research Methodology
The work developed throughout this thesis is based on constructive research; an algorithm is designed to manage electrical and electronic loads used in residential units according to the end user’s choices and without disturbing his comfort, but according to the electric utility available capacities. This algorithm is developed in Matlab, and a simple demo of main concept is developed in Neuron C and implemented in Hardware on a Power Line Communication Evaluation kit.

1-2
1.4 Thesis Layout
The thesis is composed of eight chapters. This chapter introduces the problem definition, the research objectives, and the adopted research methodology in tackling the problem in focus. Chapter two gives an overview about the energy situation in the MENA Region and the challenges ahead, with a focus on electricity sector statistics. Chapter three introduces the focus application of the research herein, which is Demand Side Energy Management. It first discusses the different type of DSEM and their practices in the MENA countries. Then it sheds light on the Smart Grid concept and how DSEM practices will benefit from upgrading the current power grid infrastructure. We discuss the communication technologies in chapter four, and then focus on Power Line Communication which is the technology of choice herein; we introduce its components, standards, and challenges. In chapter five, we discuss Networked Control Systems upon which we base our practical demo. The Load Management algorithm developed is introduced and discussed in details in chapter six, along with the proposed modifications to electric billing schemes. Technical as well as socio-economic issues are also illustrated. In chapter seven, we introduce the system design – between the residential unit and the electric utility control center – where the different components of load management are integrated, and simulate the algorithm with load profile data taken from the residential sector. In the same chapter we also introduce the Java-based Graphical Interface developed to collect utility customers’ data essential for the design of the different load management options, and also the Neuron C coding needed to demonstrate the basic idea of Networked Control Systems in Hardware. We then conclude the work developed, introduce proposals, and suggest future work in chapter eight.

2-1
2 Statistical Profile of the MENA Region
2.1 Introduction
The term MENA, for "Middle East and North Africa", is an acronym often used in different technical, economic, and social disciplines. Extending from Morocco to Iran, the term covers a widespread region and includes the majority of the Maghreb and the Middle Eastern countries (Figure 2-1). Constituting about 5.5% of the world population, the MENA Region is home to more than 370 million people.
Figure 2-1: Map of the Middle East and North Africa Region (UNICEF 2012)
Table 2-1 includes miscellaneous statistical data for the MENA Region (DECDG GSR 2011). From the data enlisted in the table below, we can induce that population density in MENA is around 43 inhabitants per square kilometers, which is very close to the worldly average population density given by 47 inhabitants per square kilometers as indicated in the United Nations World Population Prospects (2010). Also, we notice that the urban population is larger than the rural one by more than 30%.
Category Data Figure
Total Population 376,579,930
Annual Population Growth 1.9%
Urban Population 191,000,000
Rural Population 140,000,000
Gross National Income $1,190,000,000,000
GDP $1,062,418,867,027
Average Annual GDP Growth 4.1%
Land Area 8,644,000 sq. km. Table 2-1: Miscellaneous statistical data for the MENA Region

2-2
2.2 Energy Situation
According to the World Bank, the Middle East and North Africa (MENA) region has about 57% of the world’s proven oil reserves and 41% of proven natural gas resources. However, these resources are not equally distributed between countries in the region; some countries are very rich in natural resources while others are very poor and therefore depend on imports. Unfortunately the energy situation in many MENA countries is quite distorted: petroleum product prices are imprecise; cost recovery in electricity is low; energy intensity is significantly high; demand growth often exceeds inefficiently operated supply; average carbon intensity is higher than in industrialized countries; and renewable energy potentials lack explorations. Most countries of the region lack reforms and private sector investments in the energy sector; while with the continuously growing population, economic growth, and rapid urbanization, soaring demands call for infrastructure extensions and upgrades. According to the International Energy Agency (IEA), the energy use in the Middle East is growing by a rate of 170%. It is estimated for the MENA Region that over the next 30 years the total share of energy investment in GDP will exceed 30 billion USD a year, which is about 3% of the region’s total projected GDP. Figure 2-2 illustrates the electric power consumption per capita between 1971 and 2009 (World Bank Development Indicators 2009). Note that if all the income levels in the MENA Region are considered, the power consumption level per capita becomes increasingly adjacent to the world average value. Although this may be interpreted as a sign of economic growth, it can also indicate unconscious and inefficient use of electricity, and energy in general.
Figure 2-2: Electricity consumption in the World and MENA Region
0
500
1000
1500
2000
2500
3000
3500
1971 1973 1975 1977 1979 1981 1983 1985 1987 1989 1991 1993 1995 1997 1999 2001 2003 2005 2007 2009
Ele
ctri
city
Co
nsu
mp
tio
n (
GW
h)
Year
World Middle East & North Africa (developing only)
Middle East & North Africa (all income levels)
2-3
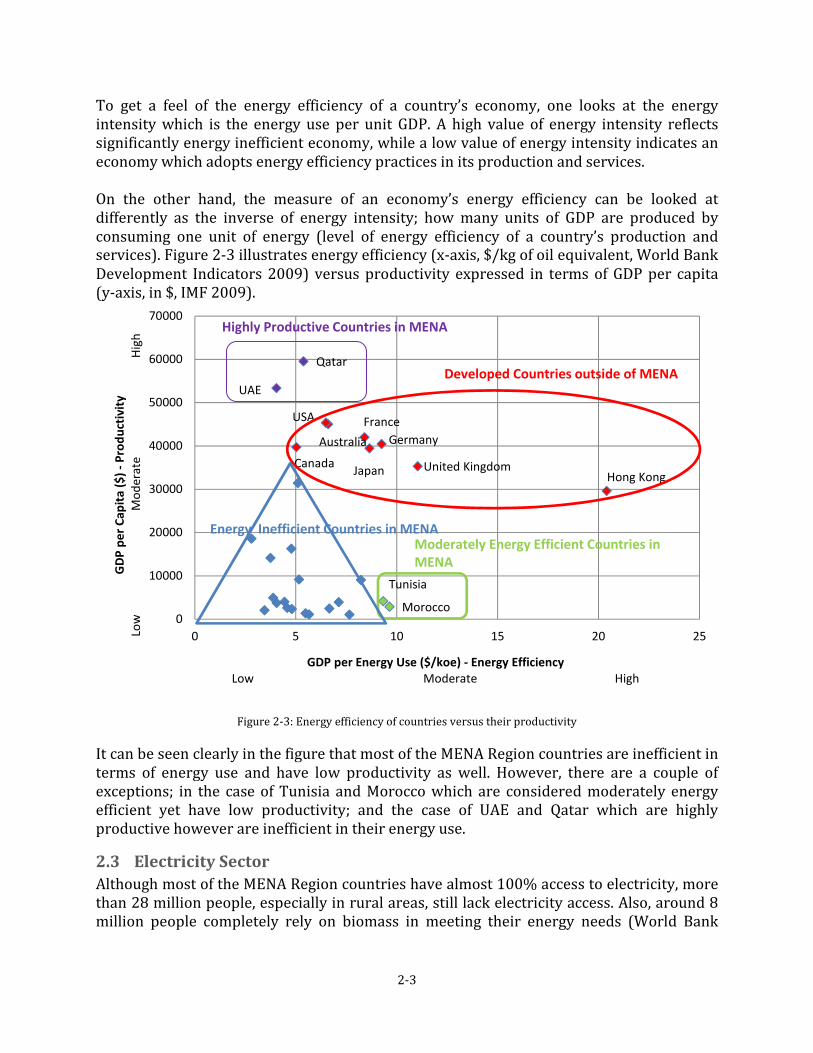
To get a feel of the energy efficiency of a country’s economy, one looks at the energy intensity which is the energy use per unit GDP. A high value of energy intensity reflects significantly energy inefficient economy, while a low value of energy intensity indicates an economy which adopts energy efficiency practices in its production and services. On the other hand, the measure of an economy’s energy efficiency can be looked at differently as the inverse of energy intensity; how many units of GDP are produced by consuming one unit of energy (level of energy efficiency of a country’s production and services). Figure 2-3 illustrates energy efficiency (x-axis, $/kg of oil equivalent, World Bank Development Indicators 2009) versus productivity expressed in terms of GDP per capita (y-axis, in $, IMF 2009).
Figure 2-3: Energy efficiency of countries versus their productivity
It can be seen clearly in the figure that most of the MENA Region countries are inefficient in terms of energy use and have low productivity as well. However, there are a couple of exceptions; in the case of Tunisia and Morocco which are considered moderately energy efficient yet have low productivity; and the case of UAE and Qatar which are highly productive however are inefficient in their energy use.
2.3 Electricity Sector
Although most of the MENA Region countries have almost 100% access to electricity, more than 28 million people, especially in rural areas, still lack electricity access. Also, around 8 million people completely rely on biomass in meeting their energy needs (World Bank
Morocco
Qatar
Tunisia
UAE
Australia
Canada
France
Germany
Hong KongJapan United Kingdom
USA
0
10000
20000
30000
40000
50000
60000
70000
0 5 10 15 20 25
GD
P p
er
Ca
pit
a (
$)
-P
rod
uct
ivit
y
Low
Mo
de
rate
Hig
h
GDP per Energy Use ($/koe) - Energy Efficiency
Low Moderate High
Developed Countries outside of MENA
Moderately Energy Efficient Countries in
MENA
Highly Productive Countries in MENA
Energy Inefficient Countries in MENA
2-4
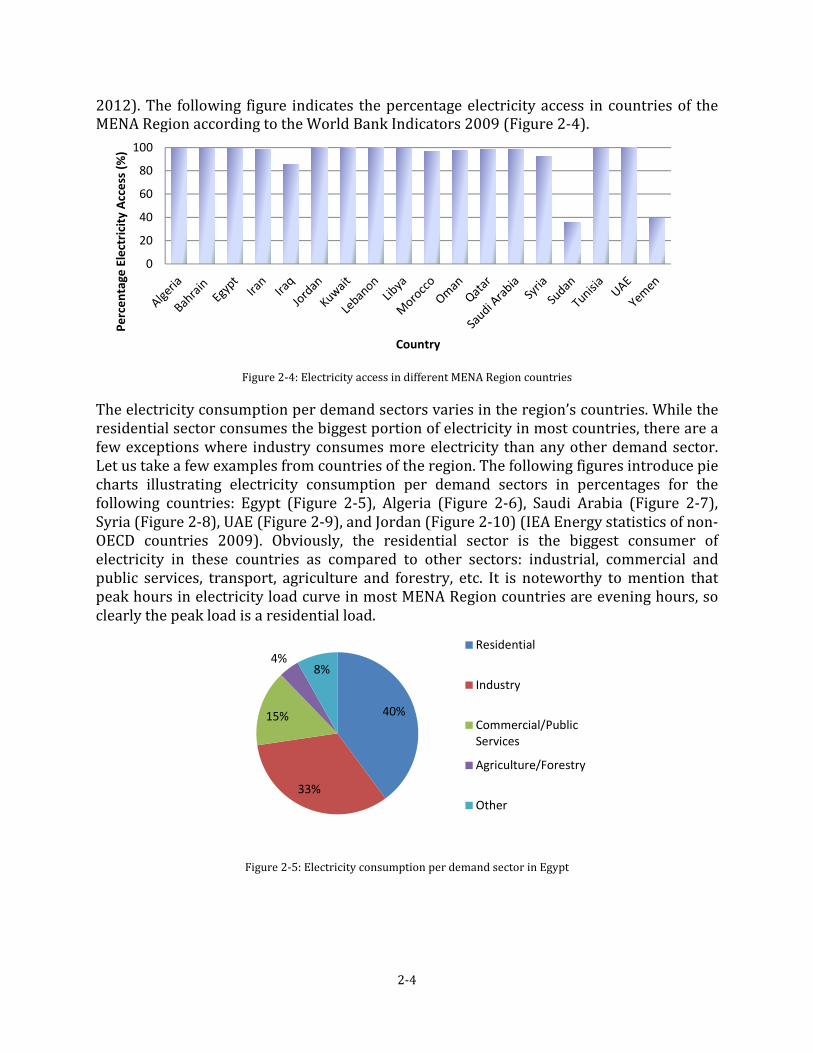
2012). The following figure indicates the percentage electricity access in countries of the MENA Region according to the World Bank Indicators 2009 (Figure 2-4).
Figure 2-4: Electricity access in different MENA Region countries
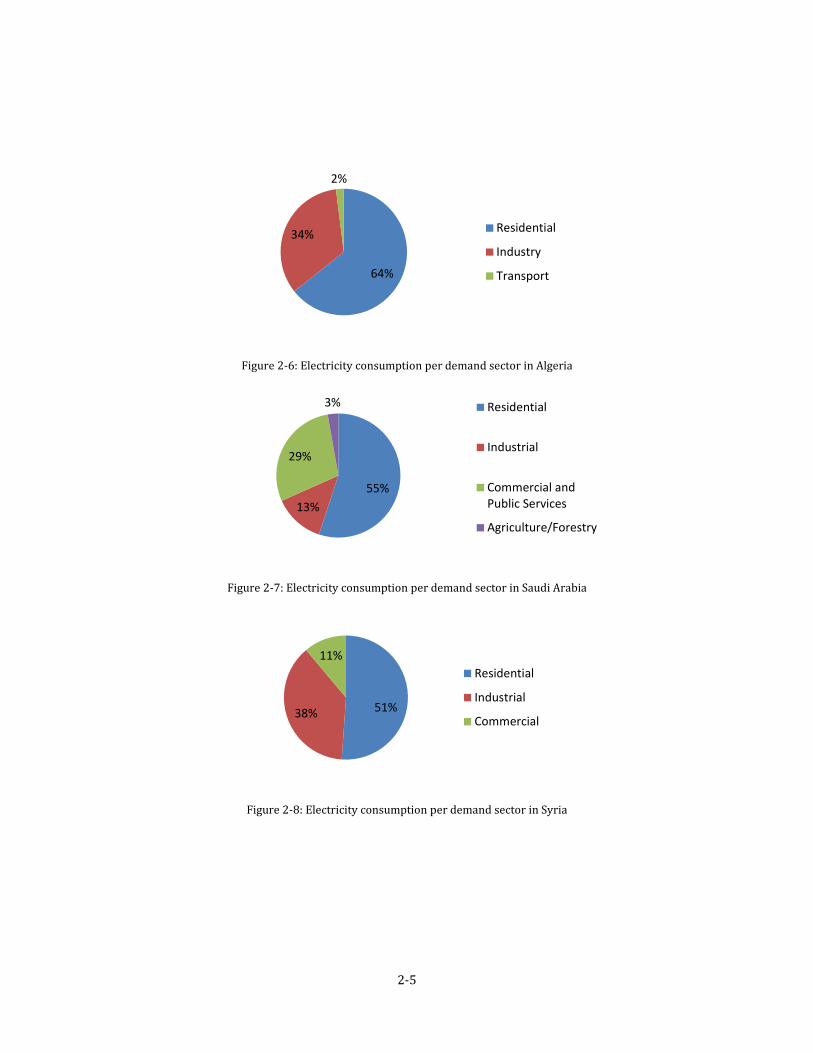
The electricity consumption per demand sectors varies in the region’s countries. While the residential sector consumes the biggest portion of electricity in most countries, there are a few exceptions where industry consumes more electricity than any other demand sector. Let us take a few examples from countries of the region. The following figures introduce pie charts illustrating electricity consumption per demand sectors in percentages for the following countries: Egypt (Figure 2-5), Algeria (Figure 2-6), Saudi Arabia (Figure 2-7), Syria (Figure 2-8), UAE (Figure 2-9), and Jordan (Figure 2-10) (IEA Energy statistics of non-OECD countries 2009). Obviously, the residential sector is the biggest consumer of electricity in these countries as compared to other sectors: industrial, commercial and public services, transport, agriculture and forestry, etc. It is noteworthy to mention that peak hours in electricity load curve in most MENA Region countries are evening hours, so clearly the peak load is a residential load.
Figure 2-5: Electricity consumption per demand sector in Egypt
0
20
40
60
80
100
Pe
rce
nta
ge
Ele
ctri
city
Acc
ess
(%
)
Country
40%
33%
15%
4%8%
Residential
Industry
Commercial/Public
Services
Agriculture/Forestry
Other
2-5
Figure 2-6: Electricity consumption per demand sector in Algeria
Figure 2-7: Electricity consumption per demand sector in Saudi Arabia
Figure 2-8: Electricity consumption per demand sector in Syria
64%
34%
2%
Residential
Industry
Transport
55%
13%
29%
3% Residential
Industrial
Commercial and
Public Services
Agriculture/Forestry
51%38%
11%
Residential
Industrial
Commercial

2-6
Figure 2-9: Electricity consumption per demand sector in UAE
Figure 2-10: Electricity consumption per demand sector in Jordan
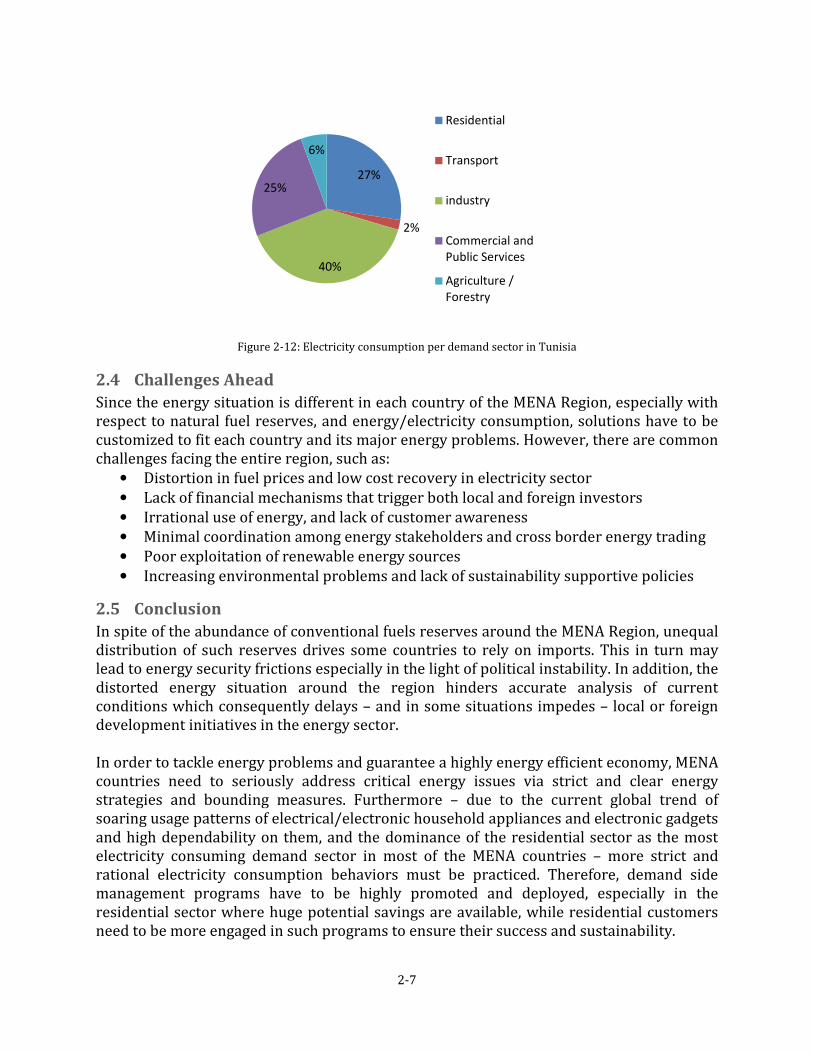
As seen in the figures above, the percentages of electricity consumption for the residential sector range between 40% and 64%; this is a huge range compared to the world average (28%). There are a few exceptions in the region though; let us consider the case of Morocco and Tunisia, where the residential sector consumes 33% and 27% of the total electricity consumption, respectively (Figure 2-11, Figure 2-12). Obviously, these percentages are much closer to the world average and reflect more rational electricity consumption patterns in the residential sector.
Figure 2-11: Electricity consumption per demand sector in Morocco
43%
12%
37%
8%
Residential
Industrial
Commercial and
Public Services
Other
40%
24%
21%
15%
Residential
Industrial
Commercial and
Public Services
Agriculture /
Forestry
33%
38%
5%
18%
6%
Residential
Industry
Transport
Commercial/Public
Services
Agriculture/Forestry
2-7
Figure 2-12: Electricity consumption per demand sector in Tunisia
2.4 Challenges Ahead
Since the energy situation is different in each country of the MENA Region, especially with respect to natural fuel reserves, and energy/electricity consumption, solutions have to be customized to fit each country and its major energy problems. However, there are common challenges facing the entire region, such as:
• Distortion in fuel prices and low cost recovery in electricity sector
• Lack of financial mechanisms that trigger both local and foreign investors
• Irrational use of energy, and lack of customer awareness
• Minimal coordination among energy stakeholders and cross border energy trading
• Poor exploitation of renewable energy sources
• Increasing environmental problems and lack of sustainability supportive policies
2.5 Conclusion
In spite of the abundance of conventional fuels reserves around the MENA Region, unequal distribution of such reserves drives some countries to rely on imports. This in turn may lead to energy security frictions especially in the light of political instability. In addition, the distorted energy situation around the region hinders accurate analysis of current conditions which consequently delays – and in some situations impedes – local or foreign development initiatives in the energy sector. In order to tackle energy problems and guarantee a highly energy efficient economy, MENA countries need to seriously address critical energy issues via strict and clear energy strategies and bounding measures. Furthermore – due to the current global trend of soaring usage patterns of electrical/electronic household appliances and electronic gadgets and high dependability on them, and the dominance of the residential sector as the most electricity consuming demand sector in most of the MENA countries – more strict and rational electricity consumption behaviors must be practiced. Therefore, demand side management programs have to be highly promoted and deployed, especially in the residential sector where huge potential savings are available, while residential customers need to be more engaged in such programs to ensure their success and sustainability.
27%
2%
40%
25%
6%
Residential
Transport
industry
Commercial and
Public Services
Agriculture /
Forestry

3-1
3 Application: Demand Side Energy Management (DSEM)
3.1 Introduction
In order to make the best use available generating capacities without needing to build new power plants to cover demand loads, optimal allocation of generated power and more rational consumption patterns are crucially needed. The best way to match supply and demand is Demand Side Energy Management (DSEM), which reshapes demand profiles to best fit provided supply. Principally since renewable energy sources are progressively being integrated with conventional generation systems, the need for DSEM is becoming even greater as a means of imitating the elasticity of conventional power plants in meeting load demands by providing flexible demand that follows generation patterns of intermittent sources. Figure 3-1 illustrates some demand control activities and their corresponding effect on a demand load profile.
Figure 3-1: Typical demand load shapes for different demand control activities
3.2 Definition
The term Demand Side Energy Management (DSEM) is becoming gradually attractive as a means of eliminating resource bottlenecks, assisting in integration of intermittent sources, engaging consumers in supply/demand issues, and attaining less peaky demand profiles. One of the most accurate and descriptive definitions for DSEM is in Gellings (2009): Demand Side Energy Management is the planning and implementation of those utility activities designed to influence customer use of electricity in ways that will produce
0
1
2
3
4
5
6
7
8
9
0 1 2 3 4 5 6 7 8 9 10 11 12 13 14 15 16 17 18 19 20 21 22 23 0
De
ma
nd
Lo
ad
Pro
file
(k
W)
Hours of the Day
Base Load Energy Efficiency Load Shifting Load Shedding Peak Clipping

3-2
desired changes in the load shape (i.e. changes in the pattern and magnitude of a load). DSEM encompasses the entire range of management functions associated with directing demand side activities, including program planning, evaluation, implementation, and monitoring. Opportunities for DSEM can be found in all customer classes, including residential, commercial, industrial, and wholesale. For a DSEM program to succeed, certain essentials must be met on the utility side as well as the demand side. Table 3-1 enlists the needs perceived in DSEM programs. Stakeholder Needs
Utility • Reduce capital investments
• Ensure efficient operation in generation, transmission, and distribution
• Provide high quality customer demands and services
• Guarantee sustainable actions on supply and demand sides
• Improve financial performance and billing systems
• Respond to constantly evolving regulatory requirements
• Enhance image of utility
Customer • Coverage of demand needs by utility
• Conserve energy in order to reduce electricity bills
• Reduce environmental impacts associated with electricity use
• Maintain same lifestyle and comfort levels Table 3-1: Perceived needs in demand side management programs for utility and customer
3.3 Types of DSEM Practices
Categorizing DSEM practices can be done according to two main factors: load shape objective (load shedding, load shifting, peak clipping, etc.), or stakeholder mainly controlling demand side activities (utility or end-user). In the scope of this work, DSEM was chosen to be differentiated according to the stakeholder directly in charge of demand controls. It can therefore be distinguished into three main activities as follows:
• Load Management (LM)
• Demand Response (DR)
• Energy Efficiency (EE)
3.3.1 Load Management
The goal of a LM program is described in Ashok & Banerjee (2000) as the maintenance of a constant level of load, thereby allowing the system load factor to approach 100%. While in Gellings (2009), LM is described as the utility activities designed to influence the timing and magnitude of customer use of electricity. In principal, traditional load management schemes include valley filling, peak clipping, load shedding, and load shifting. LM can be considered a fully automated DSEM approach which does not involve human intervention and is initiated by the utility over the demand side through the reception of control signals that initiate pre-programmed control schemes (Motegi et al. 2007). However, if agreed by the utility, the demand side may be allowed a limited capability to intervene in case of emergency or heavy discomfort. In the following lines, we will shed light on the different types of LM schemes: load shifting, load shedding, valley filling, and peak clipping.

3-3
Load Shifting
Load shifting is the most classical form of LM; it basically aims at reducing customer demand during the peak period by shifting the use of appliances to partial peak and off peak periods. In load shifting, no loads are being switched off; unlike load shedding, where loads are wholly or partially shut down. In load shifting loads are only re-scheduled, and hence the total consumption is not affected (Ashok & Banerjee 2000). The work developed in this thesis is principally concerned with load shifting. Figure 3-2 shows a demand load before and after load shifting.
Figure 3-2: Demand load profile before and after load shifting
There is a variety of applications for load shifting mentioned in Curtis et al. (2011): water heating and cooling, space heating and cooling, clothes washing and drying, etc. The idea behind load shifting is identifying a time slot in which the shifted load is totally covered, and then allocating the load to be shifted to this slot (Gellings & Chamberlain 1993). Load Shedding
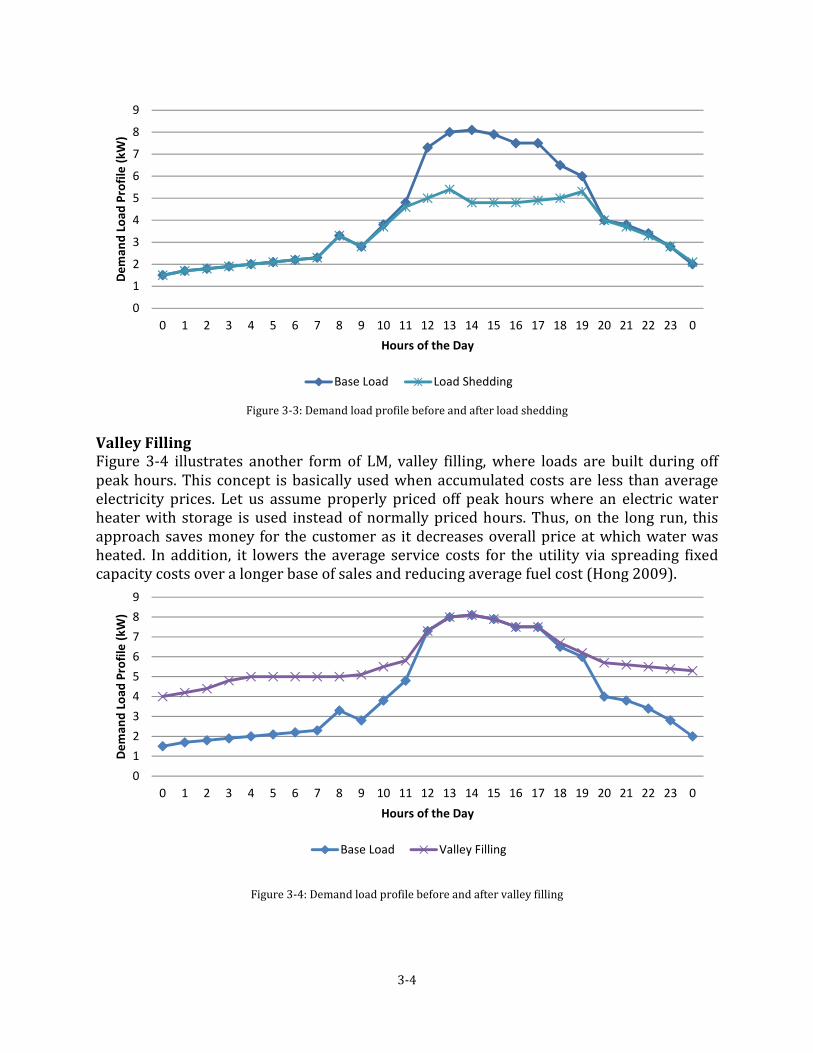
Demand limiting or load shedding are synonymous to shutting down loads when preset peak demand limits are about to be surpassed. In Motegi et al. (2007), it is stated that such peak limits can be placed on equipment (e.g. an air conditioner), systems (e.g. heating system), or even a whole building. When the demand is appropriately reduced, loads are restored. This is typically done to flatten the load shape when the monthly peak demand is pre-determined. Figure 3-3 shows a demand load before and after load shedding.
0
1
2
3
4
5
6
7
8
9
0 1 2 3 4 5 6 7 8 9 10 11 12 13 14 15 16 17 18 19 20 21 22 23 0
De
ma
nd
Lo
ad
Pro
file
(k
W)
Hours of the Day
Base Load Load Shifting
3-4
Figure 3-3: Demand load profile before and after load shedding
Valley Filling
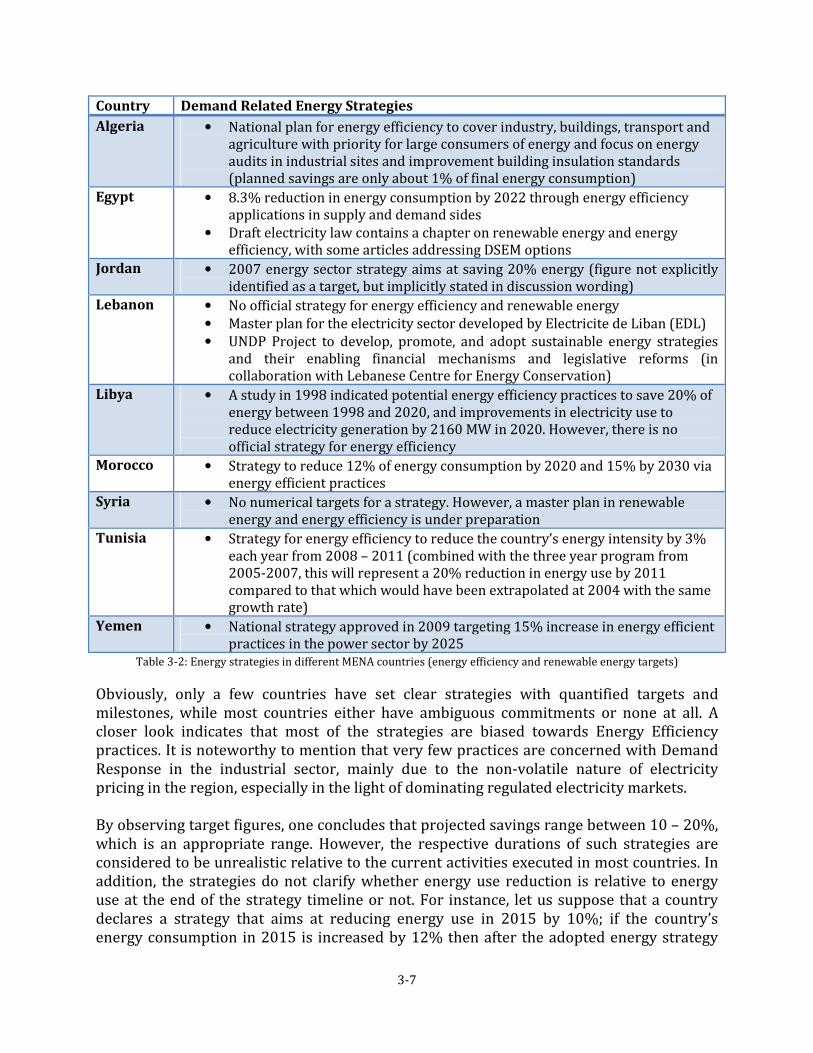
Figure 3-4 illustrates another form of LM, valley filling, where loads are built during off peak hours. This concept is basically used when accumulated costs are less than average electricity prices. Let us assume properly priced off peak hours where an electric water heater with storage is used instead of normally priced hours. Thus, on the long run, this approach saves money for the customer as it decreases overall price at which water was heated. In addition, it lowers the average service costs for the utility via spreading fixed capacity costs over a longer base of sales and reducing average fuel cost (Hong 2009).
Figure 3-4: Demand load profile before and after valley filling
0
1
2
3
4
5
6
7
8
9
0 1 2 3 4 5 6 7 8 9 10 11 12 13 14 15 16 17 18 19 20 21 22 23 0
De
ma
nd
Lo
ad
Pro
file
(k
W)
Hours of the Day
Base Load Load Shedding
0
1
2
3
4
5
6
7
8
9
0 1 2 3 4 5 6 7 8 9 10 11 12 13 14 15 16 17 18 19 20 21 22 23 0
De
ma
nd
Lo
ad
Pro
file
(k
W)
Hours of the Day
Base Load Valley Filling

3-5
Peak Clipping
Peak clipping is another form of LM (Figure 3-5), where the peak demand load during specific time slots is reduced. This scheme is commonly used by utilities which do not have enough generation supply to cover peak load. Peak clipping aims at reducing utility operating costs by avoiding the use of expensive peak power plants.
Figure 3-5: Demand load profile before and after peak clipping
3.3.2 Demand Response
Demand Response (DR) is a set of time-dependent program activities and tariffs that seek to reduce or shift electricity usage in the short term, improve electric grid reliability, and manage electricity costs (Quantum & Summit Blue 2004; Gellings 2009). DR strategies provide control methodologies that promote load shedding or load shifting by the end users during critical times when the electric grid is near its capacity or when electricity prices are high. Demand Response is dynamic and event‐driven; its programs may include dynamic pricing and tariffs, price‐responsive demand bidding, contractually obligated or voluntary curtailment, and equipment cycling (Motegi et al. 2007). Many electric utilities have been exploring the use of different pricing schemes to help reduce summer peaks in customer electric loads (e.g. Critical Peak Pricing (CPP), Time of Use (TOU), and Real Time Pricing (RTP)). However, recent evaluations have shown that customers have limited knowledge of how to operate their facilities to reduce their electricity costs under such pricing schemes (Quantum & Summit Blue 2004). DR can be either manual or semi manual as explained hereunder:
• Manual DR which involves a labor-intensive approach such as manually turning off or changing comfort set points at each equipment switch or controller
• Semi-automated DR that uses a pre-programmed load control strategy initiated by a person via centralized control system
0
1
2
3
4
5
6
7
8
9
0 1 2 3 4 5 6 7 8 9 10 11 12 13 14 15 16 17 18 19 20 21 22 23 0
De
ma
nd
Lo
ad
Pro
file
(k
W)
Hours of the Day
Base Load Peak Clipping

3-6
3.3.3 Energy Efficiency
The last DSEM activity discussed herein is Energy Efficiency (EE), which lowers energy use while providing the same level of service. Energy Conservation (EC) tends to be often confused with EE; however, they greatly vary. EC aims at reducing unnecessary energy use by partially or completely shedding loads, while EE is based on the usage of devices whose core technology consumes energy more efficiently. EC can be considered as another terminology for load shedding/demand limiting. Figure 3-6 shows a demand load profile before and after energy efficient practices are applied.
Figure 3-6: Demand load profile before and after energy efficient practices
EE and EC both provide environmental protection and utility bill savings. Peak demand can be permanently reduced by EE measures, thus reducing overall consumption. In buildings, EE is typically implemented by installing energy efficient equipment or operating buildings more efficiently. Energy efficient operations are critical to new building commissioning and retro‐commissioning, and such operations greatly require that the systems of a building operate in an integrated manner.
3.4 DSEM Practices in the MENA Region
A country’s set of energy strategies mainly defines objectives with respect to new energy supply projects, either those depending on conventional fuels or renewable energy sources. Strategies also include plans for managing demand side and curbing surging growth in consumption patterns. Required policy instruments needed to achieve set objectives are included in the detailed structure of the energy strategy. Table 3-2 lists demand related energy strategies in some countries of the MENA Region as extracted from individual country reports produced by the Regional Center for Renewable Energy and Energy Efficiency (RCREEE 2009, 2010).
0
1
2
3
4
5
6
7
8
9
0 1 2 3 4 5 6 7 8 9 10 11 12 13 14 15 16 17 18 19 20 21 22 23 0
De
ma
nd
Lo
ad
Pro
file
(k
W)
Hours of the Day
Base Load Energy Efficiency
3-7
Country Demand Related Energy Strategies
Algeria • National plan for energy efficiency to cover industry, buildings, transport and agriculture with priority for large consumers of energy and focus on energy audits in industrial sites and improvement building insulation standards (planned savings are only about 1% of final energy consumption)
Egypt • 8.3% reduction in energy consumption by 2022 through energy efficiency applications in supply and demand sides
• Draft electricity law contains a chapter on renewable energy and energy efficiency, with some articles addressing DSEM options
Jordan • 2007 energy sector strategy aims at saving 20% energy (figure not explicitly identified as a target, but implicitly stated in discussion wording)
Lebanon • No official strategy for energy efficiency and renewable energy
• Master plan for the electricity sector developed by Electricite de Liban (EDL)
• UNDP Project to develop, promote, and adopt sustainable energy strategies and their enabling financial mechanisms and legislative reforms (in collaboration with Lebanese Centre for Energy Conservation)
Libya • A study in 1998 indicated potential energy efficiency practices to save 20% of energy between 1998 and 2020, and improvements in electricity use to reduce electricity generation by 2160 MW in 2020. However, there is no official strategy for energy efficiency
Morocco • Strategy to reduce 12% of energy consumption by 2020 and 15% by 2030 via energy efficient practices
Syria • No numerical targets for a strategy. However, a master plan in renewable energy and energy efficiency is under preparation
Tunisia • Strategy for energy efficiency to reduce the country’s energy intensity by 3% each year from 2008 – 2011 (combined with the three year program from 2005-2007, this will represent a 20% reduction in energy use by 2011 compared to that which would have been extrapolated at 2004 with the same growth rate)
Yemen • National strategy approved in 2009 targeting 15% increase in energy efficient practices in the power sector by 2025
Table 3-2: Energy strategies in different MENA countries (energy efficiency and renewable energy targets)
Obviously, only a few countries have set clear strategies with quantified targets and milestones, while most countries either have ambiguous commitments or none at all. A closer look indicates that most of the strategies are biased towards Energy Efficiency practices. It is noteworthy to mention that very few practices are concerned with Demand Response in the industrial sector, mainly due to the non-volatile nature of electricity pricing in the region, especially in the light of dominating regulated electricity markets. By observing target figures, one concludes that projected savings range between 10 – 20%, which is an appropriate range. However, the respective durations of such strategies are considered to be unrealistic relative to the current activities executed in most countries. In addition, the strategies do not clarify whether energy use reduction is relative to energy use at the end of the strategy timeline or not. For instance, let us suppose that a country declares a strategy that aims at reducing energy use in 2015 by 10%; if the country’s energy consumption in 2015 is increased by 12% then after the adopted energy strategy

3-8
there would still be an increase in energy consumption amounting to 2%; if the increase in energy consumption would be already 10% in 2015, then this strategy merely keeps a stable consumption and does not result in any energy use reductions. It should be noted that the most clear and proper way of wording such strategies is obvious in the case of Tunisia.
3.5 Towards a Smarter DSEM via Smart Grids
3.5.1 Introduction
It is very important to know and constantly remember that electricity cannot be stored; it has to be used right at the very moment it is generated. The utility cannot just save some currently unused power for a later time to avoid a possible black out. In the meantime, the usage of power hungry appliances and gadgets is exponentially growing and thus the power grid is experiencing continuous straining loads. As a way of addressing shortcomings of current power grids, changes are underway to develop a more reliable and efficient version of the power grid: the Smart Grid (SG). DSEM is considered one of the key features of the future Smart Grid, as it enables a more efficient and reliable grid operation. As discussed earlier in this chapter, demand profiles may be shaped through one or more of the different DSEM approaches (LM, DR, and EE). DSEM need not be implemented only in a Smart Grid; however, to achieve optimum results from DSEM programs, demand and supply sectors need to be interconnected via a grid that is “smarter”, a grid whose infrastructure provides flexible two-way communication.
3.5.2 Smart Grid Definition
The adjective “smart” has been extensively used during the past years; particularly with existing systems that are to be upgraded with smart features allowing more reliability, flexibility, efficiency, and a better service to end users. Power grids are no exceptions; they need to be “smarter”. The Smart Grid is an interconnected system of electricity generation, transmission, distribution, and end use technologies integrated with communication and information technologies (Figure 3-7). Smart grids have the potential to:
• Assist consumers to economically and efficiently manage their energy usage
• Upgrade and automate generation, transmission, and distribution systems to ensure reliability and stability of the power grid
• Improve integration of renewable energy sources and energy storage.
Figure 3-7: Smart Grid layout illustrating integrated demand and supply sectors (Hitachi)
3-9
3.5.3 Smart Grid Characteristics and Components
The characteristics of the Smart Grid according to the U.S. Energy Independence and Security Act of 2007 are as follows:
• Increased use of digital information and controls technology to improve reliability, security, and efficiency of the power grid
• Dynamic optimization of grid operations and resources, with full cyber-security
• Integration of distributed energy sources including renewable resources
• Incorporation of demand side management activities and resources
• Deployment of “smart” technologies (real-time, automated, interactive technologies that optimize physical operation of appliances and consumer devices) for metering, communications concerning grid operations and status, and distribution automation
• Integration of ‘‘smart’’ appliances and consumer devices
• Integration of advanced electricity storage and peak-shaving technologies, including plug-in electric and hybrid electric vehicles, and thermal-storage air conditioning
• Provision to consumers of timely information and control options
• Development of standards for communication and interoperability of appliances and equipment connected to the grid, including the infrastructure serving the grid.
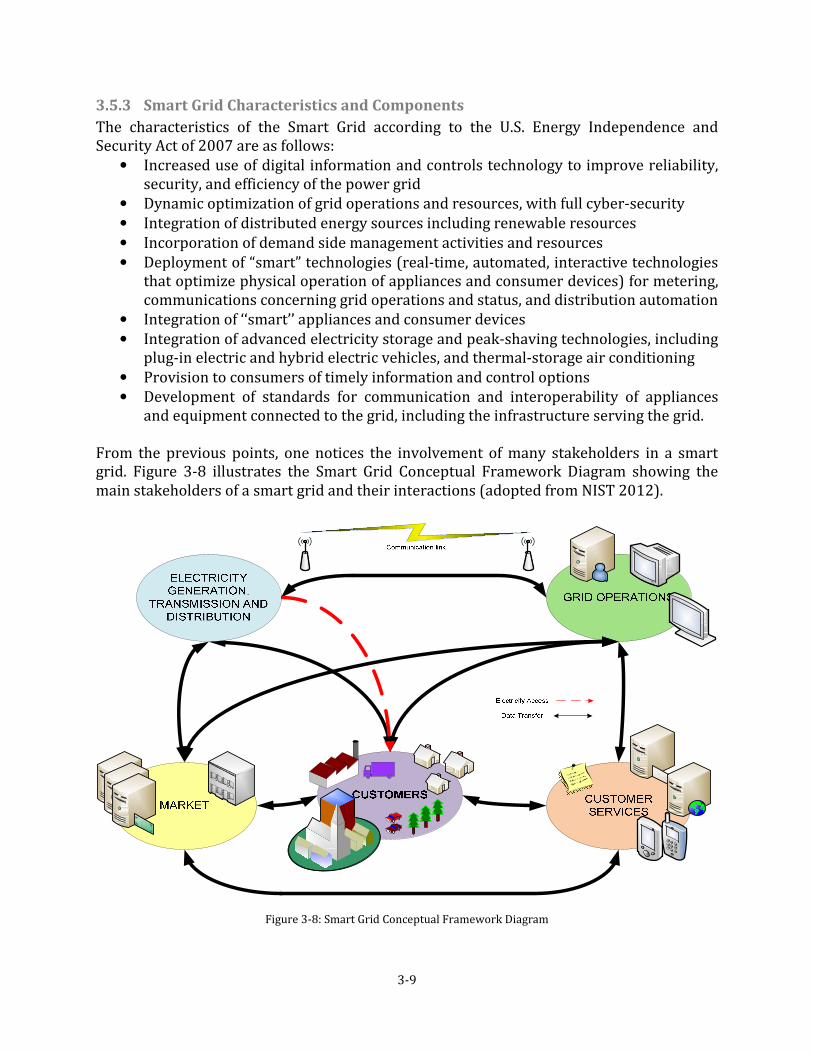
From the previous points, one notices the involvement of many stakeholders in a smart grid. Figure 3-8 illustrates the Smart Grid Conceptual Framework Diagram showing the main stakeholders of a smart grid and their interactions (adopted from NIST 2012).
Figure 3-8: Smart Grid Conceptual Framework Diagram

3-10
The key system components of a Smart Grid are summarized as follows:
• Supportive communication systems: different wired and wireless communication infrastructures are essential to support data exchange between the different market players of the electricity sector (utility and customer, utility and appliance, utility and data aggregator, customer and appliance, customer and data aggregator)
• Advanced Metering Infrastructure (AMI): this metering approach can be already found in many homes and businesses; it aims at giving accurate real time readings of power and energy consumption for customers to help them curtail their load profiles and cut on needless wastes. This concept is continuously undergoing developments to match advanced appliance technologies (smart meters, smart thermostats, etc.)
• System monitoring and control: advanced sensors and measurement technologies are crucial for monitoring and reporting system conditions to control systems in order to react accordingly
• Substation and distribution automation: intelligent switching and capacitor control
• Energy storage systems and electric vehicles
• Distributed and centralized generation capacities
• Advanced utility and end users’ interfaces and decision support tools.
3.5.4 Smart Grid Benefits
The benefits associated with smart grids are numerous; generic benefits introduced via smart grids can be summarized as follows:
• More efficient electricity transmission
• Quicker electricity restoration after power interruptions
• Reduced peak demand
• Reduced management, operations and maintenance costs for utilities
• Lower power costs for consumers
• Increased integration of distributed energy systems
• Improved security, reliability, quality of service, and robustness. While the smart grid provides powerful benefits in general, it especially offers the scalability, flexibility and effectiveness necessary for widespread deployment and cost effectiveness of DSEM. Smart grids allow customers to make more well-versed decisions about their energy consumption, translating it into economic and social benefits; they offer the promise of saving on bills, operating more efficiently, and reducing emissions of GHG associated with power generation. The penetration of smart meters, which is experiencing a constant increase nowadays, allows households to make more aware decisions on their energy consumption; the computing capabilities available via ubiquitous data networks needed for exchanging control signals enabling utility controls over demand side are becoming more advanced and complex day after day; and smart pricing is considered one of the most effective approaches to encourage efficient consumption behavior of users (Samadi et al. 2011; Luh et al. 1982; Tang & Song 2005; Crew et al. 1995; Zeng et al. 2008).

3-11
3.5.5 Adopting the Smart Grid in the MENA Region
In order to expand generation, transmission, and distribution capacities, and bring new technologies to the existing power grid infrastructure and approach the Smart Grid concept, rigorous cooperation is needed notably between government and industry. Gellings (2009) introduces a list of six steps that should be taken in order to accelerate the adoption of smart grids, enable expanded generation from renewable energy sources, and reduce the risk of having regional blackouts:
• Coordinate – locally and regionally – when building new generation and transmissions facilities to guarantee fair competition, and provide regional transmission organizations and independent system operators with authority to carry out coordinated expansion planning
• Adopt technologies required for wide-area grid operations to enable direct monitoring and computerized estimation of grid status by operators, and assess grid security
• Reconsider conditions and operations planning that might lead to blackouts as indicated by security assessment software
• Coordinate between grid operations and power market operations to minimize risk of blackouts, prevent price spikes, and ensure that power flows are handled more cost-efficiently and transmission congestion is avoided
• Improve emergency operations by providing clear lines of authority for handling emergencies effectively, and training system operators about grid restoration and black starts
• Update information systems by using advanced technologies and continuously revise their usage procedures.
3.6 Conclusion
DSEM plays an important role in electricity market design for both supply and demand sides. It helps in reducing utilities investment on peak generation and maximizing power systems utilization. In addition, it achieves significant savings for customers through reduced bills or incentive payments. DSEM is a very crucial concept that needs to be more widely deployed in the MENA Region, notably with soaring dependencies on electrical/electronic appliances and gadgets. Current demand related energy strategies need to be stricter, especially with respect to electric energy consumption which has huge savings potentials across the different demand sectors. As we have seen, there are different types of DSEM practices. The choice of a certain DSEM activity to be implemented by the utility principally depends on the following factors:
• Location of the demand unit
• Type of electricity market governing this location and its regulations
• Type of demand sector to which the unit belongs
• Available communication and control infrastructure
• Acceptance and participation levels of end users
• Current and prospective government energy strategies and policies
• Investments needed to implement such DSEM activities.

4-1
4 Communication Technology: Power Line Communication (PLC)
4.1 Introduction
In this chapter, we will present a number of different communication technologies used in low voltage distribution networks then introduce Power Line Communication (PLC) and deduce why it was the technology of choice in this research.
4.2 Communication Technologies in Low Voltage Distribution Networks
There is a difference between communication requirements in low voltage distribution networks and high voltage transmission networks (Figure 4-1). This is due to the dissimilarity in the number of end points and communication paths; low voltage distribution networks have a huge number of customers to be served unlike transmission networks that carry high voltage power to a relatively limited number of distribution transformers (Shafiu & Watts 2007).
Figure 4-1: Medium and low voltage power distribution versus high voltage transmission
In Mak & Radford (1996), the main characteristics of communication systems deployed in low voltage distribution networks are highlighted in the following points:
• Large number of dispersed communication nodes serving end users distributed in a variety of topographies
• Hierarchical communication network
• Small quantity of information for each node
• Large amount of total information
• Matching between application requirements and associated data throughput and system response times.

4-2
In addition, the performance requirements of communication systems for different applications are diverse. As discussed in Shafiu & Watts (2007), the following requirements should be taken into consideration when selecting communication systems in low distribution networks:
• Real-time capability
• Flexible and open structure
• Cost-effectiveness
• Low operational and maintenance costs
• High reliability.
4.2.1 Power Line Communication
PLC has been in operation since decades as a low data rate service used to remotely control devices on the power grid. PLC is a mature technology; high bit rates are possible with recent PLC technologies (Gungor & Lambert 2006; Shafiu & Watts 2007). The advantages and disadvantages of PLC are mentioned below.
Advantages
• Extensive coverage: power lines are installed almost everywhere and this provides broad coverage even for rural areas where other communication infrastructure may not be available.
• Cost: since existing power lines are used for the infrastructure of PLC networks, communication can be established quickly and cost effectively (Gungor & Lambert 2006).
Disadvantages
• High noise resulting in high bit error rates: when it comes to data communications, power lines environments are considered noisy due to their surrounding by noise sources (e.g. electrical motors, power supplies, fluorescent lights and radio signal interference) (Pavlidou et al. 2003).
• Attenuation and distortion: signal attenuation and distortion can be significant for reasons such as power network physical topology and power lines impedance fluctuation. Furthermore, signal attenuation arises significantly at specific frequency bands as a result of wave reflection at terminal points (Galli & Scaglione 2003).
• Security: there is neither shielding nor twisting in power cables and thus power lines produce a significant amount of Electro Magnetic Interference (EMI) which can be received via radio receivers (Liu & Widmer 2003). Therefore, in order to guarantee security of data, appropriate encryption techniques must be used to prevent interceptions by unauthorized persons.
• Open circuit problem: communication over the power lines is lost with devices on the far side of an open circuit, which severely restricts the usefulness of power line carrier systems for applications involving re-closers, switches, and outage detection. However, advancements in PLC technologies and loop configurations continuously attract automation applications, especially when combined with customer services (McGranaghan & Goodman 2005).
4-3
• Interference: Usual PLC operating up to carrier frequencies of 30 MHz will cause narrowband interference with several services in the corresponding bands like e.g.
amateur radio. In view of the sensitivity of the latter in the range of about 1 µV the use of notch filters in the PLC can be employed to avoid the otherwise arising cross-talk. However, care must be taken to cover the whole radio spectrum and to take into account nonlinearities in the overall efficient channel.
4.2.2 Internet Communication
Recent advances in Internet technology and Internet-ready Intelligent Electronic Devices (IEDs) have enabled cost-effective remote monitoring and control systems. Therefore, such technologies are becoming feasible support solutions for a myriad of applications (e.g. remote access to IEDs, relay configuration ports, diagnostic event information, video for security or equipment status assessment in substation and automatic metering). The advantages and disadvantages of Internet communication are introduced below (Gungor & Lambert 2006; Shafiu & Watts 2007). Advantages The necessary communication infrastructure required for internet communication already exists in many demand sectors worldwide, and its coverage is continuously spreading. Disadvantages
• Quality of Service (QoS): the Internet cannot guarantee the very strict QoS demanded by real-time or automation applications. This is mainly due to the fact that data communication in Internet is based on the paradigm of best effort service.
• Security: when a public network like the Internet is utilized to connect the field devices to a remote control center, security concerns can arise.
• Scalability: since the number of substations and remote devices is large and growing rapidly, the communication system must be able to deal with very large network topologies without increasing the number of operations exponentially. Therefore, the architecture of the designed Internet network should scale well to accommodate new communication requirements driven by customer demands.
4.2.3 Public Telephone Network Communication
The public telephone network is an easy and convenient way of communications in low voltage distribution networks. It can be used in situations where there are no strict requirements on time delay, for example in Automatic Meter Reading (AMR).
Advantage
The communication network can be established quickly and cost-effectively. Disadvantage
This an expensive means of communication. Furthermore, the independence of such communication systems is weak since they depend on the relevant telecom companies for their maintenance and repair.

4-4
4.2.4 Satellite Communication
This technology offers innovative solutions for remote control and monitoring of substations. It also provides extensive geographic coverage which offers a good communication infrastructure alternative for electric system automation where other infrastructures, such as telephone or cellular networks, might not exist. However, due to its high cost, it has not been used in low distribution networks (Gungor & Lambert 2006). Advantage
Satellite communications offer global coverage and rapid installation.
Disadvantages
Satellite communications need extensively higher costs than other possible communication options. In addition, it experiences relatively large latencies and is highly weather-dependent.
4.2.5 Optical Fiber Communication
Optical fiber communication systems were first introduced in the 1960s. They offer significant advantages over traditional copper-based communication systems. However, the cost of the optical fiber itself is still expensive to install, especially for low voltage distribution networks (Gungor & Lambert 2006). Advantage
Optical fibers have an extremely high bandwidth which can provide high performance communication. In addition, this means of communication endures very low bit-error rates. Optical fibers do not radiate significant energy and do not pick up interference from external sources. Disadvantages
In order to install optical fiber in low voltage distribution network, significant costs are needed.
4.2.6 Wireless Communication
Several wireless communication technologies currently exist for electric power system applications. When compared with conventional wired communication networks, wireless communication technologies have potential benefits for remote monitoring and control functions, but at the same time they still have several disadvantages. Advantages
• Cost: using an existing wireless communication network (e.g. cellular networks) might enable a cost-effective solution for load management, mainly due to the cut down in initial investment costs for the communication infrastructure. In wireless communication, cabling cost is also eliminated.
• Rapid installation: installing wireless communication systems is faster than wired networks. In addition, within the radio coverage area, communication entities can start to communicate right after installation is completed.
4-5
Disadvantages
• Limited coverage: private wireless networks provide a limited coverage (e.g. approximately 100 m coverage in IEEE 802.11b) (Galli et al. 2003), while public wireless networks (e.g. cellular network, or WiMAX) may not have any coverage in some geographical areas (e.g. remote rural locations) or indoor environments.
• Capacity: wireless communication technologies provide lower QoS compared to wired communication networks. Due to limitations and interference in radio transmission, a limited spectral efficiency is supported and fading can lead to significant reduction of throughput. In addition, since wireless communication is in a shared medium, the application average data rate per end user is lower than the total bandwidth capacity (e.g. maximum data rate of IEEE 802.11b is 11 Mbps, while the average application data rate is approximately 6 Mbps) (Jun et al. 2003).
• Security: certain wireless communication standards face serious security challenges since the communication signals can potentially be captured by nearby devices, for instance in wireless LANs. Therefore, efficient authentication and encryption techniques should therefore be applied in order to provide secure communication which, in view of specifications in legacy systems, is not easily doable.
We have seen the advantages and disadvantages of different communication technologies. We conclude this section by choosing PLC as the communication technology that links end users with the electric utility in our proposed SG environment. This is mainly due to their extensive coverage in the MENA Region; as we have seen earlier in section 2.2, the access of electricity exceeds 90% in most countries of the region. In addition, any needed PLC extensions can be established quickly and in a cost effective way, while multiple services may be introduced via the same PLC infrastructure (e.g. Load Management, and Advanced Metering Infrastructure).
4.3 Power Line Communication (PLC)
4.3.1 Introduction
Electrical power is transmitted over high voltage transmission lines, distributed over medium voltage, and used at low voltage. PLC is functional at each voltage level (in existing premises wiring, low voltage distribution networks, or high voltage transmission networks). Even though most PLC technologies limit their functionality to one voltage level, some are deployed in more than one voltage level. PLC has been widely used since decades in high voltage transmission networks, mainly for telemetry and tele-protection. The major advantage of having such a system is its dual functionality: power transmission and data communication. It is an attractive option especially for utilities since they have an extra functionality (transmitting data) via the infrastructure they already control (power transmission), which can be used in many applications. The use of PLC in low voltage networks, however, is still under investigation as it is relatively new. Different issues need to be tackled in order to sustain this technology, and this represents a real challenge for scientists and engineers. Some of the pressing issues

4-6
are: unpredictable dependence of impedance on time and frequency; noise behavior; attenuation and interference characteristics; and bandwidth limitations. PLC operates by sending data over power lines; the data signal modulates a radio frequency carrier signal which is then sent over power wiring. The frequency used in sending this modulated carrier depends mainly on the signal transmission characteristics of the power wiring.
4.3.2 PLC Systems
Technologies of PLC are categorized in a number of ways depending on the application they are deployed in; narrowband vs. broadband; over AC vs. over DC; access vs. in-house. In our case, we focus on narrowband access PLC technologies; in other words, last mile PLC connectivity having a relatively small amount of data transferred – bit rate – compared to broadband data communication. However, a short overview about in-house PLC will be given just to make contrast between the two technologies. The following sections are mainly based on research data found in Berkman & Mollenkopf (2006), Zuberi (2003), and Selander (1999).
In-house or local PLC
Data is exclusively transferred within the consumer’s premises via in-house PLC technology. It extends it to all electrical outlets within the home, where such electrical outlets providing AC power act as access points for PLC network devices. In-house technologies focus on delivering a short distance high bandwidth solution (≥10 Mbps) that competes with other existing in-house interconnection technologies (wireless, phone line network, etc.). Figure 4-2 illustrates a typical in-house PLC solution.
Figure 4-2: In-house Power Line Communication connectivity (Panasonic)
Access or Last Mile PLC
This PLC technology is responsible for sending data over low voltage networks outside household premises. It acts as a “last mile” connection between customer premises and the distribution transformer found on electric poles or local kiosks. At the distribution transformer, a bypass device (e.g. extractor/coupler) is installed in order to let data signals

4-7
pass in parallel to the transformer and not be blocked. Then data coming from different distribution transformers is aggregated before the substation and transmitted via a backhaul technology to the electric utility. The backhaul technology can be any wired or wireless communication link: fiber optics, free space optics, coaxial cables, twisted pair cables, WiFi, WiMAX, Ethernet, etc. Figure 4-3 illustrates access PLC. Access PLC uses injectors, repeaters, and extractors to deliver its services: injectors, as their name implies, inject a PLC data signal to the medium voltage network; extractors/couplers interface between medium voltage network and low voltage network; and repeaters overcome losses due to attenuation experienced by data signals in long distance transmission. In countries that install large distribution transformers to provide a large number of consumers with services, the usage of access PLC is very suitable. This is mainly due to the fact that the number of extractors and repeaters to be used will be much less than if few consumers are connected to the distribution transformer.
Residential Customer 2
Distribution Substation
Distribution Transformer
XData aggregation
point
Residential Customer n
Residential Customer 1
Bypass devices
Utility Control Center
(load management)
Backhaul link
Figure 4-3: Access Power Line Communication system layout
4.3.3 PLC Applications
PLC can be deployed in many applications, some of which are listed below:
• Advanced Metering Infrastructure (AMI): electricity, water, or gas meter readings can be transmitted over PLC, and collected at a center point for billing, developing analytics, and controlling the power grid accordingly. The market for AMI is huge and it justifies continuous developments in PLC technologies. In order to move a step forward towards a smart grid, deploying AMI is a must.

4-8
• Home networks: electrical and electronic appliances within the house can be interconnected, and therefore monitored and controlled centrally via end users. This is part of what is called a smart home.
• Last mile two-way data communication: as discussed earlier, PLC can be used to connect customer premises with service providers; Internet broadband and DSEM control schemes are among the most well-known PLC access applications.
• Distribution Automation and Supervisory Control and Data Acquisition (DA and SCADA): utility companies use such systems to monitor and control power distribution networks. It seems more viable to use PLC in such systems instead of PSTN or dedicated RF networks.
• Rural communication systems: in low density areas – where installing capital intensive communication infrastructures is not possible or non-profitable – PLC is a good alternative.
• PLC is also under discussion for use on board an aircraft. Here, the challenge is a distribution of broadband services like Internet access, video streams, and alike. Electromagnetic compatibility and the high required spectral efficiency suggest the use of a wired technology rather than wireless systems.
Perhaps the most significant push the PLC sector has received recently is the availability of a range of Application Specific Integrated Circuits (ASIC) and other products from a number of vendors which help designers to implement high end applications that overcome technology disadvantages, faster and better.
4.3.4 Narrowband PLC Standards
The existing PLC standards do not exactly address smart grid requirements; they are not scalable, too complex, and do not have enough throughput. The ideal PLC low frequency narrowband standard would have scalable bitrates from 1bps to 10Kbps (up to 500Kbps). It would also support rural and urban power grid data communications, and be available for AC as well as DC power lines. The most widespread narrowband PLC standards worldwide are the following:
4.3.4.1 FCC
The FCC Standard is used in North America. It regulates the power and bandwidth of the transmitted data through power line networks. The frequency band allowed for this standard is between 0 and 530 kHz (Abdelhalim 2007). In the FCC rules, communication over power line is allowed outside the AM frequency band (outside 535 to 1705 kHz).
4.3.4.2 CENELEC
The CENELEC Standard is used in countries of the European Union, Iceland, Norway and Switzerland; the frequency band assigned to this standard is narrower than that of FCC: 3 kHz to 148.5 kHz. The regulations concerning low voltage power line networks are described in (EETimes 2011). The frequency range allowed is divided into five sub-bands, and is shown as follows (Table 4-1):
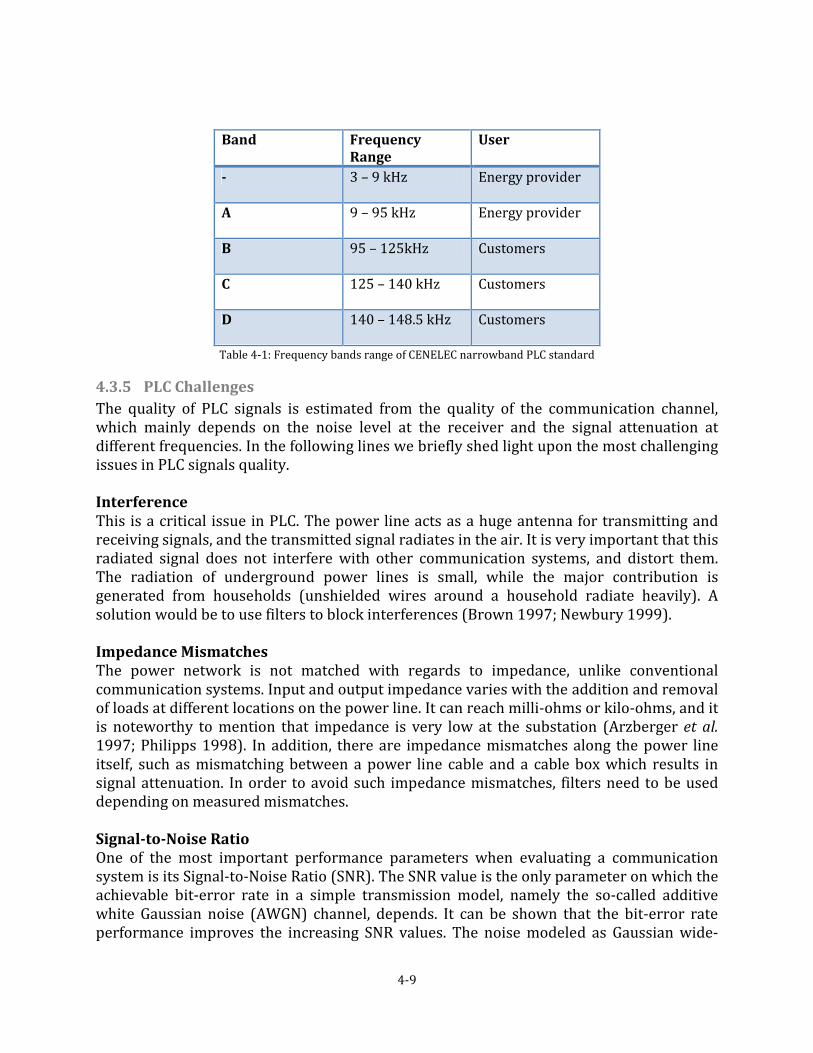
4-9
Band Frequency
Range
User
- 3 – 9 kHz Energy provider
A 9 – 95 kHz Energy provider
B 95 – 125kHz Customers
C 125 – 140 kHz Customers
D 140 – 148.5 kHz Customers
Table 4-1: Frequency bands range of CENELEC narrowband PLC standard
4.3.5 PLC Challenges
The quality of PLC signals is estimated from the quality of the communication channel, which mainly depends on the noise level at the receiver and the signal attenuation at different frequencies. In the following lines we briefly shed light upon the most challenging issues in PLC signals quality. Interference
This is a critical issue in PLC. The power line acts as a huge antenna for transmitting and receiving signals, and the transmitted signal radiates in the air. It is very important that this radiated signal does not interfere with other communication systems, and distort them. The radiation of underground power lines is small, while the major contribution is generated from households (unshielded wires around a household radiate heavily). A solution would be to use filters to block interferences (Brown 1997; Newbury 1999). Impedance Mismatches The power network is not matched with regards to impedance, unlike conventional communication systems. Input and output impedance varies with the addition and removal of loads at different locations on the power line. It can reach milli-ohms or kilo-ohms, and it is noteworthy to mention that impedance is very low at the substation (Arzberger et al. 1997; Philipps 1998). In addition, there are impedance mismatches along the power line itself, such as mismatching between a power line cable and a cable box which results in signal attenuation. In order to avoid such impedance mismatches, filters need to be used depending on measured mismatches. Signal-to-Noise Ratio
One of the most important performance parameters when evaluating a communication system is its Signal-to-Noise Ratio (SNR). The SNR value is the only parameter on which the achievable bit-error rate in a simple transmission model, namely the so-called additive white Gaussian noise (AWGN) channel, depends. It can be shown that the bit-error rate performance improves the increasing SNR values. The noise modeled as Gaussian wide-

4-10
sense stationary process includes disturbances of many different sources in the receiver, i.e. thermal noise in the power amplifiers, as well as on a power line, such as signal from vacuum cleaners, kitchen machines, TVs, computers, etc. A further detrimental effect is introduced by signal attenuation introduced by the physical propagation channel. The signal might not be detected at all at the receiver if attenuation encountered by the signal reaches very high level. Due to the high attenuation levels on power lines (up to 100 dB), there are restrictions on the allowed distance between the transmitter and receiver (Arzberger et al. 1997). To avoid such distance restrictions, repeaters are added along the power line. In order to improve the SNR, the use of filters is encouraged (Newbury 1999) to block noise generated in households from disturbing the grid power lines. It is noteworthy to mention that although power lines are highly susceptible to disturbances and attenuation, other communication systems used today have the same tendency.
4.4 Conclusion
Power lines are a hostile environment for communication links, having time variant parameters. However, it is a promising technology in light of the continuously innovative solutions which guarantee high quality signal integrity. Care must be taken to ensure that load control signals are transmitted and received via PLC in suitable times so as to avoid increasing levels of signal disturbances. When compared to the widespread internet infrastructure, PLC greatly excels in outreach and cost effectiveness; extensive electricity coverage exceeds 90% in most MENA Region countries; any needed extensions can be established quickly and cost effectively. In addition, multiple services may be introduced via the same PLC infrastructure (e.g. Load Management, Distribution Automation, Advanced Metering Infrastructure, etc.).

5-1
5 Control Technology: Networked Control Systems (NCS)
5.1 Introduction
There is a growing trend across a wide range of systems and products to phase out centralized control systems and introduce intelligent distributed controls that rely on open standard control network architectures. Whether control is embedded in a machine system, around a factory for automation purposes, in consumer gadgets, or for building automation controls, distributed control systems developed using a standard communication protocol and readily available off-the-shelf low cost components are gaining grounds. Such solutions offer great flexibility and reliability, as well as short time to market development cycles. In addition, current approach of using a central SCADA system and several smaller distributed SCADA systems is no longer sufficient for large complex smart grid operations. The technical details available in the following sections of this chapter are based on Echelon’s documentation of the Mini FX PLC Evaluation Kit (PL EG; PL HG; PL QS; PL UG; Neuron C PG; Neuron C RG).
5.2 Networked Control Systems
In a networked control system, control devices each have embedded intelligence that implements the network protocol and control functions, in addition to a transceiver to link the device to the communication medium. Simple devices implement a single task while more complex devices may implement multiple tasks. Examples of devices in a control network are: sensors, actuators, motion detectors, switches, SCADA, etc. The devices or nodes of networked control systems communicate directly with each other; this in turn provides great flexibility and low overhead in transferring status and control signals between system nodes (Figure 5-1).
Figure 5-1: Networked Control System
On the other hand, in centralized control systems sensors send status data to a central controller which then sends control pulses to actuators. Each central control system has its own processing unit and inputs/outputs. Such systems are complex to design, expensive to develop, costly to install, and difficult to expand (Figure 5-2).
Figure 5-2: Centralized Control System
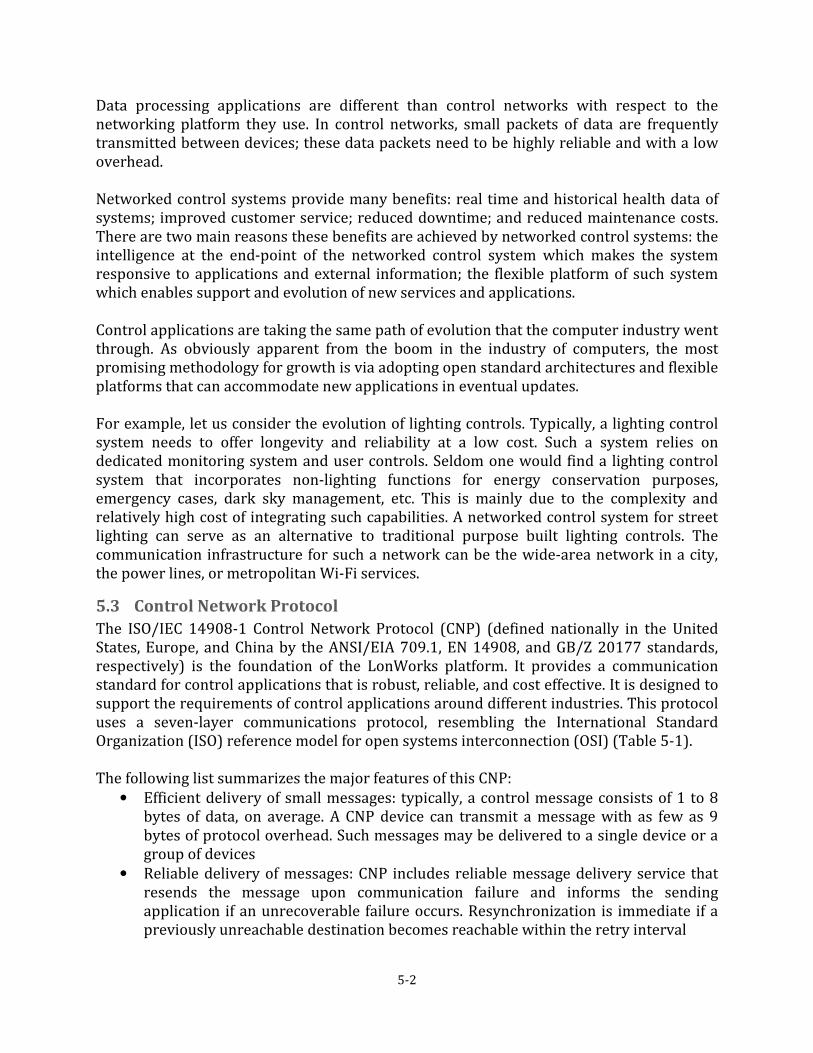
5-2
Data processing applications are different than control networks with respect to the networking platform they use. In control networks, small packets of data are frequently transmitted between devices; these data packets need to be highly reliable and with a low overhead. Networked control systems provide many benefits: real time and historical health data of systems; improved customer service; reduced downtime; and reduced maintenance costs. There are two main reasons these benefits are achieved by networked control systems: the intelligence at the end-point of the networked control system which makes the system responsive to applications and external information; the flexible platform of such system which enables support and evolution of new services and applications. Control applications are taking the same path of evolution that the computer industry went through. As obviously apparent from the boom in the industry of computers, the most promising methodology for growth is via adopting open standard architectures and flexible platforms that can accommodate new applications in eventual updates. For example, let us consider the evolution of lighting controls. Typically, a lighting control system needs to offer longevity and reliability at a low cost. Such a system relies on dedicated monitoring system and user controls. Seldom one would find a lighting control system that incorporates non-lighting functions for energy conservation purposes, emergency cases, dark sky management, etc. This is mainly due to the complexity and relatively high cost of integrating such capabilities. A networked control system for street lighting can serve as an alternative to traditional purpose built lighting controls. The communication infrastructure for such a network can be the wide-area network in a city, the power lines, or metropolitan Wi-Fi services.
5.3 Control Network Protocol
The ISO/IEC 14908-1 Control Network Protocol (CNP) (defined nationally in the United States, Europe, and China by the ANSI/EIA 709.1, EN 14908, and GB/Z 20177 standards, respectively) is the foundation of the LonWorks platform. It provides a communication standard for control applications that is robust, reliable, and cost effective. It is designed to support the requirements of control applications around different industries. This protocol uses a seven-layer communications protocol, resembling the International Standard Organization (ISO) reference model for open systems interconnection (OSI) (Table 5-1). The following list summarizes the major features of this CNP:
• Efficient delivery of small messages: typically, a control message consists of 1 to 8 bytes of data, on average. A CNP device can transmit a message with as few as 9 bytes of protocol overhead. Such messages may be delivered to a single device or a group of devices
• Reliable delivery of messages: CNP includes reliable message delivery service that resends the message upon communication failure and informs the sending application if an unrecoverable failure occurs. Resynchronization is immediate if a previously unreachable destination becomes reachable within the retry interval

5-3
Layer Function Services
Physical Electrical interconnect
Media-Specific Interfaces and Modulation Schemes (twisted pair, power line, radio frequency, coaxial cable, infrared, fiber optic)
Link Media access and framing
Framing; Data Encoding; CRC Error Checking; Predictive CSMA; Collision Avoidance; Priority & Collision Detection
Network Message delivery Unicast & Multicast Addressing; Routers
Transport End to end reliability
Acknowledged & Unacknowledged Message Delivery; Common Ordering; Duplicate Detection
Session Control Request-Response; Authentication
Presentation Data interpretation
Network Variables; Application Messages; Foreign Frame Transmission
Application Application compatibility
Network Configuration; Network Diagnostics; File Transfer; Application Configuration; Application Specification; Alarming; Data Logging; Scheduling
Table 5-1: The seven layers of the ISO Open System Interconnection
• Duplicate message detection: certain types of control messages must not be delivered multiple times (e.g. event counter in monitoring application)
• Multiple communications media: CNP is media independent, and it supports routers so that devices on different channels can interoperate
• Low device cost: control devices can be as simple as a limit switch or a temperature sensor. In addition, CNP is optimized to minimize the size of protocol firmware and the memory requirements for buffer storage (e.g. complete implementation of CNP on Neuron core requires less than 10 Kbytes of code and less than 1 Kbyte of RAM)
• Low installation and maintenance cost: low device cost leads to low system cost only if devices are easily installed, networks are easily modified, and maintenance and reparations are simple. CNP offers support for low cost installation and maintenance solutions that simplifies network devices installations and diagnosis
• Efficient use of channel bandwidth: many devices share a single communication channel so as to go down with system costs. In CNP, new and innovative media access technologies are used so as to provide the most efficient use of the communications channels even with high loading conditions
• Interoperable systems: CNP supports interoperability between devices, which is essential when multiple systems need to interoperate to offer additional features to end users (e.g. a fire alarm system interoperating with an elevator control system to keep elevators away from burning floors, or with an emergency exit lighting system
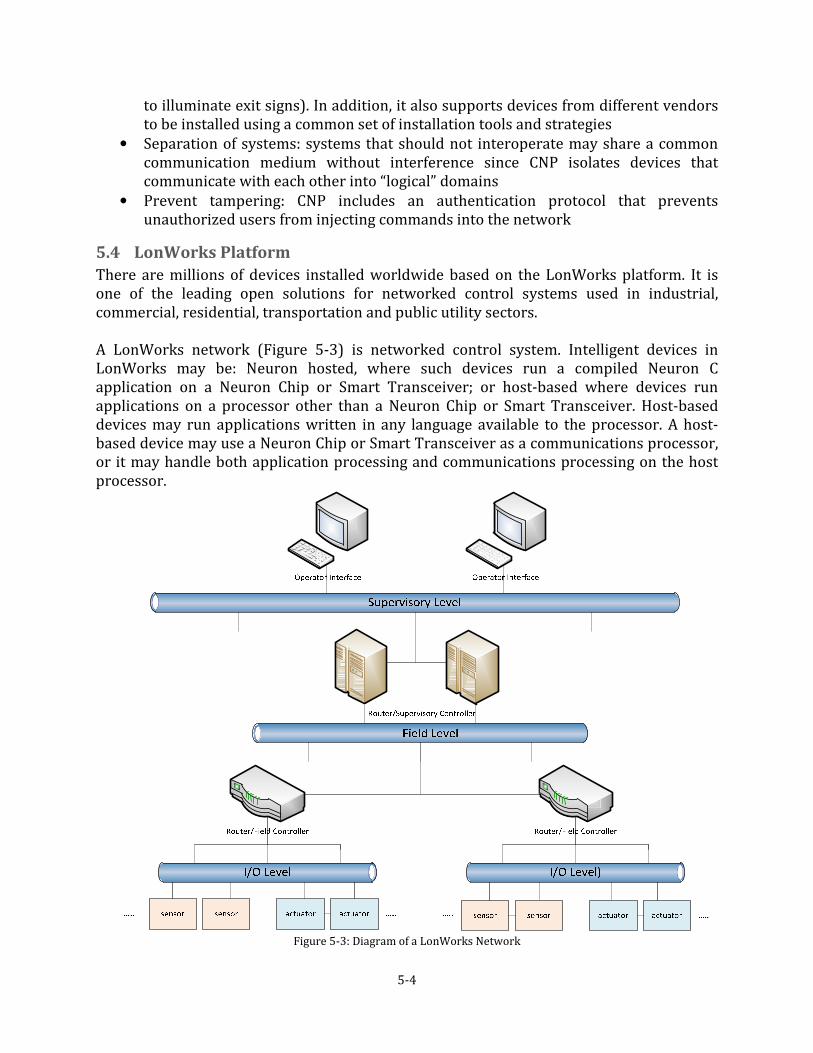
5-4
to illuminate exit signs). In addition, it also supports devices from different vendors to be installed using a common set of installation tools and strategies
• Separation of systems: systems that should not interoperate may share a common communication medium without interference since CNP isolates devices that communicate with each other into “logical” domains
• Prevent tampering: CNP includes an authentication protocol that prevents unauthorized users from injecting commands into the network
5.4 LonWorks Platform
There are millions of devices installed worldwide based on the LonWorks platform. It is one of the leading open solutions for networked control systems used in industrial, commercial, residential, transportation and public utility sectors. A LonWorks network (Figure 5-3) is networked control system. Intelligent devices in LonWorks may be: Neuron hosted, where such devices run a compiled Neuron C application on a Neuron Chip or Smart Transceiver; or host-based where devices run applications on a processor other than a Neuron Chip or Smart Transceiver. Host-based devices may run applications written in any language available to the processor. A host-based device may use a Neuron Chip or Smart Transceiver as a communications processor, or it may handle both application processing and communications processing on the host processor.
Figure 5-3: Diagram of a LonWorks Network

5-5
According to the application the device is running, it reads and writes data as needed. Data transfer between devices on a network requires a set of rules and procedures which constitutes the communication protocol. This protocol defines the format of messages sent between devices and the resulting actions due to such messages. Normally, this communication protocol is in the form of firmware or embedded software stored on each network device. In the context of this thesis, the Control Network Protocol is – as mentioned in the previous section – the ISO/IEC 14908-1 standard. The LonWorks platform provides interoperability, fast development, and robust technology. The concept of distributing processing over a network of devices using an open standard protocol and providing easy access to every device helps in lowering installation and life cycle costs, increasing reliability, and providing system flexibility to adapt to a myriad of applications.
5.5 Echelon Power Line Communication Evaluation Kit
This kit contains a hardware and software platform for evaluating the LonWorks Platform, which is our choice of networking platform. It is based on Series 5000 and 3100 Neuron Chips and Smart Transceivers (Figure 5-4).
Figure 5-4: Echelon Power Line Communication Evaluation Kit
The Mini kit lets you build Neuron-C applications and download them to LonWorks devices, and test them too. You can use the Mini kit to develop prototype or production devices, particularly in the rapidly growing, price sensitive mass markets of smart light switches, thermostats, and other simple devices and sensors. The following figure illustrates the LonWorks system level design (Figure 5-5).

5-6
Figure 5-5: LonWorks system level diagram (Echelon)
You can use the kit to do the following:
• Compile, build, and download a Neuron C device application to a development platform or to your own devices
• Test your design with prototype I/O hardware included with the PL 3170 and PL 3150 Evaluation Boards or with separately purchased boards, or build and test your own I/O hardware with your own custom device
• Create a self-installed LonWorks network and test how your device interoperates with other LonWorks devices
• View standard resource file definitions for standard network variable types, standard configuration property, and standard functional profiles
The Power Line Smart Transceivers integrate a Neuron processor core with a power line transceiver. These highly reliable, narrow-band smart transceivers are ideal for appliance, audio/video, lighting, heating/cooling, security, metering, and irrigation applications, making them suitable across a variety of applications. Essentially a system-on-a-chip, the smart transceivers include (Figure 5-6):
• Highly reliable narrow-band power line transceiver
• 8-bit Neuron processor core for running applications and managing network communications
• Choice of on-board (PL 3120/PL 3170) or external memory (PL 3150)
Figure 5-6 Power Line Communication Smart Transceiver Block Diagram (Echelon)

5-7
Features of Power Line Smart Transceivers
• Unmatched communication reliability: The Power Line Smart Transceivers incorporate a variety of technical innovations to ensure reliable operation: o Narrow-band technology with digital signal processing: using a sophisticated
digital signal processing core that employs patented noise cancellation and distortion correction algorithms. These features allow the transceiver to correct for a wide variety of impediments to power line signaling, including impulsive noise, continuous tone noise, and phase distortion
o Dual-carrier frequency: this unique feature automatically selects an alternate secondary communication frequency if the primary frequency is blocked by noise
o Forward error correction: many noise sources interfere with power line signaling by corrupting data packets; Echelon’s smart transceivers use a highly efficient, low-overhead forward error correction (FEC) algorithm in addition to a cyclical redundancy check (CRC) to overcome packet errors
o Powerful output amplifier: the external, high-output amplifier technology used with the smart transceivers can deliver 7Vp-p while complying with emission requirements worldwide
o Wide dynamic range: the PL 3120 and PL 3150 Smart Transceivers have a dynamic range of > 80dB. On a quiet line, the smart transceivers can receive signals that have been reduced by a factor of 104
• Compliant with worldwide power line signaling regulations: compliant with FCC, Industry Canada, Japan MPT, and European CENELEC EN50065-1 regulations, and therefore can be used in applications worldwide. The CENELEC communications protocol is automatically managed by the smart transceivers, so you don't have to develop the complex timing and access algorithms mandated under CENELEC EN50065-1. The smart transceivers can also operate in either the CENELEC utility (A-Band) or general signaling (C-Band) bands, so you don't have to stock multiple parts for different applications (Compliant with ISO/IEC 14908.1 and 14908.3, Compliant with ANSI 709.1 and ANSI 709.3)
• Integrated, low-cost, small-size design: you need only a small number of inexpensive external components to create a complete smart transceiver-based device
• Field-Tested, Proven Technology: the underlying core technology used in the smart transceivers was developed and optimized through years of field-testing in applications worldwide
• Extensive development resources for fast time to market
5.6 Neuron C Programming
Neuron C is a programming language based on ANSI C that you can use to develop applications for Neuron Chips and Smart Transceivers. It includes network communication, I/O, interrupt-handling, and event-handling extensions to ANSI C, which make it a powerful tool for the development of LonWorks device applications. The following are a few of the extensions to ANSI C provided by Neuron C:
• Network communication model based on functional blocks and network variables that simplifies and promotes data sharing between like or different devices

5-8
• Network configuration model based on functional blocks and configuration properties that facilitates interoperable network configuration tools
• Type model based on standard and user resource files that expands the market for interoperable devices by simplifying integration of devices from multiple manufacturers
• Extensive built-in set of I/O objects that supports the powerful I/O capabilities of Neuron Chips and Smart Transceivers
Neuron C provides a rich set of language extensions to ANSI C tailored to the unique requirements of distributed control applications. Experienced C programmers will find Neuron C a natural extension to the familiar ANSI C paradigm. Neuron C offers built-in type checking and allows the programmer to generate highly efficient code for distributed LonWorks applications. A Neuron C application executes in the environment provided by the Neuron firmware. This firmware provides an event-driven scheduling system as part of the Neuron C language’s run-time environment. Therefore, a Neuron C application does not use a single entry point, as is the case with ANSI C’s main() function. Instead, a Neuron C application uses when-tasks and interrupt-tasks to specify application code to be executed in response to various system events or interrupt requests. The Neuron firmware contains a scheduler, which executes these when-tasks in an orderly and deterministic fashion as and if needed. Neuron C when-tasks can be triggered by system events (such as reset), network events (such as a network variable update or network error), I/O events (such as a new reading from an I/O input), timer events, or any arbitrary application-defined event.
5.7 Conclusion
In a Networked Control System, control devices each have embedded intelligence that implements the network protocol and control functions, in addition to a transceiver that links the device to the communication medium. The devices or nodes of networked control systems communicate directly with each other, thus providing great flexibility, reliability, as well as short time to market development cycles. Networked Control Systems offer better solutions than current central SCADA system which are no longer sufficient for large complex smart grid operations. In this chapter, we have introduced the Echelon Power Line Communication Evaluation Kit which will be used to make a demo to demonstrate the communication link between the utility and the consumer via hardware emulation of a simple sensor and actuator connection.
6-1
6 Demand Load Management Algorithm
6.1 Introduction
The approaches by which an electric load is managed and controlled are numerous and can be classified in a number of ways as stated in Shafiu & Watts (2007). Load control schemes are categorized according to the form of communication they use to carry out control; they are considered to be based either on a frequency measurement (i.e. no dedicated communication system), a one-way communication system, or a two-way communication system. Load control schemes can be also classified according to directness with respect to utility: indirect load control and direct load control. Table 6-1 lists the categories and subcategories of load control.
Load Control Categorization Subcategories
Form of Communication • Frequency measurement
• One way communication
• Two-way communication
Directness with respect to
utility • Direct load control (one way, or two-way
communication
• Indirect load control (demand response, or frequency response)
Table 6-1: Categories of load control
The communication speed by which loads are controlled via PLC vary from a few seconds to a few minutes, depending on the level at which the control is taking place: in DR, where DSEM is implemented at a domestic level, the delay is in the order of a few seconds and is mainly due to the response time of the loads; in LM, which is a utility based control, the associated delay is longer (in the order of minutes) due to the transfer of control signals through the communication medium (in our case power lines). The required speed of communication depends on the type of anticipated reserve:
• For primary control reserve applications, a speed of less than two seconds is required. However, if the DSM is used for secondary control reserve applications, a speed of several minutes is enough
• For peak demand reduction, a speed of several minutes or longer is enough since peak demand doesn't occur suddenly (the load curve of large-scale power systems changes gradually)
• The speed required to carry out local congestion elimination is of the order of a minute or slightly longer. The requirement depends on the thermal limits of the network equipment causing the congestion
Since we are mainly concerned with peak demand reduction (require a speed of several minutes or longer to communicate), and as noted above the delay introduced in controlling the loads via PLC is in the order of a few minutes, therefore our case scenario is acceptable in terms of time delays.

6-2
6.2 Technical Issues
6.2.1 Load Control Approaches
As mentioned above, load control in DSEM can be categorized by its communication form or directness. However, putting clear cut lines between such categorizations is not possible as they are strongly interlinked. How these categorizations are interwoven will be apparent in the section (Shafiu & Watts 2007).
6.2.1.1 Indirect Load Control
6.2.1.1.1 Demand Response
In indirect load control such as that of demand response programs, the customers control the operation of their appliances by themselves while taking into account external parameters such as real-time electricity price. Demand Response has been discussed earlier in more details (see section 3.3.2). Obviously there is no unique definition describing how such external parameters correlate with consumed power resulting from indirect load control techniques. Furthermore, the utility lacks operating status data of appliances during this type of control and therefore coordinating between different appliance technologies is definitely a challenge as stated in Rowland (2011).
6.2.1.1.2 Frequency Response
The use of system frequency measurement in DSEM with no dedicated communication system is similarly considered an indirect load control method; appliances are equipped with electronic cards to control their consumed power according to frequency deviations. Since frequency is an indicator of generation and demand balance, this method is most useful as a means of meeting frequency response needs. This method has been practically applied on some small-scale isolated power systems in European islands. The required characteristics of such systems are as follows:
• Need for fast frequency response
• No need for utility to be aware of controllable loads status since a dump load is available (does not need complicated controls execution to achieve balance)
• Measuring frequency deviation is quite easy since deviations are quite high (a few Hertz)
• Allocation of different frequency thresholds to switch appliances on or off can be done manually due to limited customers count
One example of the use of this method to control appliances has been developed by the Pacific Northwest National Laboratory in the US. The Laboratory has developed a small electronic card, ‘the Grid Friendly Controller’, which can be installed in refrigerators, air conditioners, and water heaters. These low cost devices monitor system frequency and switch off for between a few seconds and a few minutes in response to low frequency. It is noteworthy to realize that using this method does not allow utilities to evaluate the amount of power saved as a result of load control. Therefore, for the sake of sustainability, estimations are made using sample monitoring or empirical models to calculate saved power.
6-3
6.2.1.2 Direct Load Control
In the case of direct load control, customers are provided with the hardware and communication infrastructure that allows utility based direct load control. This is referred to as Load Management. The details of this topic have been discussed earlier (see section 3.3.1). The utility’s role in this approach is to know the preferred consumption behaviors of end users and required load reductions by the power grid then accordingly control the different loads.
6.2.1.2.1 One-way Communication
In one-way communication, appliances receive control instructions from the utility without any overrides from the customer side. However, appliances do not send status data or acknowledgements back to the utility and that is why it is called one-way communication. There are two main disadvantages of such an approach: the lack of solid figures for the saved power since some appliances may be already off and no power was actually saved; and the unsuitability of this method in a smart grid scenario which necessitates two-way communication links between supply and demand.
6.2.1.2.2 Two-way Communication
This is often the preferred method of communication for DSEM applications. In addition, in order to develop a smart grid, two-way communication load control approaches must be deployed. In this control approach, the appliances send status information to the main controller at the utility while the utility sends back control signals to manage the appliances and reach the desired demand load profile. This load control approach, however, is not enough to justify the investment needed especially for the communication infrastructure required. Therefore, such two-way communication systems are integrated with additional functions such as Advanced Metering Infrastructure (AMI), automation of distribution systems, integration of renewable energy sources and storage facilities, and home automation. This integration in turn enhances the cost-effectiveness of the two-way communication systems as stated in Khan & Iqbal (2005). In the context of this thesis, two-way communication load control is adopted.
6.2.2 Categorization of Appliances
The work done in this thesis mainly focuses on load management in the residential sector. Therefore the appliances of interest are domestic appliances. Such appliances can be classified in a number of ways. In this work, we chose the following classification for domestic appliances: cold/hot, wet, brown, and cooking appliances (Hong 2009). The following table (Table 6-2) enlists the categories found in this classification of domestic appliances, and gives examples for each category. The appliances that mostly take part in residential load management programs are either cold or wet appliances. This is mainly due to the fact that the operation of such appliances may be rescheduled while other types of appliances cannot tolerate rescheduling and have to be available for immediate use.

6-4
Domestic Appliance Type Examples
Cold/Hot • Refrigerator
• Fridge freezer
• Air conditioner
• Water heater
Wet • Washing machine
• Washer dryer
• Tumble dryer
• Dish washer
Brown • TV
• Video
• DVD player
• Set top box
• Telephone charger
Cooking • Electric oven
• Microwave
• Kettle
• Toaster
Table 6-2: Categories of domestic appliances
6.2.3 Load Shifting Algorithm
In order to integrate household appliances into power balancing processes, many control approaches and systems have been developed. As discussed earlier, there are indirect (i.e. demand response and frequency response) and direct (i.e. one way and two-way communications load management) load control methods. A method to modulate the consumption of refrigerators based on a grid frequency control loop was introduced by Short et al. (2007). This concept is further improved in Kupzog (2008) by a more sophisticated control loop. Frequency responsive control schemes are quite notable due to their effective yet simple structures. However, they act only reactively to support the grid as they do not allow prior scheduling of appliances. Utilizing thermal mass for curbing peak demand via load shifting has been demonstrated in numerous works (Yin et al. 2010); (Rabl & Norford 1991); (Morris et al. 1994); (Keeney & Braun 1997); (Koch et al. 2009). Obviously these approaches are restricted to cold/hot appliances although other types of appliances may be deployed in DSEM approaches (e.g. wet appliances as discussed earlier). As shown in Stamminger (2008) and Lunsdorf & Sonnenschein (2010), appliances with deferral operation are of special interest: dish washers, tumble dryers, and washing machines. Such wet appliances that do not have implicit or explicit energy storage are more difficult to integrate into load shifting techniques than other types of appliances. This is mainly due to the fact that the time of their usage and their energy consumption highly depends on the unpredictable user interaction (Lunsdorf & Sonnenschein 2010). The core challenge in integrating this type of appliances (wet appliances) into DSEM schemes lies in their unpredictable operation times. Therefore, deterministic control schemes cannot be applied

6-5
to such appliances. Instead, probabilistic approaches need to be used in order to tackle the unpredictable nature of such devices. DSEM is carried out with the aim of minimizing demand peaks and thus improving supply and demand load factors and delaying capital intensive investments needed to cover growing demand. The details of DSEM have been discussed thoroughly in earlier sections. In the research herein, we develop a load management algorithm which specifically shifts wet appliances in residential premises from peak consumption hours to less peaky hours while taking customers preferences into consideration. Please note that we assume full coverage of the demand load and consider power supplied to be constant over time. The algorithm is based on three main steps as illustrated in the following figure (Figure 6-1): data acquisition, load building, and load shifting.
Figure 6-1: Steps of developing the load management algorithm
Step 1: Data Acquisition
The characteristics of a household’s demand load profile mainly depend on the surrounding climate conditions, appliances used, and consumption patterns of its inhabitants. Electricity utilities need to collect data about domestic electricity consumption in order to efficiently perform DSEM, which is quiet a tricky and challenging task. Data is typically aggregated for multiple households at once, without collecting detailed about individual households’ consumption. However, to ensure efficient and accurate implementation of DSEM schemes, sufficient knowledge about individual consumers’ electricity consumption patterns is needed in order to perform load forecasting and attempt to control household loads based on accurate simulations and predictions. In our case, typical data sets that need to be collected for load forecasting are:
• Customer inputs about their household appliances, power consumption patterns, and preferences for shifting activities
• Hypothetical simulation models for household appliances (developed by utility or research centers)
• Data loggers and/or smart meters data about power consumption of individual appliances (if possible)
Data Acquisition
Load Building Load Shifting

6-6
The method by which demand load is forecasted basically depends on the type and amount of data available, and its accuracy. Ideally, smart meters and/or data loggers would be available on consumer premises to collect energy consumption data and shape the demand load profile. However, such devices are not ubiquitous enough to rely on them herein, especially in the case of the MENA Region. Therefore, we assume that the appliances power consumption data available is collected via previously developed hypothetical models. We developed a simple Graphical User Interface (GUI) (see section 7.3.1) to act as an information form through which data about customer electrical/electronic appliances and their typical daily consumption patterns can be collected. In our case, we test the algorithm with data collected for a summer day with average weather conditions. The customer fills in the different sections of the form either in the utility premises, or online via the utility website or mobile based application (depending on how advanced the utility data collection methods are). If for any reason no power consumption data or preferences are available from customers, estimations are made using average data from similar households having similar circumstances and location. In this study, we assume that consumers are enthusiastically taking part in providing power consumption data. Hereunder are the state variables of the demand side (i.e. customer side appliances) according to which data is aggregated and analyzed:
n appliance number (n = 1, .. , N) N total number of appliances to be shifted t time of the day in hours (in our case, resolution = 1 hour; t = 1, .. , 24) T total hours a day (in our case, T = 24) An,t Hypothetical power demand of appliance n at time t On,t Likelihood of operation of appliance n at time t (Boolean value) Pn,t wattage of appliance n at time t Pt total power consumed at time t Xt total shiftable load at time t Yt total non-shiftable load at time t Pav average power of the demand profile Pmax maximum power of the demand profile Etotal total energy consumed in one day LF Load factor of the demand profile
The following are the state equations governing the demand profile load.
��, � = ��, � ∗ �, � Equation 6-1
�� = ���, �� �
�
Equation 6-2
���� = ���(��) Equation 6-3
������ = ���� �
�
Equation 6-4
��� = ������/� Equation 6-5 �� = ���/���� Equation 6-6

6-7
Step 2: Demand Load Building
After sufficient data is collected, the demand load profile is built or in other words is forecasted for each day of the week, and for each season of the year. If there is a data log containing the history of power consumption in the residential unit whose loads are to be controlled, then an accurate demand load profile can be constructed using artificial neural networks (or any other suitable soft computing methodology). If no data logs are available, which is the case here, loads can be approximately built using the information provided by customers via the GUI, average power consumption patterns for similar households, hypothetical simulation models for household appliances. More details in section 7.4. Step 3: Demand Load Shifting
In this step, the potentials of load shifts are investigated with the main objective of having a demand profile with minimal peaks. By looking into the shifting procedure, we realize that in order to have the demand load profile as flat as possible it needs to be formulated as a convex optimization problem whose objective function is to minimize peak power. By assuming a linear electricity pricing scheme, the optimal solution for convex optimization is given by the water-filling algorithm (Li et al. 2011), which is the basis of the load shifting algorithm developed here. In the following section, state variables, objective function, and equality and inequality constraints of the convex optimization problem for the demand side are introduced. The only control variable considered from the supply side (i.e. utility) is the power level available to the customer, and it is denoted as L. The following objective function:
������ !����,"ℎ!$!���� = ���(���, �� �
�)
Equation 6-7
Subject to the following equality constraint: ������ = ������_�&�!$_'ℎ�&�; Equation 6-8
�� = 0&�$�� > �; Equation 6-9
Subject to the following inequality constraint:
����_+!&�$!_'ℎ�&� > ����_�&�!$_'ℎ�&�; Equation 6-10 ��_+!&�$!_'ℎ�&� < ��_�&�!$_'ℎ�&�; Equation 6-11
The objective function (Equation 6-7) and the constraints (Equation 6-8 till Equation 6-11) are linear. Thus the optimization problem is convex and its optimal demand profile can be given by the following:
-� = .0�&� < /�,� − /��&� ≥ /�,= [�– /�]+;
where [a] + = max (0, a); and L is the unique solution to:
Equation 6-12
� max�0, L − Yt� = -�< �
=
Equation 6-13
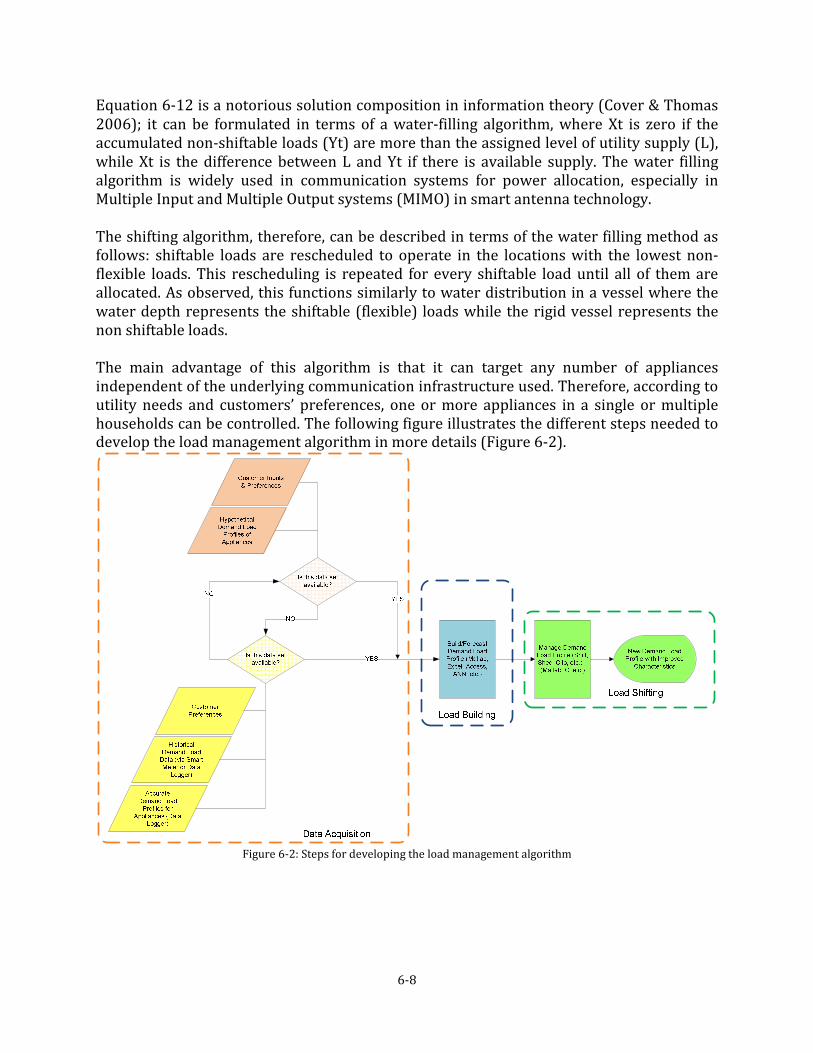
6-8
Equation 6-12 is a notorious solution composition in information theory (Cover & Thomas 2006); it can be formulated in terms of a water-filling algorithm, where Xt is zero if the accumulated non-shiftable loads (Yt) are more than the assigned level of utility supply (L), while Xt is the difference between L and Yt if there is available supply. The water filling algorithm is widely used in communication systems for power allocation, especially in Multiple Input and Multiple Output systems (MIMO) in smart antenna technology. The shifting algorithm, therefore, can be described in terms of the water filling method as follows: shiftable loads are rescheduled to operate in the locations with the lowest non-flexible loads. This rescheduling is repeated for every shiftable load until all of them are allocated. As observed, this functions similarly to water distribution in a vessel where the water depth represents the shiftable (flexible) loads while the rigid vessel represents the non shiftable loads. The main advantage of this algorithm is that it can target any number of appliances independent of the underlying communication infrastructure used. Therefore, according to utility needs and customers’ preferences, one or more appliances in a single or multiple households can be controlled. The following figure illustrates the different steps needed to develop the load management algorithm in more details (Figure 6-2).
Figure 6-2: Steps for developing the load management algorithm

6-9
6.3 Socio-Economic Issues
6.3.1 Electricity Pricing
The electricity tariff varies greatly from country to another; sometimes it even differs within the same country. The price of power generation depends largely on the type and market price of the fuel used, government subsidies, government and industry regulations, and even local weather patterns.
There are several pricing schemes in use around the world and they fall under two main categories as follows:
• Fixed pricing (independent of time and demand load) o Flat rate o Piecewise linear
• Time differentiated pricing: o Time of Use Pricing (TOU) o Critical Peak Pricing (CPP) o Real Time Pricing (RTP)
It is noteworthy to mention that most countries in the MENA Region use fixed pricing schemes in the residential sector.
6.3.2 Electricity Billing
The electric utility calculates the electricity use of a facility by measuring the energy consumed within the premises of this facility as well as its maximum power demand. The meter registers the total energy consumption a facility used during a specific period of time, usually one month (measured in kWh) and also the maximum power demand the facility needed during that period (average values for power consumed every 15 minutes, measured in kW). A customer is billed, according to the type of his facility, for the energy consumed – and the maximum powered needed, in some cases – with extra charges for taxes and any new installations.
6.3.2.1 Energy Charges
Currently in our region, most of the electricity utilities charge consumers according to their electrical energy usage irrespective of the current capacity of their meters (in Amperes). Herein we propose a new method for sizing energy charge blocks depending on the meter capacity of a household, so as to make energy charging fairer and promote rational decision making for consumers in current capacity meters upgrades. So assuming you have a meter of 10 A capacity in your household, this method of sizing energy charge blocks will make you pay less energy charges than another person who uses the same energy as you but whose household has a meter capacity of 20 A. The main idea behind this new method is to make energy charge depend on big sized tariff blocks for low meter capacities, and small sized tariff blocks for high meter capacities. The following equations (Equation 6-14, Equation 6-15, and Equation 6-16) are proposed for sizing energy charge blocks, which obviously are inversely dependent on meter capacity:

6-10
>� = A ∗ X�/A Equation 6-14 >B = A ∗ XB/A Equation 6-15 >C = A ∗ XC/A Equation 6-16
Where X1, X2, and X3 are constant values for all meter capacities and they represent reference energy charge blocks. Figure 6-3 illustrates sample sizing for energy charge blocks that may be used as a reference for values X1, X2, and X3; C is a variable representing the meter capacity; D1, D2, and D3 are the new energy charge block sizes (after relating to capacity); A is a variable chosen by the electric utility to produce multiples of D1, D2, and D3
as seen appropriate for utility’s cost benefit analysis. It is noteworthy to mention that the units of variables and constants are not taken into consideration since we are assuming relative block sizes, where the above equations do not represent quantitative physical values.
Figure 6-3: Electricity pricing block rates for the residential sector in Egypt
Let us assume that C = 10 A; X1 = 50 kWh; X2 = 100 kWh; and X3 = 150 kWh; A = 1; and prices for each block are 0.05 L.E., 0.11 L.E., and 0.16 L.E respectively, according to Figure 6-3. By substituting these arbitrary values in the equations proposed above, we get the following energy charge block sizes in kWh for D1, D2, and D3 respectively: 5, 15, and 15. If consumption is 14 kWh then the bill to be paid is 1.24 L.E. If consumption is 27 kWh then the bill is 3.02 L.E. If the consumption is 30 kWh the bill is 4.3 L.E. and so on (check figures corresponding to the 10 A meter capacity in Table 6-3). Now let us check the same values of energy consumption for a household with a meter capacity of 20 A, and see the corresponding bills to be paid. By substituting the same values for X1, X2, and X3, and putting C = 20 A, we get the following energy charge block sizes in kWh for D1, D2, D3, and D4 respectively: 2.5, 7.5, 7.5, and 15. If consumption is 14 kWh then the bill to be paid is 1.39 L.E. If consumption is 27 kWh then the bill is 3.67 L.E. If the
0.00 0.05 0.10 0.15 0.20 0.25 0.30 0.35 0.40 0.45 0.50
50 kWh
>50 - 200 kWh
>200 - 350 kWh
>350 - 650 kWh
>650- 1000 kWh
> 1000 kWh
50 kWh>50 - 200
kWh
>200 - 350
kWh
>350 - 650
kWh
>650- 1000
kWh> 1000 kWh
Energy Charge (L.E./kWh) 0.05 0.11 0.16 0.24 0.39 0.48
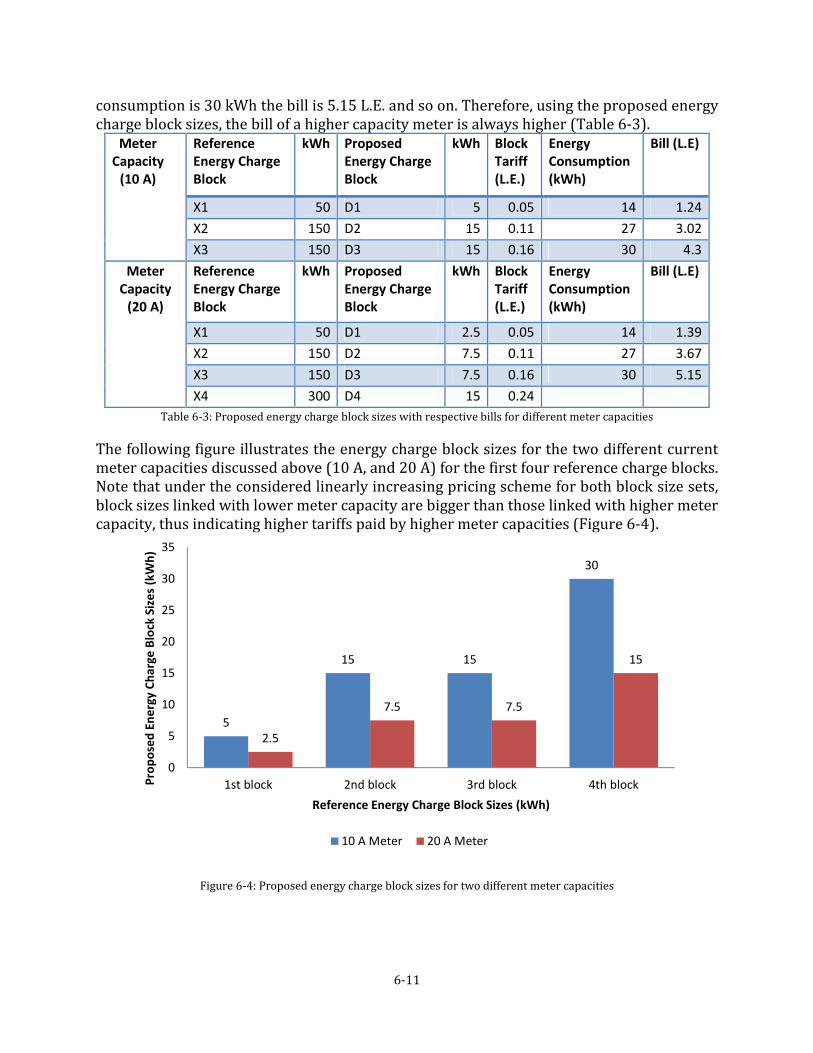
6-11
consumption is 30 kWh the bill is 5.15 L.E. and so on. Therefore, using the proposed energy charge block sizes, the bill of a higher capacity meter is always higher (Table 6-3).
Meter
Capacity
(10 A)
Reference
Energy Charge
Block
kWh Proposed
Energy Charge
Block
kWh Block
Tariff
(L.E.)
Energy
Consumption
(kWh)
Bill (L.E)
X1 50 D1 5 0.05 14 1.24
X2 150 D2 15 0.11 27 3.02
X3 150 D3 15 0.16 30 4.3
Meter
Capacity
(20 A)
Reference
Energy Charge
Block
kWh Proposed
Energy Charge
Block
kWh Block
Tariff
(L.E.)
Energy
Consumption
(kWh)
Bill (L.E)
X1 50 D1 2.5 0.05 14 1.39
X2 150 D2 7.5 0.11 27 3.67
X3 150 D3 7.5 0.16 30 5.15
X4 300 D4 15 0.24
Table 6-3: Proposed energy charge block sizes with respective bills for different meter capacities
The following figure illustrates the energy charge block sizes for the two different current meter capacities discussed above (10 A, and 20 A) for the first four reference charge blocks. Note that under the considered linearly increasing pricing scheme for both block size sets, block sizes linked with lower meter capacity are bigger than those linked with higher meter capacity, thus indicating higher tariffs paid by higher meter capacities (Figure 6-4).
Figure 6-4: Proposed energy charge block sizes for two different meter capacities
5
15 15
30
2.5
7.5 7.5
15
0
5
10
15
20
25
30
35
1st block 2nd block 3rd block 4th blockPro
po
sed
En
erg
y C
ha
rge
Blo
ck S
ize
s (k
Wh
)
Reference Energy Charge Block Sizes (kWh)
10 A Meter 20 A Meter

6-12
6.3.2.2 Demand Charge
Typically, commercial and industrial customers have demand charge included in their bill while residential customers do not. This is due to the fact that demand varies greatly among customers from the industrial and commercial sector while it has limited variations among residential households. This fact unfortunately encourages irrational use of electricity in the residential sector and dispirits customers from participating in load management programs that offer load shaping services. This is a worldwide trend not only in the MENA Region. However, demand response activities overshadow impacts of absence of demand charges for the residential sector in many countries. Unfortunately, such activities are not practiced in our region and therefore we propose adding demand charges to residential customers in the MENA region so as to promote rational electricity consumption patterns among the whole sector. By introducing demand charges to the bills of residential customers, a direct and highly rewarding incentive is available to encourage participation in load management programs and offer potential savings in the electricity bills of residential customers. Let us check the savings introduced to a residential customer’s electricity bill after applying demand charges, before and after load management is applied. Let us assume that the monthly energy consumption of a family household amounts to 750 kWh, with a maximum power demand of 10 kW. Let us assume the same energy charges applied in the calculations of the previous section (Figure 6-3), while the demand charge is 7 L.E. for every kW of maximum power demand a month. The bill calculations are listed in the table below (Table 6-4).
Energy
Consumption
(kWh)
Block
Size
Block
Tariff
Demand
Charge
(L.E.)
Max
Power
Demand
(kW)
Bill
(L.E.)
750 50 0.05 Before Load Management
150 0.11 7 10 253
150 0.16 After Load Management
300 0.24 7 6.5 228.5
350 0.39 Savings 9.68%
Table 6-4: Electricity bill for a family household before and after applying demand charges
As can be seen from the calculations in the table above, if demand charges are applied the monthly savings amount to 24.5 L.E. (about 9.68 % of the old bill), while the yearly savings are 294 L.E. The following figure illustrates percentage savings for different values of peak load after applying Load Management (different load reductions) and demand charges (Figure 6-5).
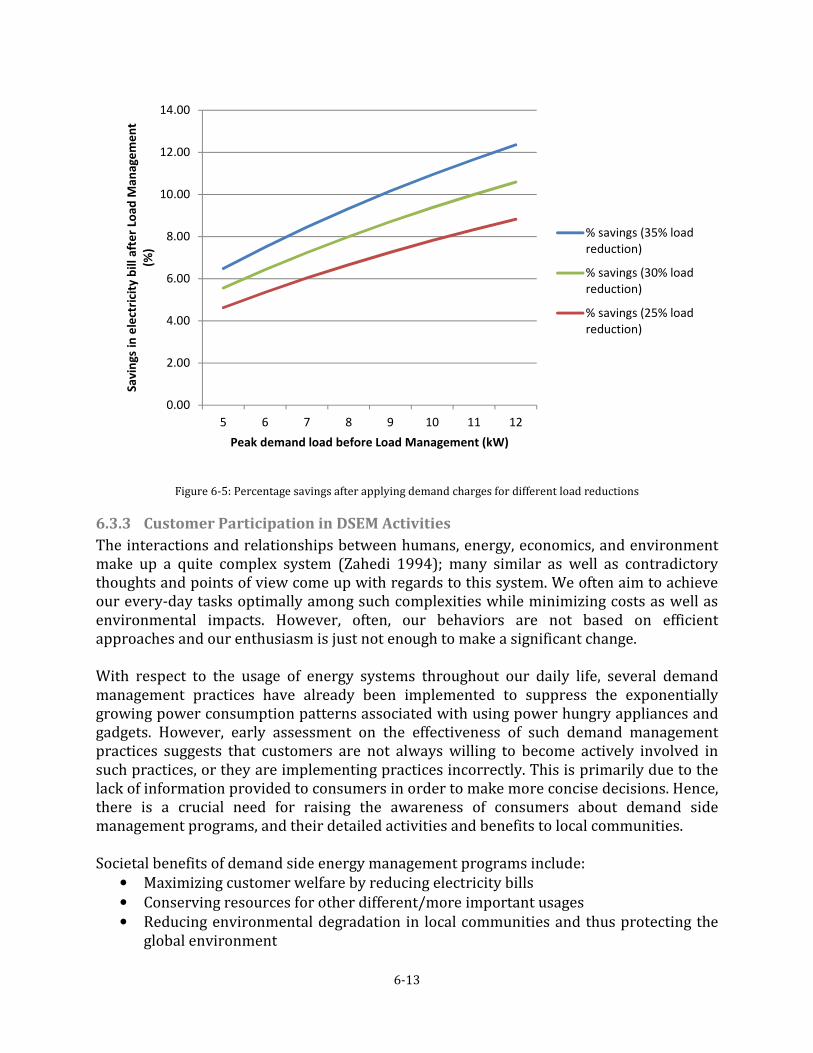
6-13
Figure 6-5: Percentage savings after applying demand charges for different load reductions
6.3.3 Customer Participation in DSEM Activities
The interactions and relationships between humans, energy, economics, and environment make up a quite complex system (Zahedi 1994); many similar as well as contradictory thoughts and points of view come up with regards to this system. We often aim to achieve our every-day tasks optimally among such complexities while minimizing costs as well as environmental impacts. However, often, our behaviors are not based on efficient approaches and our enthusiasm is just not enough to make a significant change. With respect to the usage of energy systems throughout our daily life, several demand management practices have already been implemented to suppress the exponentially growing power consumption patterns associated with using power hungry appliances and gadgets. However, early assessment on the effectiveness of such demand management practices suggests that customers are not always willing to become actively involved in such practices, or they are implementing practices incorrectly. This is primarily due to the lack of information provided to consumers in order to make more concise decisions. Hence, there is a crucial need for raising the awareness of consumers about demand side management programs, and their detailed activities and benefits to local communities. Societal benefits of demand side energy management programs include:
• Maximizing customer welfare by reducing electricity bills
• Conserving resources for other different/more important usages
• Reducing environmental degradation in local communities and thus protecting the global environment
0.00
2.00
4.00
6.00
8.00
10.00
12.00
14.00
5 6 7 8 9 10 11 12
Sa
vin
gs
in e
lect
rici
ty b
ill
aft
er
Loa
d M
an
ag
em
en
t
(%)
Peak demand load before Load Management (kW)
% savings (35% load
reduction)
% savings (30% load
reduction)
% savings (25% load
reduction)

6-14
Consumer acceptance and participation is the key to the success of DSEM programs. The conditions under which consumers would be ready to participate in such programs need to be thoroughly investigated. One of the most important issues to put in mind while collecting data about consumers acceptance is the level of control consumers are willing to give to the utility over their appliances and their respective flexibility with regards to the rescheduling and shedding of their household appliances. This critical issue and many others need to be assessed relative to benefits offered to consumers participating in DSEM programs (e.g. lower electric tariffs, no installation fees, etc.). Assessment of consumer acceptance is conducted then accordingly DSEM programs are customized to fit the customers’ needs and promote further program participation. In addition, data about climate conditions, socio-economic status, and energy related products/appliances of each country in the region need to be collected, and general consumer participation trends across the region need to be concluded so as to discover the extent of dominance of green lifestyles, or at least their potentials. Approaches practiced in analyzing consumer acceptance data need to include quantitative and qualitative methods, as well as learned lessons from previous experiences in countries with similar climate conditions and socio-economic situation. In order to assess consumer participation level in DSEM programs, we suggest the following regression model, which governs the effect of several socio-economic factors (independent/explanatory variables) on DSEM program participation level (dependent variable). Knowledge about regression models is found in Skyes (1993).
DPP = C�A + CBF + CCE + CIP + CJI + CLN + CNR + e
Equation 6-17
DPP = DSEM program participation level for residential customers A = Number of electrical/electronic appliances in a household F = Number of family members E = Average electricity consumption P = Peak power consumption I = Income of residential customer N = Incentives given by electric utility to program participants R = Price of electricity e = Error/residual term C1, C2, C3, C4, C5, C6, C7= Coefficients Hereunder we state the reasons behind choosing such independent/explanatory variables: A: Number of electrical/electronic appliances in a household – residential customers who use a large number of electrical/electronic household appliances are likely to be more willing to participate in a DSEM program than those who don’t rely heavily on such appliances, since it would result in some electricity bill savings; however, we foresee that the degree of flexibility and willingness would vary depending on the type of appliance

6-15
under question, the level of dependency of the customer upon it, and the time at which he uses it. F: Number of family members – larger families, especially from the middle and high society classes, tend to have more appliances than smaller families and therefore with the higher count of family members, we expect a higher level in DSEM program participation. E: Average electricity consumption – higher bills accompanying high electricity consumption would trigger consumers to participate in DSEM more than low consuming end users. P: Peak power consumption – we suggest adding this variable only if demand charges are applied, or else the consumer would not care about its value since it doesn’t affect his electricity bill. I: Income of residential customer – we anticipate that this independent coefficient especially affects the participation level in DSEM in a negative way since consumers having less incomes would participate in such a program more than highly paid consumers N: Incentives given by electric utility to program participants – obviously, the more the electric utility introduces in term of incentives to promote DSEM programs, the more the consumers will get convinced and enthusiastic in joining such programs. R: Price of electricity – the participation levels in DSEM are foreseen to highly depend on electricity prices via a positive relationship; higher prices would most probably indicate more participation levels from consumers. e: error/residual term – any other factors not proposed above are included in this term Due to the lack of data and in order to stay within the scope of research objectives, we do not analyze the proposed multi-variant data regression model; we only suggest it for illustrative reasons. Further work may be developed to investigate the values of the coefficients of this model.
6.4 Conclusion
In this chapter, we introduced an algorithm for demand load management that may be integrated in an advanced Energy Management Software tool, or be an upgraded feature in a retrofitted SCADA System at the electric utility control center to manage demand loads according to power grid status and available generation capacities. We also introduce a new electricity billing scheme for residential customers where demand charges are also included in the electricity bill; that is to say that additional charges are applied according to the maximum power demand consumed monthly in a customer’s household.

6-16
In addition, we also suggest block sizing for energy consumption charges that depends on electricity meter current capacity in residential households. This in turn introduces a fairer billing system to customers and promotes efficient electricity consumption behaviors. During the work developed, especially in this chapter, we came to a conclusion that even if all required technicalities are available, customer acceptance of and participation in DSEM programs is crucial to programs success. Intervention of customers is highly needed; whether it is in the very first step of collecting data about residential household electricity consumption patterns or degree of flexibility given to the utility over household appliances, or at a later stage in deciding whether the electric utility should continue in a DSEM program after its trial period or make any minor/major changes to it to gain more customer participation. Collaboration is needed to incentivize sustainable consumption and make it the simplest and cheapest choice for consumers. Information technology is a critical enabler of consumer and business engagement. Electric utilities are greatly encouraged to collaborate with media agencies and NGOs to make a step change in consumer engagement. Engaging with consumers to link their consumption decisions with their values as citizens could open a tide of consumers towards sustainable consumption.

7-1
7 Simulation and Emulation of Load Management Algorithm
7.1 Introduction
In this chapter we give a holistic view of the load management algorithm developed. We introduce the system level design of the Power Line Communication network which links the residential unit with the utility control center. Then, we go into the Software development part of the algorithm (using Matlab and Neuron C), and of the Java-based customer data GUI. We then test the algorithm on a load profile for a typical middle class residential unit in the MENA Region and evaluate results. At the end we implement a simple demo on Echelon’s Power Line Communication Evaluation Kit.
7.2 System Design
The following figure illustrates the system design starting from the electric utility control center, where load management tools are deployed, up to the household appliances to be controlled (Figure 7-1).
Figure 7-1: Diagram illustrating the connection between utility control center and residential customer

7-2
7.3 Software Development
7.3.1 Java-based Graphical User Interface for Residential Customer Data
The GUI where utility customers fill in their household appliances, usage patterns, and rescheduling/preferences is developed in Java. Figure 7-2 illustrates a very basic interface to collect data from the customer. Please note that this interface is developed merely for illustrative reasons. Additional sections/choices/questions may be easily added to the interface to produce a complete customer data platform for utility customers.
Figure 7-2: Java based GUI for gathering necessary customer data for load management activities
Check out the interface when it is partially filled in the figure below (Figure 7-3). When the customer completes the different sections of the data form, he pushes “Save New Customer” to save his entries. His information is then saved in a database (in our case, in excel format), to be available for later use in load management activities.
Figure 7-3: Partially filled Java based customer data GUI
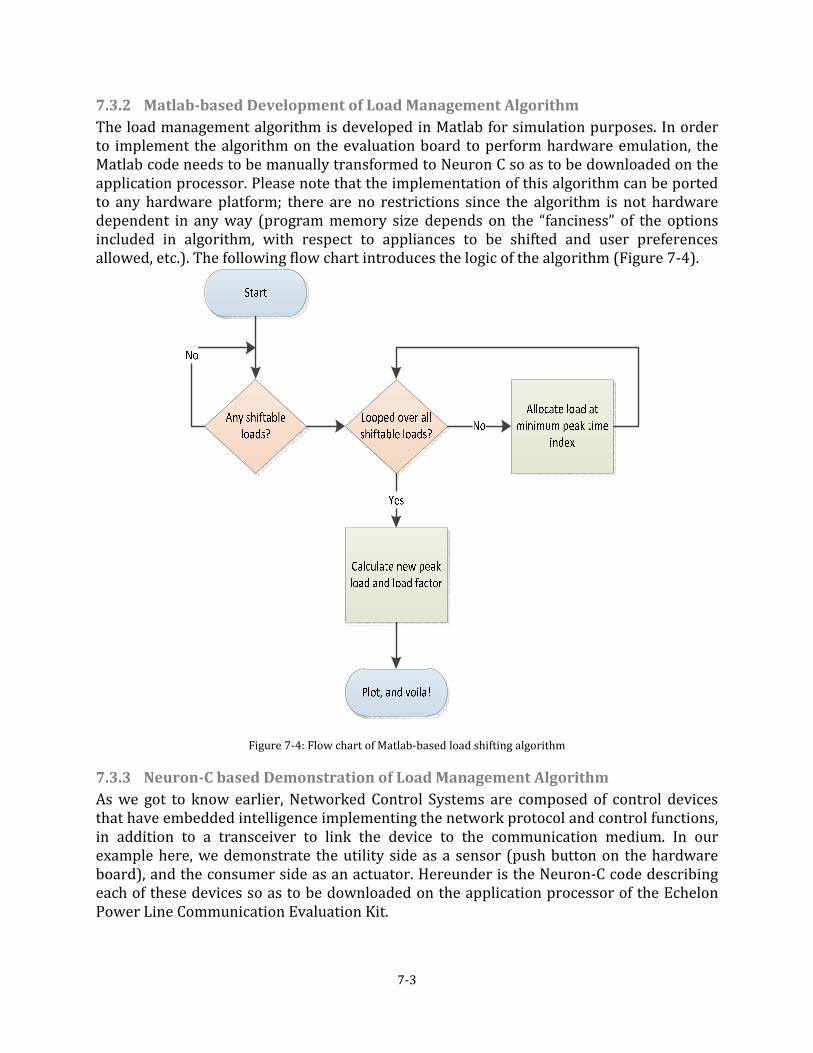
7-3
7.3.2 Matlab-based Development of Load Management Algorithm
The load management algorithm is developed in Matlab for simulation purposes. In order to implement the algorithm on the evaluation board to perform hardware emulation, the Matlab code needs to be manually transformed to Neuron C so as to be downloaded on the application processor. Please note that the implementation of this algorithm can be ported to any hardware platform; there are no restrictions since the algorithm is not hardware dependent in any way (program memory size depends on the “fanciness” of the options included in algorithm, with respect to appliances to be shifted and user preferences allowed, etc.). The following flow chart introduces the logic of the algorithm (Figure 7-4).
Figure 7-4: Flow chart of Matlab-based load shifting algorithm
7.3.3 Neuron-C based Demonstration of Load Management Algorithm
As we got to know earlier, Networked Control Systems are composed of control devices that have embedded intelligence implementing the network protocol and control functions, in addition to a transceiver to link the device to the communication medium. In our example here, we demonstrate the utility side as a sensor (push button on the hardware board), and the consumer side as an actuator. Hereunder is the Neuron-C code describing each of these devices so as to be downloaded on the application processor of the Echelon Power Line Communication Evaluation Kit.

7-4
Sensor – Push button
The Mini Gizmo I/O board (Figure 7-5) includes eight buttons connected to the Smart Transceiver using a parallel-in serial-out shift register. The following function GetButton() checks whether the first push button is pushed and returns its logical state.
IO_4 input bitshift numbits(8) clockedge(-) ioButtons; IO_6 output bit ioButtonLoad = 1; boolean GetButton(void) {unsigned debounce; unsigned data; data = 0xFF; for (debounce = 0; debounce < 3; ++debounce) { io_out(ioButtonLoad, 0); io_out(ioButtonLoad, 1); data &= (unsigned)io_in(ioButtons);} return ~buttons & 0x01;}
Figure 7-5: Mini Gizmo I/O Board
Actuator - LED
The Mini Gizmo I/O board (Figure 7-5) includes eight LEDs connected to the Smart Transceiver using a serial-in parallel-out shift register. The following function SetLeds() is used to light the LEDs on one Mini Gizmo I/O board which correspond to the pushed button on the other Mini Gizmo I/O board.
IO_2 output bitshift numbits(8) ioLeds; IO_1 output bit ioLedLoad = 1; void SetLeds(boolean led1, boolean led2) {unsigned data; data = led1 ? 0x80 : 0x00; data |= led2 ? 0x40 : 0x00; io_out(ioLeds, ~data); io_out(ioLedLoad, 0); io_out(ioLedLoad, 1);}
The following figure illustrates the lighted LEDs on one of the Mini Gizmo I/O boards corresponding to the pushed push button on the other board (Figure 7-6). We assume that the push button corresponds to a signal coming from the utility to turn on/off one or more appliances in a residential unit, represented in the LEDs.

7-5
Figure 7-6: Demo of connection between LonWorks PLC sensor and actuator
7.4 Load Profiles for Residential Sector
Traditionally, demand side management measures are done on a macro scale where they are driven by the energy utility companies and designed solely for the benefits of the companies to augment profits. When the scale moves down to the micro level and the demand curve interval moves from being hourly-based to minute-based, the load curve becomes more dynamic and fluctuating (Born 2001). In terms of consumer power consumption behavior, many activities are carried out randomly. The flexibility of this demand level needs to be studied, since it is necessary to ascertain to what extent it can be modified through demand side measures. Factors such as internal environmental conditions, performance of supply devices, priority of electric/electronic loads, and user satisfaction and behavior need to be balanced within the system set to control the residential loads (Gajjar & Tajularas 1998; Newborough & Augood 1999). At micro-scale, the DSEM algorithm takes all these factors into account and provides the capability to analyze and identify the best demand side strategies for the operation with various supply technology combinations. In this section, we assume the use of the Java based GUI introduced in section 7.3.1 in collecting data about a consumer’s daily power demand in an average summer day. We consider a consumer living in a 3 bedroom residential unit (middle class family in the MENA Region). After analyzing the data provided by the consumer, we firstly enlist all appliances available in the residential unit, and get their detailed specifications to construct their power demand profiles. Secondly, usage patterns are approximated according to consumer’s inputs and accordingly the average daily load profile of electricity demand of the residential unit is estimated. Then according to the categorization of the appliances and priorities/preferences set by the consumer, we consider flexible appliances for shifting ideally from peak hours to off peak hours. Then a new demand load profile is produced
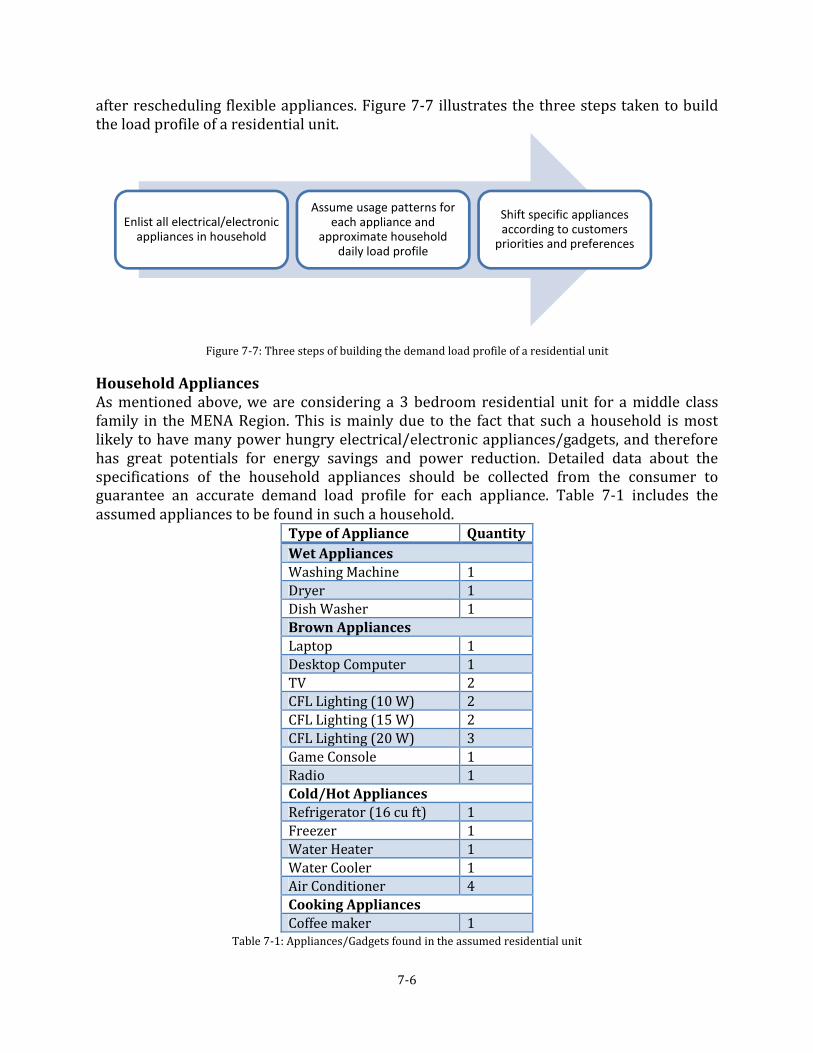
7-6
after rescheduling flexible appliances. Figure 7-7 illustrates the three steps taken to build the load profile of a residential unit.
Figure 7-7: Three steps of building the demand load profile of a residential unit
Household Appliances
As mentioned above, we are considering a 3 bedroom residential unit for a middle class family in the MENA Region. This is mainly due to the fact that such a household is most likely to have many power hungry electrical/electronic appliances/gadgets, and therefore has great potentials for energy savings and power reduction. Detailed data about the specifications of the household appliances should be collected from the consumer to guarantee an accurate demand load profile for each appliance. Table 7-1 includes the assumed appliances to be found in such a household.
Type of Appliance Quantity
Wet Appliances
Washing Machine 1
Dryer 1
Dish Washer 1
Brown Appliances
Laptop 1
Desktop Computer 1
TV 2
CFL Lighting (10 W) 2
CFL Lighting (15 W) 2
CFL Lighting (20 W) 3
Game Console 1
Radio 1
Cold/Hot Appliances
Refrigerator (16 cu ft) 1
Freezer 1
Water Heater 1
Water Cooler 1
Air Conditioner 4
Cooking Appliances
Coffee maker 1 Table 7-1: Appliances/Gadgets found in the assumed residential unit
Enlist all electrical/electronic appliances in household
Assume usage patterns for each appliance and
approximate household daily load profile
Shift specific appliances according to customers
priorities and preferences
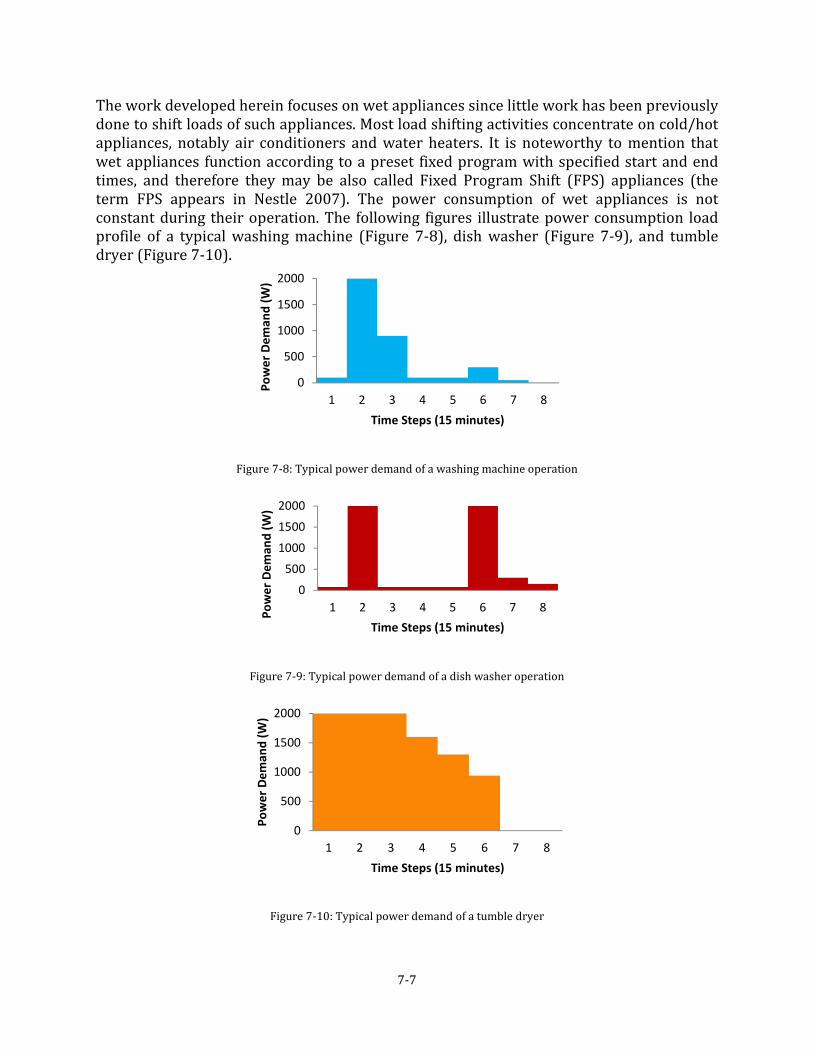
7-7
The work developed herein focuses on wet appliances since little work has been previously done to shift loads of such appliances. Most load shifting activities concentrate on cold/hot appliances, notably air conditioners and water heaters. It is noteworthy to mention that wet appliances function according to a preset fixed program with specified start and end times, and therefore they may be also called Fixed Program Shift (FPS) appliances (the term FPS appears in Nestle 2007). The power consumption of wet appliances is not constant during their operation. The following figures illustrate power consumption load profile of a typical washing machine (Figure 7-8), dish washer (Figure 7-9), and tumble dryer (Figure 7-10).
Figure 7-8: Typical power demand of a washing machine operation
Figure 7-9: Typical power demand of a dish washer operation
Figure 7-10: Typical power demand of a tumble dryer
0
500
1000
1500
2000
1 2 3 4 5 6 7 8
Po
we
r D
em
an
d (
W)
Time Steps (15 minutes)
0
500
1000
1500
2000
1 2 3 4 5 6 7 8
Po
we
r D
em
an
d (
W)
Time Steps (15 minutes)
0
500
1000
1500
2000
1 2 3 4 5 6 7 8
Po
we
r D
em
an
d (
W)
Time Steps (15 minutes)
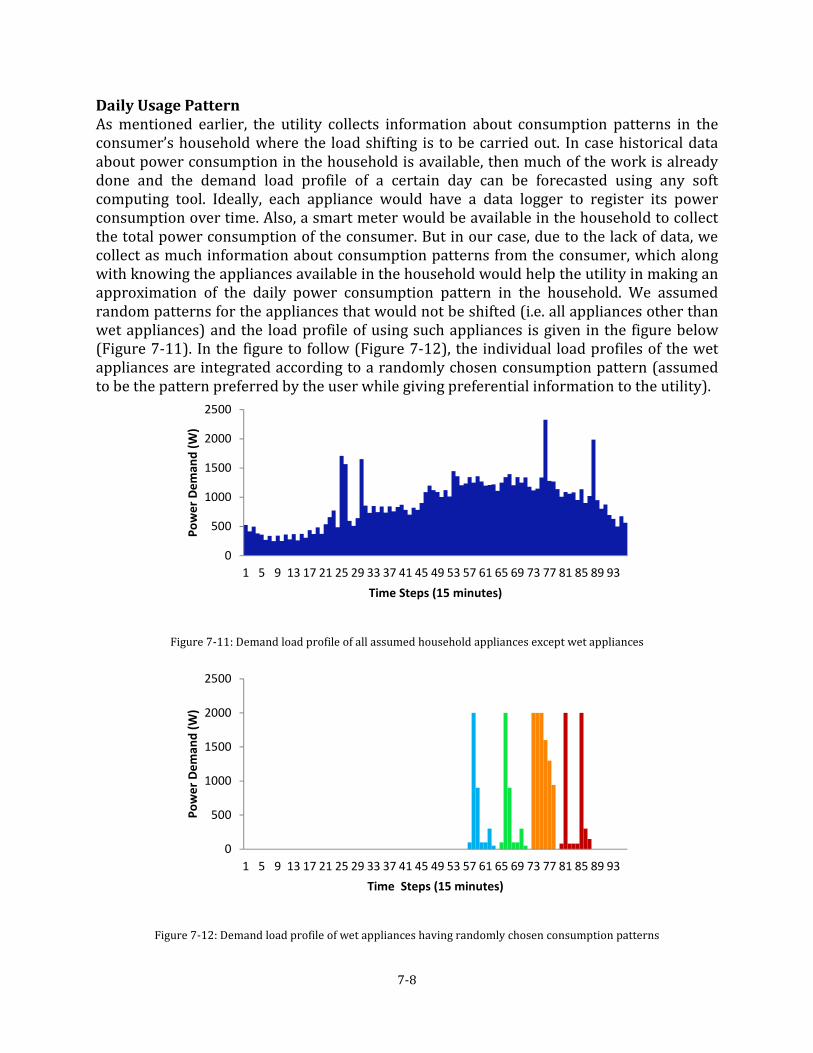
7-8
Daily Usage Pattern
As mentioned earlier, the utility collects information about consumption patterns in the consumer’s household where the load shifting is to be carried out. In case historical data about power consumption in the household is available, then much of the work is already done and the demand load profile of a certain day can be forecasted using any soft computing tool. Ideally, each appliance would have a data logger to register its power consumption over time. Also, a smart meter would be available in the household to collect the total power consumption of the consumer. But in our case, due to the lack of data, we collect as much information about consumption patterns from the consumer, which along with knowing the appliances available in the household would help the utility in making an approximation of the daily power consumption pattern in the household. We assumed random patterns for the appliances that would not be shifted (i.e. all appliances other than wet appliances) and the load profile of using such appliances is given in the figure below (Figure 7-11). In the figure to follow (Figure 7-12), the individual load profiles of the wet appliances are integrated according to a randomly chosen consumption pattern (assumed to be the pattern preferred by the user while giving preferential information to the utility).
Figure 7-11: Demand load profile of all assumed household appliances except wet appliances
Figure 7-12: Demand load profile of wet appliances having randomly chosen consumption patterns
0
500
1000
1500
2000
2500
1 5 9 13 17 21 25 29 33 37 41 45 49 53 57 61 65 69 73 77 81 85 89 93
Po
we
r D
em
an
d (
W)
Time Steps (15 minutes)
0
500
1000
1500
2000
2500
1 5 9 13 17 21 25 29 33 37 41 45 49 53 57 61 65 69 73 77 81 85 89 93
Po
we
r D
em
an
d (
W)
Time Steps (15 minutes)

7-9
Appliance shift
As stated earlier in section 6.2.3, wet appliances considered in the residential unit are shifted optimally according to the water filling algorithm. The rescheduling of the appliances may be completely performed by the utility according to that algorithm, or it may be selected by consumers according to their own convenience. We assume in our case that the consumer gives full flexibility to the utility to choose the optimum hours to shift his wet appliances to off peak hours as long as their operation is during the same day.
7.5 Results
After summing up all the loads of the residential unit, the following demand load profile results (Figure 7-13). The peak power demand of this load profile is 3927 W, while its load factor is 28.88%.
Figure 7-13: Residential demand load profile before shifting wet appliances
The load management algorithm is applied to the residential demand load, with the target of rescheduling the operation of wet appliances found in the household. We assume that this is the option chosen by this customer; more restrictions may govern the algorithm and its control options according to the customer preferences. The peak power demand of this new load profile (Figure 7-14) is 2484 W, while its load factor is 45.66%.
Figure 7-14: Residential demand load profile after shifting wet appliances

7-10
7.6 Conclusion
As can be seen from the results tabulated in the table below (Table 7-2), when the activities of the wet appliances are rescheduled to off peak periods using the algorithm developed, the peak load demand is flattened by more than 36%, while the load factor is improved by more than 58%.
Old peak
(W)
New peak
(W)
Reduced
by (%)
Old load
factor (%)
New load
factor (%)
Improved
by (%)
3927 2484 36.7 28.88 45.66 58.1
Table 7-2: Old versus new values of peak demand and load factor after applying the algorithm

8-1
8 Conclusions and Future Work
8.1 Conclusions
The MENA Region is facing a lot of challenges in the energy sector. To tackle energy related issues and guarantee a highly energy efficient economy, MENA countries need to set stricter and clearer energy strategies and bounding measures for its supply as well as demand sectors. Due to the current global trend of soaring usage patterns of electrical/electronic household appliances and electronic gadgets, high dependability on them, and the dominance of the residential sector as the most electricity consuming demand sector in most of the MENA countries, more strict and rational electricity consumption behaviors must be practiced. Therefore, demand side management programs – especially for the residential sector – have to be highly promoted, practiced, and included in the energy strategies of each country along with measurable milestones to assess their progress. In addition, residential consumers need to be more engaged in the different phases of designing, implementing, and implementing such programs to ensure programs success and sustainability. Trending social media channels should be used more broadly by electric utilities and governmental bodies to trigger residential customers’ participation and seek their feedback and suggestions. Load Management is a strategic level and long term demand management methodology enabling utilities to control demand and accordingly cancel or postpone long term capital intensive investments in new power plants and maximize system utilization. According to the results obtained from the algorithm developed herein, LM is able to reduce peak loads by 15 to 30% and, when done at scale, can create the effect of a "virtual power plant" that generates "negawatts" – or reduced demand – instead of megawatts! On the other hand, Demand Response is more suitable for short term emergency cases of demand control where the power grid is near its capacity or electricity prices are high. Therefore, due to the current regulated status of the electricity market in the MENA Region, we recommend electric utilities to start first by adopting Load Management programs, alongside the Energy Efficiency initiatives already in practice in many of the region’s countries. When designing a demand side management program for the MENA Region, a lot of data sets and surveys need to be collected so as to ensure appropriate program control options and flexibility suiting technical, economic, and societal needs of the region’s consumers, notably residential consumers. Due to the lack of quarter hourly, hourly, or even daily electricity consumption data, we had to come up with several assumptions and estimated figures for missing data sets to support our work herein. However, with the continuously growing awareness about the necessity of upgrading the current power grid infrastructure and moving towards a Smart Grid environment, we aim at finding more data and more research initiatives that tackle such issues in the MENA Region in the coming years.

8-2
In this thesis, we developed a load management algorithm which introduces the concept of a “smart plug” for controlling household appliances by switching them on/off or rescheduling their operation to off peak periods. We chose to test the algorithm developed herein on the operation of wet appliances, such as dish washers, tumble dryers, and washing machines. This is mainly because such appliances have flexibility in shifting their usage without introducing any inconveniences to end users, use a significant amount of power, and have not been widely explored in previous researches. However, the concept itself can also be used to switch off or shift the operation of other types of appliances, such as cold/hot appliances (air conditioners, water heaters, fridges, freezers, etc.), cooking appliances (microwave, electric stove, electric kettle, etc.), and brown appliances (TV, DVD player, cable box, sound system, set-top box, etc.). The main advantages of this “smart plug” are:
• Shifting different types of appliances according to an optimized algorithm
• Switching off appliances that consume vampire or phantom power, which is the power consumed while an appliance is switched off or in standby mode
• Utility control over appliances according to accurate measurements to ensure maximum energy savings
• Possibility of overriding options by consumers in case prior agreement has been made with electric utility to priority of overrides can be set in contract with utility)
• Producing flatter demand load profiles for participating customers which when aggregated on a large scale may postpone or cancel future electric utility plans for erecting new power plants
• Saving on electricity bills for consumers according to adopted pricing scheme in demand management program
Due to the lack of available data, the algorithm is based on arbitrarily chosen data for usage time slots, frequency, duration, and household appliances and their electricity consumption. It is noteworthy to mention that the algorithm may use currently suggested data sets for load forecasting, as well as accurately anticipated loads via soft computing methods. As we have seen in the results of the previous chapter, rescheduling the operation of wet appliances flattened the peak load demand by more than 36%, while the load factor of the demand profile improved by more than 58%. If done at scale, LM can create the effect of a "virtual power plant" generating "negawatts" instead of megawatts.
8.2 Proposals
In the work developed herein, we propose an algorithm to be integrated in an advanced Energy Management Software tool (or be an upgraded feature in a retrofitted SCADA System) at the electric utility control center to control demand loads according to grid status and available power generation capacities. We also propose a new electricity billing scheme for residential customers where they are billed according to the maximum power demand they consumed during a month time

8-3
(unlike the current scenario in the residential sector, where electricity bills are only dependent on the amount of energy consumed monthly). In addition, we also suggest block sizing for energy consumption charges that depends on the current capacity of electricity meters in residential households, so as to introduce a fairer billing system to customers and promote efficient and rational electricity consumption patterns. We have also suggested a multi-variant regression model to characterize customer participation levels in DSEM programs (more future work to be developed on this topic). For the proposed Smart Grid environment, we recommend the usage of Power Line Communication as the communication technology mainly because of its wide outreach and cost effectiveness in the MENA Region when compared to other technologies. PLC offers many benefits when operating over low voltage distribution networks. They utilize an already available extensive infrastructure for data communication, therefore allowing end users in remote areas to access different services with limited installations by the utility. In addition, PLC hosts many different services that are especially important for the concept of Smart Grids: Load Management, Distribution Automation, Advanced Metering Infrastructure, etc. However, this choice is highly location dependent; another technology of choice may be more suitable for a specific location. With respect to the control technology, we highly recommend Networked Control Systems due to their promising and flexible nature in a highly emerging and distributed environment such as the Smart Grid. An ideal scenario for a demand side management program in the MENA Region would include:
• Enthusiastically engaged end-users who are more concerned and curious about their energy consumption patterns than about checking their email inbox
• Smart appliances and metering systems based on advanced energy efficient technologies which enable consumers to be continuously updated about their electricity consumption while providing efficient electricity usage tips
• Optimized generation, transmission, and distribution, and control networks that provide easily accessible analytics to utility customers
• Distributed alternative energy sources and storage capacities which intelligently respond to the needs of local consumers within its proximity
• Supportive demand side management policies and regulations which trigger the involvement of more private sector investments in the electricity sector so as to dampen the soaring subsidization burdens on governmental bodies
8.3 Future Work
Eventually, we aim at designing a complete DSEM program that can be easily customized and deployed by local electric utilities of the MENA Region. In addition, we look forward to investigating other communication technologies for access between the electric utility and consumers – such as wireless communication systems which can be powered by solar cells – and looking into their deployment in locations of the MENA Region where PLC is not the ideal technology to be chosen. Also, we plan to consider long term changes in appliance usage, and investigate regional penetration rates of different domestic appliances.

References
Arzberger M., Dostert K., et al. (1997), “Fundamental Properties of the Low Voltage Power Distribution Grid”, Proceedings of the International Symposium on Power Line Communications and its Applications, Essen, Germany, April 1997 Ashok A., Banerjee R. (2000), “Industrial Load Management”, International Journal on Applied Energy, vol. 66, no.2, 2000 Berkman W., Mollenkopf J. (2006), “Power Line Communication System and Method of Operating the Same”, United States Patent, Virginia, USA, June 2006 Born F. (2001), “Aiding Renewable Energy Integration through Complementary Demand-Supply Matching”, Doctoral Thesis, University of Strathclyde, Glasgow, UK, 2001 Brown P. (1997), “Directional Coupling of High Frequency Signals onto Power Networks”, Proceedings of the International Symposium on Power Line Communications and its Applications, Essen, Germany, April 1997 Cover T., Thomas J. (2006), “Elements of Information Theory”, John Wiley & Sons, New York, USA, July 2006 Crew M., Fernando C., et al (1995), “The Theory of Peak-Load Pricing: a Survey,” Journal of Regulatory Economics, vol. 8, no. 3, November 1995 Curtis R., Sakis M., et al. (2011), “Simulated Demand Response of a Residential Energy Management System”, IEEE EnergyTech, Georgia Institute of Technology, Georgia, USA, May 2011 DECDG GSR 2011 – Development Economics and Data Group Global Statistics Report April 2011 – World Bank – http://data.worldbank.org/sites/default/files/gsapril2011.pdf – last accessed November 2011 EETimes 2011 – http://www.eetimes.com/design/industrial-control/4218852/What-is-Power-Line-Communication – last accessed in September 2011 Gajjar J., Tajularas, Z. (1998), “Feasibility Study of Residential Level Demand Side Management in Malaysia”, IEEE Region 10 International Conference on Global Connectivity in Energy, Computer, Communication and Control, vol. 2, December 1998 Galli S., Scaglione A., et al. (2003), “Broadband is Power: Internet Access through the Power Line Network”, IEEE Communications Magazine, vol.41, no.5, May 2003 Gellings C. (2009), “The Smart Grid: Enabling Energy Efficiency and Demand Response”, Fairmont Press, Georgia, USA, July 2009

Gellings C., Chamberlain J. (1993), “Demand-Side Management: Concepts and Methods”, 2nd ed., Fairmont Press, Lilburn, India, January 1993 Gungor V., Lambert F. (2006), “A Survey on Communication Networks for Electric System Automation”, Computer Networks: The International Journal of Computer and Telecommunications Networking, vol. 50, iss. 7, May 2006 Hong J. (2009), “The Development, Implementation, and Application of Demand Side Management and control (DSM+c) Algorithm for Integrating Microgeneration System within Built Environment”, Doctoral Thesis, University of Strathclyde, Glasgow, UK, March 2009 IEA energy statistics of non-OECD countries 2009 – http://www.iea.org/stats/index.asp – last accessed December 2011 IMF 2009 – International Monetary Fund – http://www.imf.org/external/pubs/ft/weo/2009/02/weodata/weoselgr.aspx – last accessed November 2011 Jun J., Peddabachagari P., et al. (2003), “Theoretical Maximum Throughput of IEEE 802.11 and its Applications”, IEEE International Symposium on Network Computing and Applications, Massachusetts, USA, April 2003 Keeney K., Braun J. (1997), “Application of Building Precooling to Reduce Peak Cooling Requirements”, ASHRAE Transactions, vol.103, iss.1, 1997 Khan J., Iqbal T. (2005), “Pre-feasibility Study of Stand-Alone Hybrid Energy Systems for Applications in Newfoundland", Renewable Energy Journal, vol. 30, no.6, May 2005 Koch S., Zima M., et al. (2009), “Active Coordination of Thermal Household Appliances for Load Management Purposes”, IFAC Symposium on Power Plants and Power Systems Control, Tampere, Finland, July 2009 Kupzog F. (2008), “Frequency Responsive Load Management in Electric Power Grids”, Suedwestdeutscher Verlag fuer Hochschulschriften, Germany, November 2008 Li D., Jayaweera K., et al. (2011), “Load Management for Price-based Demand Response Scheduling – a Block Scheduling Model”, 11th International Conference on Renewable Energy and Power Quality, Gran Canaria, Spain, April 2011 Liu W., Widmer H., et al. (2003), “Broadband PLC Access Systems and Field Deployment in European Power Line Networks”, IEEE Communications Magazine, vol. 41, no.5, May 2003 Luh P., Ho Y., et al. (1982), “Load Adaptive Pricing: An Emerging Tool for Electric Utilities,” IEEE Transactions on Automatic Control, vol. 27, no. 2, April 1982

Lunsdorf O., Sonnenschein M. (2010), “A Pooling Based Load Shift Strategy for Household Appliances”, 24th International Conference on Informatics for Environmental Protection, Cologne and Bonn, October 2010 Mak S., Radford D. (1996), “Communication System Requirements for Implementation of Large Scale Demand Side Management and Distribution Automation”, IEEE Transaction on Power Delivery, vol. 11, no. 2, April 1996 McGranaghan M., Goodman F. (2005), “Technical and System Requirements for Advanced Distribution Automation”, 18th International Conference on Electricity Distribution, Turin, Italy, June 2005 World Bank Indicators 2009 – MENA Region World Bank Indicators – http://data.worldbank.org/region/MNA – last accessed January 2012 Morris F., Braun J., et al. (1994), “Experimental and Simulated Performance of Optimal Control of Building Thermal Storage”, ASHRAE Transactions, vol.100, no.1, January 1994 Motegi N., Piette M., et al. (2007), “Introduction to Commercial Building Control Strategies and Techniques for Demand Response”, Demand Response Research Center, Lawrence Berkeley National Laboratory, May 2007 Neuron C PG – Echelon’s Neuron C Programmers Guide 2009 Neuron C RG – Echelon’s Neuron C Reference Guide 2009 Newborough, M., Augood, P. (1999), "Demand-Side Management Opportunities for the UK Domestic Sector", IEEE Proceedings on Generation, Transmission and Distribution, vol. 146, no.3, May 1999 Newbury J. (1999), “Technical Developments in Power Line Communications”, Proceedings of the 3rd International Symposium on Power-line Communications and its Applications, Lancaster, UK, 1999 Nieuwenhout F., Hommelberg M., et al. (2006), “Feasibility of Distributed Electricity Storage”, International Journal of Distributed Energy Resources, vol. 2, no.4, May 2006 NIST 2012 – National Institute of Standards and Technology – United States Department of Commerce – http://smartgrid.ieee.org/ieee-smart-grid/smart-grid-conceptual-model – last accessed February 2012 Pavlidou N., Vinck A., et al. (2003), “Power Line Communications: State of the Art and Future Trends”, IEEE Communications Magazine, vol. 41, no. 4, April 2003

Philipps H. (1998), “Performance Measurements of Powerline Channels at High Frequencies”, Proceedings of the International Symposium on Power-line Communications and its Applications", Tokyo, Japan, 1998 PL EG – Echelon’s Mini FX Power Line Examples Guide 2009 PL HG – Echelon’s Mini FX Power Line Hardware Guide 2009 PL QS – Echelon’s Mini FX Power Line Quick Start 2009 PL UG – Echelon’s Mini FX Power Line User Guide 2009 Quantum Consulting Inc., Summit Blue Consulting LLC. (2004), “Working Group 2 Demand Response Program Evaluation: Non-participant Market Survey Report”, report to Working Group 2 Measurement and Evaluation Committee, August 2004 Rabl A., Norford L. (1991), “Peak Load Reduction by Preconditioning Buildings at Night”, International Journal of Energy Research, vol.15, iss.9, December 1991 RCREEE (2009, 2010) – Regional Center for Renewable Energy and Energy Efficiency Country Reports of 2009 and 2010 – Algeria, Egypt, Jordan, Lebanon, Libya, Morocco, Syria, Tunisia, and Yemen Rowland K. (2011), “Facing the Challenges of Demand Response”, Intelligent Utility Bimonthly Magazine, March/April Issue, 2011 Samadi P., Wong V., et al. (2011), “Optimal Energy Consumption Scheduling Using Mechanism Design for the Future Smart Grid,” 2011 IEEE International Conference on Smart Grid Communications, Brussels, Belgium, October 2011 Selander L. (1999), “Power Line Communications: Channel Properties and Communication Strategies”, Master Thesis, Department of Information Technology, Lund University, Lund, Sweden, 1999 Shafiu A., Watts M. (2007), “A Working Document on Communication and Control Requirements”, Project on Smart Domestic Appliances in Sustainable Energy Systems (Smart-A), 2007 Short J., Infield D., et al. (2007), “Stabilization of Grid Frequency through Dynamic Demand Control”, IEEE Transactions on Power Systems, vol.22, iss.3, August 2007 Skyes A. (1993), “An Introduction to Regression Analysis”, Law School, University of Chicago, Illinois, USA, 1993

Stamminger R., (2008), “Synergy Potential of Smart Appliances”, WP2 Report, Intelligent Energy Europe, Project on Smart Domestic Appliances in Sustainable Energy Systems (Smart-A), November 2008 Tang Y., Song H. (2005), “Investigation on TOU Pricing Principles,” IEEE/PES Transmission and Distribution Conference and Exhibition: Asia and Pacific, Dalian, China, August 2005 UNICEF 2012 – United Nations International Children’s Emergency Fund – http://www.unicef.org/har07/files/MENA-__15_Nov_2006.pdf – last accessed February 2012 United Nations World Population Prospects 2010 – http://esa.un.org/unpd/wpp/index.htm – last accessed December 2011 Weissbach R., Kephart L. (2005), “Hybrid Renewable Energy System Analysis for Off-Grid Great Lakes Residential Housing", ASEE Annual Conference and Exposition: The Changing Landscape of Engineering and Technology Education in a Global World, Oregon, USA, June 2005 World Bank 2012 – http://web.worldbank.org/ – last accessed February 2012 World Bank Development Indicators 2009 – http://data.worldbank.org/indicator – last accessed January 2012 Yin R., et al. (2010), “Study on Auto-DR and Pre-cooling of Commercial Buildings with Thermal Mass in California”, Energy and Buildings Journal, January 2010 Zahedi A. (1994), “’Energy, People, Environment’. Development of an Integrated Renewable Energy and Energy Storage System, an Uninterruptable Power Supply for People and for Better Environment”, Proceedings of the 1994 IEEE International Conference on Systems, Man and Cybernetics, Texas, USA, October 1994 Zeng S., Li S., et al. (2008), “Research of Time-Of-Use Electricity Pricing Models in China: a Survey,” IEEE International Conference on Industrial Engineering and Engineering Management, Singapore, December 2008 Zuberi K. (2003), “Power Line Carrier Communication Systems”, Master Thesis, Department of Microelectronics and Information Technology, Royal Institute of Technology, Stockholm, Sweden, September 2003


