Thermostructural Analysis of Unconventional Wing ... · PDF fileThermostructural Analysis of...
44
NASA/TP-2001-210398 Thermostructural Analysis of Unconventional Wing Structures of a Hyper-X Hypersonic Flight Research Vehicle for the Mach 7 Mission William L. Ko and Leslie Gong NASA Dryden Flight Research Center Edwards, California October 2001
Transcript of Thermostructural Analysis of Unconventional Wing ... · PDF fileThermostructural Analysis of...
NASA/TP-2001-210398
Thermostructural Analysis of Unconventional Wing Structures of a Hyper-X Hypersonic Flight Research Vehicle for the Mach 7 Mission
William L. Ko and Leslie GongNASA Dryden Flight Research CenterEdwards, California
October 2001

The NASA STI Program Office…in Profile
Since its founding, NASA has been dedicatedto the advancement of aeronautics and space science. The NASA Scientific and Technical Information (STI) Program Office plays a keypart in helping NASA maintain thisimportant role.
The NASA STI Program Office is operated byLangley Research Center, the lead center forNASA’s scientific and technical information.The NASA STI Program Office provides access to the NASA STI Database, the largest collectionof aeronautical and space science STI in theworld. The Program Office is also NASA’s institutional mechanism for disseminating theresults of its research and development activities. These results are published by NASA in theNASA STI Report Series, which includes the following report types:
• TECHNICAL PUBLICATION. Reports of completed research or a major significantphase of research that present the results of NASA programs and include extensive dataor theoretical analysis. Includes compilations of significant scientific and technical data and information deemed to be of continuing reference value. NASA’s counterpart of peer-reviewed formal professional papers but has less stringent limitations on manuscriptlength and extent of graphic presentations.
• TECHNICAL MEMORANDUM. Scientificand technical findings that are preliminary orof specialized interest, e.g., quick releasereports, working papers, and bibliographiesthat contain minimal annotation. Does notcontain extensive analysis.
• CONTRACTOR REPORT. Scientific and technical findings by NASA-sponsored contractors and grantees.
• CONFERENCE PUBLICATION. Collected papers from scientific andtechnical conferences, symposia, seminars,or other meetings sponsored or cosponsoredby NASA.
• SPECIAL PUBLICATION. Scientific,technical, or historical information fromNASA programs, projects, and mission,often concerned with subjects havingsubstantial public interest.
• TECHNICAL TRANSLATION. English- language translations of foreign scientific and technical material pertinent toNASA’s mission.
Specialized services that complement the STIProgram Office’s diverse offerings include creating custom thesauri, building customizeddatabases, organizing and publishing researchresults…even providing videos.
For more information about the NASA STIProgram Office, see the following:
• Access the NASA STI Program Home Pageat
http://www.sti.nasa.gov
• E-mail your question via the Internet to [email protected]
• Fax your question to the NASA Access HelpDesk at (301) 621-0134
• Telephone the NASA Access Help Desk at(301) 621-0390
• Write to:NASA Access Help DeskNASA Center for AeroSpace Information7121 Standard DriveHanover, MD 21076-1320

NASA/TP-2001-210398
Thermostructural Analysis of Unconventional Wing Structures of a Hyper-X Hypersonic Flight Research Vehicle for the Mach 7 Mission
William L. Ko and Leslie GongNASA Dryden Flight Research CenterEdwards, California
October 2001
National Aeronautics andSpace Administration
Dryden Flight Research CenterEdwards, California 93523-0273

NOTICE
Use of trade names or names of manufacturers in this document does not constitute an official endorsementof such products or manufacturers, either expressed or implied, by the National Aeronautics andSpace Administration.
Available from the following:
NASA Center for AeroSpace Information (CASI) National Technical Information Service (NTIS)7121 Standard Drive 5285 Port Royal RoadHanover, MD 21076-1320 Springfield, VA 22161-2171(301) 621-0390 (703) 487-4650

ABSTRACT
Heat transfer, thermal stresses, and thermal buckling analyses were performed on the unconventionalwing structures of a Hyper-X hypersonic flight research vehicle (designated as X-43) subjected tonominal Mach 7 aerodynamic heating. A wing midspan cross section was selected for the heat transferand thermal stress analyses. Thermal buckling analysis was performed on three regions of the wing skin(lower or upper); 1) a fore wing panel, 2) an aft wing panel, and 3) a unit panel at the middle of the aftwing panel. A fourth thermal buckling analysis was performed on a midspan wing segment. The unitpanel region is identified as the potential thermal buckling initiation zone. Therefore, thermal bucklinganalysis of the Hyper-X wing panels could be reduced to the thermal buckling analysis of that unit panel.“Buckling temperature magnification factors” were established. Structural temperature-time histories arepresented. The results show that the concerns of shear failure at wing and spar welded sites, and ofthermal buckling of Hyper-X wing panels, may not arise under Mach 7 conditions.
NOMENCLATURE
a length of rectangular plate, in.
b width of rectangular plate, in.
CL clamped boundary condition
specific heat, Btu/lb-˚F
E Young's modulus, lb/in2
E23 two-nodes bar element
E33 triangular combined membrane and bending element
E43 quadrilateral combined membrane and bending element
FR panel edge supports allowing free in-plane motion (free)
FX panel edge supports with no in-plane motion (fixed)
JLOC joint location (node)
k thermal conductivity, Btu/hr-ft-˚F
LTA Lockheed Thermal Analyzer
SPAR Structured Performance and Resizing
SS simply supported boundary condition
T temperature, ˚F
Tmat average temperature for material properties, ˚F
Tn temperature at node n
To peak temperature of dome-shaped temperature distribution, ˚F
Ts panel boundary heat sink temperature, ˚F
Tu uniform temperature distribution, ˚F
cp
TPATH Dryden computer simulation program
TPS thermal protection system
t time counted from the air-launching of Pegasus booster rocket from B-52, sec.
VIEW computer program to compute view factors, see equation (1)
( )cr critical buckling value at buckling
α coefficient of thermal expansion, in/in-˚F
ε emissivity
η ,Buckling temperature magnification factor of the first kind = buckling
temperature (To)cr of dome-shaped temperature loading (fixed or free support condition)
divided by the buckling temperature (Tu)cr of uniform temperature loading (fixed
support condition).
λc eigenvalue associated with uniform temperature loading
λo eigenvalue associated with dome-shaped temperature loading
ν Poisson's ratio
ξ Buckling temperature magnification factor of the second
kind = buckling temperature (To)cr of dome-shaped temperature loading case with any heat
sink temperature (free support condition) divided by the buckling temperature (To)cr
of dome-shaped temperature loading case with zero heat sink temperature (free
support condition)
ρ density, lb/in3
σf uniaxial tensile failure stress, lb/in2
σT ultimate tensile strength, lb/in2
σx chord-wise stress, lb/in2
σY yield strength, lb/in2
τf sheer failure stress, lb/in2
τmax maximum shear stress, lb/in2
INTRODUCTION
Hypersonic flight vehicles are subjected to severe aerodynamic heating during flights. To maintainstructural integrity at these high temperatures, the vehicle structural design concepts for high Machnumber vehicles are different from those of low Mach number aircraft. The vehicle structure may becalled “hot” structures or “warm” structures, depending on the operating temperature range. The hotstructures are fabricated with high-temperature materials and are capable of operating at elevatedtemperatures exceeding 1000 °F. Typical hot structural components are carbon/carbon composite
T o( )cr T u( )cr⁄=
T o( )cr T o( )cr⁄ T s 0==
T s 0≠
T s 0=
2
structures, hat-stiffened panels fabricated with either monolithic titanium alloys or metal-matrixcomposite materials, and honeycomb sandwich panels fabricated with high-temperature materials such asTitanium, or nickel-based Inconel® (Inco Alloys International, Inc., Huntington, West Virginia) alloys.The warm structures are fabricated with light-weight materials such as aluminum and must be insulatedso that the sub-structural temperatures will not exceed the operating temperature limit of 350 °F. Thespace shuttle orbiter is a good example of warm structure. The entire vehicle is protected with a thermalprotection system (TPS) to shield the aluminum substructure from overheating beyond the warmtemperature limit (ref. 1).
An example of a recent hot structure is the new hypersonic flight research vehicle called Hyper-X(designated as the X-43 vehicle), which has unconventional wing structures with irregular-shaped wingpanels (described in the following section).
Temperature distributions in the hot structures are, in general, not uniform because of coolersubstructures such as spars and ribs. The nonuniformity of the structural temperature distribution inducesthermal stresses. Excess thermal stresses could cause vehicle wing panels to buckle and creep, and couldalso cause the skin and spar weld sites to lose bonding integrity. A uniform temperature field induces nothermal stresses in structures fabricated with materials that have the same coefficient of thermalexpansion. Thermal buckling problems are of great concern for both hot and warm structures, and havebeen extensively studied by Ko (refs. 2-11). Those past thermal buckling studies were conducted onrectangular-shaped honeycomb sandwich and hat-stiffened panels, and not on irregular-shaped panelssuch as the Hyper-X wing panels.
To fully understand the thermostructural performance of the unconventional Hyper-X wing structuresunder nominal Mach 7 aerodynamic heating*, heat transfer analysis, thermal stress analysis, and thermalbuckling analysis must be performed. This requires complex three-dimensional modeling of the Hyper-Xwing structures. However, without going through complex modeling of the entire wing structure, one canuse a simple method to quickly approximate the panel buckling temperatures of wing panels. This reportpresents the results of heat transfer analysis and thermal buckling analysis of wing structures using suchan approximation method, and discusses how the Hyper-X wing structures would perform under nominalMach 7 heating.
Use of trade names or names of manufacturers in this document does not constitute an officialendorsement of such products or manufacturers, either expressed or implied, by the National Aeronauticsand Space Administration.
HYPER-X FLIGHT RESEARCH VEHICLE
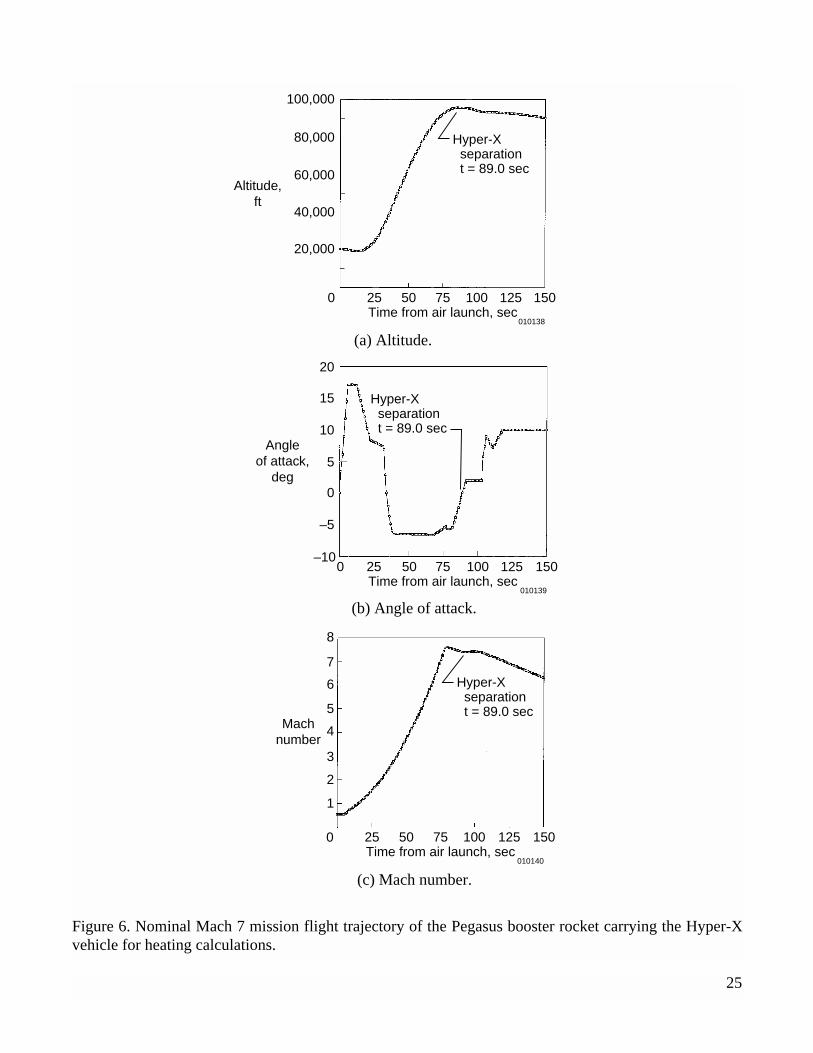
Hyper-X (designated as X-43) is a new hypersonic flight research vehicle (12 ft long, 5 ft span,3,000 lb weight), designed to be flown at a range of Mach 7~10 (fig. 1). The underside of the vehicleconsists of an inlet ramp, a scramjet (supersonic-combustion ramjet) engine module, and an expansionramp. The scramjet engine is an air-breathing ramjet engine in which the airflow through the wholeengine remains supersonic. The Hyper-X scramjet engine uses hydrogen as fuel and inlet air as oxidizer(no oxidizer is carried on board). The proposed flight trajectory of Hyper-X is shown in figure 2. TheHyper-X rides on a winged Pegasus booster rocket, which is carried under the wing of a B-52 aircraft up
*It should be noted that the maximum Mach number reached during the nominal Mach 7 mission was 7.5.
3

to a launch altitude of 17,000 ft. for the Mach 7 mission or 43,000 ft for the Mach 10 mission. After airlaunching from the B-52, the Pegasus booster rocket will accelerate and ascend to an altitude ofapproximately 100,000 ft, reaching the test velocity (of Mach 7 or Mach 10). After separation from thebooster rocket, the cowl door of the Hyper-X scramjet engine opens to test the performance of thescramjet engine. Once the cowl door is open, fuel is injected, ignited and burned for about 8 seconds. Theentire event from the opening to the closing of the cowl door lasts for 34 seconds.
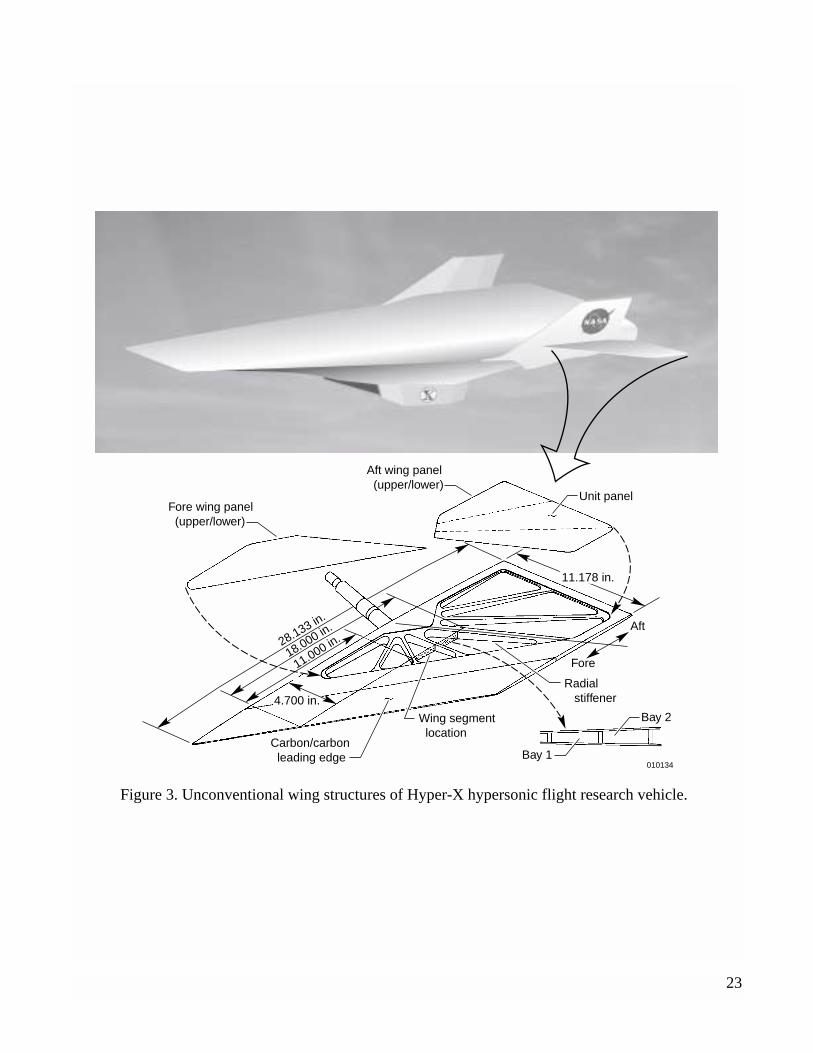
The Hyper-X wing structure is fabricated with high-temperature Haynes 230 alloy (anickel-chromium-tungsten-molybdenum alloy) which has relatively low thermal expansioncharacteristics. The design concept of its wing structures (fig. 3) is entirely different from that of theconventional wing structures. The conventional spar and rib system is replaced with multiple radialstiffeners (spars, 0.25 in. wide) fanning out from the pivoting wing roots. To house the instrumentationinside the wing structure, upper and lower wing skins (0.090 inches thick) are divided into two separatewing panels (a fore wing panel and an aft wing panel). The wing panels are then butt-welded at theiredges to the main wing frame, and line-welded to the radial reinforcing stiffeners without usingconventional fastening screws or rivets. Because the edges of the heated wing panels are constrained,potential thermal buckling of the wing panels and possible shearing off of the line-welded sites are ofgreat concern.
DESCRIPTION OF PROBLEM
Heat transfer and thermal stress analyses are to be performed on the midspan segment of the Hyper-Xwing (fig.3). A nominal Mach 7 aerodynamic heating is to be used as heat input to calculate time historiesof structural temperatures. The worst-case non-uniform temperature distribution obtained from the heattransfer analysis is to be used for temperature loads to calculate thermal stresses in the wing segment.
Thermal buckling analysis is to be performed on the following three regions of the wing skin panels(lower or upper): 1) the fore wing panel, 2) the aft wing panel, and 3) a unit panel at the middle of the aftwing panel (fig. 3). In addition, thermal buckling is also to be conducted for the wing segment (fig 3).These analyses are being done to locate the thermal buckling initiation zone.
The unit panel is used to establish buckling temperature magnification factors (1) to scale up thebuckling solution of uniform temperature loading for generating a buckling solution for dome-shapedtemperature loading; or (2) to scale up the buckling solution of dome-shaped temperature loading withunheated boundary heat sinks for generating a buckling solution for the same case when the heat sinks areheated up.
HEAT TRANSFER ANALYSIS
The finite-difference heat transfer analyses of Hyper-X wing structures are performed using theLockheed Thermal Analyzer (LTA). The LTA is a generalized FORTRAN program that computestransient temperature distributions in complex structures based on an electrical analogy of capacitors andresistors.
4

Finite-Difference Thermal Modeling
The Hyper-X wing segment selected for the heat transfer analysis is located at the wing midspan,approximately 4.7 in. from the wing root edge (fig. 3). The chord-wise region lies between thestream-wise distances 11.0 in. and 18.0 in. measured from the carbon/carbon leading edge, and spansover three neighboring radial stiffeners (or spars) (fig. 3).
Two finite-difference thermal models (fig. 4) were generated for two cases of welded site skin andspar contacts; 1) full contact, and 2) partial contact (inset of fig. 4). The two thermal models are identical(fig. 4) except for the contact resistance between the skin panels and radial stiffeners. Each modelconsists of 64 capacitors modeling Haynes® 230® (Haynes International, Kokomo, Indiana) alloy. Outerstructural mold lines use a 1.5 degree half-angle for both upper and lower skins. For the full contact, thewing skin panels are perfectly bonded to the full width (0.25 in.) of the stiffeners. For the partial contact,the welded site is 0.040 in. wide and 0.01 in. thick. The resistance between capacitors {1 and 66}, {13and 70}, {25 and 75}, {69 and 41}, {74 and 53}, and {79 and 65} (fig. 4) were calculated for 1) fullcontact conductance, or 2) partial contact conductance representing a 0.040-inch-width contact area. Thepartial contact case is a more realistic representation of the actual skin and spar welded sites. The thermalmodels have a surface emissivity of ε = 0.85. The external radiation view factors were calculated byhand, but the internal radiation view factors were calculated from the VIEW program (described below).The input thermal properties of Haynes 230 alloy are listed in Table A-1 of the Appendix.
Internal Radiation View Factors
The internal radiation view factors were calculated from the VIEW program, which is incorporatedinto the Structural Performance And Resizing (SPAR) finite-element computer program (ref. 12). Figure5 shows the two SPAR finite-element radiation models generated for the internal view factorcomputations. Each model has 63 internal radiation elements. Each of the radiation elements matches theinterior surface of each corresponding element of the finite-difference thermal model (fig. 4).
In the computations of internal radiation view factors using the VIEW program, two cases were used:the combined case and the separate case. For the combined case, the entire wing segment was consideredas a single enclosure with obstruction at the middle spar (fig. 5-a). For the separate case, each bay wasconsidered independently as an enclosure without obstructions (fig. 5-b).
For case one, the radiation element numbering was started from bay 1 and continued on bay 2, (notindependently numbered for each bay). The command OBSTRUCT was used to define the obstructingsurfaces, which are the two sides of the middle spar (i. e., elements 12, 13, 14, 15, 16, 59, 60, 61, 62, 63)(fig. 5-a). The ENCLOSURE command was used to identify the system of radiation surfaces as anenclosure, and to correct the calculated view factors so that the sum of the view factors from eachradiation element is equal to unity. Namely, if Fij (i, j = 1, 2, 3, ….) is the radiation view factor defined asthe fraction of radiant heat, leaving radiation element i and incident on radiation element j, then theENCLOSURE command will enforce the following condition for the final values of Fij.
(1)
where the summation is taken over j for each given i.
Fijj
∑ 1=
5
For case two, the internal radiation view factors were computed independently for each bay using theVIEW command. For this case, the radiation elements are numbered independently (starting from No. 1)for each bay (fig. 5-b). Because there is no obstruction within each bay, the ENCLOSURE andUNOBSTRUCT commands were used. The command OBSTRUCT was not needed. The above twoapproaches (fig. 5-a, 5-b) gave identical internal view factor solutions, thus verifying the accuracy ofview factor calculations.
Heating Profile
Figure 6 shows the preliminary flight trajectory for the Mach 7 mission of the Pegasus booster rocketcarrying the Hyper-X vehicle. The maximum Mach number of the flight trajectory turned out to be 7.5(fig.6-c). This was the flight trajectory available at the time of this analysis and was, therefore, used tocalculate the aerodynamic heating rates. The Dryden in-house computer code called TPATH was used forthese calculations. Various parameters for inputs to the TPATH code are: time histories of altitude, angleof attack, and Mach number (fig. 6) as well as the outer mold-line geometry of the wing cross section.The program calculates transient heating rates and surface temperatures, and also computes heat transfercoefficients, boundary layer recovery temperatures and other parameters required to calculate theaerodynamic heating rates. The program permits the use of different theories for calculating the heattransfer coefficients. These theories can be properly applied at each location of interest for laminar orturbulent flow condition, or for flows with transition. The transition condition can be input as a functionof Reynolds number and local Mach number, or prescribed at a specific time. In the present analysis, thetransition criteria used resulted in turbulent flow calculations for the entire flight profile. Local flowconditions were calculated for an attached flow using the oblique shock theory (ref. 13). Heat transfercoefficients were calculated using Eckert’s reference enthalphy method (refs. 14, 15). Calculations weremade for the upper and lower surface of the horizontal wing. Real gas properties of air were used in allcalculations (ref. 16). Heat transfer coefficients and recovery temperatures calculated from the TPATHcode were then used as inputs to the LTA. This thermal analyzer program then calculated the heatingrates and corresponding structural temperatures for the two-dimensional thermal models.
THERMAL STRESS ANALYSIS
The SPAR finite-element computer program (ref. 12) is used in the linear thermal stress analysis ofthe wing segment. The following sections discuss finite element modeling, boundary constraints, andtemperature load.
Finite Element Modeling
The wing segment selected for the thermal stress and thermal buckling analysis is located at the wingmidspan cross section where the heat transfer analysis is performed (fig. 3). The wing segment has a unitspan-wise width, and spans over three neighboring radial stiffeners (spars) in stream-wise direction. Thefinite-element structural model generated for the wing segment is shown in figure 7. The wing panels andthe spars are modeled with a single row of quadrilateral combined membrane and bending elements (E43elements). The nodal coordinates of the finite-element structural model are made coincidental with thoseof the finite-difference thermal model (fig. 4). Thus, the nodal temperature output from the thermal model
6

can be used directly as temperature input to the structural model. Only one welded site at the top of the
middle spar (radial stiffener) is modeled in detail for shear stress calculations (inset of figure 7). The wing
skin and spar welded site is modeled with E43 elements whose lower boundaries are connected to the
middle spar (E43) element through triangular membrane and bending elements (E33 elements). To
simulate the effect of stream-wise thermal expansion restraint resulting from the cooler wing frame, the
nodes of the three radial stiffeners are interconnected with two nodes (E23 bar elements). The size of the
finite-element structural model for the wing segment is listed in Table 1.
The temperature-dependent material properties of Haynes 230 used for input to the structural model
are listed in the Appendix.
Boundary Constraints
The wing-segment model is allowed to expand freely in all directions. The span-wise edges of the
wing panels are constrained to have zero slopes in the span-wise direction to simulate the effect of
continuity to neighboring regions.
Temperature Load
The structural temperature distribution at time t = 89 sec (from launch of the Pegasus booster)
obtained from the heat transfer analysis is used as thermal load input for the thermal stress analysis. Time
t = 89 sec is the instant when the difference between the upper and lower skin peak temperatures reaches
a maximum. As will be seen later, this structural temperature distribution over each bay is arch-shaped.
Table 1. Number of joint locations and elements ofwing-segment finite-element model.
Item Number
JLOC 166
E23 elements 20
E33 elements 8
E43 elements 95
7
THERMAL BUCKLING ANALYSIS
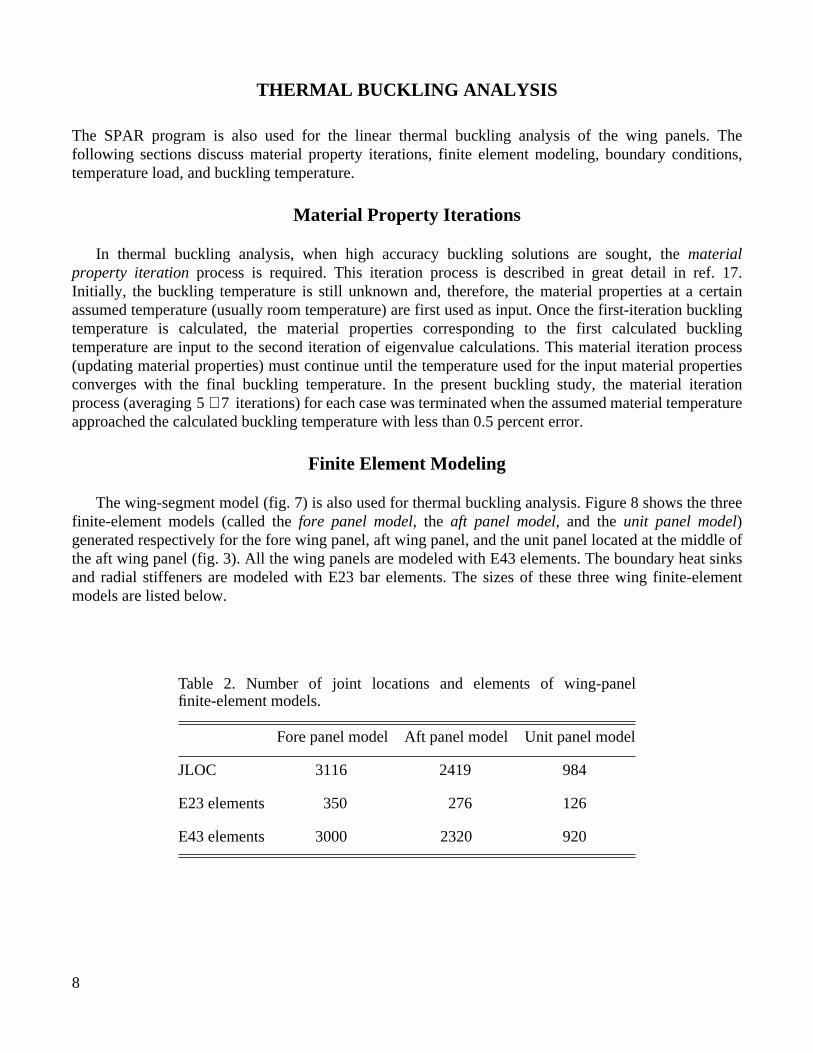
The SPAR program is also used for the linear thermal buckling analysis of the wing panels. Thefollowing sections discuss material property iterations, finite element modeling, boundary conditions,temperature load, and buckling temperature.
Material Property Iterations
In thermal buckling analysis, when high accuracy buckling solutions are sought, the materialproperty iteration process is required. This iteration process is described in great detail in ref. 17.Initially, the buckling temperature is still unknown and, therefore, the material properties at a certainassumed temperature (usually room temperature) are first used as input. Once the first-iteration bucklingtemperature is calculated, the material properties corresponding to the first calculated bucklingtemperature are input to the second iteration of eigenvalue calculations. This material iteration process(updating material properties) must continue until the temperature used for the input material propertiesconverges with the final buckling temperature. In the present buckling study, the material iterationprocess (averaging iterations) for each case was terminated when the assumed material temperatureapproached the calculated buckling temperature with less than 0.5 percent error.
Finite Element Modeling
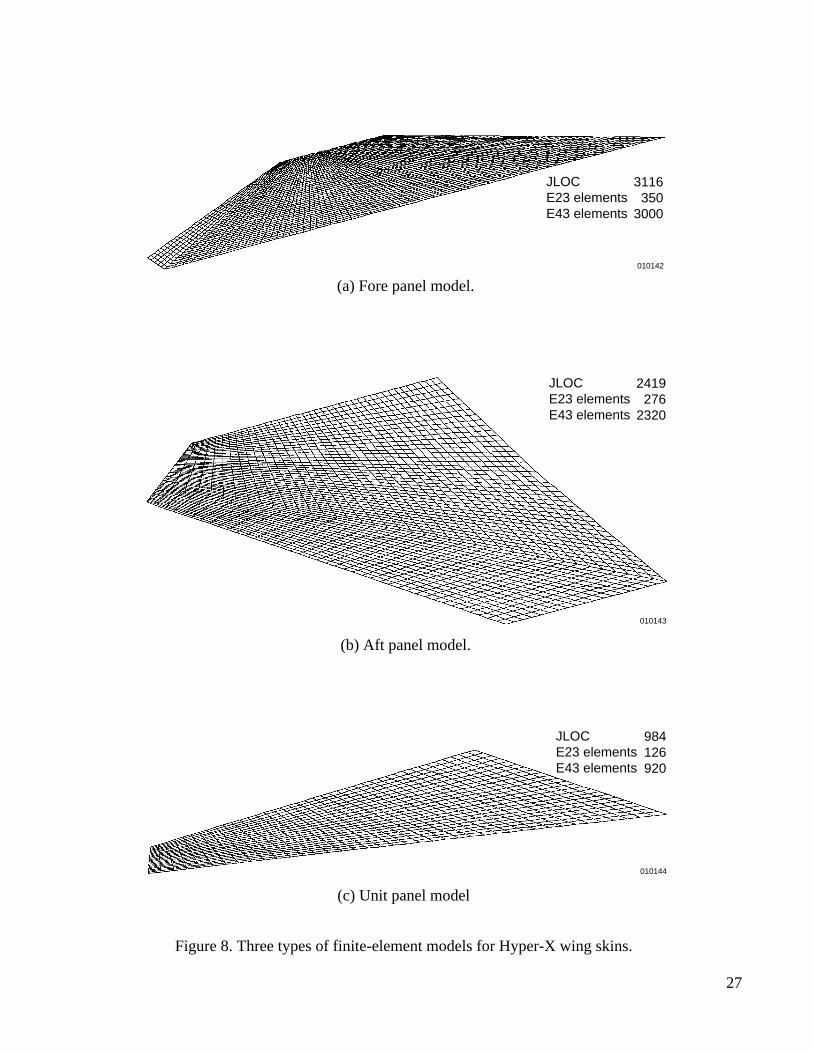
The wing-segment model (fig. 7) is also used for thermal buckling analysis. Figure 8 shows the threefinite-element models (called the fore panel model, the aft panel model, and the unit panel model)generated respectively for the fore wing panel, aft wing panel, and the unit panel located at the middle ofthe aft wing panel (fig. 3). All the wing panels are modeled with E43 elements. The boundary heat sinksand radial stiffeners are modeled with E23 bar elements. The sizes of these three wing finite-elementmodels are listed below.
Table 2. Number of joint locations and elements of wing-panelfinite-element models.
Fore panel model Aft panel model Unit panel model
JLOC 3116 2419 984
E23 elements 350 276 126
E43 elements 3000 2320 920
5 7∼
8

Boundary Conditions
Different support conditions listed below are considered for comparative studies of how the bucklingtemperatures change with the support conditions.
Based on the fact that the Hyper-X wing panels (fig. 4-b) are line-welded, the SS-SS condition listedin Table 3 could be the closest to the actual support condition of the Hyper-X wing panels.
Temperature Load
The thermal load inputs used are uniform temperature loading and dome-shaped (or arch-shaped)temperature loading.
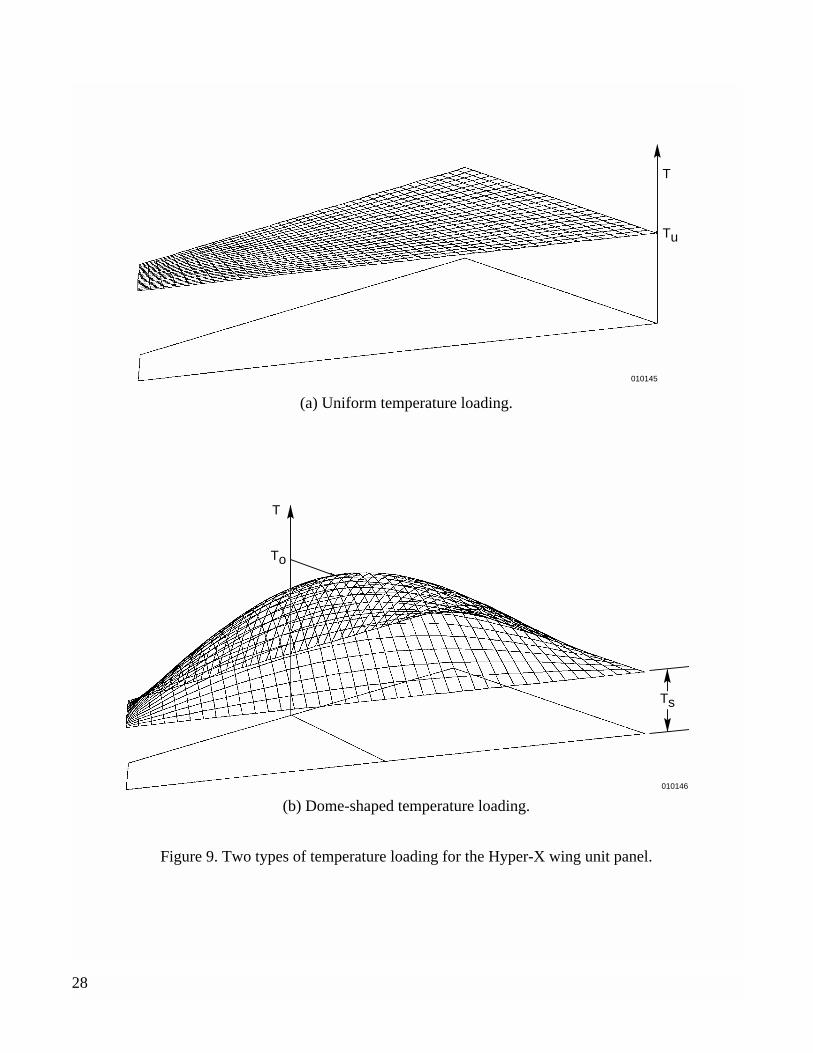
Uniform Temperature Loading
Because the actual temperature distributions over the entire wing surfaces are not available, uniformtemperature loading will be analyzed first. Figure 9(a) shows an example of a typical uniformtemperature loading case for the unit panel. The uniform nodal temperature input is chosen to be
. The eigenvalue λc (scaling factor) calculated from the SPAR program will then give thebuckling temperature (Tu)cr. Namely,
(2)
This buckling solution is for the uniform temperature loading over the wing panels with fixedsupports, and is not the actual case. This buckling solution is the simplest fundamental case, and canshow the location of the weakest bay, where thermal buckling is likely to take place. When the panelboundaries can have free in-plane motion (free supports), the uniform temperature loading case obviouslycan not induce thermal buckling.
Dome-Shaped Temperature Loading
Hot structural panels are usually fastened to the cooler substructures (of relatively large mass) thatfunction as heat sinks. Thus, even under a uniform surface heat flux, the temperature distribution over the
Table 3. Definition of support conditions.
Panel Boundaries Panel and Stiffener Welded Sites
SS-SS simply supported simply supported
SS-CL simply supported clamped
CL-SS clamped simply supported
CL-CL clamped clamped
T T u 1°F= =
T u( )cr λc 1°F×=
9
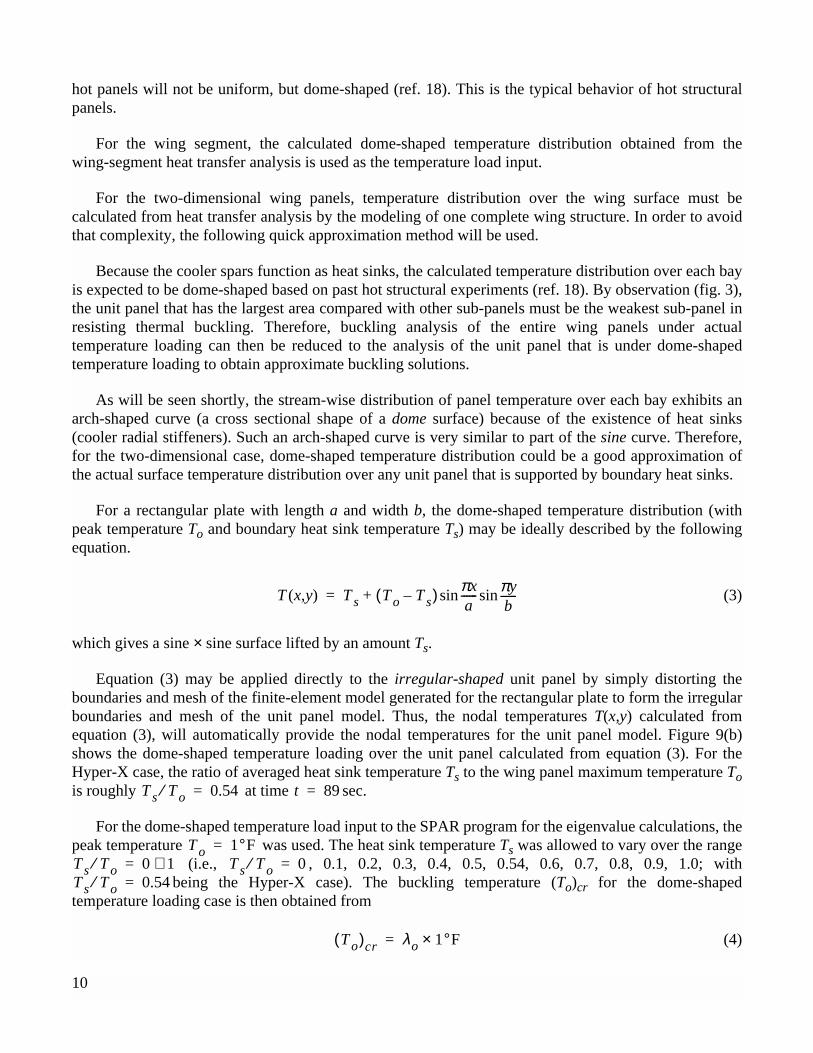
hot panels will not be uniform, but dome-shaped (ref. 18). This is the typical behavior of hot structuralpanels.
For the wing segment, the calculated dome-shaped temperature distribution obtained from thewing-segment heat transfer analysis is used as the temperature load input.
For the two-dimensional wing panels, temperature distribution over the wing surface must becalculated from heat transfer analysis by the modeling of one complete wing structure. In order to avoidthat complexity, the following quick approximation method will be used.
Because the cooler spars function as heat sinks, the calculated temperature distribution over each bayis expected to be dome-shaped based on past hot structural experiments (ref. 18). By observation (fig. 3),the unit panel that has the largest area compared with other sub-panels must be the weakest sub-panel inresisting thermal buckling. Therefore, buckling analysis of the entire wing panels under actualtemperature loading can then be reduced to the analysis of the unit panel that is under dome-shapedtemperature loading to obtain approximate buckling solutions.
As will be seen shortly, the stream-wise distribution of panel temperature over each bay exhibits anarch-shaped curve (a cross sectional shape of a dome surface) because of the existence of heat sinks(cooler radial stiffeners). Such an arch-shaped curve is very similar to part of the sine curve. Therefore,for the two-dimensional case, dome-shaped temperature distribution could be a good approximation ofthe actual surface temperature distribution over any unit panel that is supported by boundary heat sinks.
For a rectangular plate with length a and width b, the dome-shaped temperature distribution (withpeak temperature To and boundary heat sink temperature Ts) may be ideally described by the followingequation.
(3)
which gives a sine × sine surface lifted by an amount Ts.
Equation (3) may be applied directly to the irregular-shaped unit panel by simply distorting theboundaries and mesh of the finite-element model generated for the rectangular plate to form the irregularboundaries and mesh of the unit panel model. Thus, the nodal temperatures T(x,y) calculated fromequation (3), will automatically provide the nodal temperatures for the unit panel model. Figure 9(b)shows the dome-shaped temperature loading over the unit panel calculated from equation (3). For theHyper-X case, the ratio of averaged heat sink temperature Ts to the wing panel maximum temperature Tois roughly at time sec.
For the dome-shaped temperature load input to the SPAR program for the eigenvalue calculations, thepeak temperature was used. The heat sink temperature Ts was allowed to vary over the range
(i.e., , 0.1, 0.2, 0.3, 0.4, 0.5, 0.54, 0.6, 0.7, 0.8, 0.9, 1.0; withbeing the Hyper-X case). The buckling temperature (To)cr for the dome-shaped
temperature loading case is then obtained from
(4)
T x y( , ) T s T o T s–( ) πxa
------ πyb
------sinsin+=
T s T o⁄ 0.54= t 89=
T o 1°F=T s T o⁄ 0 1∼= T s T o⁄ 0=T s T o⁄ 0.54=
T o( )cr λo 1°F×=
10

where λo is the eigenvalue calculated from the SPAR program for the dome-shaped temperature loadingcase. The reason for using the whole range of is to study the effect of the heat sinktemperature Ts on the panel buckling temperature (To)cr. Keep in mind that the panel bucklingtemperature (To)cr will increase with the increasing heat sink temperature Ts as a result of relaxation ofthe thermal expansion constraint exerted on the unit panel by the boundary heat sink.
Buckling Temperature Magnification Factors
As will be seen shortly, the buckling temperature (To)cr for the dome-shaped temperature loadingcase is much higher than the buckling temperature (Tu)cr of the uniform temperature loading case (withfixed supports). Therefore, a buckling temperature magnification factor of the first kind η defined below
(5)
will be used to indicate how many times the buckling temperature (To)cr of the dome-shaped temperatureloading case (free or fixed supports) is magnified from the buckling temperature (Tc)cr of the uniformtemperature loading case with fixed supports (fundamental case).
In reality, the wing panel attempts to expand under heating, but its expansion is resisted by the coolerboundary substructures (heat sinks) which expand less. This boundary constraint is the cause of thermalbuckling of the wing panels. Such substructure constraints will gradually relax as the substructures areheated up, resulting in a higher panel buckling temperature. In order to find out how the heat sinktemperature Ts affects the panel buckling temperature (To)cr for the dome-shaped temperature loadingcase with free supports, another buckling temperature magnification factor of the second kind ξ definedbelow
(6)
will be used to indicate how many times the buckling temperature (To)cr for the dome-shaped temperatureloading case with free support (SS or CL) is magnified when the heat sink temperature Ts increases from
(no heat sink thermal expansion) to a certain non-zero value (with heat sink thermalexpansion).
RESULTS
The results of the heat transfer analysis, thermal stress analysis, and thermal buckling analysis of theHyper-X wing structure subjected to Mach 7.5 heating (the nominal Mach 7 mission) are presented in thefollowing sections.
T s T o⁄ 0 1∼=
ηT o( )cr
T u( )cr----------------=
ξT o( )cr
T o( )cr T s 0=---------------------------------=
T s 0= T s 0≠
11

Heat Transfer
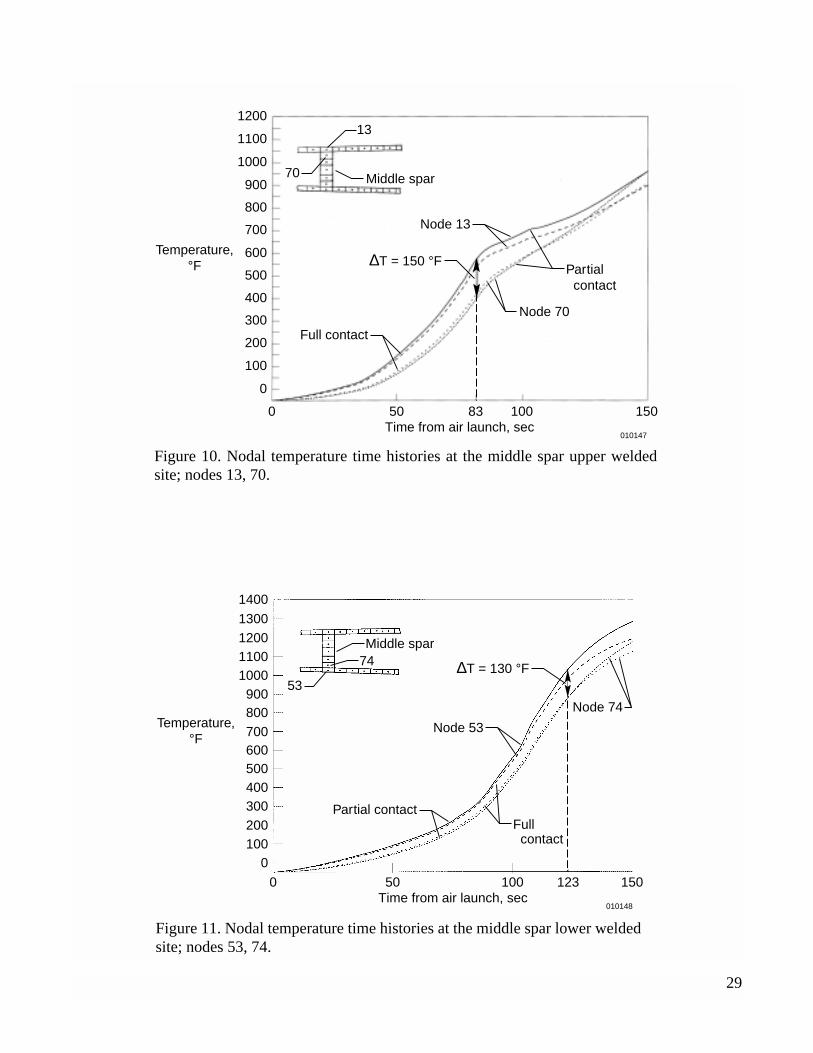
Figure 10 shows the time histories of nodal temperatures {T13(t), T70(t)} at nodes {13, 70} of themiddle spar upper welded site (fig. 4) for the full and partial contact cases. The nodal temperaturedifference (T13 − T70) is slightly higher for the partial contact case, and it reached a maximum value of
at approximately sec. into the flight profile.
Figure 11 shows the time histories of nodal temperatures {T53(t), T74(t)} at nodes {53, 74} of themiddle spar lower welded site (fig. 4) for the two cases of contact conditions. Although the nodaltemperature difference (T53 − T74) at the lower weld site is less severe than (T13 − T70) of the upper weldsite, it is still substantial. For the partial contact case, the lower welded site nodal temperature difference(T53 − T74) reached a maximum value of at approximately sec into theflight profile.
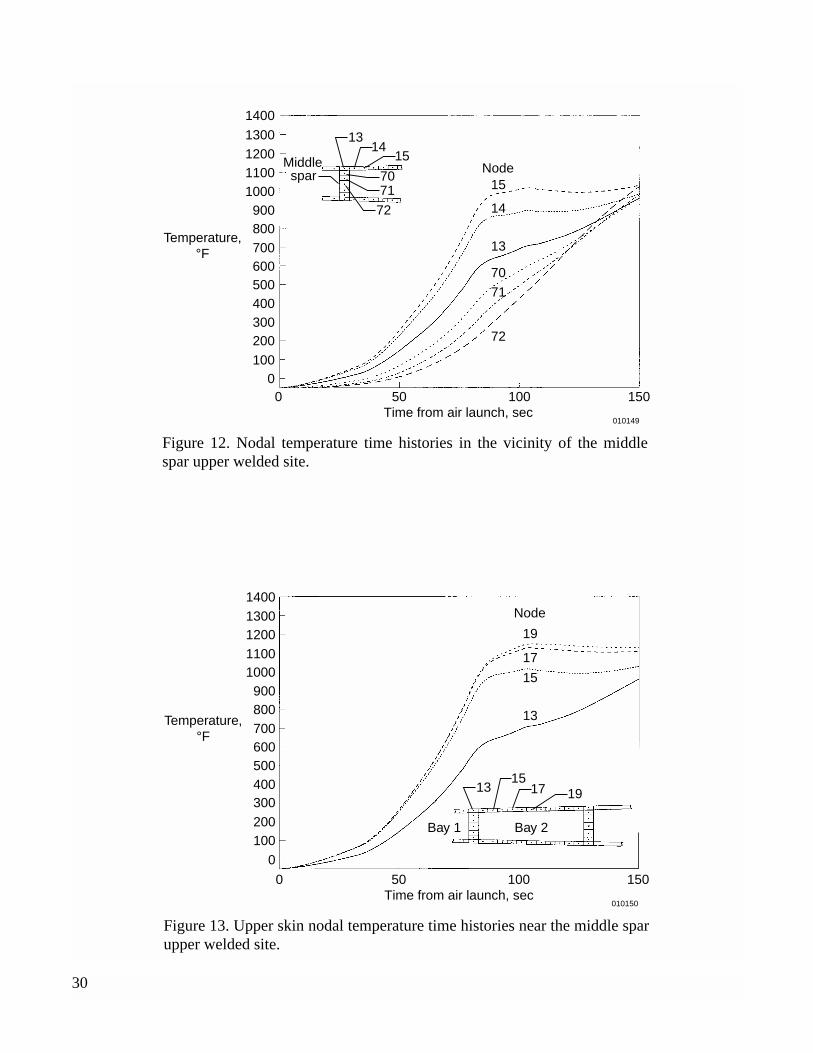
Shown in figure 12 are temperature time histories at locations down the middle spar and along theupper skin panel. The temperature gradient along the skin panel (between capacitor 13 and 14) appears tobe greater than the temperature gradient from capacitor 13 to 70, but the distance between the twocapacitors is longer. The temperature gradient per inch between capacitor 13 and 70 is actually larger.Temperature time histories on the upper skin panel can be seen in figure 13. The temperature gradientbetween capacitor 13 and 15 is higher than the gradients between capacitors 13 and 17 or 13 and 19.Distance between capacitors 13 and 15, 15 and 17, and 17 and 19 is 0.5 inches apart. Figure 14 showsnodal temperature time histories for node 7 of bay 1 upper skin and node 46 of bay 1 lower skin. Notethat reached a maximum value, at sec. As can be seen in the nextfigure, node 7 and node 46 are respectively the peak temperatures of the upper and lower skins.
Figure 15 shows the chord-wise distributions of the upper and lower skin temperatures at secinto the flight profile. These temperature distributions were calculated from the thermal model withpartial contact at the spar and skin weld sites. As can be seen from figure 15, the temperature distributionsare steepest near the spars (heat sinks). Note that the panel temperature distribution over each bay isarch-shaped. This is the typical behavior of hot structural panels supported by the boundary heat sinks.The structural temperatures at typical points of the wing segment at sec are listed in Table 4. Theupper and lower wing skin temperatures listed are the peak temperatures of each bay.
Notice that the designed flight trajectory caused the Hyper-X upper skin temperatures to besignificantly higher than the lower skin temperatures. This implies that buckling is more critical for theupper wing panels than the lower wing panels. The panel temperature distributions of figure 15 and the
Table 4. Structural temperatures at typical points of wing segment; t = 89 sec, °F
Fore weld site
Bay 1 skin (peak)
Middle weld site
Bay 2 skin (peak)
Aft weld site
Upper 675 1,153 748 1,127 638
Lower 479 607 476 592 418
T 13 T 70–( ) 150°F= t 83=
T 53 T 74–( ) 130 °F= t 123=
∆T T 7 T 46–= ∆T 546 °F= t 89=
t 89=
t 89=
12
associated spar temperatures (not shown) were used as temperature inputs to the structural model forthermal stress and thermal buckling analyses of the wing segment.
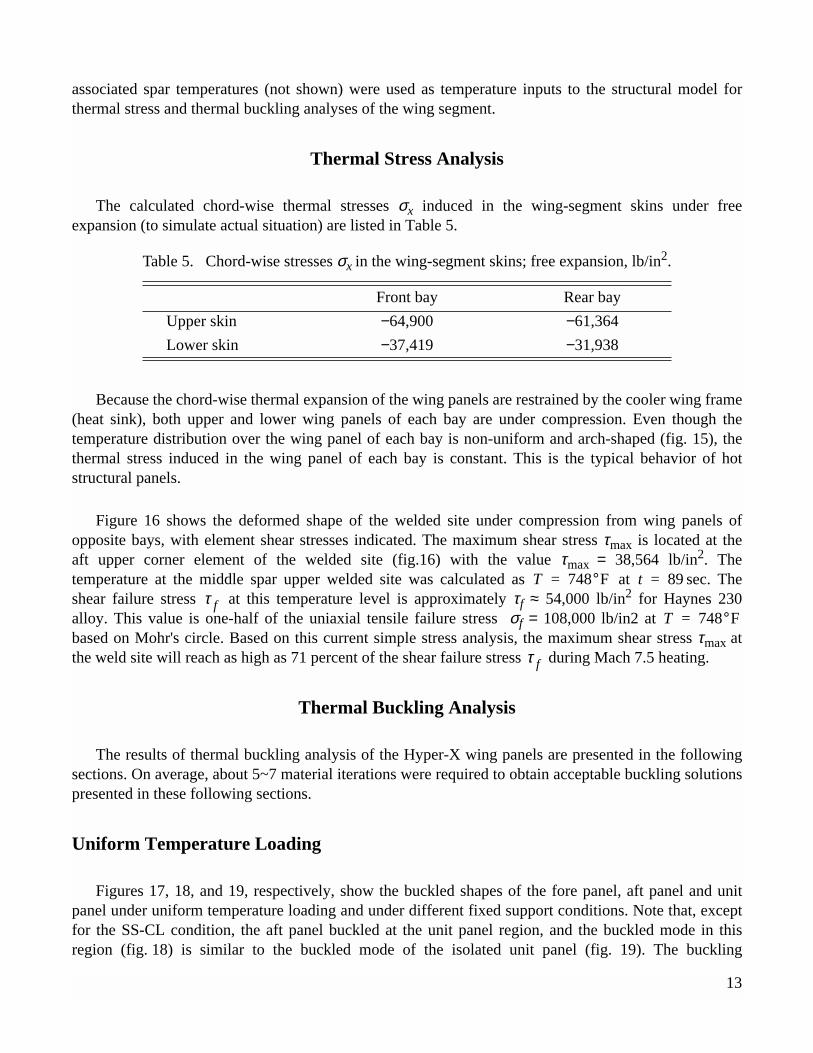
Thermal Stress Analysis
The calculated chord-wise thermal stresses σx induced in the wing-segment skins under freeexpansion (to simulate actual situation) are listed in Table 5.
Because the chord-wise thermal expansion of the wing panels are restrained by the cooler wing frame(heat sink), both upper and lower wing panels of each bay are under compression. Even though thetemperature distribution over the wing panel of each bay is non-uniform and arch-shaped (fig. 15), thethermal stress induced in the wing panel of each bay is constant. This is the typical behavior of hotstructural panels.
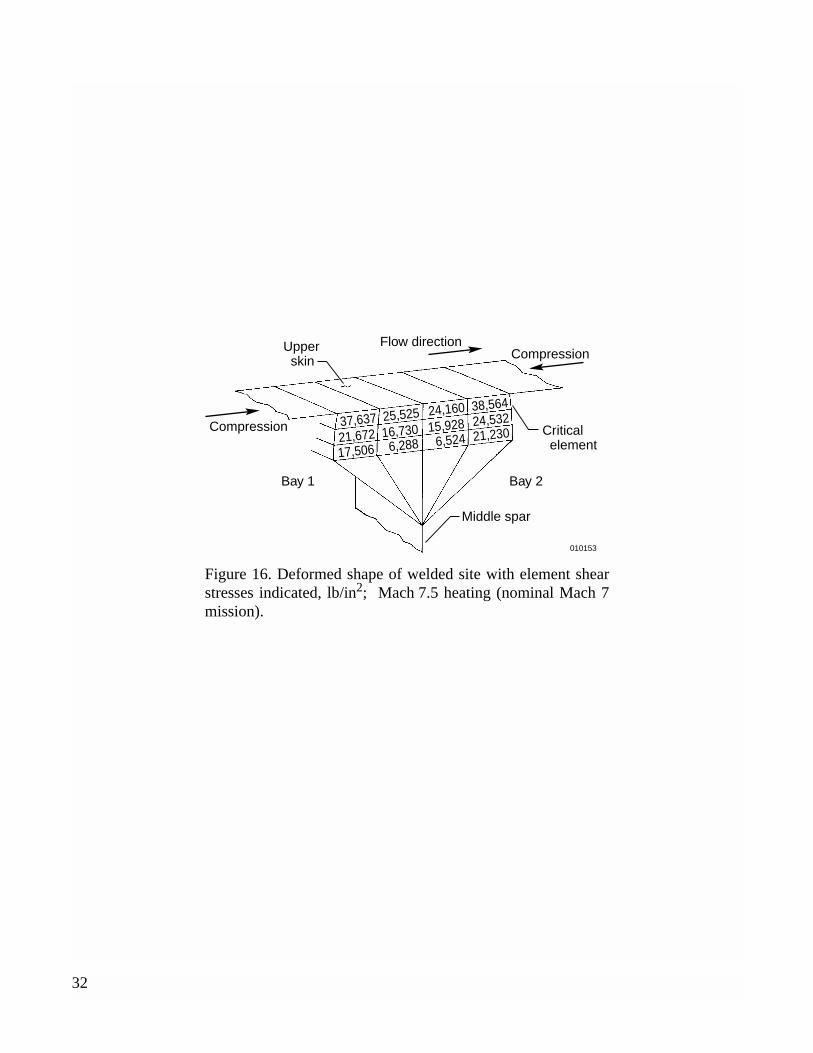
Figure 16 shows the deformed shape of the welded site under compression from wing panels ofopposite bays, with element shear stresses indicated. The maximum shear stress τmax is located at theaft upper corner element of the welded site (fig.16) with the value τmax = 38,564 lb/in2. Thetemperature at the middle spar upper welded site was calculated as at sec. Theshear failure stress at this temperature level is approximately τf ≈ 54,000 lb/in2 for Haynes 230alloy. This value is one-half of the uniaxial tensile failure stress σf = 108,000 lb/in2 at based on Mohr's circle. Based on this current simple stress analysis, the maximum shear stress τmax atthe weld site will reach as high as 71 percent of the shear failure stress during Mach 7.5 heating.
Thermal Buckling Analysis
The results of thermal buckling analysis of the Hyper-X wing panels are presented in the followingsections. On average, about 5~7 material iterations were required to obtain acceptable buckling solutionspresented in these following sections.
Uniform Temperature Loading
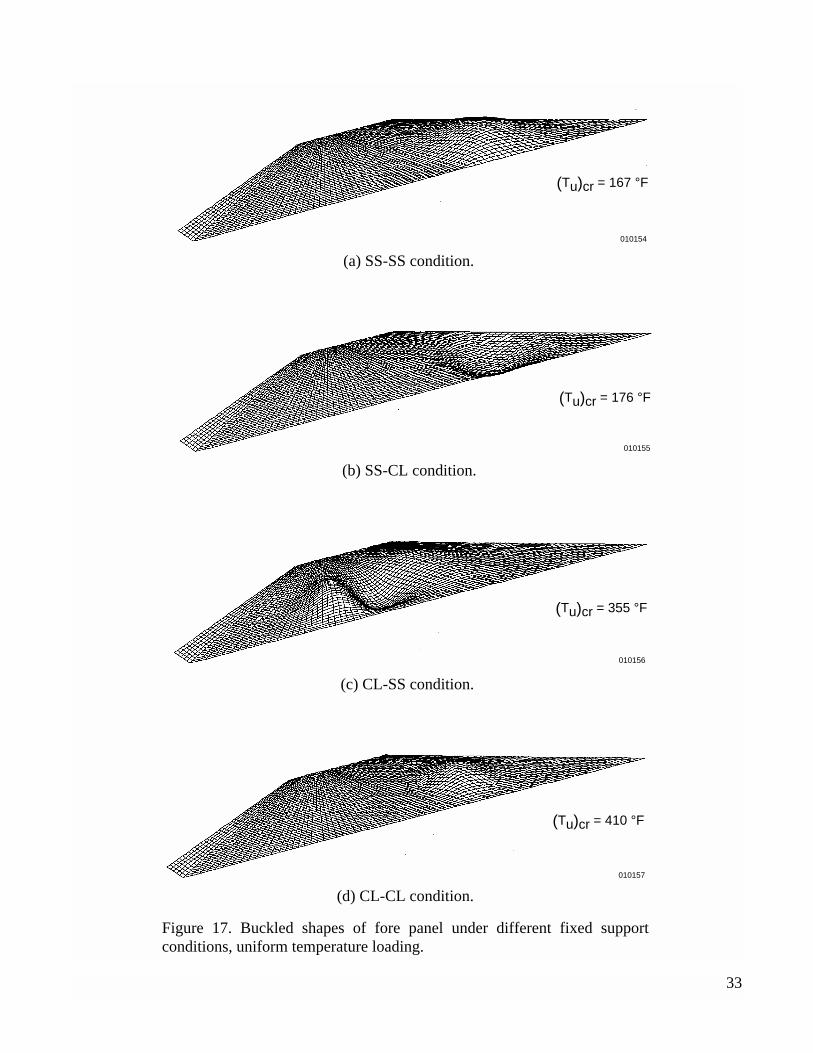
Figures 17, 18, and 19, respectively, show the buckled shapes of the fore panel, aft panel and unitpanel under uniform temperature loading and under different fixed support conditions. Note that, exceptfor the SS-CL condition, the aft panel buckled at the unit panel region, and the buckled mode in thisregion (fig. 18) is similar to the buckled mode of the isolated unit panel (fig. 19). The buckling
Table 5. Chord-wise stresses σx in the wing-segment skins; free expansion, lb/in2.
Front bay Rear bay
Upper skin −64,900 −61,364
Lower skin −37,419 −31,938
T 748°F= t 89=τ f
T 748°F=
τ f
13
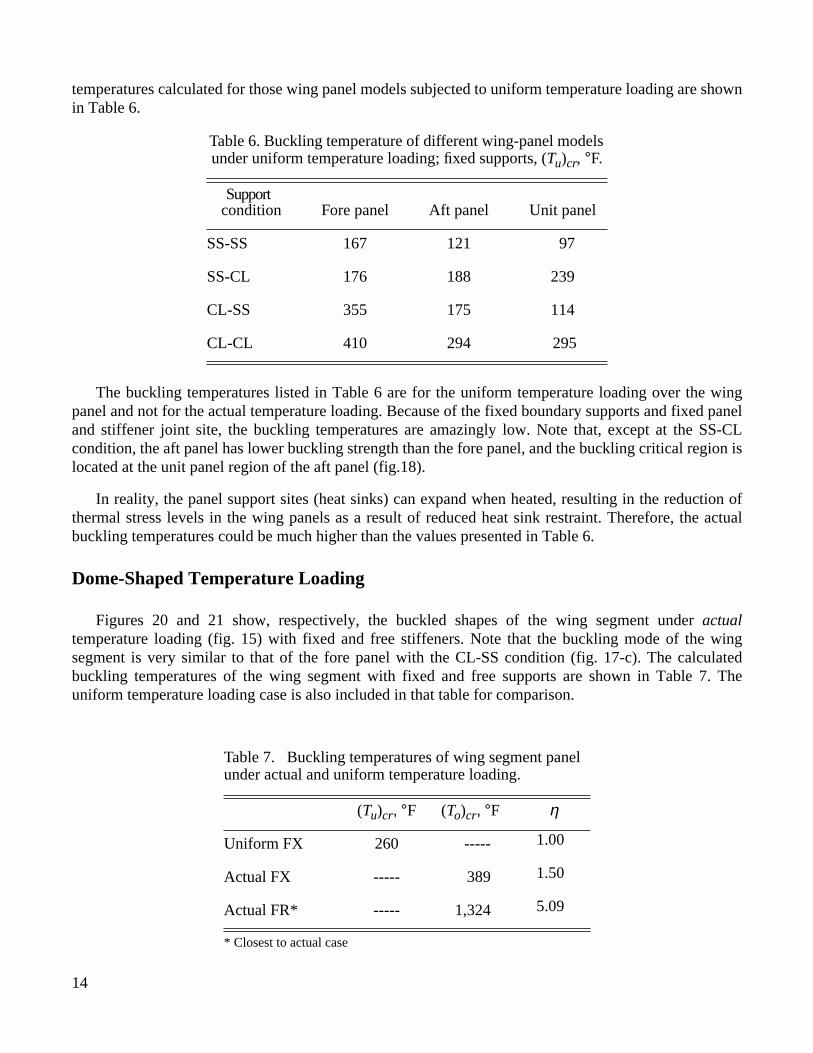
temperatures calculated for those wing panel models subjected to uniform temperature loading are shownin Table 6.
The buckling temperatures listed in Table 6 are for the uniform temperature loading over the wingpanel and not for the actual temperature loading. Because of the fixed boundary supports and fixed paneland stiffener joint site, the buckling temperatures are amazingly low. Note that, except at the SS-CLcondition, the aft panel has lower buckling strength than the fore panel, and the buckling critical region islocated at the unit panel region of the aft panel (fig.18).
In reality, the panel support sites (heat sinks) can expand when heated, resulting in the reduction ofthermal stress levels in the wing panels as a result of reduced heat sink restraint. Therefore, the actualbuckling temperatures could be much higher than the values presented in Table 6.
Dome-Shaped Temperature Loading
Figures 20 and 21 show, respectively, the buckled shapes of the wing segment under actualtemperature loading (fig. 15) with fixed and free stiffeners. Note that the buckling mode of the wingsegment is very similar to that of the fore panel with the CL-SS condition (fig. 17-c). The calculatedbuckling temperatures of the wing segment with fixed and free supports are shown in Table 7. Theuniform temperature loading case is also included in that table for comparison.
Table 6. Buckling temperature of different wing-panel models under uniform temperature loading; fixed supports, (Tu)cr, °F.
Support condition Fore panel Aft panel Unit panel
SS-SS 167 121 97
SS-CL 176 188 239
CL-SS 355 175 114
CL-CL 410 294 295
Table 7. Buckling temperatures of wing segment panel under actual and uniform temperature loading.
(Tu)cr, °F (To)cr, °F η
Uniform FX 260 ----- 1.00
Actual FX ----- 389 1.50
Actual FR* ----- 1,324 5.09
* Closest to actual case
14
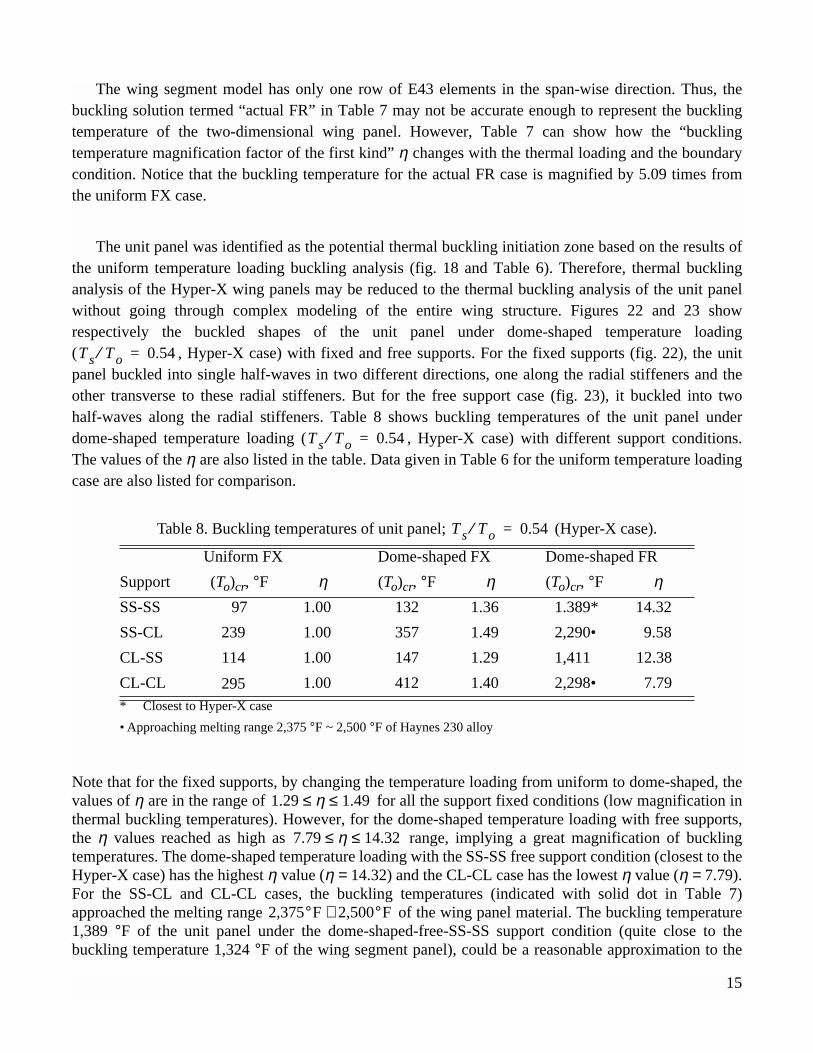
The wing segment model has only one row of E43 elements in the span-wise direction. Thus, thebuckling solution termed “actual FR” in Table 7 may not be accurate enough to represent the bucklingtemperature of the two-dimensional wing panel. However, Table 7 can show how the “bucklingtemperature magnification factor of the first kind” η changes with the thermal loading and the boundarycondition. Notice that the buckling temperature for the actual FR case is magnified by 5.09 times fromthe uniform FX case.
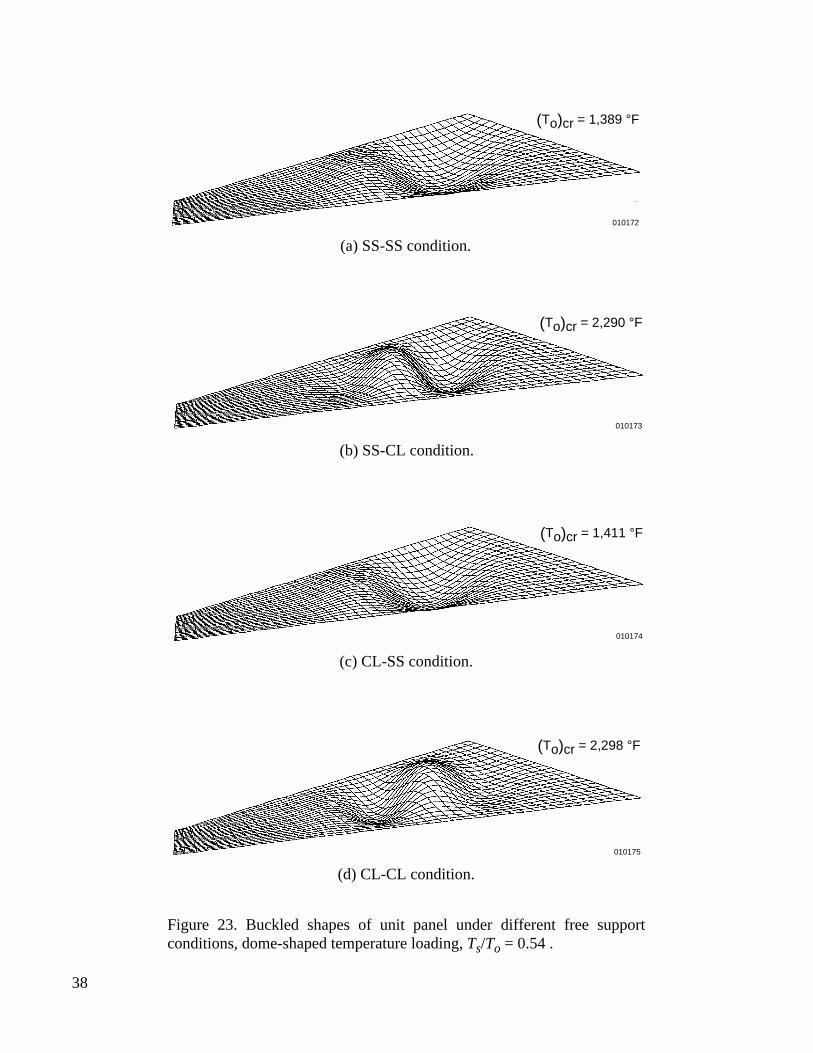
The unit panel was identified as the potential thermal buckling initiation zone based on the results ofthe uniform temperature loading buckling analysis (fig. 18 and Table 6). Therefore, thermal bucklinganalysis of the Hyper-X wing panels may be reduced to the thermal buckling analysis of the unit panelwithout going through complex modeling of the entire wing structure. Figures 22 and 23 showrespectively the buckled shapes of the unit panel under dome-shaped temperature loading( , Hyper-X case) with fixed and free supports. For the fixed supports (fig. 22), the unitpanel buckled into single half-waves in two different directions, one along the radial stiffeners and theother transverse to these radial stiffeners. But for the free support case (fig. 23), it buckled into twohalf-waves along the radial stiffeners. Table 8 shows buckling temperatures of the unit panel underdome-shaped temperature loading ( , Hyper-X case) with different support conditions.The values of the η are also listed in the table. Data given in Table 6 for the uniform temperature loadingcase are also listed for comparison.
Note that for the fixed supports, by changing the temperature loading from uniform to dome-shaped, thevalues of η are in the range of for all the support fixed conditions (low magnification inthermal buckling temperatures). However, for the dome-shaped temperature loading with free supports,the η values reached as high as range, implying a great magnification of bucklingtemperatures. The dome-shaped temperature loading with the SS-SS free support condition (closest to theHyper-X case) has the highest η value (η = 14.32) and the CL-CL case has the lowest η value (η = 7.79).For the SS-CL and CL-CL cases, the buckling temperatures (indicated with solid dot in Table 7)approached the melting range of the wing panel material. The buckling temperature1,389 °F of the unit panel under the dome-shaped-free-SS-SS support condition (quite close to thebuckling temperature 1,324 °F of the wing segment panel), could be a reasonable approximation to the
Table 8. Buckling temperatures of unit panel; (Hyper-X case).
Uniform FX Dome-shaped FX Dome-shaped FR
Support (To)cr, °F η (To)cr, °F η (To)cr, °F ηSS-SS 97 1.00 132 1.36 1.389* 14.32
SS-CL 239 1.00 357 1.49 2,290• 9.58
CL-SS 114 1.00 147 1.29 1,411 12.38
CL-CL 295 1.00 412 1.40 2,298• 7.79* Closest to Hyper-X case
• Approaching melting range 2,375 °F ~ 2,500 °F of Haynes 230 alloy
T s T o⁄ 0.54=
T s T o⁄ 0.54=
T s T o⁄ 0.54=
1.29 η 1.49≤ ≤
7.79 η 14.32≤ ≤
2,375°F 2,500°F∼
15

actual buckling temperature of the aft wing panel of the Hyper-X. The buckling temperature 1,389 °F ofthe unit panel is 1.20 times the calculated peak temperature 1,153 °F of the wing panels (fig.14). Thus, itis unlikely that the Hyper-X wing panels will buckle during the nominal Mach 7 flight trajectory.
Table 9 and10, respectively, show the buckling temperatures of unit panels under simply supportedand clamped freely expandable boundaries subjected to dome-shaped temperature loading with differentheat sink temperatures. The η and ξ are also listed.
The solid dot symbols in both Tables 8 and 10 indicate that the buckling temperatures have exceeded
the melting range 2,375 °F ∼ 2,500 °F of the wing panel material. At for which the
dome-shaped temperature distribution degenerates into uniform (flat) temperature distribution, the
buckling temperatures reached infinity, implying that thermal buckling does not occur. Note that at
in Tables 9 and 10 (no heat sink thermal expansion), the buckling temperatures
{ °F, °F} for the free simply supported and free clamped cases are much
higher than the corresponding buckling temperatures { °F, °F} for the
fixed support cases (Table 8). This results from the fact that for the free support cases, the unheated heat
sink still can deform elastically because of the thermal expansion of the unit panel, causing the buckling
temperatures to be much higher.
Table 9. Buckling temperatures of unit panel under dome-shaped temperature loading;simply supported free boundaries.
0. 0.1 0.2 0.3 0.4 0.5 0.54* 0.6 0.7 0.8 0.9 1.0
(To)cr, °F 826 872 971 1,067 1,189 1,352 1,389 1,458 1,732 2,507• 4,866• ∞
ξ 1.00 1.06 1.18 1.29 1.44 1.64 1.68 1.77 2.10 3.04 5.89 ∞
η 8.52 8.99 10.01 11.00 12.26 13.97 14.32 15.03 17.86 25.85 50.16 ∞
•Exceeded incipient melting point 2,345 ˚F of Haynes 230 alloy.*Hyper-X
Table 10. Buckling temperatures of unit panel under dome-shaped temperature loading;clamped free boundaries.
0. 0.1 0.2 0.3 0.4 0.5 0.54* 0.6 0.7 0.8 0.9 1.0
(To)cr, °F 1,294 1,385 1,408 1525 1661 1,857 1,942 2,141 2,763• 4,333• 8,447• ∞
ξ 1.00 1.07 1.09 1.18 1.29 1.44 1.50 1.65 2.14 3.35 6.53 ∞
η 4.39 4.69 4.77 5.17 5.63 6.29 6.58 7.26 9.37 14.69 28.63 ∞
•Exceeded incipient melting point 2,345 ˚F of Haynes 230 alloy.*Hyper-X
T s T o⁄
T s T o⁄
T s T o⁄ 1=
T s T o⁄ 0=
T o( )cr 826= T o( )cr 1,294=
T o( )cr 132= T o( )cr 412=
16
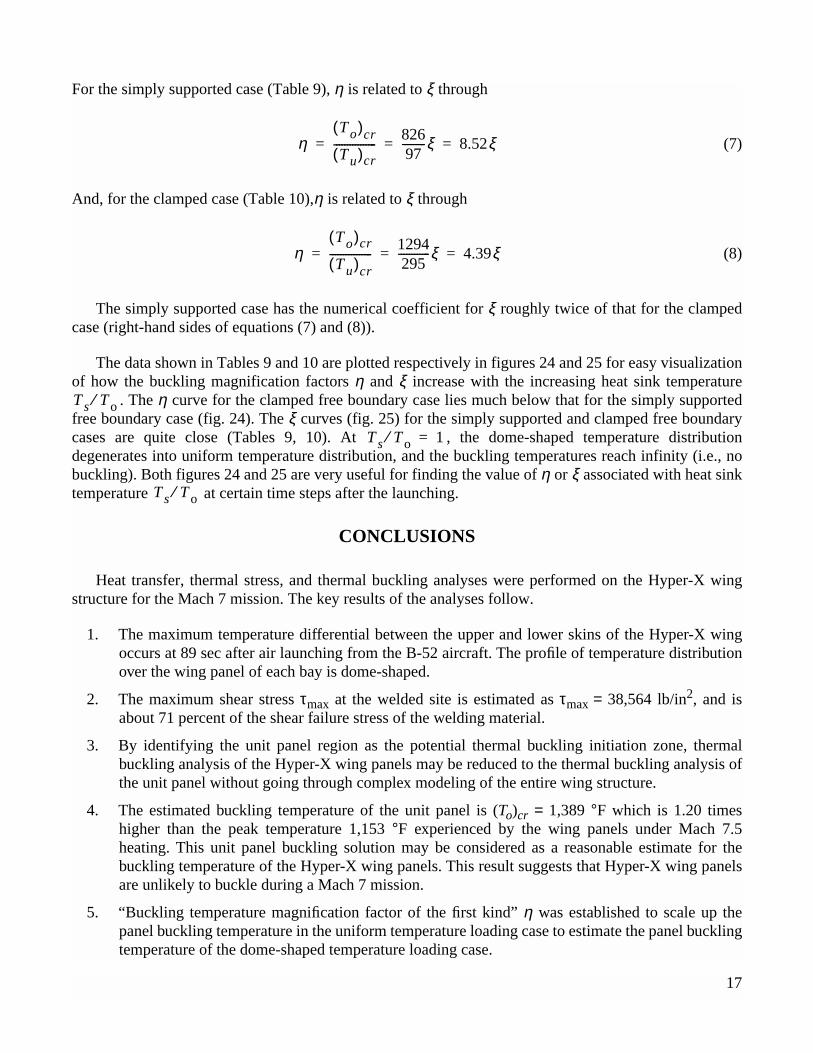
For the simply supported case (Table 9), η is related to ξ through
(7)
And, for the clamped case (Table 10),η is related to ξ through
(8)
The simply supported case has the numerical coefficient for ξ roughly twice of that for the clampedcase (right-hand sides of equations (7) and (8)).
The data shown in Tables 9 and 10 are plotted respectively in figures 24 and 25 for easy visualizationof how the buckling magnification factors η and ξ increase with the increasing heat sink temperature
. The η curve for the clamped free boundary case lies much below that for the simply supportedfree boundary case (fig. 24). The ξ curves (fig. 25) for the simply supported and clamped free boundarycases are quite close (Tables 9, 10). At , the dome-shaped temperature distributiondegenerates into uniform temperature distribution, and the buckling temperatures reach infinity (i.e., nobuckling). Both figures 24 and 25 are very useful for finding the value of η or ξ associated with heat sinktemperature at certain time steps after the launching.
CONCLUSIONS
Heat transfer, thermal stress, and thermal buckling analyses were performed on the Hyper-X wingstructure for the Mach 7 mission. The key results of the analyses follow.
1. The maximum temperature differential between the upper and lower skins of the Hyper-X wingoccurs at 89 sec after air launching from the B-52 aircraft. The profile of temperature distributionover the wing panel of each bay is dome-shaped.
2. The maximum shear stress τmax at the welded site is estimated as τmax = 38,564 lb/in2, and isabout 71 percent of the shear failure stress of the welding material.
3. By identifying the unit panel region as the potential thermal buckling initiation zone, thermalbuckling analysis of the Hyper-X wing panels may be reduced to the thermal buckling analysis ofthe unit panel without going through complex modeling of the entire wing structure.
4. The estimated buckling temperature of the unit panel is (To)cr = 1,389 °F which is 1.20 timeshigher than the peak temperature 1,153 °F experienced by the wing panels under Mach 7.5heating. This unit panel buckling solution may be considered as a reasonable estimate for thebuckling temperature of the Hyper-X wing panels. This result suggests that Hyper-X wing panelsare unlikely to buckle during a Mach 7 mission.
5. “Buckling temperature magnification factor of the first kind” η was established to scale up thepanel buckling temperature in the uniform temperature loading case to estimate the panel bucklingtemperature of the dome-shaped temperature loading case.
ηT o( )cr
T u( )cr----------------
82697---------ξ 8.52ξ= = =
ηT o( )cr
T u( )cr----------------
1294295------------ξ 4.39ξ= = =
T s T o⁄
T s T o⁄ 1=
T s T o⁄
17

6. “Buckling temperature magnification factor of the second kind” ξ was established to scale up thepanel buckling temperature in the dome-shaped temperature loading case with unheated boundaryheat sinks to generate a solution for the same case when boundary heat sinks are heated.
Dryden Flight Research CenterNational Aeronautics and Space AdministrationEdwards, California, April 12, 2001
18
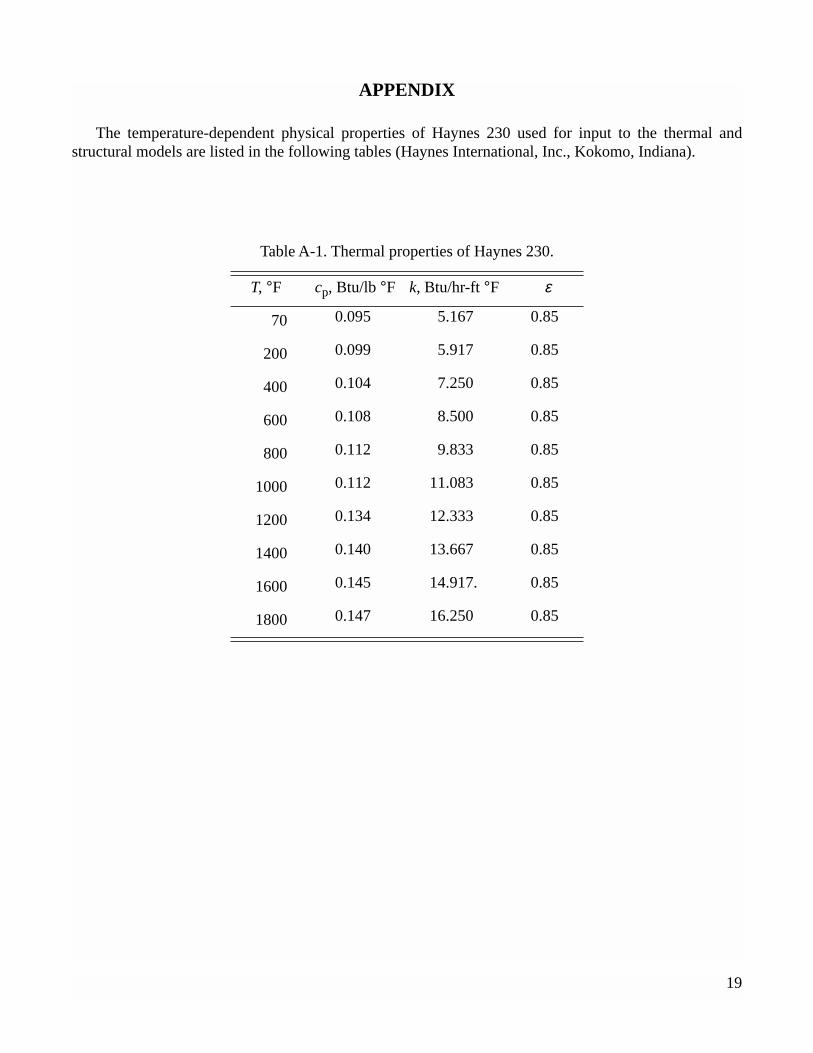
APPENDIX
The temperature-dependent physical properties of Haynes 230 used for input to the thermal andstructural models are listed in the following tables (Haynes International, Inc., Kokomo, Indiana).
Table A-1. Thermal properties of Haynes 230.
T, °F cp, Btu/lb °F k, Btu/hr-ft °F ε
70 0.095 5.167 0.85
200 0.099 5.917 0.85
400 0.104 7.250 0.85
600 0.108 8.500 0.85
800 0.112 9.833 0.85
1000 0.112 11.083 0.85
1200 0.134 12.333 0.85
1400 0.140 13.667 0.85
1600 0.145 14.917. 0.85
1800 0.147 16.250 0.85
19

REFERENCES
1. Ko, William L., Robert D. Quinn, and Leslie Gong, Finite-Element Reentry Heat Transfer Analysisof Space Shuttle Orbiter, NASA Technical Paper 2657, December 1986.
2. Ko, William L. and Raymond H. Jackson, Compressive Buckling Analysis of Hat-Stiffened Panel,NASA TM-4310, August 1991.
3. Ko, William L. and Raymond H. Jackson, Shear Buckling Analysis of Hat-Stiffened Panel, NASATM-4644, November 1994.
4. Ko, William L. and Raymond H. Jackson, Thermal Behavior of a Titanium Honeycomb-CoreSandwich Panel, NASA TM-101732, January 1991.
5. Ko, William L. and Raymond H. Jackson, Combined Compressive and Shear Buckling Analysis ofHypersonic Aircraft Structural Sandwich Panels, NASA TM-4290, May 1991. Also published asAIAA Paper No. 92-2487-CP, in the proceedings of the 33rd AIAA/ASME/ASCE/AHS/ASCStructures, Structural Dynamics and Materials Conference, Dallas, Texas, April 13-15, 1992
Table A-2. Material properties of Haynes 230; ρ = 0.324 lb/in3.
T, °F E × 106,lb/in2 σT × 103, lb/in2 σY × 103, lb/in2 α × 10-6, in/in-°F ν*
70 30.6 125.4 57.4 7.0 0.310
200 30.1 (122.2) (55.0) 7.1 0.311
400 29.3 (117.3) (51.3) 7.2 0.315
600 28.3 (112.3) (47.7) 7.4 0.318
800 27.3 (107.4) (44.0) 7.6 0.321
1000 26.4 102.5 40.3 7.9 0.324
1200 25.3 97.7 39.5 8.1 0.330
1400 24.1 87.7 42.5 8.3 0.332
1600 23.1 63.1 37.3 8.6 0.334
1800 21.9 35.2 21.1 8.9 0.340
2000 20.7* 19.5 10.8 9.2* 0.343
* Estimated; ()Interpolated
20

6. Ko, William L., “Mechanical and Thermal Buckling Analysis of Sandwich Panels Under DifferentEdge Conditions,” Pacific International Conference on Aerospace Science and TechnologyConference Proceedings, Vol. II, Tainan, Taiwan, December 6-9, 1993.
7. Ko, William L., Mechanical and Thermal Buckling Analysis of Rectangular Sandwich Panels underDifferent Edge Conditions, NASA TM-4585, April 1994.
8. Ko, William L., Prediction of Thermal Buckling Strengths of Hypersonic Aircraft Sandwich PanelsUsing Minimum Potential Energy and Finite Element Methods, NASA TM-4643, May 1995.
9. Ko, William L. and Raymond H. Jackson, Combined-Load Buckling Behavior of Metal-MatrixComposite Sandwich Panels Under Different Thermal Environments, NASA TM-4321, September1991.
10. Ko, William L. and Raymond H. Jackson, Compressive and Shear Buckling Analysis of MetalMatrix Composite Sandwich Panels under Different Thermal Environments, NASA TM-4492, June1993. Also presented in Composite Structures, Vol. 25, July 1993, pp. 227-239.
11. Ko, William L., Thermostructural Behavior of a Hypersonic Aircraft Sandwich Panel Subjected toHeating on One Side, NASA TM-4769, April 1997.
12. Whetstone, W. D., SPAR Structural Analysis System Reference Manual, System Level 13A,Vol. 1,Program Execution, NASA CR-158970-1, December 1978.
13. Moeckel, W. E., Oblique-Shock Relations at Hypersonic Speeds for Air in Chemical Equilibrium,NACA TN-3895, January 1957.
14. Eckert, Ernst R. G., Survey of Boundary Layer Heat Transfer at High Velocities and HighTemperatures, WADC TR-59-624, Wright-Patterson AFB, Ohio, April 1960.
15. Zoby, E. V., Moss, J. N., and Sutton, K., “Approximate Convective-Heating Equations forHypersonic Flows,” J. Spacecraft and Rockets, vol. 18, no. 1, Jan./Feb. 1981, pp. 64-70.
16. Hansen, C., Frederick, Approximations for the Thermodynamic and Transport Properties ofHigh-Temperature Air, NASA TR R-50, 1959.
17. Ko, William L., Mechanical- and Thermal-Buckling Behavior of Rectangular Plates With DifferentCentral Cutouts, NASA/TM-1998-206542, March 1998.
18. Richards, W. Lance and Randolph C. Thompson, Titanium Honeycomb Panel Testing. NASA TM-4768, October 1996. Also presented at Structural Testing Technology at High TemperatureConference, Dayton, Ohio, Nov. 4–6, 1991.
21

22
Hyper-X
Pegasus booster
010132
Interstage adapter
100,000
Air launch (t = 0.0 sec)
AscentB-52
End of flight(t = 728.66 sec)
Distance 010133
(over water)
Altitude,ft
Pegasus booster rocket
Hyper-X free flight
Scramjet engine start (t = 91.50 sec)
Hyper-X booster separation (t = 89.00 sec)
Booster burn-out (t = 85.50 sec)
Experiment completion (t = 105.00 sec)
Descent
Energy maneuvers to reduce speed/
energy
Figure 1. Hyper-X hypersonic flight research vehicle mated to thelaunch vehicle Pegasus® booster rocket.
Figure 2. Hyper-X hypersonic flight research vehicle flight trajectory.
23
Figure 3. Unconventional wing structures of Hyper-X hypersonic flight research vehicle.
Fore wing panel (upper/lower)
Aft wing panel (upper/lower)
Unit panel
Aft
Fore
Carbon/carbon leading edge
Wing segment location
Radial stiffener
Bay 1
28.133 in.
18.000 in.
11.000 in.
Bay 2
010134
11.178 in.
4.700 in.

24
Figure 4. Finite-difference thermal model for Hyper-X wing segment;welded site dimensions in inches, full contact and partial contact.
010136
Bay 1
Bay 2
63 internal radiation elements
1
32 33 34 35 36 37 38 39 40 41 4243
44
45
46
474849505152535455565758
5950
61
6263
2 3 4 5 6 7 8 9 10 11
13
1516
171819202122232425262728
29
30
31
12
14
010137
Bay 1
Bay 2
63 internal radiation elements
1 2 3 4 5 6 7 8 9 10 11
13
1516
171819202122232425262728
29
30
31
12
14
1 2 3 4 5 6 7 8 9 10 11
13
15
161718192021222324252627
2829
30
3132
12
14
(a) Combined case.
(b) Separate case.
Figure 5. SPAR finite-element models for computations of internal radiation viewfactors.
010135
0.09 in.
Full contact Partial contact
0.25 in.
Bay 1 Bay 2
0.09 in.
Upper skin
Spar(radial stiffener)
OR
0.01 in.
0.04 in.
0.25 in.
66676869
1
41
Fore spar Middle spar 64 capacitors
Typical welded site
Aft spar
7071727374
7576777879
2 3 4 5 6 7 8 9 10 11 13 15 16 17 18 19 20 21 22 23 24 25
42 43 44 45 46 47 48 49 50 51 52 53 54 55 56 57 58 59 60 61 62 63 64 65
12 14
25
(a) Altitude.
(b) Angle of attack.
(c) Mach number.
010138
Altitude,ft
100,000
80,000
60,000
40,000
25
20,000
0 50 100
Hyper-X separation t = 89.0 sec
75Time from air launch, sec
125 150
010139
Angleof attack,
deg
20
25
10
5
15
0
–5
0–10
50 100
Hyper-X separation t = 89.0 sec
75Time from air launch, sec
125 150
Figure 6. Nominal Mach 7 mission flight trajectory of the Pegasus booster rocket carrying the Hyper-Xvehicle for heating calculations.
010140
Machnumber
8
25
7
6
5
4
3
2
1
0 50 100
Hyper-X separation t = 89.0 sec
75Time from air launch, sec
125 150

26
Upper skin
(not to scale)
E43 elements
E33 elements
JLOCE23 elementsE33 elementsE43 elements
Welded site
Middle spar
E23 elements
Fore spar
Bay 1
Bay 2
Middle spar Aft spar010141
166208
95
Figure 7. SPAR finite-element structural model for Hyper-X wing segment.
27
JLOCE23 elementsE43 elements
3116350
3000
010142
(a) Fore panel model.
JLOCE23 elementsE43 elements
2419276
2320
010143
(b) Aft panel model.
JLOCE23 elementsE43 elements
984126920
010144
(c) Unit panel model
Figure 8. Three types of finite-element models for Hyper-X wing skins.
28
010146
Ts
To
T
(a) Uniform temperature loading.
(b) Dome-shaped temperature loading.
Figure 9. Two types of temperature loading for the Hyper-X wing unit panel.
T
Tu
010145
29
010147
1200
1100
1000
900
800
Temperature,°F
700
600
500
400
300
200
100
0
0 50 83 100Time from air launch, sec
Node 70
Full contact
Node 13
13
150
Partial contact
∆T = 150 °F
70 Middle spar
010148
1400
Temperature,°F
0 50 100Time from air launch, sec
Node 74
Partial contact
Node 53
74
150123
Full contact
∆T = 130 °F53
Middle spar
1300120011001000900800700600500400300200
0100
Figure 10. Nodal temperature time histories at the middle spar upper weldedsite; nodes 13, 70.
Figure 11. Nodal temperature time histories at the middle spar lower weldedsite; nodes 53, 74.
30
010149
1400
Temperature,°F
0 50 100Time from air launch, sec
15
14
13
70
71
72
150
1314
15
70
72
71
Middle spar Node
1300120011001000900800700600500400300200
0100
010150
1400
Temperature,°F
0 50 100Time from air launch, sec
19
17
15
13
150
13
Bay 1 Bay 2
Node
1517 19
1300120011001000900800700600500400300200
0
100
Figure 12. Nodal temperature time histories in the vicinity of the middlespar upper welded site.
Figure 13. Upper skin nodal temperature time histories near the middle sparupper welded site.

31
010151
1800
Temperature,°F
500 100Time from air launch, sec
Node 46Node 7
150
∆T = 546 °F
Bay 1 Bay 2
17001600150014001300120011001000900800700600500400300200100
0
1
41
2 3 4 5 6 7 8 9 10 11 12 13 14 15 16 17 18 19 20 21 22 23 24 25
7576777879
66676869
42 43 44 45 46 47 48 49 50 51 52 53 54 55 56 57 58 59 60 61 62 63 64 65
89
010152
Temperature,°F
1200
11001153
1000
900
800
700
600
500
0400
1 2 3 4Chord-wise distance, in.
Lower skin
Bay 1
Fore spar Middle spar
Bay 2
5 6 7 8
Upper skin
Aft spar
Figure 14. Nodal temperature time histories for node 7 of bay 1 upper skinand node 46 of bay 1 lower skin.
Figure 15. Chord-wise distributiuon of Hyper-X wing segment skintemperatures; t = 89 sec, 0.04 in. web contact.
32
37,63721,67217,506 6,288 6,524 21,230
25,525
16,73024,160
15,92838,56424,532
010153
Bay 1
Critical element
Bay 2
Flow directionUpper skin
Middle spar
Compression
Compression
Figure 16. Deformed shape of welded site with element shearstresses indicated, lb/in2; Mach 7.5 heating (nominal Mach 7mission).
33
010154
(Tu)cr = 167 °F
(a) SS-SS condition.
010155
(Tu)cr = 176 °F
(b) SS-CL condition.
010156
(Tu)cr = 355 °F
(c) CL-SS condition.
010157
(Tu)cr = 410 °F
(d) CL-CL condition.
Figure 17. Buckled shapes of fore panel under different fixed supportconditions, uniform temperature loading.

34
010159
(Tu)cr = 188 °F
010160
(Tu)cr = 175 °F
010161
(Tu)cr = 294 °F
(b) SS-CL condition.
(c) CL-SS condition.
(d) CL-CL condition.Figure 18. Buckled shapes of aft panel under different fixed supportconditions, uniform temperature loading.
010158
(Tu)cr = 121 °F
(a) SS-SS condition.

35
010162
(Tu)cr = 97 °F
010163
(Tu)cr = 239 °F
010164
(Tu)cr = 114 °F
010165
(Tu)cr = 295 °F
(a) SS-SS condition.
(b) SS-CL condition.
(c) CL-SS condition.
(d) CL-CL condition.
Figure 19. Buckled shapes of unit panel under different fixed supportconditions, uniform temperature loading.

36
010166
(Tu)cr = 389 °F
Figure 20. Buckled shape of wing segment under actual temperature loadingat t = 89 sec, fixed stiffeners.
010167
(Tu)cr = 1,324 °F
Figure 21. Buckled shape of wing segment under actual temperature loading att = 89 sec, free stiffeners.

37
010168
(To)cr = 132 °F
010169
(To)cr = 357 °F
010170
(To)cr = 147 °F
(a) SS-SS condition.
(b) SS-CL condition.
(c) CL-SS condition.
010171
(To)cr = 412 °F
(d) CL-CL condition.
Figure 22. Buckled shapes of unit panel under different fixed supportconditions, dome-shaped temperature loading, Ts/To = 0.54 .
38
010172
(To)cr = 1,389 °F
010173
(To)cr = 2,290 °F
010174
(To)cr = 1,411 °F
010175
(To)cr = 2,298 °F
(a) SS-SS condition.
(b) SS-CL condition.
(c) CL-SS condition.
(d) CL-CL condition.
Figure 23. Buckled shapes of unit panel under different free supportconditions, dome-shaped temperature loading, Ts/To = 0.54 .

39
010176
η
∞60
55
50
45
40
Simply supported free boundariesClamped free boundaries
35
30
25
20
15
10
5
0 .1 .2 .3 .4 .5 .6
0.54
Hyper-X
.7 .8 .9 1.0Ts/To
∞
010177
ξ
∞Simply supported free boundariesClamped free boundaries
0
1
.1 .2 .3 .4 .5 .6
0.54
Hyper-X
.7 .8 .9 1.0Ts/To
{
2
3
4
5
6
7
8
Figure 24. Plots of buckling temperature magnificationfactors of the first kind, , as functions of boundary heatsink temperature Ts/To .
η
Figure 25. Plots of buckling temperaturemagnification factors of the second kind, , asfunctions of boundary heat sink temperature Ts/To .
ξ

REPORT DOCUMENTATION PAGE Form ApprovedOMB No. 0704-0188
Public reporting burden for this collection of information is estimated to average 1 hour per response, including the time for reviewing instructions, searching existing data sources, gathering andmaintaining the data needed, and completing and reviewing the collection of information. Send comments regarding this burden estimate or any other aspect of this collection of information,including suggestions for reducing this burden, to Washington Headquarters Services, Directorate for Information Operations and Reports, 1215 Jefferson Davis Highway, Suite 1204, Arlington,VA 22202-4302, and to the Office of Management and Budget, Paperwork Reduction Project (0704-0188), Washington, DC 20503.
1. AGENCY USE ONLY (Leave blank) 2. REPORT DATE 3. REPORT TYPE AND DATES COVERED
4. TITLE AND SUBTITLE 5. FUNDING NUMBERS
6. AUTHOR(S)
8. PERFORMING ORGANIZATION REPORT NUMBER
7. PERFORMING ORGANIZATION NAME(S) AND ADDRESS(ES)
9. SPONSORING/MONITORING AGENCY NAME(S) AND ADDRESS(ES) 10. SPONSORING/MONITORING AGENCY REPORT NUMBER
11. SUPPLEMENTARY NOTES
12a. DISTRIBUTION/AVAILABILITY STATEMENT 12b. DISTRIBUTION CODE
13. ABSTRACT (Maximum 200 words)
14. SUBJECT TERMS 15. NUMBER OF PAGES
16. PRICE CODE
17. SECURITY CLASSIFICATION OF REPORT
18. SECURITY CLASSIFICATION OF THIS PAGE
19. SECURITY CLASSIFICATION OF ABSTRACT
20. LIMITATION OF ABSTRACT
NSN 7540-01-280-5500 Standard Form 298 (Rev. 2-89)Prescribed by ANSI Std. Z39-18298-102
Thermostructural Analysis of Unconventional Wing Structures of aHyper-X Hypersonic Flight Research Vehicle for the Mach 7 Mission
WU 710-55-24-E8-RR-00-000
William L. Ko and Leslie Gong
NASA Dryden Flight Research CenterP.O. Box 273Edwards, California 93523-0273
H-2453
National Aeronautics and Space AdministrationWashington, DC 20546-0001 NASA/TP-2001-210398
Heat transfer, thermal stresses, and thermal buckling analyses were performed on the unconventionalwing structures of a Hyper-X hypersonic flight research vehicle (designated as X-43) subjected tonominal Mach 7 aerodynamic heating. A wing midspan cross section was selected for the heat transferand thermal stress analyses. Thermal buckling analysis was performed on three regions of the wingskin (lower or upper); 1) a fore wing panel, 2) an aft wing panel, and 3) a unit panel at the middle ofthe aft wing panel. A fourth thermal buckling analysis was performed on a midspan wing segment. Theunit panel region is identified as the potential thermal buckling initiation zone. Therefore, thermalbuckling analysis of the Hyper-X wing panels could be reduced to the thermal buckling analysis of thatunit panel. “Buckling temperature magnification factors” were established. Structural temperature-time histories are presented. The results show that the concerns of shear failure at wing and spar weldedsites, and of thermal buckling of Hyper-X wing panels, may not arise under Mach 7 conditions.
Buckling temperature magnification factors, Hyper-X wing, Irregular panels,Non-uniform temperature loading, Thermal buckling
A03
43
Unclassified Unclassified Unclassified Unlimited
October 2001 Technical Publication
Unclassified—UnlimitedSubject Category 39
This report is available at http://www.dfrc.nasa.gov/DTRS/