Thermodynamics of High Temperature Materials Systems · Partial molal enthalpy ∆Hsoln. (O 2)...
61
Thermodynamics of High Temperature Thermodynamics of High Temperature Materials Systems Materials Systems Hans Hans Jürgen Jürgen Seifert Seifert Freiberg University of Mining and Freiberg University of Mining and Technology, Germany Technology, Germany Summer School Summer School Advanced Advanced Thermostructural Thermostructural Materials Materials Santa Barbara, August 9, 2006 Santa Barbara, August 9, 2006
Transcript of Thermodynamics of High Temperature Materials Systems · Partial molal enthalpy ∆Hsoln. (O 2)...
Thermodynamics of High Temperature Thermodynamics of High Temperature Materials SystemsMaterials Systems
Hans Hans JürgenJürgen SeifertSeifert
Freiberg University of Mining and Freiberg University of Mining and Technology, GermanyTechnology, Germany
Summer SchoolSummer SchoolAdvanced Advanced ThermostructuralThermostructural MaterialsMaterialsSanta Barbara, August 9, 2006Santa Barbara, August 9, 2006

Thermodynamics of High Temperature Materials System sThermodynamics of High Temperature Materials System s
Hans Hans JürgenJürgen SeifertSeifert
1. Introduction and motivation for thermodynamic calcul ations- Computational thermodynamics- CALPHAD approach (CALculation of PHAse Diagrams)- Thermodynamic databases and software
2. Thermodynamic optimization of the Ce-O system- Thermodynamic modeling of solution phases
3. Precursor-derived Si-(B-)C-N ceramics- High temperature reactions of silicon carbide and silicon nitride ceramics
- Crystallization and high temperature stability ofSi-(B-)C-N ceramics
OutlineOutline

Thermodynamics of High Temperature Materials System sThermodynamics of High Temperature Materials System s
Hans Hans JürgenJürgen SeifertSeifert
4. Computational thermodynamics in heat shieldengineering
- The Y-Si-C-O system database- Active / passive oxidation of SiC- Phase reactions of Yttrium silicates and C/C-SiCcomposites
- High temperature stability issues in the engineering of heat shields
5. Conclusions
OutlineOutline

ComputationalThermodynamics and
Modeling+
Experiments, Analysis
Fundamental Research
Materials Engineering,Processing
Combined Approach

Computational Thermodynamics
Ab-initioCalculation
TheoryQuantum Mechanics,
StatisticalThermodynamics
ExperimentsDTA, Calorimetry,
EMF, Knudsen Effusion ,Metallography ,
X-ray Diffractometry, ...
Modelswith adjustable
Parameters
Estimates
Adjustment ofParameters
Phase Diagrams
Equilibria
Storage inDatabases
GraphicalRepresentation
Application
Thermodyn. FunctionsG, H, S, Cp
Opt
imiz
atio
nE
quili
briu
mC
alcu
latio
ns
Kinetics
CALPHAD
CALculationof PHAse Diagrams

• Development of Optimized Thermodynamic Datasetsstored in Computer Databases
• Calculation of :- Thermodynamic Functions- Liquidus Surface- Isothermal Sections- Isopleths- Potential Phase Diagrams
CALPHAD (CALculation of PHAse Diagrams)
Requires Modeling of Stoichiometric and Solution PhasesTaking into Account the (Crystal-) Structures and Site Occupancies
- Phase Fraction Diagrams- Phase Compositions- Scheil Solidification…

• LUKAS (BINGSS, BINFKT, TERGSS, TERFKT)• THERMO-CALC• FACTSAGE• PANDAT• MALT, MALT2• MTDATA• JMATPRO• GEMINI• ...
CALPHAD (CALculation of PHAse Diagrams)Software

• SGTE, Scientific Group Thermodata Europe - SSOL2, SSOL4- SSUB3- Noble Metals
• Thermo-Calc: Steels, Ni-base, slags, ...• ThermoTech: Ni-base, Al-, Mg-, ...• PML: Al-, Ceramics• ...
CALPHAD (CALculation of PHAse Diagrams)Databases
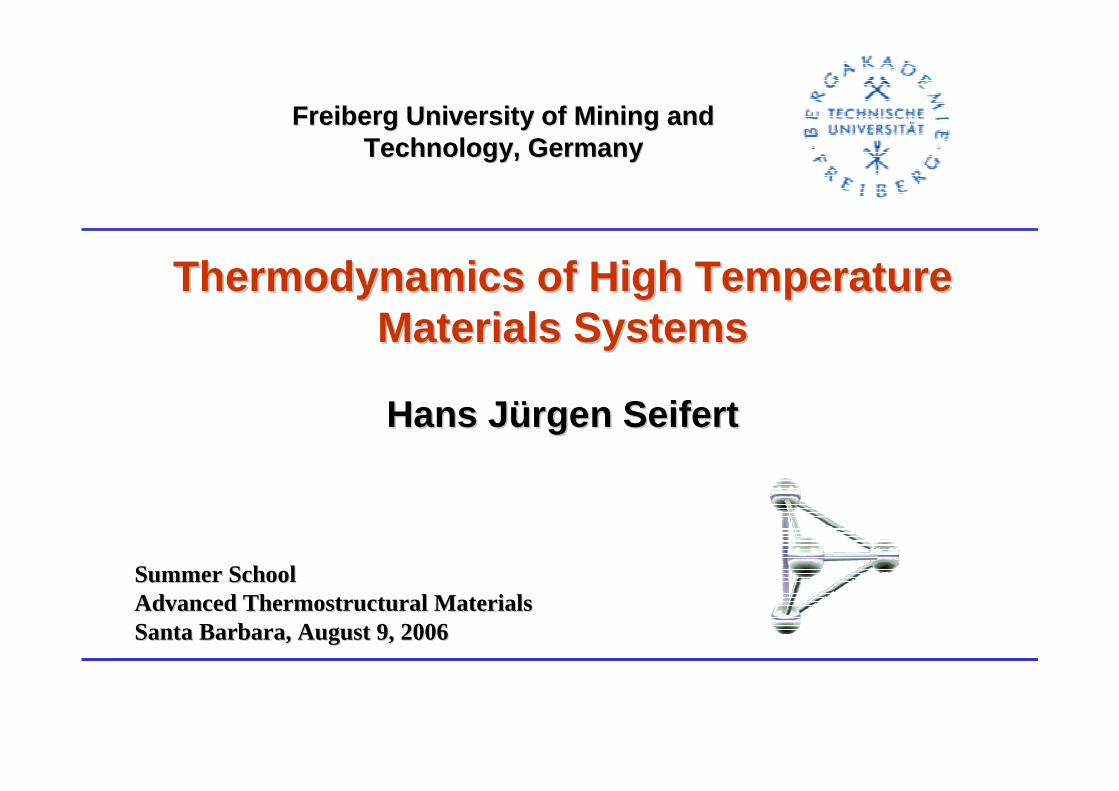
Calculated Ce–O System in Solid State from 60 to 67 mol. % Oin comparison with experimental data.

Phases in the Partial Ce – O System
Related Crystal Structures:
CeO2-x (ss) CaF2 - type (Strukturbericht C1)
Compound Energy Formalism:(Ce+3, Ce+4)1(O-2,Va)2
C-Ce2O3 (ss) Mn2O3 - type (Strukturbericht D53, Ordered State of C1)Unit Cell: composed of 8 CaF2-type cells. ¼ of O-ions removed, remaining atoms re-arrange towards these vacancies.Compound Energy Formalism:(Ce+3, Ce+4)2(O-2)3(O-2,Va)1
Contains more O atoms than the ideal formula of the Mn2O3.
Ce2O3 Stoichiometric phase description (Strukturbericht D52)

Four compounds defined:
A : DA : EB : DB : E
Gibbs free energy for every compound to be determined
“Compound Energy” Formalisms –Reference Compounds
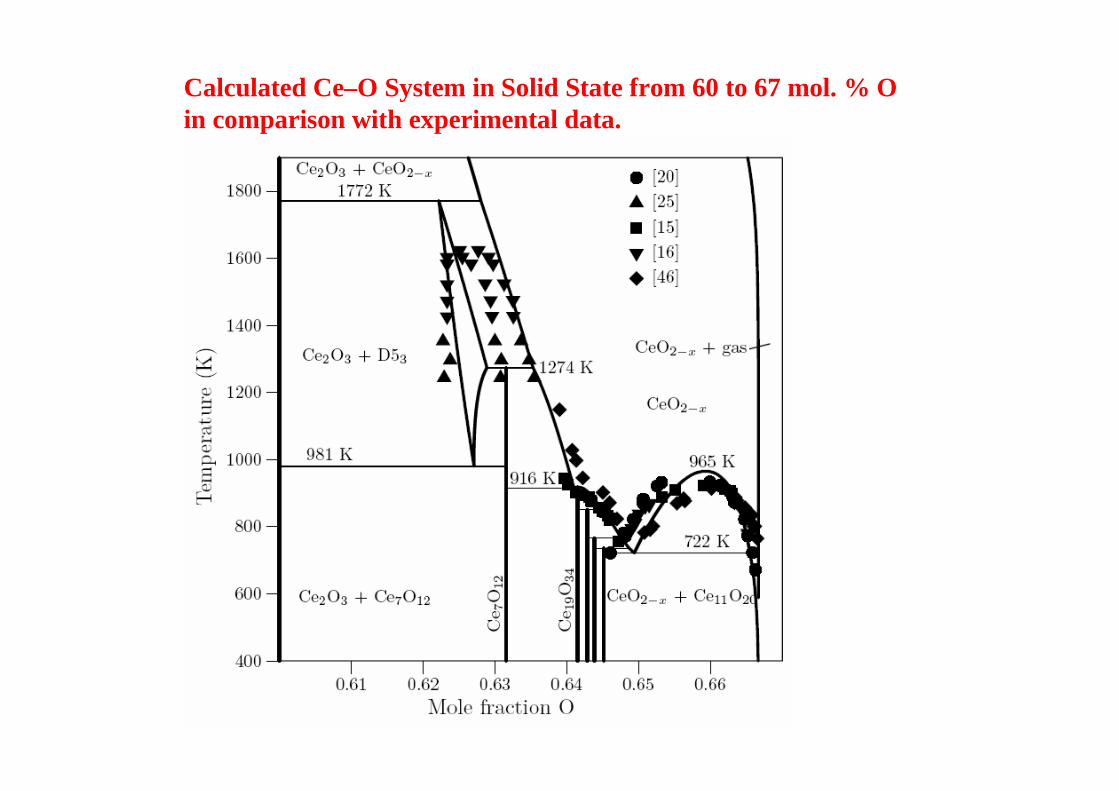
(A,B) k(D,E)lSolution phase with two sublattices and 4 species
Here:(Ce+3, Ce+4)1(O-2,Va)2
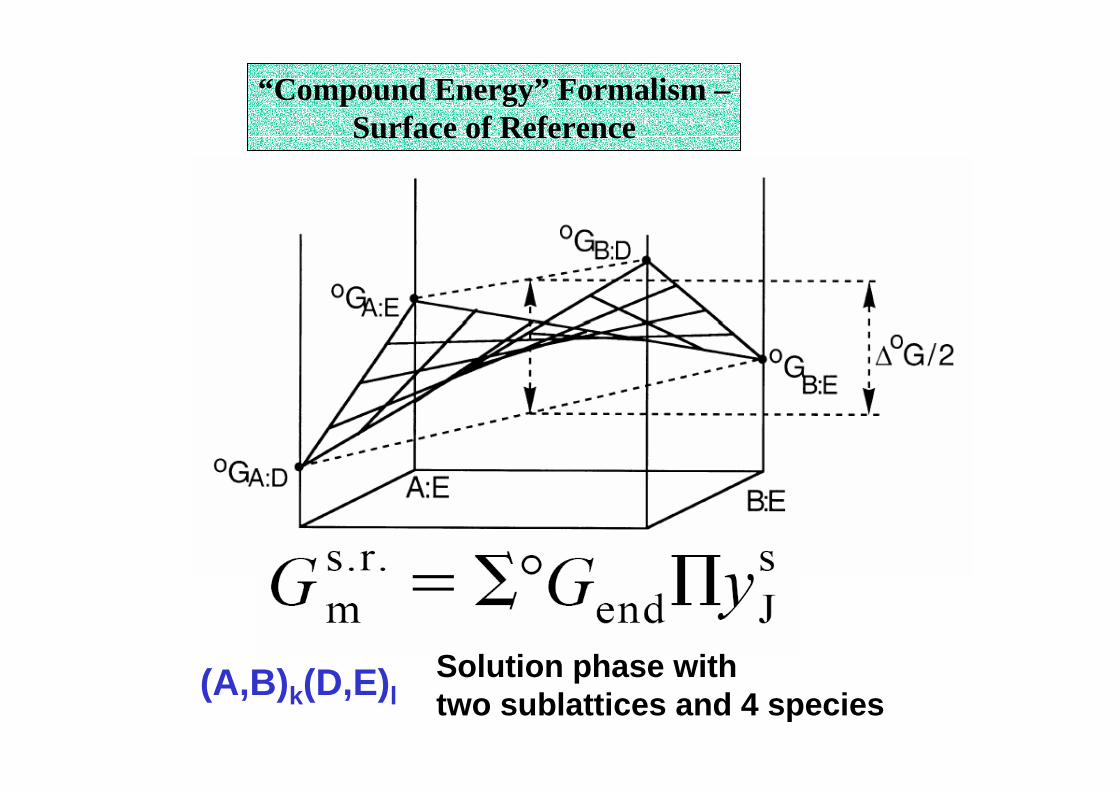
“Compound Energy” Formalism –Surface of Reference
(A,B) k(D,E)lSolution phase with two sublattices and 4 species

Stochiometric coefficient (s: sublattice)
(A,B) k(D,E)l
Modeling of solution phases; sublattice model described in the Compound Energy Formalism
Site fraction of spezies A onsublattice s
Solution phase with two sublattices and 4 species
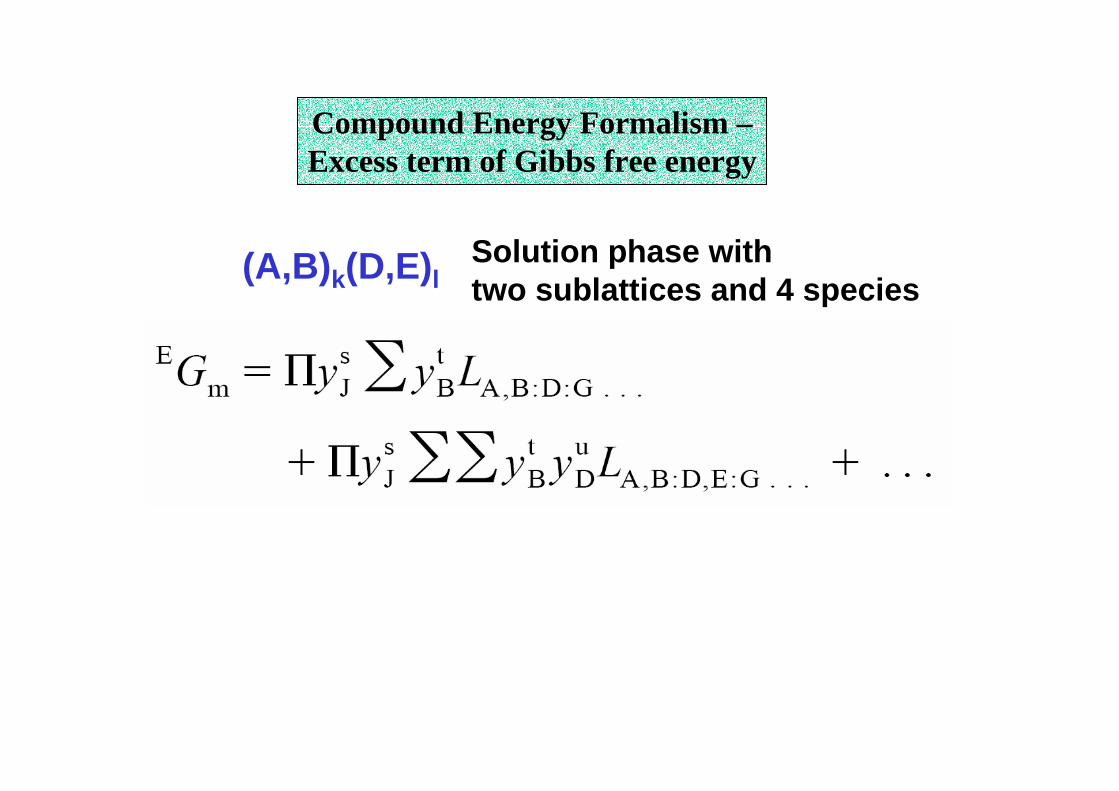
(A,B) k(D,E)l
Compound Energy Formalism –Excess term of Gibbs free energy
Solution phase with two sublattices and 4 species

Compound Energy Formalisms –Gibbs free energy of solution phases
Mixing Gibbs Energy

Phases in the Partial Ce – O System
CeO2-x (ss) CaF2 - type (Strukturbericht C1)
Compound Energy Formalism:(Ce+3, Ce+4)1(O-2,Va)2
Cubic close pack of Ce ions, where all the tetrahedral voids form the sublattice on which the 2-x O-ions are statistically distributed.Electroneutrality condition determines that site fractions on the two sublattices are not independent: Single variable y is equal 2·x.
)1('4 yyCe −=+
yyCe =+
'3
4'' y
yVa =
41''
2
yyO
−=−
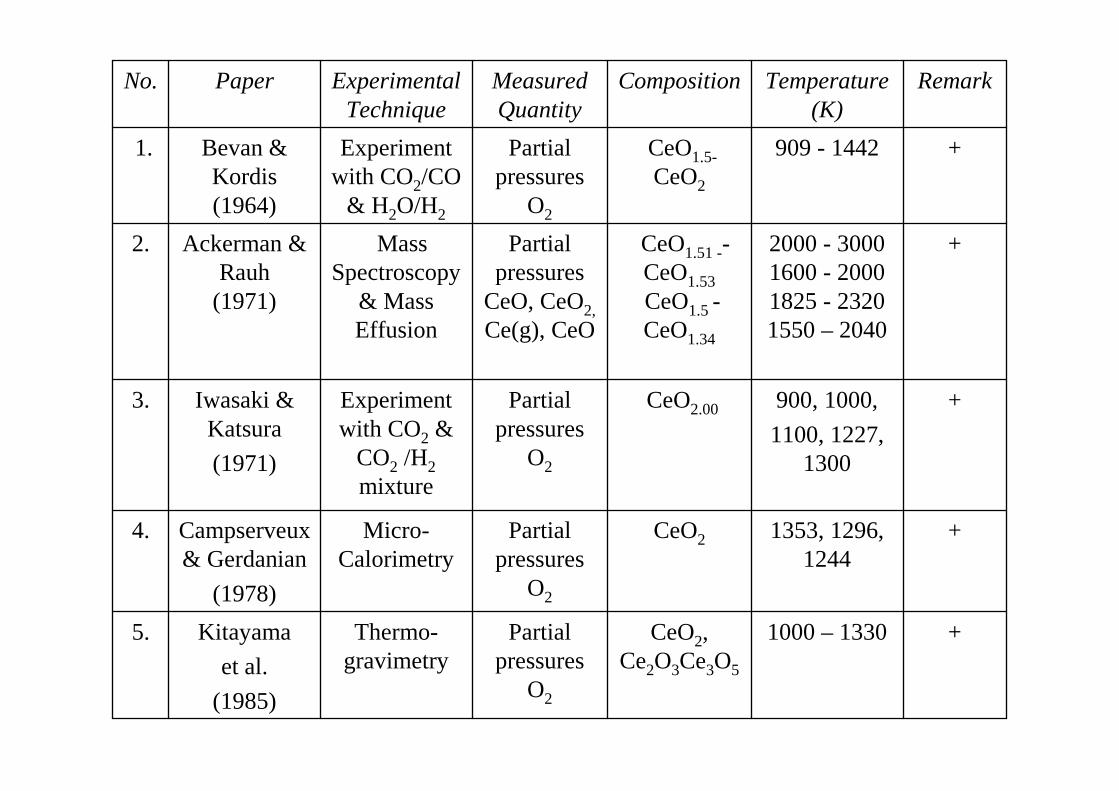
+1000 – 1330CeO2, Ce2O3Ce3O5
Partial pressures
O2
Thermo-gravimetry
Kitayama
et al.
(1985)
5.
+1353, 1296,1244
CeO2Partial pressures
O2
Micro-Calorimetry
Campserveux& Gerdanian
(1978)
4.
+900, 1000,
1100, 1227, 1300
CeO2.00Partial pressures
O2
Experiment with CO2 &
CO2 /H2 mixture
Iwasaki & Katsura
(1971)
3.
+2000 - 30001600 - 20001825 - 23201550 – 2040
CeO1.51 --CeO1.53CeO1.5 -CeO1.34
Partial pressures
CeO, CeO2,Ce(g), CeO
Mass Spectroscopy
& Mass Effusion
Ackerman & Rauh
(1971)
2.
+909 - 1442CeO1.5-CeO2
Partial pressures
O2
Experiment with CO2/CO
& H2O/H2
Bevan & Kordis(1964)
1.
RemarkTemperature(K)
CompositionMeasured Quantity
Experimental Technique
PaperNo.

+298Ce2O3.00∆H for Ce2O3Bomb calorimetry
Kuznetzov, et al. (1960)12.
-320-1200CeO1.72 –
CeO2
Specific heat,
∆H trans.
CalorimetryRicken et al. (1984)11.
+400-1000 Ce2O3Heat capacityPlane temperature
wave method
Basily & El-Sharkawy
(1979)10.
+5-350Ce2O3.02Heat capacityCryogenic Calorimetry
Justice & Westrum(1969)
9.
+5-300CeO2Heat capacity, Adiabatic
CalorimetryWestrum &
Beale Jr.(1961)
8.
-608-1172CeO2Heat capacity, CalorimetryKuznetzov& Rezukhina
(1960)7.
-1900-2150
1850-2050
CeO1.99, Ce2O2.96
Partial pressures,
CeO2, Ce2O3
Knudsen cell, Mass
spectrometry
Marushkin
et al. (2000)6.

+320-1200CeO1.79 –CeO2
Thermal expansion coefficient
DilatometryRiess, Koerner & Noelting
(1988)
17
+1023-1773CeO2-x∆W/WThermo-gravimetry
Panlener, Blementhal & Garnier(1975)
16.
+1353CeO1.5 –
CeO2
Partial molalenthalpy
∆Hsoln. (O2)
Micro
Calorimetry
Campserveux& Gerdanian
(1974)
15.
-298.15CeO2Heat of formation
CeO2, CeC1.5, CeC2
Bomb calorimetry
Baker, Huber, Holley & Krikorian
(1971)
14.
-298.15Ce2O3Heat of combustion
Ce2O3
Oxygen Bomb
Calorimetry
Baker & Holley
(1968)
13.

Calculated Ce–O System in Solid State from 60 to 67 mol. % Oin comparison with experimental data.
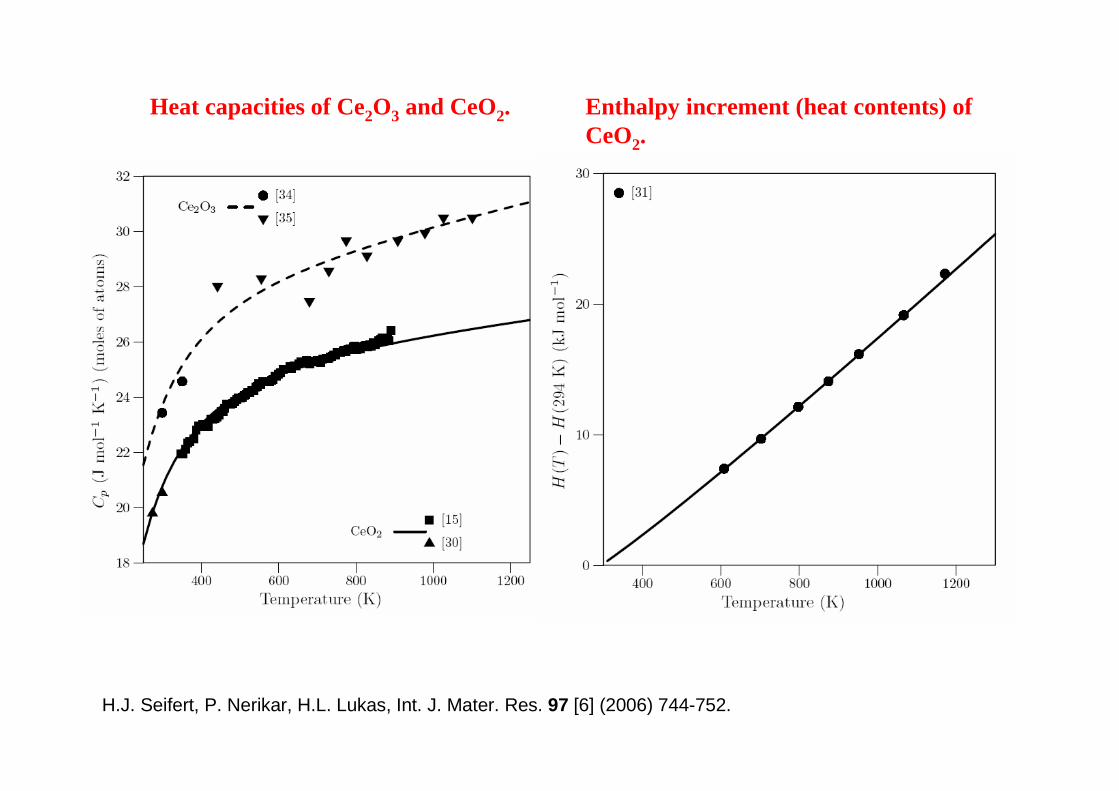
Heat capacities of Ce2O3 and CeO2. Enthalpy increment (heat contents) ofCeO2.
H.J. Seifert, P. Nerikar, H.L. Lukas, Int. J. Mater. Res. 97 [6] (2006) 744-752.
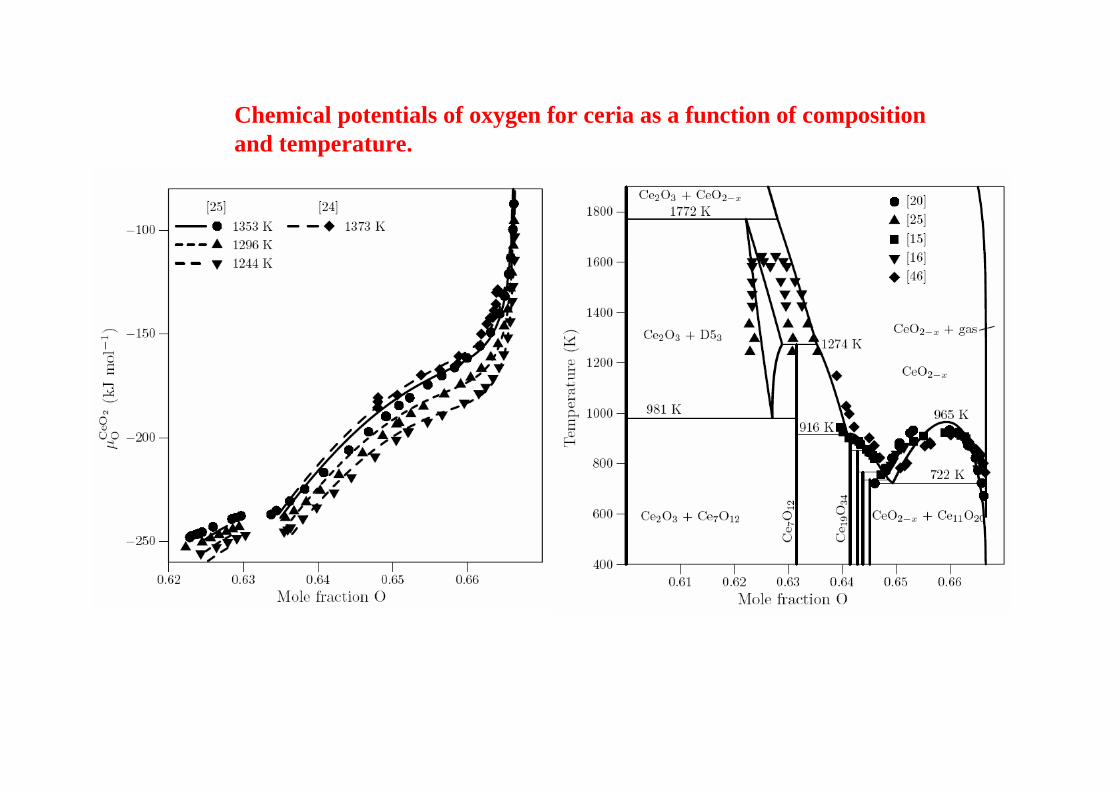
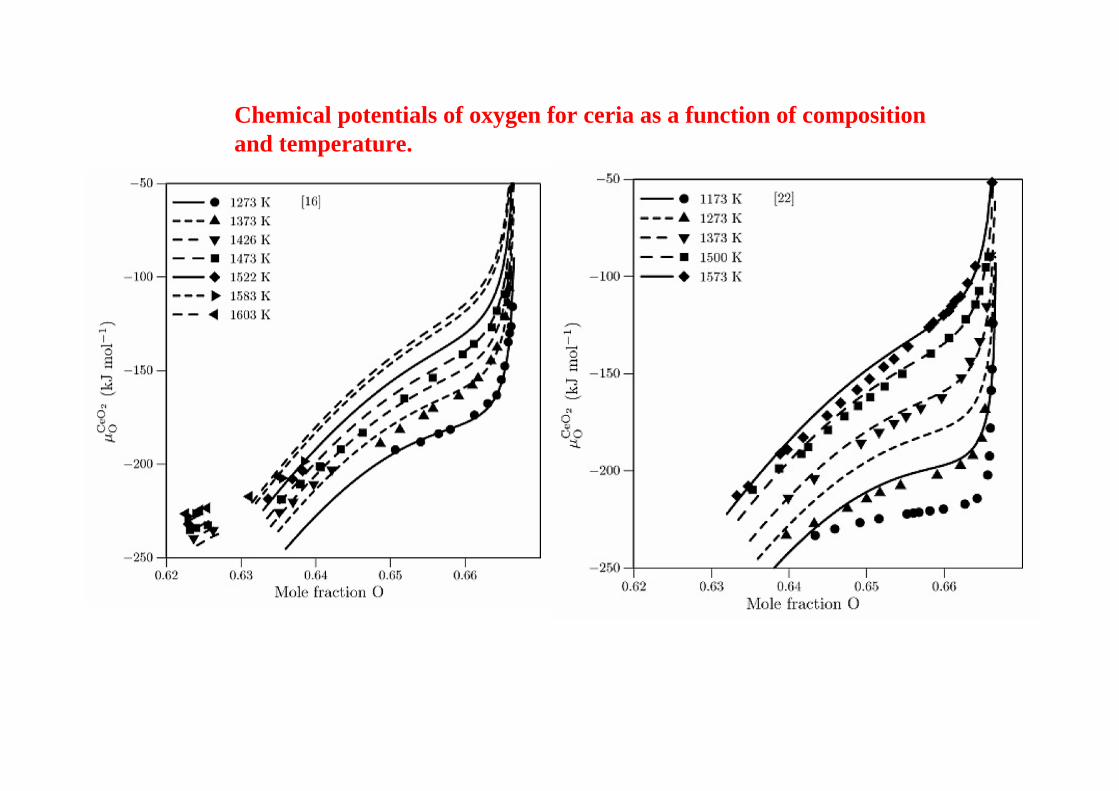
Chemical potentials of oxygen for ceria as a function of compositionand temperature.

Chemical potentials of oxygen for ceria as a function of compositionand temperature.

Chemical potentials of oxygen for ceria as a function of compositionand temperature.

Chemical potentials of oxygen for ceria as a function of compositionand temperature.
Chemical potentials of oxygen for ceria as a function of compositionand temperature.

Chemical potentials of oxygen in the two-phase areas.
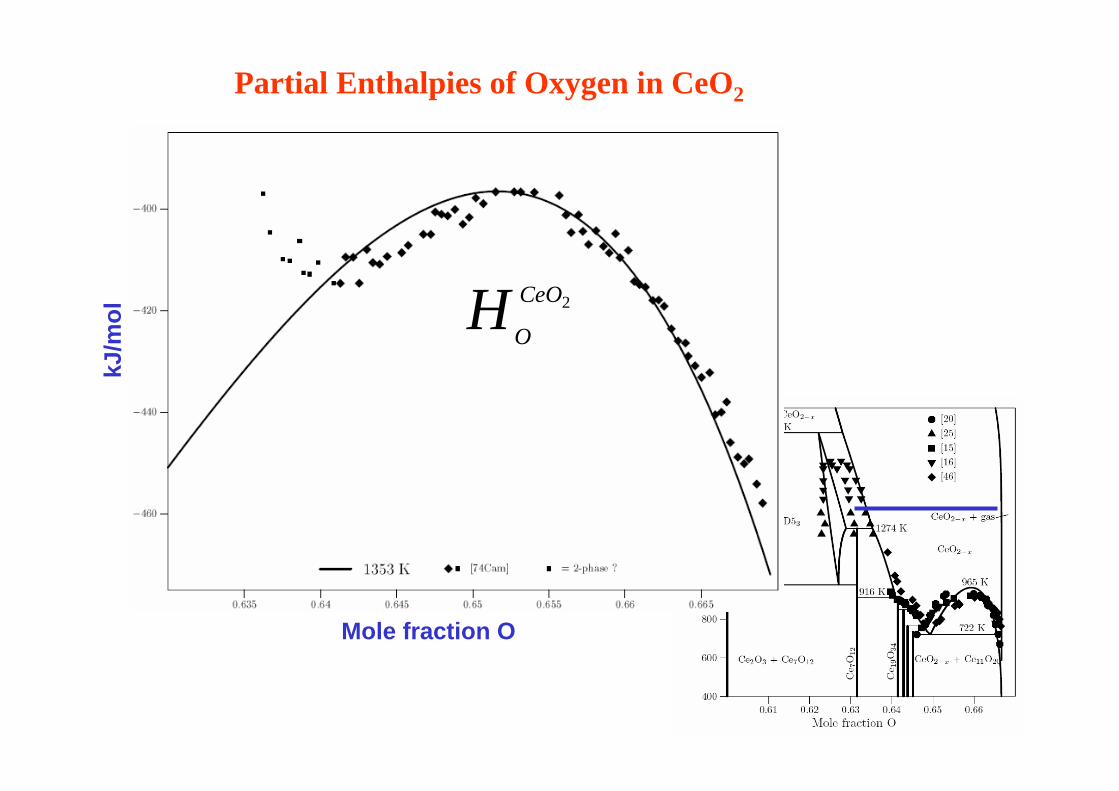
Partial Enthalpies of Oxygen in CeO2
Mole fraction O
kJ/m
ol
2CeO
OH 2CeO
OH

Thermodynamics of High Temperature Materials System sThermodynamics of High Temperature Materials System s
Hans Hans JürgenJürgen SeifertSeifert
1. Introduction and motivation for thermodynamic calcul ations- Computational thermodynamics- CALPHAD approach (CALculation of PHAse Diagrams)- Thermodynamic databases and software
2. Thermodynamic optimization of the Ce-O system- Thermodynamic modeling of solution phases
3. Precursor-derived Si-(B-)C-N ceramics- High temperature reactions of silicon carbide and silicon nitride ceramics
- Crystallization and high temperature stability ofSi-(B-)C-N ceramics
OutlineOutline

• Produced by thermolysis (1323 K, Ar) of polymer precursors
• Amorphous, purely homogeneous inorganic materials
Precursor-derived Si-B-C-N Ceramics
• NCP200: 40.1Si 23C 36.9N(at.%)- Starts to crystallize at 1700 K (N2)- Thermal stability up to 1800 K (N2)
• T2-1: 29.1Si 41.7C 19.4N 9.8B(at.%) - X-ray amorphous, nanocrystalline- Thermal stability up to 2300 K

Monomer Unit
Precursor Polymer
Preceramic Network
Amorphous Ceramic
Crystalline Ceramic
Synthesis
Crosslinking (200-400°C)
Thermolysis (1000-1400°C)
Crystallization ( > 1400°C)
Process for Precursor-derived Si-(B-)C-N Ceramics
Monomer
Polymer
Amorphous Solid
Polycrystalline CeramicNovel ceramics with high temperature stability and withgood resistance to oxidationcan be obtained frommolecular units withoutsintering aid.

Si-C binary subsystem
J. Gröbner, PhD thesis, 1994

Gas
Si(l) + Gas
2114 K
Gas + Si3N4
Si3N4 + Si(l)
Si3N4 + Si(s)
1687 K
Si3N4
Si(s)
Si(l)
Si-N binary subsystem


Isopleth from Carbon to Si3N4 in the Si-C-N System

Isothermal Section of the Ternary System Si-C-N
T = 3000 K(2727 °C)

N
C SiSiC
Si3N4
N
C SiSiC
Si3N4
N
C SiSiC
Isothermal Sections of the Ternary System Si-C-N
T < 1484°C(1757 K)
1484°C< T < 1841°C T > 1841°C(2114 K)
Si1N1.6C1.33 (VT50, Polyvinysilazane, Hoechst AG, Frankfurt, Germany)
Si1N0.6C1.02 (NCP200, Polyhydridomethylsilazane, Nichimen Corp., Tokyo, Japan)
Si3N4 + 3C = 3SiC +2N2(1)
Si3N4 = 3Si + 2N2
(2)
P = 1 bar

Si1N1.6C1.33 (VT50)
Calculated Phase Fraction Diagrams of Precursor Derived Ceramics
1484
°C
Si3N4 + 3C = 3SiC +2N2

-35
-30
-25
-20
-15
-10
-5
0
5
1000 1200 1400 1600 1800 2000
Temperature (°C)
Mas
s Lo
ss (
%)
Thermogravimetrical (TG) analysis of precursor-derived Si-C-N ceramics
VT50
NCP200

Ceramics:Si1N0.6C1.02
Calculated Phase Fraction Diagram of Precursor Derived Ceramics
1484
°C
1841
°C
NCP200, Polyhydridomethylsilazane (Nichimen Corp., Tokyo, Japan)
N
C SiSiC
Si3N4
Reaction Path
Phase Fraction Diagram

-35
-30
-25
-20
-15
-10
-5
0
5
1000 1200 1400 1600 1800 2000
Temperature (°C)
Mas
s Lo
ss (
%)
Thermogravimetrical (TG) analysis of precursor-derived Si-C-N ceramics
VT50
NCP200
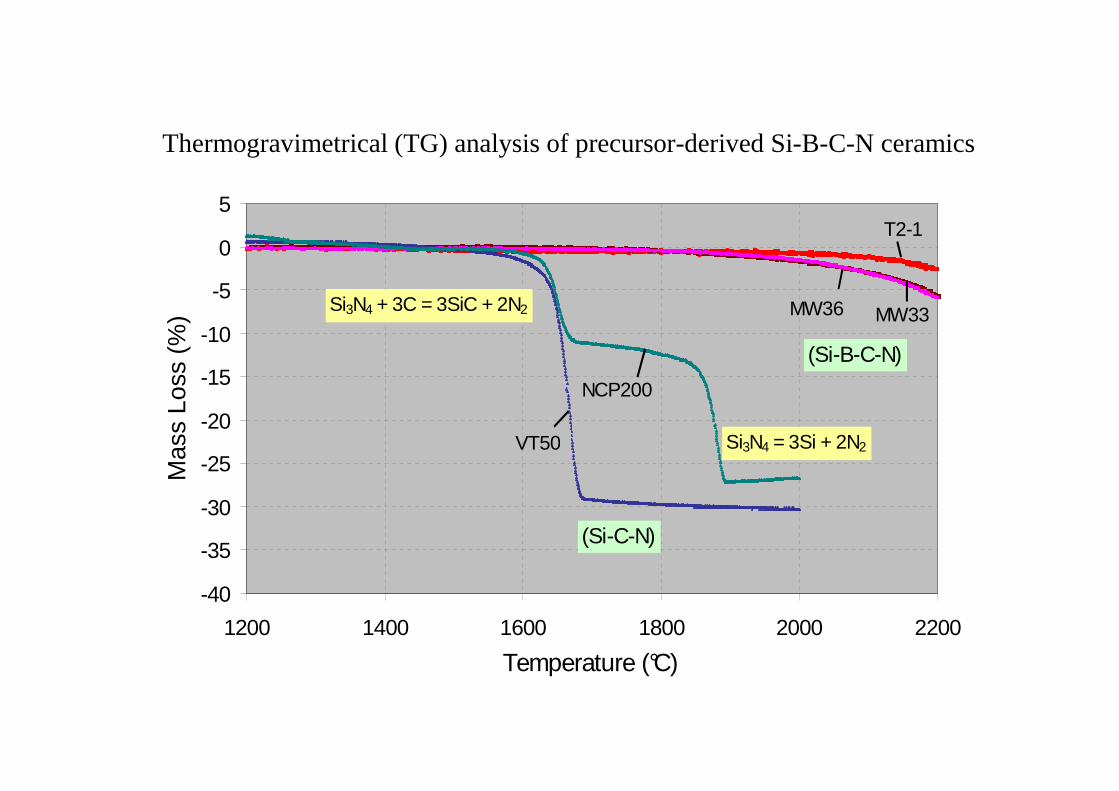
-40
-35
-30
-25
-20
-15
-10
-5
0
5
1200 1400 1600 1800 2000 2200
Temperature (°C)
Mas
s Lo
ss (
%) MW36
VT50
MW33
NCP200
T2-1
(Si-B-C-N)
Si3N4 + 3C = 3SiC + 2N2
Si3N4 = 3Si + 2N2
(Si-C-N)
Thermogravimetrical (TG) analysis of precursor-derived Si-B-C-N ceramics

Calculated Phase Fraction Diagram ofT2-1- Derived Ceramic Si3.0B1.0C4.3N2.0
1484
°C
Si3.0B1.0C4.3N2.0
( T2-1 precursor, PML,Max-Planck-Institut,Stuttgart, Germany )
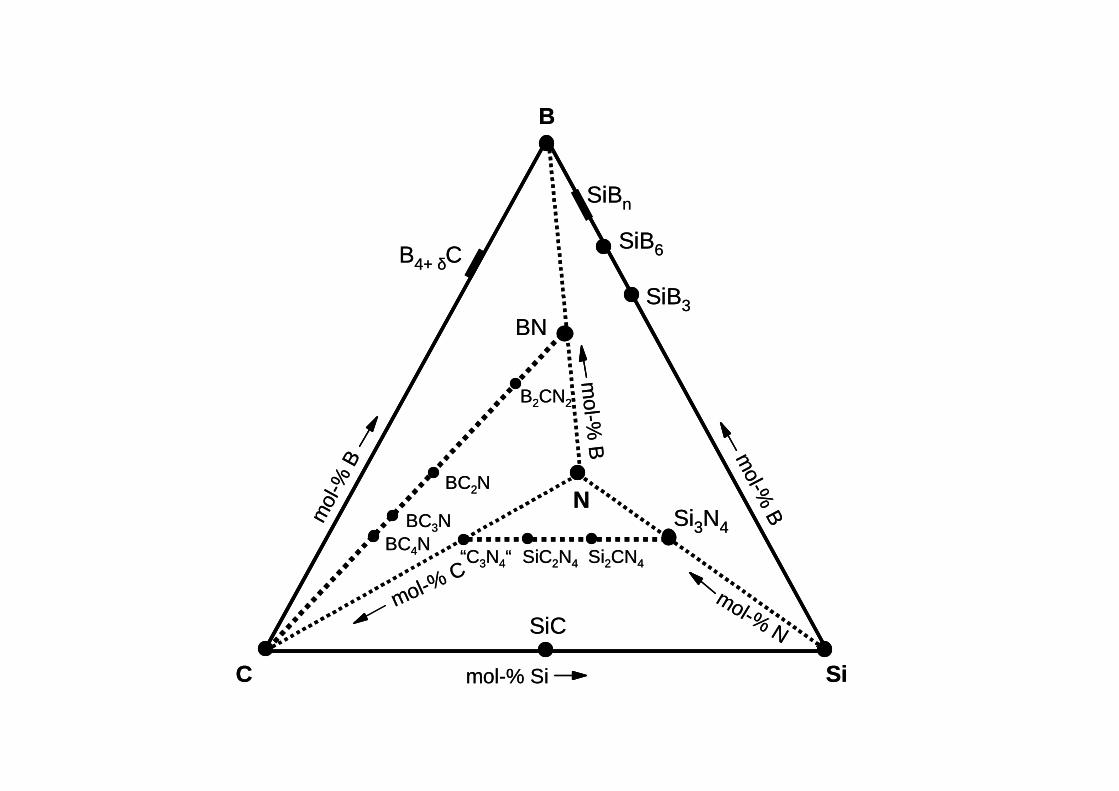
C Si
B
N
BN
B4+ δC
SiBn
SiB6
SiB3
Si3N4
SiC
mol-%
B mol-%
Bmol
-% B
mol-% Si
mol-% Nmol-%
C
B2CN2
BC2N
BC3NBC4N “C3N4“ SiC2N4 Si2CN4
C Si
B
N
BN
B4+ δC
SiBn
SiB6
SiB3
Si3N4
SiC
mol-%
B mol-%
Bmol
-% B
mol-% Si
mol-% Nmol-%
C
B2CN2
BC2N
BC3NBC4N “C3N4“ SiC2N4 Si2CN4

Isothermal Section at 1500 K in the Ternary System Si-B-C
T = 1500 K(1227 °C)

B4+δC
C
B
N
SiC
BN
Si3N4
SiBn
SiB6
SiB3
Si

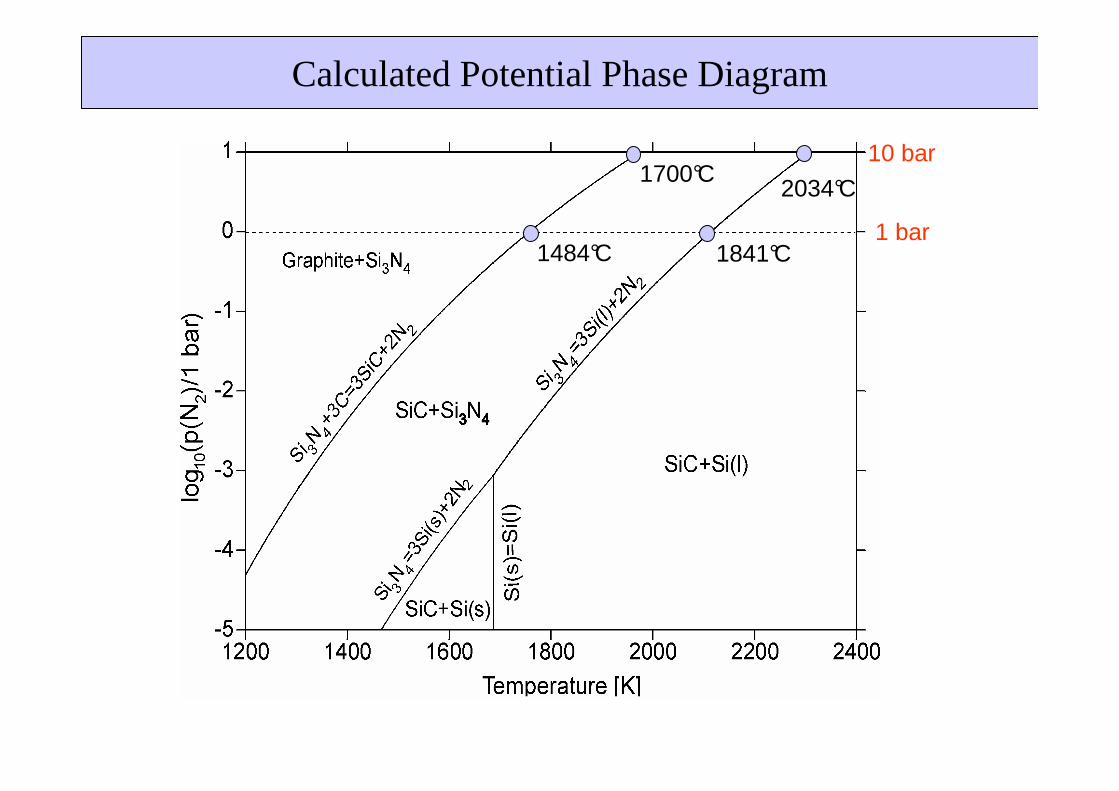
Calculated Potential Phase Diagram
1 bar
10 bar
Si3N4
Calculated Potential Phase Diagram
1 bar
10 bar
1484°C
1700°C
1841°C
2034°C

(2034°C)
(1700°C)
Carbon activity - temperature diagram
I0 bar pressure :
ac. = 1 1973 K (1700°C)
ac. = 0.17 2307 K (2034°)
Estimating a pressure of 10 bar and a carbon activity of 0.17, it can be concluded that the thermal stability of precursor-derived Si-B-C-N ceramics remains up to 2000°C.

SiC
N
B

Isopleth from B to Si1C1.6N1.33 (VT50) in the Si-B-C-N System
SiC
N
B

Isopleth from B0.1C0.65Si0.25 to B0.1N0.65Si0.25 in the Si-B-C-N System(at 10 mol-% B and 25 mol-% Si)
B0.1C0.65Si0.25 B0.1N0.65Si0.25
X (Si)
X (N
)

B - C - N B - C - Si B - C - N - Si C - N - Si B - N -Si
2722 u1
G + L = BN + B4C
2657 u2
G + L = C + B4C
2597 u3
G + B4C = C + BN G + B4C = L + C + BN 2597 U1
G + L = BN + SiC + C 2586 U2
L + C = SiC + B4C, BN 2568 U3L + C = B4C + SiC
u42568
2590 MG = L + SiC + BN
L + C = SiC, G 3095 d1
L, SiC, BN, B4C
G, L, SiC, BN
2311 L + B = B4C + SiBn, BN D1
2114 G + L = Si3N4 + SiC, BN D3
2123 L + SiBn=SiB6 + B4C, BN D2
2372 u5
2123 u7
L + SiBn=B4C + SiB6
2278 u6
L + B = B4C + SiBn
L + B4C = B + BN
L + C + BN + B4C
L, BN, B4C, SiB6
G, Si3N4, SiC, BN
L, Si3N4, SiC, BN
L, BN, B4C, SiBn
BN, B4C, SiB6, SiBn
G + L + C + BN
G, L, SiC, BN
SiC, C, BN, B4C
BN, B4C, SiBn, B
L, SiC, C, BN
G, SiC, C, BN
G + L = Si3N4 + SiCu8
L + B = SiBn, BN d22310
G + L = Si3N4, BN d4
L + SiBn = SiB6, BN d32123
21142114
1669
1687 D5
u10
d10
1757 D4G + SiC = C + Si3N4, BN
L = Si, Si3N4, BN, SiC
1757 u9G + SiC = C + Si3N4
1687 d5
L = Si, SiC, Si3N4
1687 d6
L = Si, Si3N4, BN
1669 D6L + SiC = B4C + Si, BN
1657 D7L = Si + SiB6,, BN, B4C
1471 D8Si + SiB6 = SiB3, B4C, BN
Si3N4, SiC, C, BN G, Si3N4, C, BN
Si3N4, SiC, BN, SiL, SiC, BN, Si
SiC, BN, Si, B4C L, BN, Si, B4C
BN, Si, B4C, SiB6
BN, Si, B4C, SiB3 BN, B4C, SiB3, SiB6
1657 d8
L = Si + SiB6, BN
L + SiC = B4C + Si
1657 d7L = Si + SiB6, B4C
1471 d9
Si + SiB6=SiB3, B4C1471
Si + SiB6 = SiB3, BN
2273 K
1873 K
1673 K
298 K

B
B4C
N
C Si
BN
SiC
SiBn
SiB6
LSi3N4
Si-B-C-N phase diagram at 1673 K with 4 of 9 4-phase equilibria

Si-B-C-N concentration tetrahedron with indicatedplane at a constant B content of 25 at.%
B
N
C SiSiC
Si3N4
B4+δC
BN
SiBn
SiB6SiB3
T = 1400°C (1673 K)

B4+δC
C
B
NT2-1
SiC
BN
Si3N4
SiBn
SiB
6 SiB3
Si
Si-B-C-N concentration tetrahedron with indicatedplane at a constant B content of 10 at.%
Si3.0B1.0C4.3N2.0
( T2-1 precursor, PML,Max-Planck-Institut,Stuttgart, Germany )

Isothermal Section at 10 mol-% B in the Si-B-C-N System
T = 1400°C(1673 K)
B4+δC
C
B
N
T2-1
SiC
BN
Si3N4
SiBn
SiB6
Si

T = 1873 K(1600 °C)
Isothermal Sections at 10 mol-% B in the Si-B-C-N System
T = 1673 K(1400°C)
B
C Si
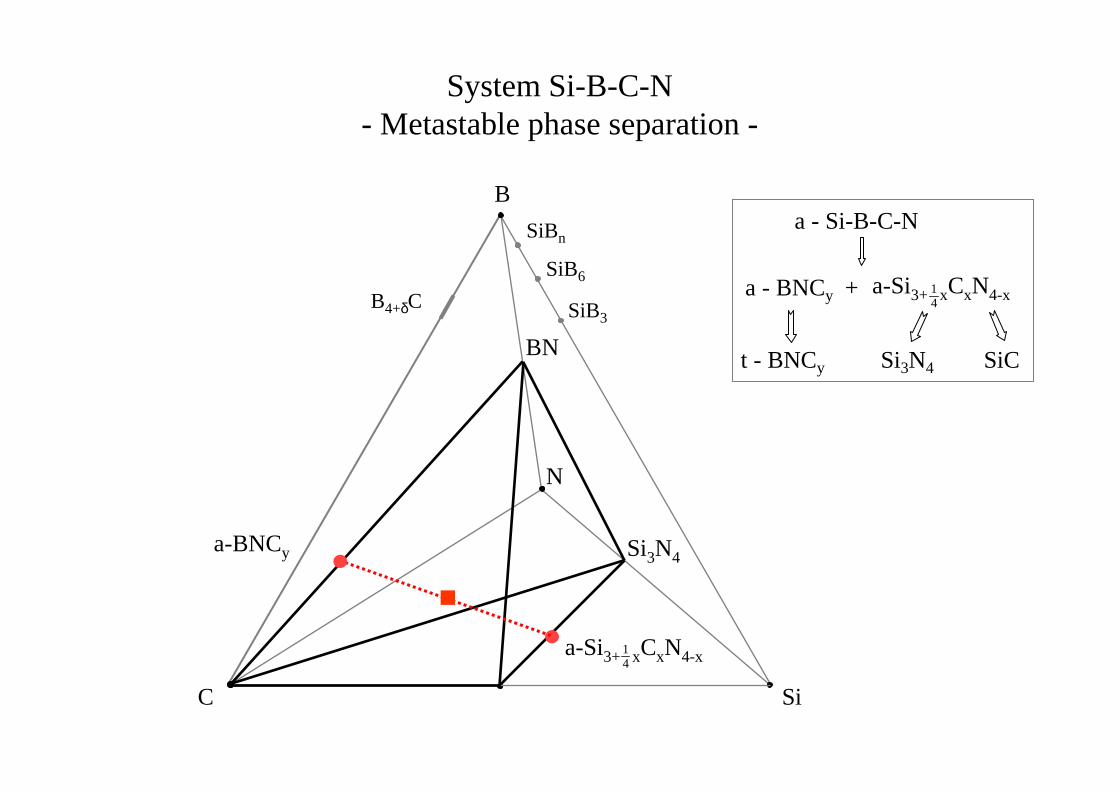
a-BNCy
a-Si3+ xCxN4-x41
N
Si3N4
B4+δC
BN
SiBn
SiB6
SiB3
a - Si-B-C-N
a - BNCy +
t - BNCy Si3N4 SiC
41
System Si-B-C-N- Metastable phase separation -
a-Si3+ xCxN4-x

B
N
C SiSiC
Si3N4
B4+δC
BN
SiBn
SiB6
SiB3
stable
not stable
a - Si-B-C-N
a - Cy(BN) +
t - BNCy Si3N4 SiC
T2-1
a-BNCy
a-Si3+ xCxN4-x41
a-Si3+ xCxN4-x41