Thermodynamic Modeling of the SRS ... - UNT Digital Library
68
WSRC-TR-2001-00155 THERMODYNAMIC MODELING OF THE SRS EVAPORATORS: PART II. THE 3H SYSTEM (U) C. M. Jantzen and J. E. Laurinat August 20, 2001 TTP #: SR-1-9-WT-31, Subtask A.2-2 Approved by: W.L. Tamosaitis, Research Manager Waste Processing Technology
Transcript of Thermodynamic Modeling of the SRS ... - UNT Digital Library
WSRC-TR-2001-00155
THERMODYNAMIC MODELING OF THE SRSEVAPORATORS: PART II. THE 3H SYSTEM (U)
C. M. Jantzen and J. E. Laurinat
August 20, 2001
TTP #: SR-1-9-WT-31, Subtask A.2-2
Approved by:
W.L. Tamosaitis, Research ManagerWaste Processing Technology

This document was prepared in conjunction with work accomplished under Contract No. DE-AC09-96SR18500 with the U.S. Department of Energy
DISCLAIMER
This report was prepared as an account of work sponsored by an agency of the UnitedStates Government. Neither the United States Government nor any agency thereof, norany of their employees, makes any warranty, express or implied, or assumes any legalliability or responsibility for the accuracy, completeness, or usefulness of anyinformation, apparatus, product or process disclosed, or represents that its use would notinfringe privately owned rights. Reference herein to any specific commercial product,process or service by trade name, trademark, manufacturer, or otherwise does notnecessarily constitute or imply its endorsement, recommendation, or favoring by theUnited States Government or any agency thereof. The views and opinions of authorsexpressed herein do not necessarily state or reflect those of the United States Governmentor any agency thereof.
This report has been reproduced directly from the best available copy.
Available for sale to the public, in paper, from U.S. Department of Commerce, NationalTechnical Information Service, 5285 Port Royal Road, Springfield, VA 22161phone: (800) 553-6847fax: (703) 605-6900email: [email protected] ordering: http://www.ntis.gov/support/index.html
Available electronically at http://www.doe.gov/bridge
Available for processing fee to U.S. Department of Energy and its contractors, in paper,from: U.S. Department of Energy, Office of Scientific and Technical Information, P.O.Box 62, Oak Ridge, TN 37831-0062, phone: (865) 576-8401, fax: (865) 576-5728, email:[email protected]
WSRC-TR-2001-00155
iii
WSRC-TR-2001-00155
Distribution Category: UnlimitedKeywords: Evaporator, activity diagrams,
zeoliteRetention: Permanent
THERMODYNAMIC MODELING OF THE SRSEVAPORATORS: PART II. THE 3H SYSTEM (U)
C. M. Jantzen and J. E. Laurinat
Publication Date: August 20, 2001
TTP #: SR-1-9-WT-31, Subtask A2.2
Approved by:
W.L. Tamosaitis, Research ManagerWaste Processing Technology
Westinghouse Savannah River CompanySavannah River SiteAiken, SC 29808
PREPARED FOR THE U.S. DEPARTMENT OF ENERGY UNDER CONTRACT NO. DE-AC09-96SR18500


WSRC-TR-2001-00155
vi
EXECUTIVE SUMMARY
Accumulations of two solid phases (a nitrated aluminosilicate, known as nitrated cancriniteand/or nitrated sodalite depending on the number of attached water molecules,Na8Al6Si6O24(NO3)2•4H2O, and sodium diuranate, Na2U2O7) have been forming in theSavannah River Site (SRS) 2H Evaporator system since late 1996. The aluminosilicatescale deposits caused the SRS 2H Evaporator pot to become completely inoperable inOctober 1999. Accumulation of the sodium diuranate phase, which appears to havesimultaneously precipitated with the aluminosilicate phase, has caused criticality concernsin the 2H Evaporator. In order to ensure that similar deposits are not forming in the SRS3H Evaporator, thermodynamically derived activity diagrams specific to the feedsprocessed from the 3H Evaporator feed tank (Tank 32) were evaluated.
Reactive oxides, soluble silicates, and soluble aluminates in a caustic solution can combineto form a sodium aluminosilicate (NAS) hydrogel at ambient temperature when thesolution stoichiometry of the constituent aluminate and silicate species is ~1:1. Thehydrogel converts to Zeolite-A ( OH27OSiAlNa 248121212 • ) under hydrothermal conditions
at elevated temperature such as the conditions existing in the SRS evaporators. It has beenshown that the nitrated-cancrinite/sodalite forming in the SRS 2H Evaporator forms fromZeolite-A. Zeolite-A and hydroxysodalite (Na8[Al6Si6O24](OH)2•1.5H2O) formation froma gel phase has also been observed in evaporators used in the wood pulp industry andZeolite-A→sodalite→cancrinite ((Na7.6Al6Si6O24(CO3)1.6•2.1H2O) formation have beenobserved in the Bayer aluminum fabrication process.
The sequential transformations of NAS gel→Zeolite-A (cubic)→sodalite(cubic)→cancrinite (hexagonal) are densification (aging) transformations that require the saturationof the evaporator and/or tank solutions with respect to the parent NAS gel phase.Modeling the potential to form the NAS gel phase in the feed or drop tanks and/or in theevaporator has been chosen because this phase is the primary phase from which all theothers are derived and it is kinetically most rapid step in the formation sequence[aluminosilicate species in solution]→NAS gel→Zeolite-A→sodalite→cancrinite.Modeling the denser phases, which are less soluble than the NAS gel, could unnecessarilyconstrict the solution chemistry range of the SRS evaporators.
The current SRS 3H Evaporator pot has been in operation since May 2000. The 3HEvaporator feed tank is Tank 32 and the drop tank is Tank 30. Tank 32 has receivedmultiple recycles of supernate from the drop tank (Tank 30) on a 4-6 week frequency.Typically during a recycle transfer from Tank 30 to Tank 32, the evaporator continuesbeing fed. Tank 32 also received a transfer from Tank 40 of Extended Sludge Processing(ESP) Washwater in December 2000. Tank 32, the feed tank, has about 48” of sludge atthe bottom. The transfer pump to the evaporator is located at a height of 89” from thebottom of the tank. Tank 30, the drop tank, reportedly has no sludge at the bottom. Tank30 had a transfer jet that was located 4” above the bottom of the tank during the timeperiod that this study covers.† The 3H Evaporator has been operating at 135-140°C since † In the spring of this year, the fixed length transfer jet was replaced with a telescoping transfer jet (TTJ)which is currently positioned 150” from the tank bottom.
WSRC-TR-2001-00155
vii
May 2000. Tanks 32 and 30 have been at a nominal temperature of ~40°C until a fewmonths ago when cooling coil difficulties caused the temperature in Tanks 30 and 32 tobecome elevated.
The historical chemical data for the feed tank (Tank 32) had been taken at various timesbetween November 1992 and February 2001 and at various depths. The chemistry of thevariable depth samples (VDS) indicates chemical zones exist within the tank at differentdepths. Three depth populations were defined:
• Surface dip sample analyses (surface to 120” from the tank bottom)
• Variable Depth Sample (VDS) analyses (70 to 120” from the tank bottom,e.g. 30” above the feed pump and 20” below the feed pump)
• “Zone of Turbidity” (ZOT) analyses (>48” to <70” from the tank bottom, e.g.the surface of the sludge to the next available chemical analysis)
Turbidity in the ZOT is caused by the following:
• turbulent eddies of sludge stirred up when recycle transfers are injected belowthe sludge surface every 4-6 weeks
• influence from feed pump turbulence ~20” above
• hydrophobic silica rich sol accumulation layer, e.g. a layer which will not settlebecause silica sols are hydrophobic and repel each other
Feed from the ZOT cannot be pumped into the evaporator since the feed pump is >20”above the upper boundary of the ZOT. Therefore, no modeling was performed onsamples from the ZOT.
The historical chemical data for the drop tank (Tank 30) had been taken at various timesbetween November 1992 and February 2001 and at various depths. There is a salt layer inTank 30 at a height of 8”. The chemical analysis for a sample taken at 8” above the tankfloor was, therefore, not modeled. Otherwise, the Tank 30 supernate chemistry appearedhomogeneous and the delineation of depth populations was not necessary for modeling.
Activity diagrams were generated at 25°C (the temperature at which the tank solutionswere analyzed), at 40°C (the temperature of the feed and drop tanks), and at 140°C (theevaporator temperature) with and without a simulated evaporation of 40%. Theconclusions of this study are:
• The SRS 3H Evaporator is not precipitating sodium aluminosilicates (NAS)based on the last available accurate data for the SRS 3H Evaporator feed tank(September 2000) and drop tank (December 2000)
WSRC-TR-2001-00155
viii
• The SRS 3H Evaporator feed tank is not in the stability field of sodiumaluminosilicate (NAS) formation above the ZOT
• The SRS 3H Evaporator feed tank chemistry is closer to the NAS precipitationboundary than they were in 1992 based on historic data
• Routine analytic samples, if used for modeling the potential for NASformation, should be taken at the height of the feed pump in order to berepresentative of the feed entering the evaporator
• Analytic samples should not be taken close to the sludge layer or within theZOT
• Analytic samples should not be taken within 5-6 hours of tank recycles or tanktransfers if subsurface injection of waste under the sludge layer is continued
• Frequent recycles from Tank 30 to Tank 32 beneath the sludge layer arestirring and/or agitating the feed tank contents adding extra silica and iron tothe feed tank supernates if not allowed to settle out
• The SRS 3H Evaporator drop tank may have silica sol deposits and/or sludgeat or near the level of the transfer jet since higher levels of silica (4X), Fe andMn are present in the “salt” layer (~8”) in Tank 30 compared to the remainingsupernate in Tank 30‡
• Continued recycle and transfers from the bottom of the drop tank (Tank 30)could cause sodium aluminosilicates to supersaturate
• More accurate Si analyses are needed for modeling
The following recommendations from this study should be implemented as soon asfeasible:
• Take routine analytic samples from the height of the feed pump
• Keep the feed pump a minimum of 40” above the sludge layer and aminimum of ~20” above the ZOT
• Minimize the depth of the ZOT- inject recycle and/or transfers above the sludge layer in Tank 32 and not
subsurface to minimize agitation and maximize settling of suspendedsolids and any silica rich sols
- allow the feed tank contents to settle for 5-6 hours after a transfer beforefeeding to the 3H Evaporator
‡ Tank 30 received one small sludge transfer in September 1986 according to tank farm records.
WSRC-TR-2001-00155
ix
• Move the transfer jet in Tank 30 to a higher position to avoid the region of“salt” which may be mixed with sludge and/or silica sols rather than recyclingthis material back to the feed tank and possibly the evaporator‡*
• Implement a more accurate Si measurement technique in F-Area laboratoryimmediately
It is desirable that the following recommendation be considered as a longer term strategy:
• Eliminate recycle directly from Tank 30 to the feed tank (Tank 32): use Tanks39 and/or Tank 35 as settling tanks so that NAS supersaturation andaccumulation of silica sol deposits is not of concern
TABLE OF CONTENTS
1.0 INTRODUCTION......................................................................................................1
2.0 BACKGROUND.........................................................................................................2 ‡* In Spring, 2001 the transfer jet was moved to a height of 150”

WSRC-TR-2001-00155
x
2.1 Operation of the SRS 2H Evaporator .....................................................................22.2 Thermodynamic Activity Diagrams.......................................................................32.3 Zeolite, Sodalite, and Cancrinite Nomenclature and Paragenesis............................52.4 The Role of Uranium in the Evaporator Deposits...................................................10
3.0 OPERATION OF THE SRS 3H EVAPORATOR ......................................................11
4.0 ANALYTIC DATA AVAILABLE FOR SRS 3H EVAPORATOR MODELING.......114.1 Availability of Analytic Data.................................................................................114.2 Consistency of Analytic Data................................................................................124.3 Quality of Analytic Data.......................................................................................134.4 Analytic Data Populations .....................................................................................15
4.4.1 Tank 32H (Feed Tank).................................................................................154.4.2 Tank 30H (Drop Tank) .................................................................................24
5.0 MODELING APPROACH..........................................................................................24
6.0 ACTIVITY DIAGRAMS FOR THE SRS 3H EVAPORATOR...................................286.1 Activity Diagrams at the Solution Measurement Temperature ..............................286.2 Activity Diagrams at the Tank Temperature .........................................................356.3 Activity Diagrams at the Evaporator Temperature ................................................376.4 Activity Diagrams at the Evaporator Temperature With SimulatedEvaporation .................................................................................................................39
7.0 POTENTIAL FOR DEPOSITION IN THE SRS 3H EVAPORATOR .......................40
8.0 CONCLUSIONS........................................................................................................49
9.0 RECOMMENDATIONS.............................................................................................50
10.0 ACKNOWLEDGEMENTS.......................................................................................51
11.0 REFERENCES.................................................................................................... .....52
WSRC-TR-2001-00155
xi
LIST OF FIGURES
Figure 1. Part of the aluminosilicate framework in the structure of sodalite. 6
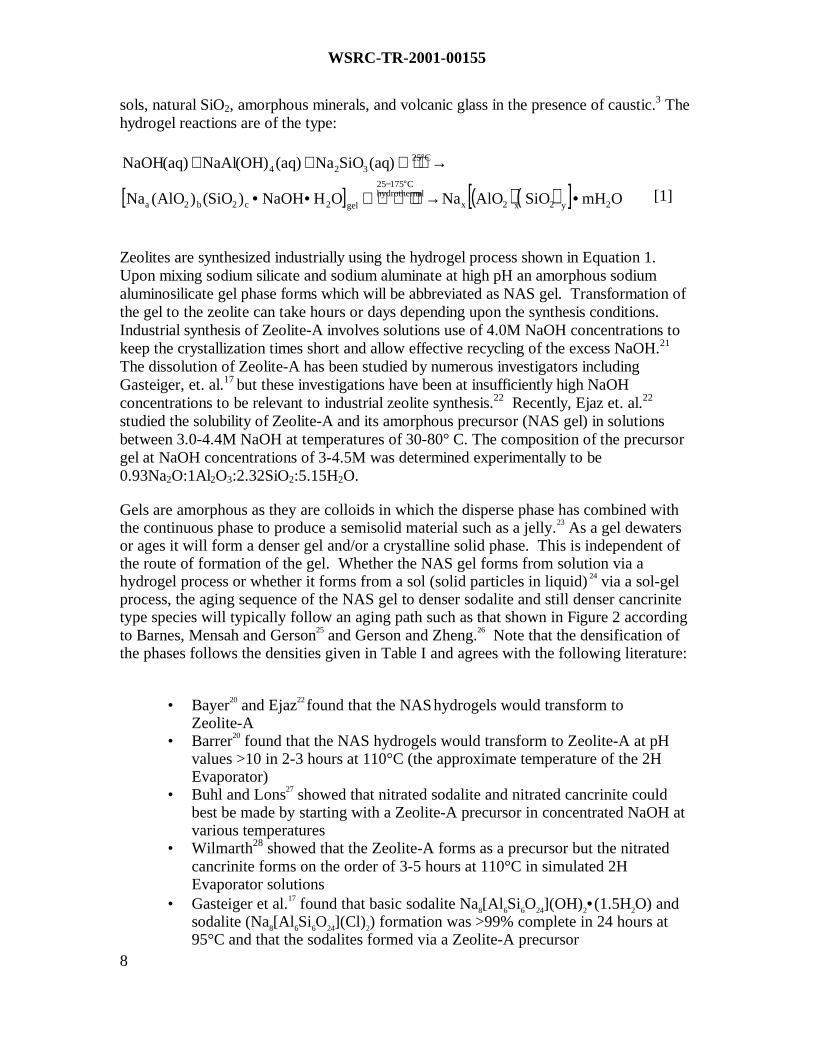
Figure 2. Typical aging (densification) sequence of NAS gel→Zeolite-A→ sodalite→ cancrinite phases. 9
Figure 3. Schematic of the SRS 3H Evaporator, the feed tank (Tank 32) and thedrop tank (Tank 30). 14
Figure 4. Delineation of depth populations in the SRS 3H Evaporator Feed Tank. 16
Figure 5. Pictorial diagram showing the differences between a sol, gel, andprecipitate. 18
Figure 6. Relative Stability Boundaries of NAS gel, “mixed zeolite,” Zeolite-Aand hydroxysodalite. 27
Figure 7. Activity diagram for Tank 32 dip samples at 25°C. 30
Figure 8. Activity diagrams for Tank 32 dip samples at 25°C and 140°C. 31
Figure 9 Activity diagram for Tank 32 dip samples at 25°C before and afterrecycle from Tank 30. 32
Figure 10. Activity diagram for Tank 32 variable depth samples at 25°C before andafter recycle from Tank 30. 33
Figure 11. Activity diagram for Tank 30 samples (all depths) at 25°C. 34
Figure 12. Activity diagram for dip sample (surface sample) compositions in Tank32 (feed tank) at 40°C. 35
Figure 13. Activity diagram for variable depth sample compositions in Tank 32(feed tank) at 40°C. 36
Figure 14. Activity diagram for Tank 30 samples (all depths) at 40°C. 37
Figure 15. Activity diagram for dip sample (surface sample) compositions in Tank32 (feed tank) at 140°C (no simulated evaporation). 41
Figure 16. Activity diagram for Tank 32 variable depth samples at 140°C before andafter recycle from Tank 30 (no simulated evaporation) with Fe(OH)3
formation suppressed. 43
WSRC-TR-2001-00155
xii
Figure 17. Activity diagram for Tank 30 samples (all depths) at 140°C (no simulatedevaporation) with the formation of Fe(OH)3 suppressed. 44
Figure 18. Activity diagram for dip sample (surface sample) compositions in Tank32 (feed tank) at 140°C (with 40% simulated evaporation) with theformation of Fe(OH)3 suppressed. 45
Figure 19. Activity diagram for Tank 32 variable depth samples at 140°C before andafter recycle from Tank 30 (with 40% simulated evaporation) with theformation of Fe(OH)3 suppressed. 46
LIST OF TABLES
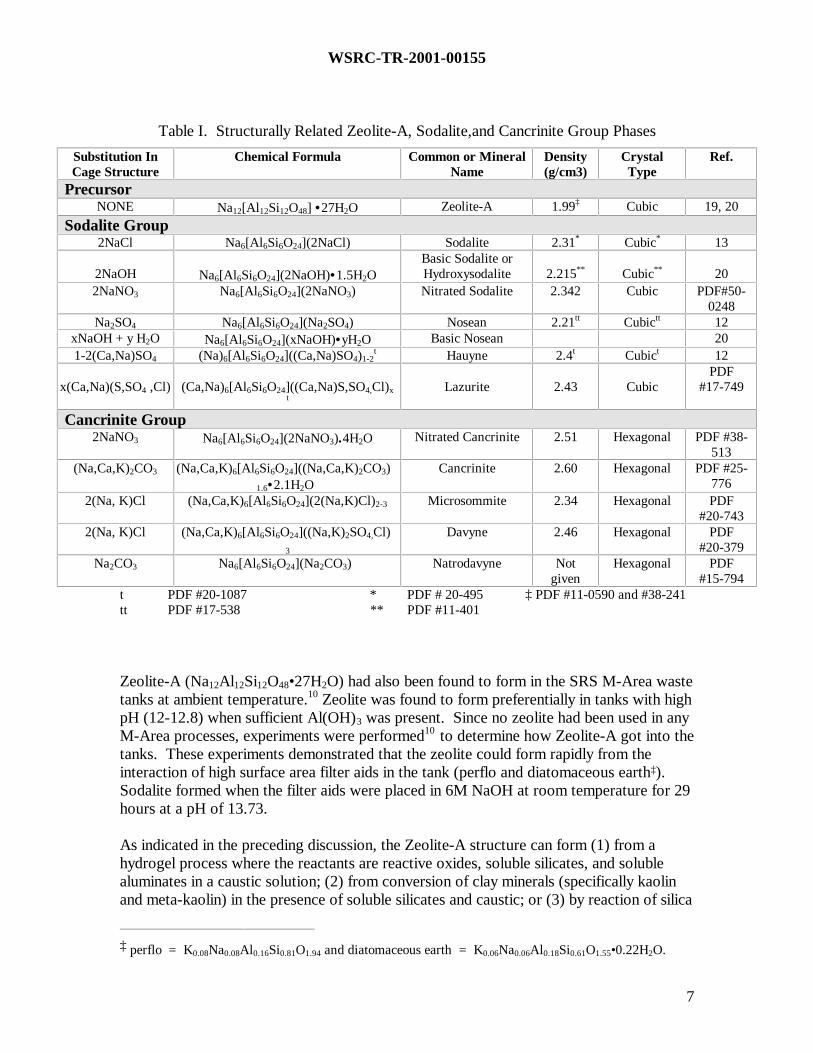
Table I. Structurally Related Zeolite-A, Sodalite,and Cancrinite Group Phases7
Table II. Transfer and Recycle Frequency and Si Analysis for the SRS 3HEvaporator 19
Table III. Available Tank 32 Analytic Data Including Si for SRS 3H Evaporator FeedTank 20
Table IV. Available Tank 30 Analytic Data Including Si for SRS 3H EvaporatorDrop Tank 21
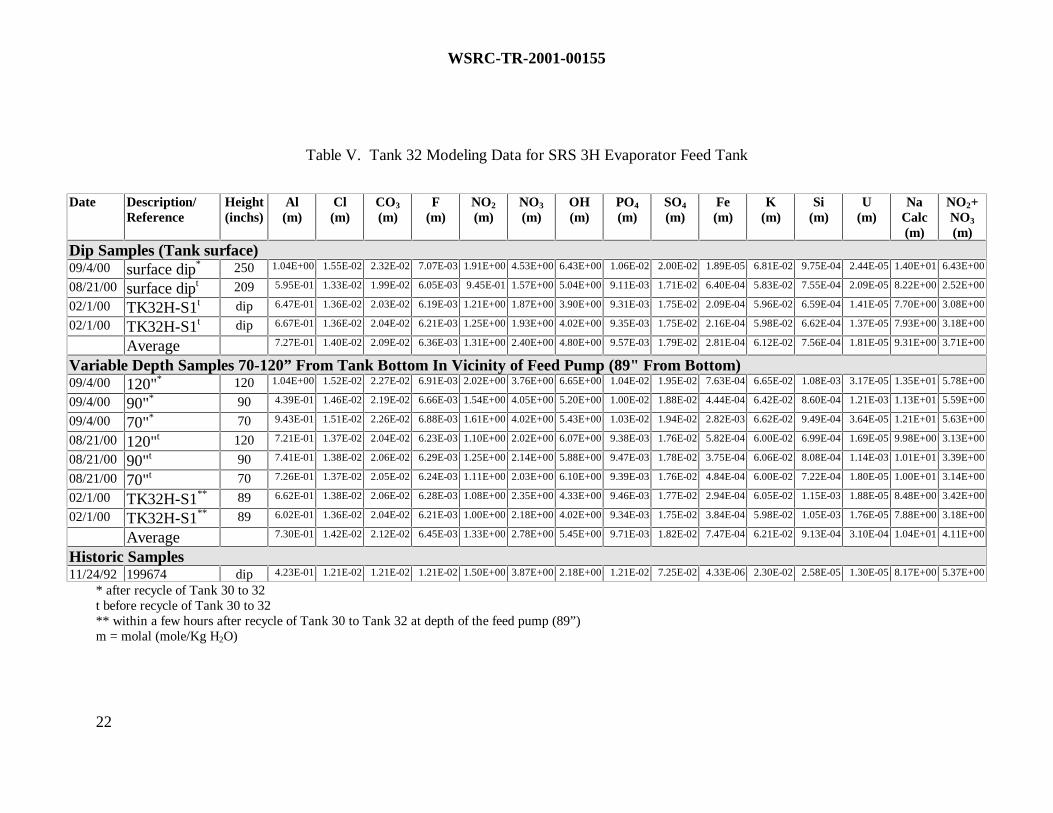
Table V. Tank 32 Modeling Data for SRS 3H Evaporator Feed Tank 22
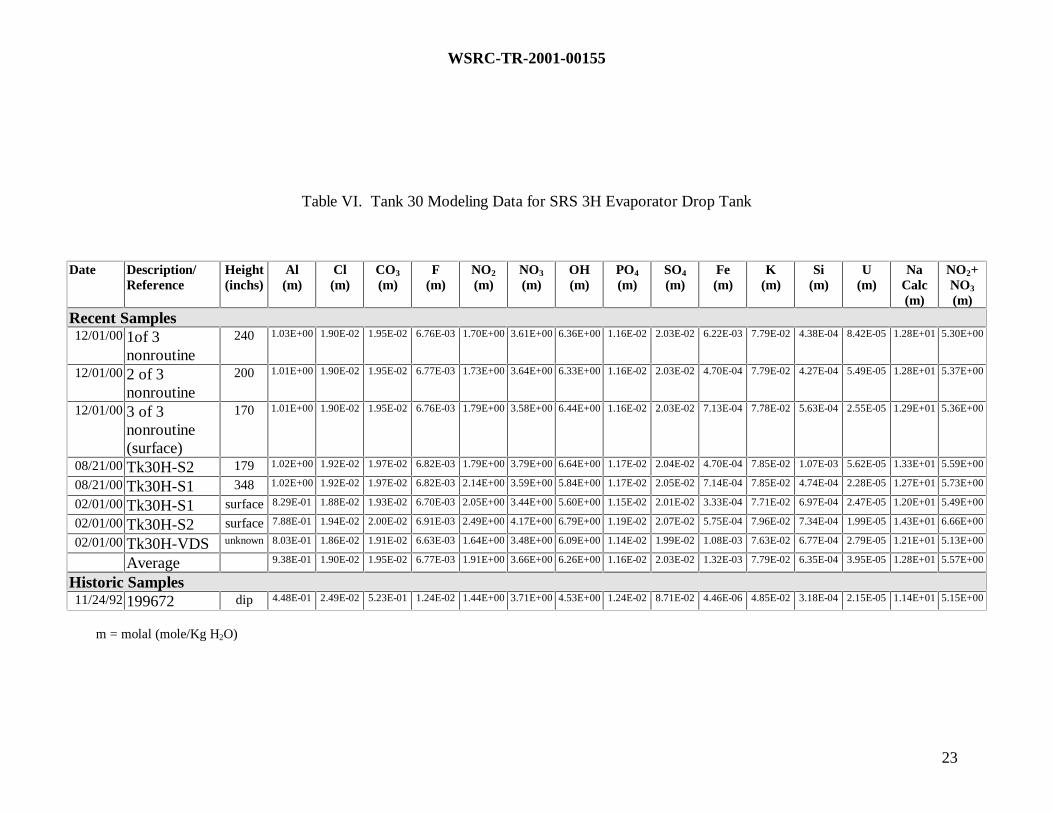
Table VI. Tank 30 Modeling Data for SRS 3H Evaporator Drop Tank 23
Table VII. Supersaturation of 3H Evaporator Solutions with Respect toAluminosilicate Formation 48
WSRC-TR-2001-00155
xiii
LIST OF ACRONYMS
ACT-2: ACTivity Diagram Subroutine in GWBANL-W: Argonne National Laboratory-WestDOE: United States Department of EnergyDWPF: Defense Waste Processing FacilityESP: Extended Sludge ProcessingGDL: Gravity Drain LineGWB: The Geochemist’s Workbench SoftwareLLNL: Lawrence Livermore National LaboratoryNAS: Sodium AluminoSilicate gelPC: Personal ComputerREACT: Reaction Path Subroutine in GWBRW-0333P: DOE Level of Quality AssuranceSRS: Savannah River SiteSRTC: Savannah River Technology CenterVDS: Variable Depth SamplesWSRC: Westinghouse Savannah River CompanyXRD: X-Ray DiffractionZOT: Zone of Turbidity................................................................................................................................................

WSRC-TR-2001-00155
1
THERMODYNAMIC MODELING OF THE SRS EVAPORATORS:PART II. THE 3H SYSTEM (U)
C. M. Jantzen and J. E. LaurinatSavannah River Technology Center
Westinghouse Savannah River CompanyAiken, South Carolina 29808
1.0 INTRODUCTION
Accumulations of two solid phases (a nitrated aluminosilicate that is a mixture of nitratedcancrinite, Na8Al6Si6O24(NO3)2•4H2O, and nitrated sodalite, Na8Al6Si6O24(NO3)2,simultaneously formed with sodium diuranate, Na2U2O7) have formed scale deposits in theSavannah River Site (SRS) 2H Evaporator system since late 1996.1, 2 The aluminosilicatescale deposits caused the evaporator pot to become inoperable in October 1999.Accumulations of the diuranate phase have caused criticality concerns in the SRS 2HEvaporator. In Part I of this study, 3 thermodynamically derived activity diagrams, alsoknown as stability diagrams, were used on historic feed tank (Tank 43) and drop tank(Tank 38) chemistry in order to understand the effects of tank chemistry on solidsformation in the 2H Evaporator. In order to ensure that similar deposits are not and willnot form in the SRS 3H Evaporator, thermodynamically derived activity diagrams specificto the feeds processed from Tanks 30 and 32 are evaluated in this report.
Activity diagrams are most commonly used in electrochemistry, geochemistry andagronomy to study the effects of various aqueous species on the formation and/ordissolution of solids. Activity diagram representation can, therefore, be used to calculateif an evaporator feed tank composition lies in the formation field of an undesirable solidspecies. Modeling the deposition of solids in the SRS 3H Evaporator means that activitydiagrams must be calculated in the complex Na-N-Si-Al-U-H2O system at elevatedtemperatures and at high ionic strengths (I~8). Modeling accuracy is impacted by thefollowing:
• quality of the chemical data available from the feed and drop tanks• how representative the analytic dip samples from the feed and drop tank
are of the feed entering the evaporator• quality of the solubility data used from the literature• quality of the approximations that must be made to determine the activity
coefficients for high ionic strength solutions.
The quality of the solubility data and the quality of the approximations that are used tomodel high ionic strength solutions are discussed in Part I of this study.3 The quality ofthe chemical data available for the SRS 2H and 2F Evaporators is also discussed in Part Iof this study.3 The quality of the chemical data for the SRS 3H Evaporator is discussed inthis study.
WSRC-TR-2001-00155
2
2.0 BACKGROUND
2.1 Operation of the SRS 2H Evaporator
For ~40 years, the SRS tank farm evaporators have run with only occasional operationalproblems, e.g., salt (NaNO3) buildup has caused difficulty in draining evaporators butthese deposits are water soluble and easily removed by flushing with hot water. Over thelast decade several important changes have been made in the handling of wastes enteringthe SRS evaporators.∗ Prior to the mid 1990’s, high activity waste was stored for >1year before being processed in the evaporators so that the short lived radionuclides coulddecay before waste was concentrated. This also allowed any solids or colloidal species inthe wastes to settle to the bottom of the tank before being processed. When the SRSreactors shut down and wastes were less radioactive, the one year hold strategy was nolonger required. In addition, the evaporators used to discharge to alternate drop tanks.When one drop tank was filled it was left to settle, and cool, and a second drop tank wasused. Typically recycles to the feed tank were made from the passive drop tank and notfrom the active drop tank. This allowed any particulates or colloids in a given drop tankto settle before being recycled to the feed tank again for further concentration. Theactive/passive drop tank practice had to be discontinued in the early 1990’s since therewas no longer enough salt drop space in the concentrate receipt tanks. In 1997, the 1st
inter-area waste transfers were made between the SRS H-area and the SRS F-area wastetanks for the purpose of volume reducing the waste. This allowed co-mingling of wastesof different chemistries. More recently, a decision was made to evaporate canyonprocesses and back-log waste in the 2F evaporator for initial salt separation. This occurswhen the hydroxide molarity exceeds 6-8M. Then the desalted liquor will be routed to the3H evaporator for final dehydration which would likely drive the hydroxide molarity above12M.‡
A new 2H Evaporator pot was installed and began receiving waste in January 1996. Frommid 1996 until August 1997 the SRS 2H Evaporator was increasingly hard to control.When the evaporator was shut down in August 1997 for cleaning, deposits of the sodiumaluminosilicate and sodium uranate phases were found in the gravity drain line (GDL).4
The GDL was pressure washed in the direction of the drop tank. The line remained cleanand the evaporator showed minimal deposits on the walls or in the lines from August 1997to June 1998. In June 1998 the GDL needed to be pressure washed a second time anddeposits were observed in the evaporator cone, on the vessel walls and on the warmingtubes. The GDL was pressure washed in the direction of the evaporator and in thedirection of the drop tank to ensure that it was clean. Operation continued, with difficulty,from June 1998 until October 1999, when the evaporator was shut down. At this time,significant accumulations of the same deposits were found on many of the exposedsurfaces of the evaporator pot.
∗ Synopsis by Kent Gilbreth, Mark Mahoney, and Thomas Caldwell (May, 2001)‡ HLW System Plan, Rev. 12

WSRC-TR-2001-00155
3
Waste from H-Canyon separations processes is typically rich in aluminum species whenreceived in the 2H Evaporator feed tank (Tank 43) where it undergoes concentration of60-70% in the evaporator. However, the newly installed 2H Evaporator pot receivedlittle high alumina waste from High Activity Waste (HAW) processing until April 1998when H-Canyon resumed operations. In March 1996, Tank 43 received the firstradioactive transfers of a silica rich stream from the Defense Waste Processing Facility(DWPF) recycle. The relatively low salt content of the DWPF recycle stream requiredgreater concentration (90%) than typical H-Canyon wastes to achieve comparableconcentrated solution density. Multiple transfers of supernate from the drop tank (Tank38) were recycled back to the feed tank (Tank 43) for further concentration. At sometime after the silica rich DWPF transfers were received from the DWPF and mixed withthe aluminum rich transfers from 2H-Canyon separation processes, the sodiumaluminosilicate began to form in the 2H Evaporator.
2.2 Thermodynamic Activity Diagrams
Activity diagrams, also known as stability diagrams, have been used for about 60 years inthe electrochemical sciences. Marcell Pourbaix developed this graphical representationmethod in 1938 for studying the corrosion of solids in aqueous solution. The Pourbaix orE°-pH diagrams are also used to understand the corrosion of metals in concentrated ordilute aqueous solutions, at a variety of temperatures and in oxidizing or reducingatmospheres.
Garrels, a geochemist, studied under Pourbaix and applied the activity diagram calculationapproach to complex interactions between minerals and solutions of geological interest.Geochemical applications included examples whereby minerals precipitated from solutionas well as examples of how minerals dissolved in various solutions.5, 6 Activity diagramsare capable of predicting solubilities of solid mineral species in aqueous solutions,equilibria among different solid minerals, and equilibria among different aqueous species.The geologic systems most commonly studied are: (1) the formation or dissolution ofminerals in ground water or in sea water at ambient temperatures (for this application theyare often called Eh-pH diagrams),7 (2) weathering of mineral phases at ambienttemperature,7 (3) formation of kaolinite and bauxite deposits from weathering of othermineral species,7 and (4) formation of ores from hydrothermal mineralizing solutions attemperatures ≤300°C and pressures deep within the earth.6 Activity diagrams are also usedin agronomy to study aerobic and anaerobic soil chemistry: for soil applications they arecommonly known as pe-pH diagrams.
Activity diagrams have been used to model the dissolution reactions of zeolites at ambienttemperatures: the predicted stability of the zeolite phases has been well correlated withexperimental data.8 The dissolution of zeolites in the rock at the proposed high levelwaste (HLW) repository in Yucca Mountain, Nevada has also been modeled and studiedin terms of activity diagrams.9 It is, therefore, appropriate to use activity diagramrepresentation to model the nitrated cancrinite/sodalite found to deposit in the SRS 2HEvaporator, since the cancrinite/sodalite forms from a precursor zeolite phase which inturn forms from a sodium aluminosilicate (NAS) gel (see Section 2.3).
WSRC-TR-2001-00155
4
Activity diagrams can be used to thermodynamically predict both mineral phase formationand dissolution on geologic time scales. However, the formation of the NAS gel precursorto nitrated cancrinite/sodalite and sodium diuranate is kinetically rapid, occurring in a fewminutes or hours (see Sections 2.3 and 2.4). This allows the thermodynamically basedactivity diagrams to be used as a predictive tool for the evaporator’s short residence times.
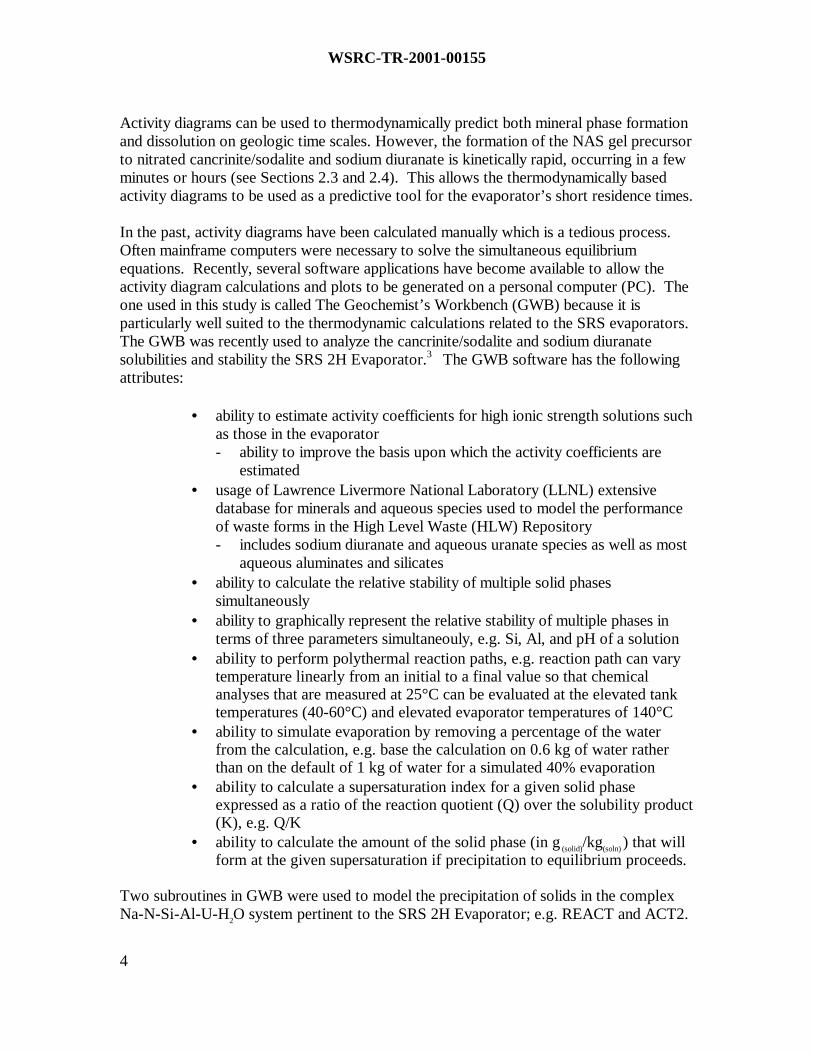
In the past, activity diagrams have been calculated manually which is a tedious process.Often mainframe computers were necessary to solve the simultaneous equilibriumequations. Recently, several software applications have become available to allow theactivity diagram calculations and plots to be generated on a personal computer (PC). Theone used in this study is called The Geochemist’s Workbench (GWB) because it isparticularly well suited to the thermodynamic calculations related to the SRS evaporators.The GWB was recently used to analyze the cancrinite/sodalite and sodium diuranatesolubilities and stability the SRS 2H Evaporator.3 The GWB software has the followingattributes:
• ability to estimate activity coefficients for high ionic strength solutions suchas those in the evaporator- ability to improve the basis upon which the activity coefficients are
estimated• usage of Lawrence Livermore National Laboratory (LLNL) extensive
database for minerals and aqueous species used to model the performanceof waste forms in the High Level Waste (HLW) Repository- includes sodium diuranate and aqueous uranate species as well as most
aqueous aluminates and silicates• ability to calculate the relative stability of multiple solid phases
simultaneously• ability to graphically represent the relative stability of multiple phases in
terms of three parameters simultaneouly, e.g. Si, Al, and pH of a solution• ability to perform polythermal reaction paths, e.g. reaction path can vary
temperature linearly from an initial to a final value so that chemicalanalyses that are measured at 25°C can be evaluated at the elevated tanktemperatures (40-60°C) and elevated evaporator temperatures of 140°C
• ability to simulate evaporation by removing a percentage of the waterfrom the calculation, e.g. base the calculation on 0.6 kg of water ratherthan on the default of 1 kg of water for a simulated 40% evaporation
• ability to calculate a supersaturation index for a given solid phaseexpressed as a ratio of the reaction quotient (Q) over the solubility product(K), e.g. Q/K
• ability to calculate the amount of the solid phase (in g (solid)/kg(soln) ) that willform at the given supersaturation if precipitation to equilibrium proceeds.
Two subroutines in GWB were used to model the precipitation of solids in the complexNa-N-Si-Al-U-H2O system pertinent to the SRS 2H Evaporator; e.g. REACT and ACT2.

WSRC-TR-2001-00155
5
The REACT subroutine models equilibrium states and processes of solids in equilibriumwith aqueous fluids. The program calculates the following:
• equilibrium distribution of aqueous species in a fluid• the fluid’s saturation state with respect to mineral phases• the fugacities of the gases dissolved in the fluid
During the modeling of deposition in the 2H Evaporator using GWB several mineralphases that were known to kinetically form on geologic time scales, but not on the timescales pertaining to the 2H Evaporator, were suppressed. The ACT2 program was usedto calculate and plot activity-activity diagrams for representation of the solidsprecipitation. The manner in which GWB calculates equilibrium and estimates activitycoefficients in high ionic strength solutions such as those in the SRS evaporators isdiscussed in Part I of this report.3 The amount of solids predicted to form in grams perkilogram of solution was developed into two potential process control algorithms for theoperation of the SRS 2H Evaporator.
The GWB calculations in the complex Na-N-Si-Al-U-H2O system were validated bymodeling two additional data sets not related to solids deposition in the SRS evaporators.The first of these was the analysis of the M-Area wastes (supernate plus sludge) from1987 when the M-Area tanks were well agitated.10 This waste was high in alumina, silica,and sodium nitrate. The tanks were at ambient temperature. The REACT code predictedthat the solutions were supersaturated with respect to Zeolite-A, hydroxysodalite, nitratedsodalite, Na2U2O7 (sodium diuranate), and Al(OH)3 (gibbsite). The phases identified byx-ray diffraction to have formed in the sludge were Zeolite-A, Na2U2O7, and Al(OH)3.
10
The second set of confirmatory data was from a study of caustic additions to a highlyacidic concentrated uranyl nitrate solution.11 The REACT code indicated that aprecipitate of schoepite should be in equilibrium with uranyl nitrate in solution. Pierce’ssolution remained acidic after he started the neutralization, but a precipitate formed thatwas analyzed by x-ray diffraction to be becquerelite (PDF pattern #29-0389) a structuralisomer of schoepite (UO2•2H2O).12 Both of these independent studies validated that GWBis calculating the activity diagrams and the reactions in this complex system correctly.
2.3 Zeolite, Sodalite, and Cancrinite Nomenclature and Paragenesis
The type of sodalite normally found in nature has the formula Na8[Al6Si6O24](Cl2). Thesquare brackets in the formula are used to delineate the alumina:silica ratio of thealuminosilicate cage structure shown in Figure 1. The cavities in the framework areoccupied by the sodium and chlorine ions.13 The formula can also be written asNa6[Al6Si6O24]•(2NaCl).13 When the 2NaCl are replaced by Na2SO4, Na2CO3, 2NaNO3,and/or 2NaOH, the mineral and/or chemical names are as given in Table I.

WSRC-TR-2001-00155
6
Figure 1. Part of the aluminosilicate framework in the structure of sodalite.13
Linde Zeolite-A, Na12[Al12Si12O48] •27H2O, is a phase related structurally to basic sodaliteand basic nosean20 because the alumina:silica ratio of the aluminosilicate cage structure isthe same as that found in the sodalites (Figure 1). Zeolite-A is a double unit cell ofsodalite without the NaCl, Na2SO4, NaOH, or Na2CO3 groups (Table I).
Recent work at Argonne National Laboratory-West (ANL-W) on sodalite based†wasteforms containing NaCl found that Zeolite-A formed as a precursor to the formation ofsodalite, Na8[Al6Si6O24](Cl2).
14 The Zeolite-A transformed to Na8[Al6Si6O24](Cl2) atelevated temperature and pressure. Wilmarth15 has determined that a mixture of thenitrated sodalite and nitrated cancrinite formed in the 2H evaporator also forms from aZeolite-A precursor while Frederick determined that mixtures of nitrited sodalite andcancrinite found to deposit in spent pulping liquor evaporators also formed from a Zeolite-A precursor.16 The studies by Gasteiger, Frederick, et al.17 precipitated the zeolite andmixed sodalite phases in the [Al]/[Si] range between 0.076 and 3. These aqueous alkalinesolutions had ionic strengths between 1.0 and 4.0 mol/kg at 95°C.
The formation of Zeolite-A is well studied and very rapid kinetically. Formation from asodium aluminate gel (87 wt% NaAlO2 and 13 wt% NaOH commercially available asAlfloc) and a 1 M colloidal silica sol (particles of 250Å)formed well crystallized Zeolite- A(also called Zeolite Q by Barrer, et. al.20) at temperatures between 85-110°C at pH values≥10 in 2 or 3 hours (longer residence times were needed if the silica content of the gelincreased and crystallization was more rapid in the presence of excess NaOH).20,18
† waste form is 69 wt% sodalite, 22 wt% glass, 2.4 wt% NaCl, 6.7 wt% nepheline, and 1wt% actinides
WSRC-TR-2001-00155
7
Table I. Structurally Related Zeolite-A, Sodalite,and Cancrinite Group Phases
Substitution InCage Structure
Chemical Formula Common or MineralName
Density(g/cm3)
CrystalType
Ref.
PrecursorNONE Na12[Al12Si12O48] •27H2O Zeolite-A 1.99‡ Cubic 19, 20
Sodalite Group2NaCl Na6[Al6Si6O24](2NaCl) Sodalite 2.31* Cubic* 13
2NaOH Na6[Al6Si6O24](2NaOH)•1.5H2OBasic Sodalite orHydroxysodalite 2.215** Cubic** 20
2NaNO3 Na6[Al6Si6O24](2NaNO3) Nitrated Sodalite 2.342 Cubic PDF#50-0248
Na2SO4 Na6[Al6Si6O24](Na2SO4) Nosean 2.21tt Cubictt 12xNaOH + y H2O Na6[Al6Si6O24](xNaOH)•yH2O Basic Nosean 201-2(Ca,Na)SO4 (Na)6[Al6Si6O24]((Ca,Na)SO4)1-2
t Hauyne 2.4t Cubict 12
x(Ca,Na)(S,SO4 ,Cl) (Ca,Na)6[Al6Si6O24]((Ca,Na)S,SO4,Cl)xt
Lazurite 2.43 CubicPDF
#17-749
Cancrinite Group2NaNO3 Na6[Al6Si6O24](2NaNO3)•4H2O Nitrated Cancrinite 2.51 Hexagonal PDF #38-
513(Na,Ca,K)2CO3 (Na,Ca,K)6[Al6Si6O24]((Na,Ca,K)2CO3)
1.6•2.1H2OCancrinite 2.60 Hexagonal PDF #25-
7762(Na, K)Cl (Na,Ca,K)6[Al6Si6O24](2(Na,K)Cl)2-3 Microsommite 2.34 Hexagonal PDF
#20-7432(Na, K)Cl (Na,Ca,K)6[Al6Si6O24]((Na,K)2SO4,Cl)
3
Davyne 2.46 Hexagonal PDF#20-379
Na2CO3 Na6[Al6Si6O24](Na2CO3) Natrodavyne Notgiven
Hexagonal PDF#15-794
t PDF #20-1087 * PDF # 20-495 ‡ PDF #11-0590 and #38-241tt PDF #17-538 ** PDF #11-401
Zeolite-A (Na12Al12Si12O48•27H2O) had also been found to form in the SRS M-Area wastetanks at ambient temperature.10 Zeolite was found to form preferentially in tanks with highpH (12-12.8) when sufficient Al(OH)3 was present. Since no zeolite had been used in anyM-Area processes, experiments were performed10 to determine how Zeolite-A got into thetanks. These experiments demonstrated that the zeolite could form rapidly from theinteraction of high surface area filter aids in the tank (perflo and diatomaceous earth‡).Sodalite formed when the filter aids were placed in 6M NaOH at room temperature for 29hours at a pH of 13.73.
As indicated in the preceding discussion, the Zeolite-A structure can form (1) from ahydrogel process where the reactants are reactive oxides, soluble silicates, and solublealuminates in a caustic solution; (2) from conversion of clay minerals (specifically kaolinand meta-kaolin) in the presence of soluble silicates and caustic; or (3) by reaction of silica
‡ perflo = K0.08Na0.08Al 0.16Si0.81O1.94 and diatomaceous earth = K0.06Na0.06Al 0.18Si0.61O1.55•0.22H2O.
WSRC-TR-2001-00155
8
sols, natural SiO2, amorphous minerals, and volcanic glass in the presence of caustic.3 Thehydrogel reactions are of the type:
[ ] ( ) ( )[ ] OmHSiOAlONaOHNaOH)SiO()AlO(Na
)aq(SiONa)aq()OH(NaAl)aq(NaOH
2y2x2xalhydrotherm
C17525
gel2c2b2a
C25324
• →••
→++°−
°
[1]
Zeolites are synthesized industrially using the hydrogel process shown in Equation 1.Upon mixing sodium silicate and sodium aluminate at high pH an amorphous sodiumaluminosilicate gel phase forms which will be abbreviated as NAS gel. Transformation ofthe gel to the zeolite can take hours or days depending upon the synthesis conditions.Industrial synthesis of Zeolite-A involves solutions use of 4.0M NaOH concentrations tokeep the crystallization times short and allow effective recycling of the excess NaOH.21
The dissolution of Zeolite-A has been studied by numerous investigators includingGasteiger, et. al.17 but these investigations have been at insufficiently high NaOHconcentrations to be relevant to industrial zeolite synthesis.22 Recently, Ejaz et. al.22
studied the solubility of Zeolite-A and its amorphous precursor (NAS gel) in solutionsbetween 3.0-4.4M NaOH at temperatures of 30-80° C. The composition of the precursorgel at NaOH concentrations of 3-4.5M was determined experimentally to be0.93Na2O:1Al2O3:2.32SiO2:5.15H2O.
Gels are amorphous as they are colloids in which the disperse phase has combined withthe continuous phase to produce a semisolid material such as a jelly.23 As a gel dewatersor ages it will form a denser gel and/or a crystalline solid phase. This is independent ofthe route of formation of the gel. Whether the NAS gel forms from solution via ahydrogel process or whether it forms from a sol (solid particles in liquid) 24 via a sol-gelprocess, the aging sequence of the NAS gel to denser sodalite and still denser cancrinitetype species will typically follow an aging path such as that shown in Figure 2 accordingto Barnes, Mensah and Gerson25 and Gerson and Zheng.26 Note that the densification ofthe phases follows the densities given in Table I and agrees with the following literature:
• Bayer20 and Ejaz22 found that the NAS hydrogels would transform toZeolite-A
• Barrer20 found that the NAS hydrogels would transform to Zeolite-A at pHvalues >10 in 2-3 hours at 110°C (the approximate temperature of the 2H Evaporator)
• Buhl and Lons27 showed that nitrated sodalite and nitrated cancrinite couldbest be made by starting with a Zeolite-A precursor in concentrated NaOH atvarious temperatures
• Wilmarth28 showed that the Zeolite-A forms as a precursor but the nitratedcancrinite forms on the order of 3-5 hours at 110°C in simulated 2HEvaporator solutions
• Gasteiger et al.17 found that basic sodalite Na8[Al 6Si6O24](OH)2•(1.5H2O) andsodalite (Na8[Al 6Si6O24](Cl)2) formation was >99% complete in 24 hours at95°C and that the sodalites formed via a Zeolite-A precursor
WSRC-TR-2001-00155
9
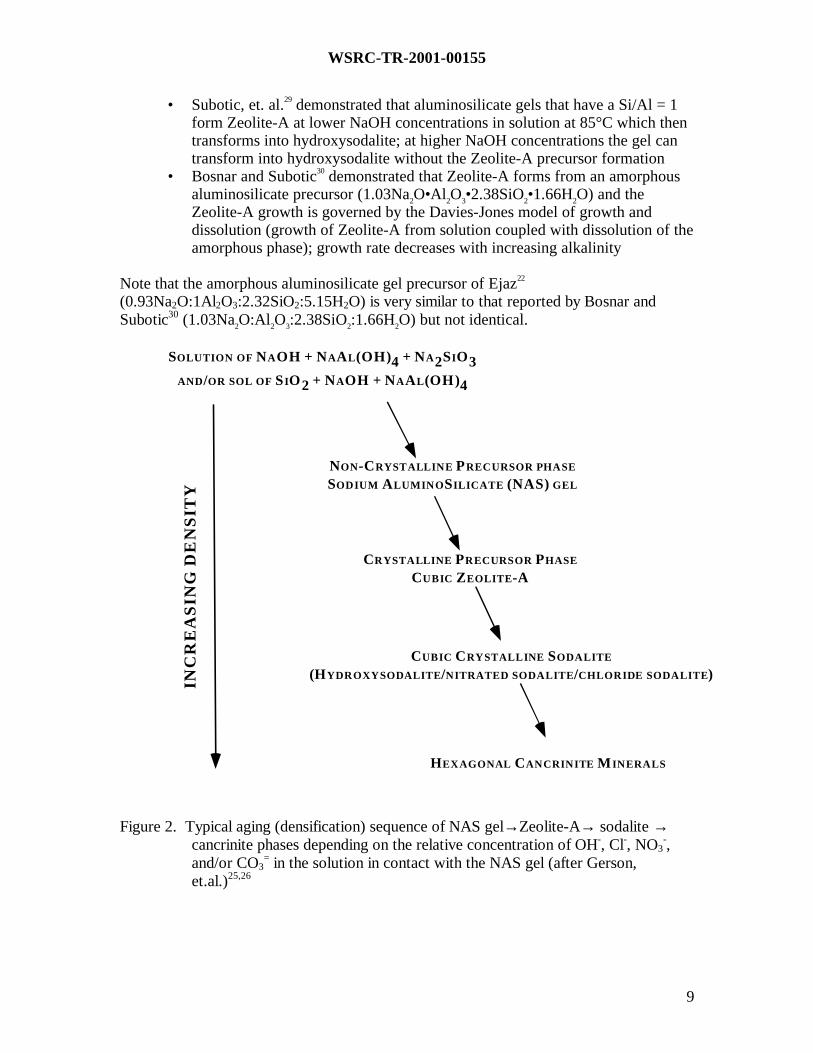
• Subotic, et. al.29 demonstrated that aluminosilicate gels that have a Si/Al = 1form Zeolite-A at lower NaOH concentrations in solution at 85°C which thentransforms into hydroxysodalite; at higher NaOH concentrations the gel cantransform into hydroxysodalite without the Zeolite-A precursor formation
• Bosnar and Subotic30 demonstrated that Zeolite-A forms from an amorphousaluminosilicate precursor (1.03Na2O•Al2O3•2.38SiO2•1.66H2O) and theZeolite-A growth is governed by the Davies-Jones model of growth anddissolution (growth of Zeolite-A from solution coupled with dissolution of theamorphous phase); growth rate decreases with increasing alkalinity
Note that the amorphous aluminosilicate gel precursor of Ejaz22
(0.93Na2O:1Al2O3:2.32SiO2:5.15H2O) is very similar to that reported by Bosnar andSubotic30 (1.03Na2O:Al2O3:2.38SiO2:1.66H2O) but not identical.
SOLUTION OF NAOH + NAAL(OH)4 + NA2SIO3AND/OR SOL OF SIO2 + NAOH + NAAL(OH)4
NON-CRYSTALLINE PRECURSOR PHASE
SODIUM ALUMINOSILICATE (NAS) GEL
CRYSTALLINE PRECURSOR PHASE
CUBIC ZEOLITE-A
CUBIC CRYSTALLINE SODALITE
(HYDROXYSODALITE/NITRATED SODALITE/CHLORIDE SODALITE)
HEXAGONAL CANCRINITE MINERALS
INC
RE
AS
ING
DE
NS
ITY
Figure 2. Typical aging (densification) sequence of NAS gel→Zeolite-A→ sodalite →cancrinite phases depending on the relative concentration of OH-, Cl-, NO3
-,and/or CO3
= in the solution in contact with the NAS gel (after Gerson,et.al.)25,26

WSRC-TR-2001-00155
10
2.4 The Role of Uranium in the Evaporator Deposits
It is highly unlikely that the uranium contained in the 2H Evaporator deposits isincorporated into the cage structure of the Zeolite-A and/or cancrinite/sodalite phases.The ion exchange capacity of Na+ in the Zeolite-A structure for large monovalent ions isminimal, e.g., Cs+ and Rb+ exchanged at 90°C ~31% and 36%, respectively.31 Ionexchange with multivalent cations is limited with ions such as Ba2+, Fe2+, and Fe3+
exchanging but destroying the zeolite structure while large trivalent cations such as Ce3+
do not exchange at all.31 This implies that large tetra- or hexa-valent cations which aremost likely tied up in uranium complexes cannot ion exchange for Na+ in the Zeolite-Aand/or the cancrinite/sodalite structures. This is in agreement with the following:
• the absence of any uranium containing sodalite or cancrinite structures innature13
• the absence of uranium in the sodalite phase of the ANL-W sodalite wasteform14
• the presence of a second uranium-containing phase in the x-ray spectra of the2H Evaporator deposits.1,2,4
The uranium containing phase observed in the 2H Evaporator is sodium diuranate(Na2U2O7). Sodium diuranate can form readily from mixtures of 0.1N uranyl nitrate andNaOH at room temperature in time frames of <24 hours. The ratio of the Na:U in thepolyuranate phase that forms is a function of pH of the solution and the length of time thatthe Na has to diffuse into the crystal structure.32 Specifically, when NaOH was added todilute solutions of uranyl nitrate, the first species to form was a polymerized ion of theform [UO2(UO3H2O)n]
++, followed by precipitation of a nitrated uranate phase with apolymer chain of [(UO3H2O)5N2O5] at pH of 4.32 As the solution pH increases withincreasing NaOH, Na2O replaces the N2O5 in the polymer chain forming[(UO3H2O)nNa2O] where n changes from 16 at low pH values to 5 at higher pH values.Longer contact with the NaOH rich solution at high pH causes n to become ≤3 causing achange in the crystal structure. At n=2 the final stable Na2U2O7•2H2O composition isformed. Similar results were observed when reactive UO3 was treated with NaOH at50°C and 75°C.33 It should be noted that in both of these studies32, 33 the Na2U2O7
precipitates were very small and suspended in the NaOH solutions, i.e., the precipitateshad to be centrifuged in order to be examined. Finely dispersed sodium diuranate phaseswere found to form readily at 25°C in about 10-60 minutes, 32 reaching equilibrium inabout 5 days.34
Hobbs and Karraker35 studied the precipitation of Na2U2O7 in simulated evaporatorsolutions under simulated evaporator conditions. The precipitates that formed had particlesize ranges between 3.3 µm and 60 µm for unsaturated solutions and 2.3 µm to 13 µm forsupersaturated solutions. The studies indicated that Na2U2O7 would precipitate underevaporator conditions and might accumulate depending on particle size, mixing, andequipment geometry. The accumulation of Na2U2O7 with the nitrated zeolite in the 2HEvaporator is likely caused by co-precipitation as discussed in Part I.3 Precipitation of
WSRC-TR-2001-00155
11
uranium and not other salts (e.g. sodium sulfate, sodium carbonate, etc) would beexpected as the solubility of uranium is much lower than that of the other salt components.
3.0 OPERATION OF THE SRS 3H EVAPORATOR
The current SRS 3H Evaporator pot began operation in May 2000 (Table II). The 3HEvaporator feed tank is Tank 32 and the drop tank is Tank 30. The initial feed for the 3HEvaporator was H-Canyon waste that had been stored in Tanks 30, 32, and 35 for manyyears. In the future the 3H Evaporator will receive de-salted waste from the 2FEvaporator system for further concentration. Tank 32 can potentially be feed from Tanks35 and 39 but feed from these tanks has not yet been sent forward to Tank 32 since initialoperations.
Tank 32 has received multiple recycles of supernate from the drop tank (Tank 30) asindicated in Table II. The recycle is approximately on a 4-6 week frequency though itcan be more frequent depending on the level of the wastes in the feed and drop tanks.Tank 32 has about 48” of sludge at the bottom (Figure 3). The transfer pump to theevaporator is located at a height of 89” from the bottom of the tank. The level of thesupernate varies depending on the volume of a given transfer into the tank.
Tank 30, the drop tank has no significant sludge accumulation at the bottom other thansome entrained sludge solids. It had a transfer jet that was located 4” above the bottomof the tank (Figure 3) during the time period discussed in this study.* The salt layer is at~8” above the bottom of the tank. Tank 30 received Extended Sludge Processing (ESP)Washwater from Tank 40 in December 2000.
The 3H Evaporator has been operating at 135-140°C since May 2000.‡ Tanks 32 and 30have been at a nominal temperature of ~40°C until a few months ago when cooling coildifficulties in Tank 30 caused the temperature in Tank 32 to be elevated to the 60-65°Crange.‡ The temperature in Tank 30 has recently been somewhat hotter.
4.0 ANALYTIC DATA AVAILABLE FOR SRS 3H EVAPORATOR MODELING
4.1 Availability of Analytic Data
A compilation of molar chemical analyses for Tanks 30 and 32 appears in Table III andTable IV. There were sparse and incomplete data in the tank farm historic records.Specifically there were no Si analyses available for the feed tank (Tank 32) compositionsprior to February 2000 and no Si analyses available for the drop tank (Tank 30)compositions prior to February 2000. Data for several cations were missing from thetank farm historic records, e.g. Si, Fe, Al, Na, and total U. The cation analyses wereadded into Table III and Table IV using data from three reports by Wilmarth and others.36,
* In spring 2001 ther fixed transfer jet was replaced with a telescoping transfer jet currently positioned at~150” from the tank floor‡ Morning reports

WSRC-TR-2001-00155
12
37,38 Conversely, Wilmarth did not analyze for the cation K+ nor several anions,† e.g. Cl,CO3
2-, F-, NO2
-, NO3
-, OH-, PO4
3-, SO4
2
-. The anion and K analyses shown in yellow inTable III and Table IV were averaged from the data provided in the tank farm records.Separate averages were computed for Tank 30 and Tank 32 data.
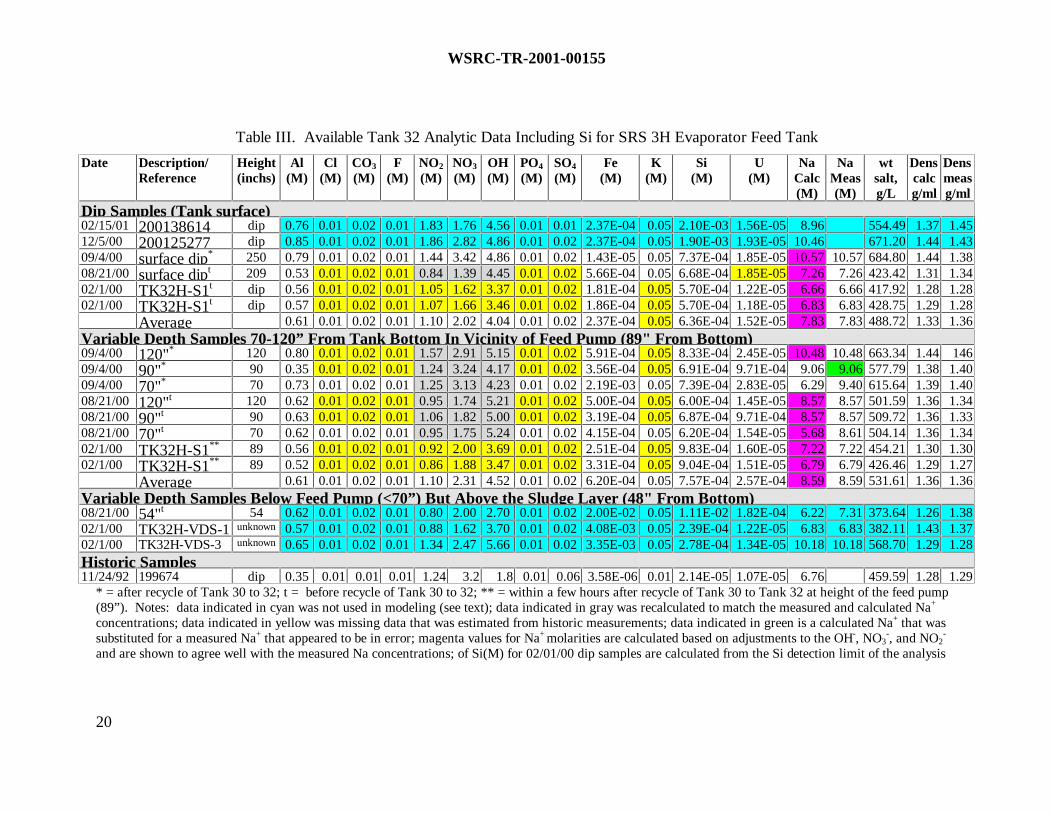
The feed tank (Tank 32) was sampled in February 2000 before the operation of the new3H Evaporator pot began (Table III). This data represents the initial feed to the new 3HEvaporator pot since no transfers were made to Tank 32 after February 15, 2000 (seeTable II). Wilmarth extensively characterized two dip samples and two variable depthsamples (VDS) taken from Tank 32 in February 2000.36 Wilmath also analyzed Tank 32surface dip and VDS samples in August 2000 just before a recycle was made from Tank30 to 32.37 He then immediately analyzed samples taken in Tank 32 during the Tank 30transfer in September 2000.37
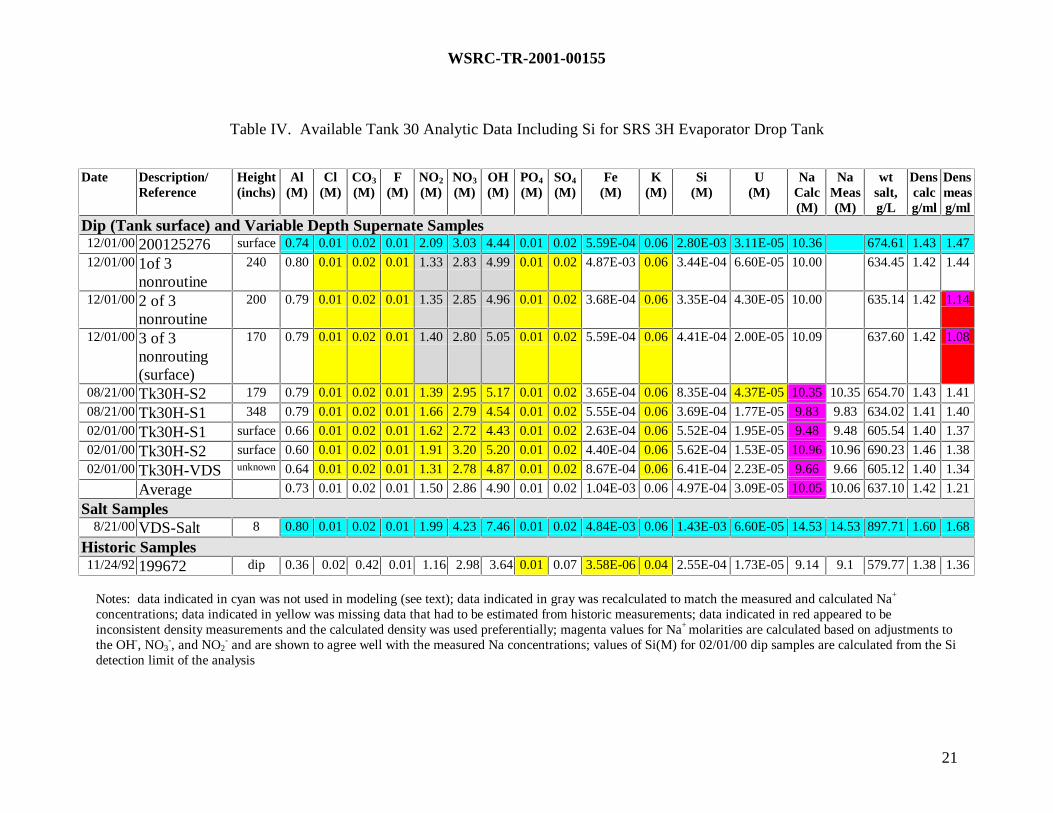
The chemistry of the drop tank, Tank 30, was also analyzed in February 2000 (Table II)by Wilmarth, et. al.37 Tank 30 was also analyzed in August 2000 just before the recycleto the Tank 32 feed tank. In addition a transfer of ESP wash water was made from Tank40 to Tank 30 in December 2000. Wilmarth analyzed the contents of Tank 30 just afterthe transfer from Tank 40 (see Table II).38
4.2 Consistency of Analytic Data
In order to use the chemical analyses compiled in Table III and Table IV for modeling, thedata had to be made internally consistent, e.g., anion and cation charges had to bebalanced. In balancing charges, it was assumed that the Na+ molarities were more accuratethan the anion molarities. If the sum of the anion charges differed significantly from thesum of the cation charges, molarities of the three principal anions, OH-, NO3
-, and NO2-,
were adjusted so that these sums became equal. The measured molarities for all threeprincipal anions were multiplied by the same factor to achieve charge neutrality. Data forwhich anion charges were adjusted are shaded gray in Table III and Table IV. The chargebalance calculations assumed that each ionic species was present in its most prevalentvalence state; most importantly, Al was modeled as Al(OH)4
-.
In addition to reporting molar concentrations, Table III and Table IV compare calculatedand measured solution densities. Solution densities were calculated from the Na+ molarity,using the following formula for H-Canyon waste solutions at 25°C, derived by Walker andColeman39.
[ ]++=ρ Na040469.00133.1 [2]
where ρ is the solution density in g/cm3 and [ ]+Na is the molar Na+ concentration.
† Wilmarth analyzed for NO2, NO3, and OH- for one surface dip sample taken in September, 2000 at aheight of 250” from the tank bottom
WSRC-TR-2001-00155
13
Generally, measured and calculated densities agreed within 2-3%. Two measureddensities for Tank 30, however, were much lower than predicted from the measured saltconcentrations; these are shaded magenta in Table IV. It was assumed that these densitymeasurements were in error. For one Tank 32 dip sample at a tank elevation of 90 inches,shaded green in Table III, the measured Na+ concentration was significantly lower thanwould be predicted by the measured density or the measured anion concentrations. Acalculated Na+ concentration was substituted for this measured concentration. Theconcentration was calculated by multiplying the measured Na+ concentration for a dipsample taken on the same date at a tank elevation of 120 inches by the ratio of the partialdensities of dissolved solids for these two measurements. The calculation took the form
[ ] [ ]0133.1
0133.1NaNa
1,meas
2,meas12 −ρ
−ρ= ++ [3]
where ρmeas is the measured density and subscripts 1 and 2 refer to the two sets ofmeasurements.
4.3 Quality of Analytic Data
The SRTC and the F-area laboratory both analyzed samples taken on 12/5/00 from Tank30 which was just after the transfer of the ESP washwater from Tank 40. Note that the F-area laboratory sample was a surface dip sample and the reported Si concentration is 78.7ppm (see Table II). The SRTC laboratory analyzed samples taken on the same day at170”, 200” and 240” above the bottom of the tank. The SRTC laboratory analyses arereported as 9.4, 9.7, and 12.4 ppm.
The SRTC and the F-area laboratory both dilute the original sample in order to handle theradioactive samples safely in a radioactive hood and match the Na concentration to theinstrument range. The F-area laboratory uses two dilutions, one 21X and one 10X. If thetrue Si concentration is between 9.4 and 12.4 as measured by SRTC, then the combined210X dilution done by F-Area laboratory puts the Si concentration at or close to thedetection limit of the inductively coupled plasma (ICP) technique employed formeasurement, e.g. 9.4ppm/210 and 12.4/210 = 0.045 – 0.059 ppm in the solution at thisdilution while the instrument detection limit is in the 0.2 ppm range for Si in the 4M HNO3
solutions analyzed.‡ Measurements taken at or below the detection limit of an analyticinstrument can be in error by 100-300%. When this error is multiplied by the dilutionfactor it is magnified into a larger error. Hence, the F-Area laboratory Si analyses are ~7Xlarger than those of the SRTC analyses.
‡ Mark Jones (F-Area Laboratory on April 5, 2001)

WSRC-TR-2001-00155
14
Figure 3. Schematic of the SRS 3H Evaporator, the feed tank (Tank 32) and the drop tank (Tank 30).
Note that the feed pump in Tank 32 is at a height of 89” and that the sludge layer is at a height of ~48” from the bottom ofthe tank. Note that Tank 30 does not have a feed pump and has an ~8” salt layer. Tank 30 had a transfer jet located 4”from the bottom of the tank for the time period examined in this study.

WSRC-TR-2001-00155
15
SRTC has developed a method by which the entire diluted sample is filtered so that thetotal amount of Si (both soluble and colloidal) can be more accurately determined. A literof solution is filtered. The filtrate, representing the soluble silica, is homogeneous and canbe accurately measured by ICP. The colloidal silica on the filter is dissolved and measuredseparately. The two are added together for a final total silica analysis that is representativeof an entire liter of sample36,37,38 rather than a few milliliters of solution. The quality of theSRTC analyses is evidenced in Table II by the consistency of the surface and dip sampleanalyses for Tanks 30 and 32.
Recently, Coleman40 has tested a spectrophotometric method from the 1920’s that usesmolybdic acid to analyze simultaneously for the monosilicic acid in solution, the polysilicicacids, and colloids. Coleman’s analyses have verified Wilmarth’s analytic results.Because of the high bias in the F-area laboratory Si analyses, only the Si analyses reportedby Wilmarth were used for modeling, e.g. the F-area analyses (#200138614 and#200125277 for Tank 32 and #200125276 for Tank 30) were not used and are shown incyan in Table III and Table IV.
4.4 Analytic Data Populations
4.4.1 Tank 32H (Feed Tank)
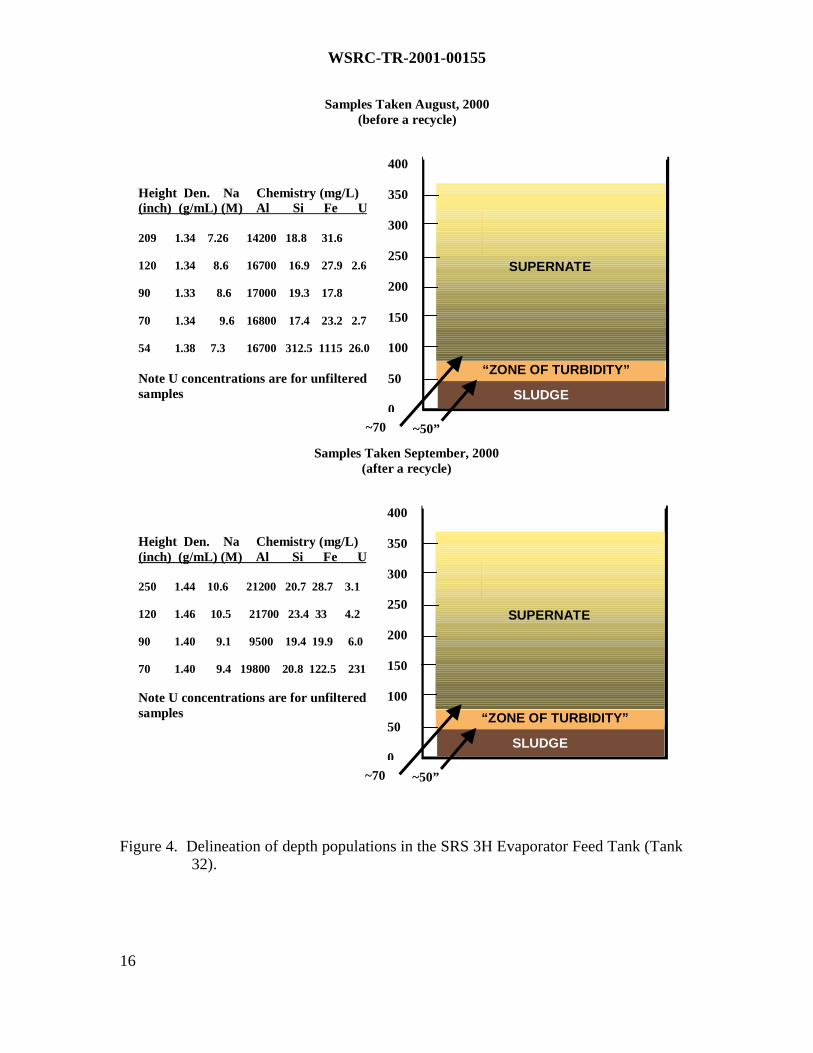
The chemical data for Tank 32 given in Table III was taken at various times and at variousdepths within the tank. The chemistry of the samples taken within 6” of the sludge layer,at a height of 54” (~35” below the height of the feed pump), was distinctly different thanthe chemistry of the remaining supernate samples higher in the tank as illustrated in Figure4. Since the feed pump cannot process liquid from the 54” height a decision was made tonot model this depth data.
The chemistry of the supernate above the feed pump looked somewhat different from thechemistry of the supernate at the feed pump (at a height of 90”) and 20” below the feedpump (at a height of 70”). These supernate samples were split into two depth regimes, e.g.dip samples and variable depth samples (VDS), to assess if the chemistry differencesobserved in Table III made a difference in the saturation with respect to thealuminosilicate NAS phase. The VDS samples spanned from 70” above the tank bottomto 120” above the tank bottom.
Modeling different depth regimes in the feed tank provided an average chemistry for eachdepth. The average chemistry is needed for modeling the phase boundaries on the activitydiagrams. Once the boundaries are defined by this average chemistry, then the position ofthe data taken on different days and at different depths can be overlain. Modeling theTank 32 data as different depth populations also facilitates the interpretation of whethercolloidal silica or unsettled entrained sludge solids are skewing the interpretation of thedata.
WSRC-TR-2001-00155
16
Samples Taken August, 2000(before a recycle)
Height Den. Na Chemistry (mg/L)(inch) (g/mL) (M) Al Si Fe U
209 1.34 7.26 14200 18.8 31.6
120 1.34 8.6 16700 16.9 27.9 2.6
90 1.33 8.6 17000 19.3 17.8
70 1.34 9.6 16800 17.4 23.2 2.7
54 1.38 7.3 16700 312.5 1115 26.0
Note U concentrations are for unfilteredsamples
~70 ~50”
SLUDGE
“ZONE OF TURBIDITY”
SUPERNATE
400
350
300
250
200
150
100
50
0
Samples Taken September, 2000(after a recycle)
Height Den. Na Chemistry (mg/L)(inch) (g/mL) (M) Al Si Fe U
250 1.44 10.6 21200 20.7 28.7 3.1
120 1.46 10.5 21700 23.4 33 4.2
90 1.40 9.1 9500 19.4 19.9 6.0
70 1.40 9.4 19800 20.8 122.5 231
Note U concentrations are for unfilteredsamples
~70 ~50”
SLUDGE
“ZONE OF TURBIDITY”
SUPERNATE
400
350
300
250
200
150
100
50
0
Figure 4. Delineation of depth populations in the SRS 3H Evaporator Feed Tank (Tank32).
WSRC-TR-2001-00155
17
The first depth population defined for Tank 32 samples (Table III) consists of dip sampleanalyses taken at various heights in the supernate (see Figure 4). Six analyses wereavailable spanning a time frame between February 2000 and February 2001. The twomost recent samples had been analyzed by the F-area laboratory and were biased high asindicated in Section 4.3 (see also Table II and Table III). These data were not used inmodeling. The data used for modeling, therefore, spans from February 2000 to September2000.
The second depth population consists of all Tank 32 variable depth samples taken from70” above the tank bottom to 120” below the tank bottom. This range spans the height30” above the feed pump and 20” below the feed pump. All of the VDS data in the 70-120” depth interval was used in modeling. The data spans from February 2000 toSeptember 2000. The data includes two samples from February 2000 that had been takenwithin a few hours of a Tank 30 to Tank 32 transfer and data from August/September2000 that had been made before and after a Tank 30 to Tank 32 transfer. While several ofthe February and September 2000 samples appear high in silica, removal of these 8samples from this depth population would have left only three samples fromAugust/September 2000. During modeling the before and after recycle samples wereplotted as different symbols (and colors) to draw attention to their relative positions on theactivity diagrams.
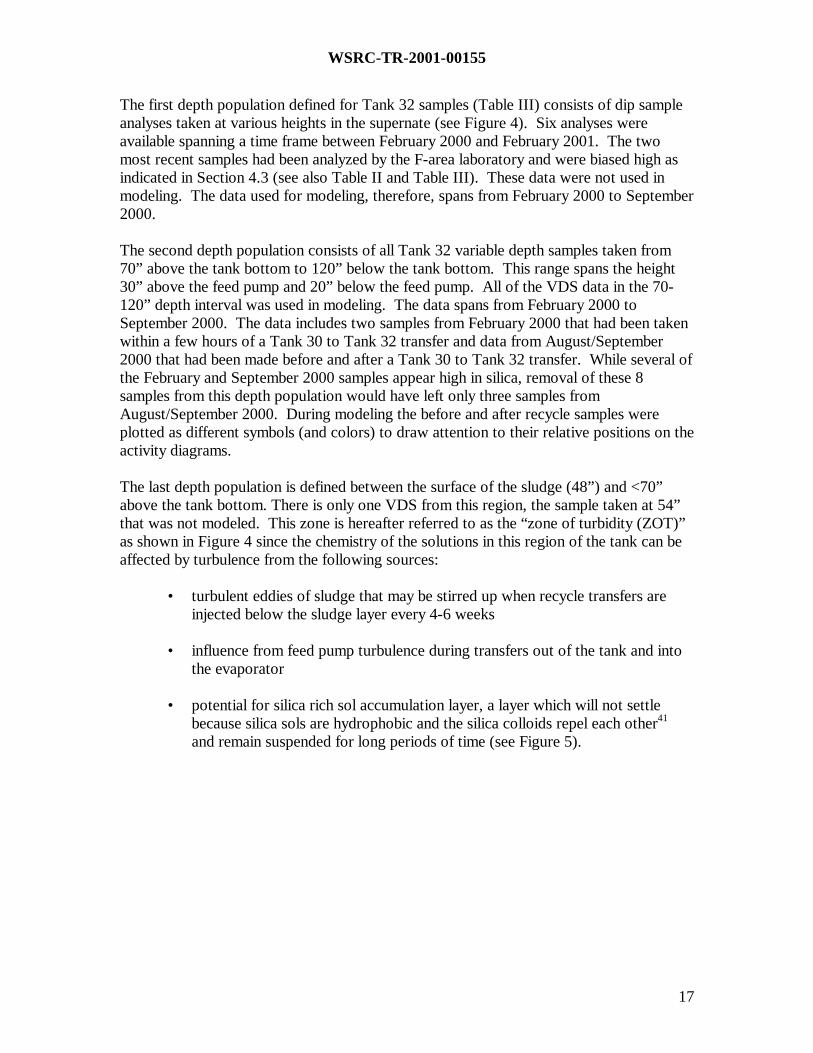
The last depth population is defined between the surface of the sludge (48”) and <70”above the tank bottom. There is only one VDS from this region, the sample taken at 54”that was not modeled. This zone is hereafter referred to as the “zone of turbidity (ZOT)”as shown in Figure 4 since the chemistry of the solutions in this region of the tank can beaffected by turbulence from the following sources:
• turbulent eddies of sludge that may be stirred up when recycle transfers areinjected below the sludge layer every 4-6 weeks
• influence from feed pump turbulence during transfers out of the tank and intothe evaporator
• potential for silica rich sol accumulation layer, a layer which will not settlebecause silica sols are hydrophobic and the silica colloids repel each other41
and remain suspended for long periods of time (see Figure 5).
WSRC-TR-2001-00155
18
SOL
GEL
AMORPHOUSPRECIPITATE
CRYSTALLINEPRECIPITATE
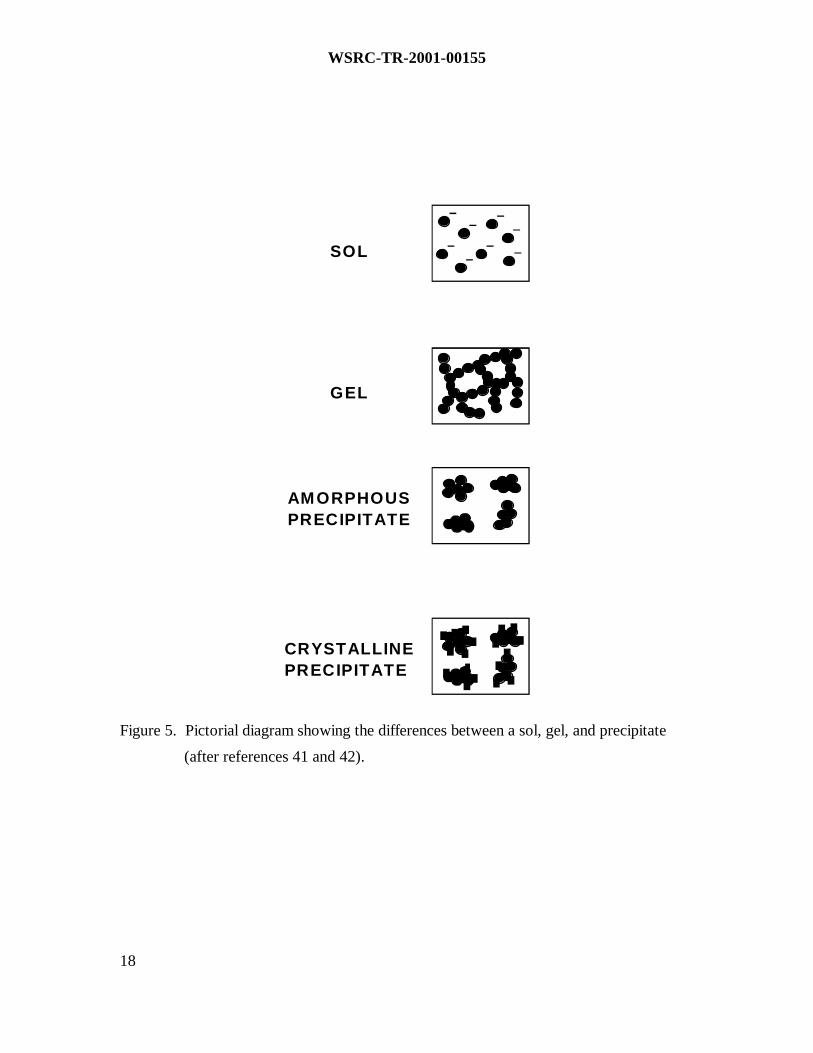
Figure 5. Pictorial diagram showing the differences between a sol, gel, and precipitate
(after references 41 and 42).

WSRC-TR-2001-00155
19
Table II. Transfer and Recycle Frequency and Si Analysis for the SRS 3H Evaporator
Feb2000
Mar2000
Apr2000
May2000(New3HPot)
June2000
July2000
Aug2000
Sept2000
Oct2000
Nov2000
Dec2000
Jan2001
Feb2001
Mar2001
Feed and Recycle Frequency to Tanks 32 (Feed Tank) and 30 (Drop Tank)Trans-
fersintoT32
2/15fromT30
(184,000
gallons)
6/30fromT30
(230,000
gallons)
7/29fromT30
(607,000
gallons)
8/22fromT30
(526,000
gallons)
9/3fromT30
(695,000
gallons)
10/25fromT30
(993,000
gallons)
1/18fromT30
(249,000
gallons)
Ongoing
Trans-fersintoT30
12/5fromT40
(379,000
gallons)Si Analyses (ppm) for Tank 32 (Feed Tank)F-Area 53.4‡ 59‡
SRTC
15.5*‡
18.7‡
16.919.317.4
20.7‡
23.419.420.8
Si Analyses (ppm) for Tank 30 (Drop Tank)F-Area 78.7‡
SRTC 15.5*‡
10.4‡
23.5
12.4‡
9.49.7
‡ Dip samples, remaining are variable depth samples (VDS) as discussed in text*Calculated from minimum detection limit
WSRC-TR-2001-00155
20
Table III. Available Tank 32 Analytic Data Including Si for SRS 3H Evaporator Feed Tank
Date Description/Reference
Height(inchs)
Al(M)
Cl(M)
CO3
(M)F
(M)NO2
(M)NO3
(M)OH(M)
PO4
(M)SO4
(M)Fe
(M)K
(M)Si
(M)U
(M)Na
Calc(M)
NaMeas(M)
wtsalt,g/L
Denscalcg/ml
Densmeasg/ml
Dip Samples (Tank surface)02/15/01 200138614 dip 0.76 0.01 0.02 0.01 1.83 1.76 4.56 0.01 0.01 2.37E-04 0.05 2.10E-03 1.56E-05 8.96 554.49 1.37 1.4512/5/00 200125277 dip 0.85 0.01 0.02 0.01 1.86 2.82 4.86 0.01 0.02 2.37E-04 0.05 1.90E-03 1.93E-05 10.46 671.20 1.44 1.4309/4/00 surface dip* 250 0.79 0.01 0.02 0.01 1.44 3.42 4.86 0.01 0.02 1.43E-05 0.05 7.37E-04 1.85E-05 10.57 10.57 684.80 1.44 1.3808/21/00 surface dipt 209 0.53 0.01 0.02 0.01 0.84 1.39 4.45 0.01 0.02 5.66E-04 0.05 6.68E-04 1.85E-05 7.26 7.26 423.42 1.31 1.3402/1/00 TK32H-S1t dip 0.56 0.01 0.02 0.01 1.05 1.62 3.37 0.01 0.02 1.81E-04 0.05 5.70E-04 1.22E-05 6.66 6.66 417.92 1.28 1.2802/1/00 TK32H-S1t dip 0.57 0.01 0.02 0.01 1.07 1.66 3.46 0.01 0.02 1.86E-04 0.05 5.70E-04 1.18E-05 6.83 6.83 428.75 1.29 1.28
Average 0.61 0.01 0.02 0.01 1.10 2.02 4.04 0.01 0.02 2.37E-04 0.05 6.36E-04 1.52E-05 7.83 7.83 488.72 1.33 1.36Variable Depth Samples 70-120” From Tank Bottom In Vicinity of Feed Pump (89" From Bottom)09/4/00 120"* 120 0.80 0.01 0.02 0.01 1.57 2.91 5.15 0.01 0.02 5.91E-04 0.05 8.33E-04 2.45E-05 10.48 10.48 663.34 1.44 14609/4/00 90"* 90 0.35 0.01 0.02 0.01 1.24 3.24 4.17 0.01 0.02 3.56E-04 0.05 6.91E-04 9.71E-04 9.06 9.06 577.79 1.38 1.4009/4/00 70"* 70 0.73 0.01 0.02 0.01 1.25 3.13 4.23 0.01 0.02 2.19E-03 0.05 7.39E-04 2.83E-05 6.29 9.40 615.64 1.39 1.4008/21/00 120"t 120 0.62 0.01 0.02 0.01 0.95 1.74 5.21 0.01 0.02 5.00E-04 0.05 6.00E-04 1.45E-05 8.57 8.57 501.59 1.36 1.3408/21/00 90"t 90 0.63 0.01 0.02 0.01 1.06 1.82 5.00 0.01 0.02 3.19E-04 0.05 6.87E-04 9.71E-04 8.57 8.57 509.72 1.36 1.3308/21/00 70"t 70 0.62 0.01 0.02 0.01 0.95 1.75 5.24 0.01 0.02 4.15E-04 0.05 6.20E-04 1.54E-05 5.68 8.61 504.14 1.36 1.3402/1/00 TK32H-S1** 89 0.56 0.01 0.02 0.01 0.92 2.00 3.69 0.01 0.02 2.51E-04 0.05 9.83E-04 1.60E-05 7.22 7.22 454.21 1.30 1.3002/1/00 TK32H-S1** 89 0.52 0.01 0.02 0.01 0.86 1.88 3.47 0.01 0.02 3.31E-04 0.05 9.04E-04 1.51E-05 6.79 6.79 426.46 1.29 1.27
Average 0.61 0.01 0.02 0.01 1.10 2.31 4.52 0.01 0.02 6.20E-04 0.05 7.57E-04 2.57E-04 8.59 8.59 531.61 1.36 1.36Variable Depth Samples Below Feed Pump (<70”) But Above the Sludge Layer (48" From Bottom)08/21/00 54"t 54 0.62 0.01 0.02 0.01 0.80 2.00 2.70 0.01 0.02 2.00E-02 0.05 1.11E-02 1.82E-04 6.22 7.31 373.64 1.26 1.3802/1/00 TK32H-VDS-1 unknown 0.57 0.01 0.02 0.01 0.88 1.62 3.70 0.01 0.02 4.08E-03 0.05 2.39E-04 1.22E-05 6.83 6.83 382.11 1.43 1.3702/1/00 TK32H-VDS-3 unknown 0.65 0.01 0.02 0.01 1.34 2.47 5.66 0.01 0.02 3.35E-03 0.05 2.78E-04 1.34E-05 10.18 10.18 568.70 1.29 1.28Historic Samples11/24/92 199674 dip 0.35 0.01 0.01 0.01 1.24 3.2 1.8 0.01 0.06 3.58E-06 0.01 2.14E-05 1.07E-05 6.76 459.59 1.28 1.29
* = after recycle of Tank 30 to 32; t = before recycle of Tank 30 to 32; ** = within a few hours after recycle of Tank 30 to Tank 32 at height of the feed pump(89”). Notes: data indicated in cyan was not used in modeling (see text); data indicated in gray was recalculated to match the measured and calculated Na+
concentrations; data indicated in yellow was missing data that was estimated from historic measurements; data indicated in green is a calculated Na+ that wassubstituted for a measured Na+ that appeared to be in error; magenta values for Na+ molarities are calculated based on adjustments to the OH-, NO3
-, and NO2-
and are shown to agree well with the measured Na concentrations; of Si(M) for 02/01/00 dip samples are calculated from the Si detection limit of the analysis
WSRC-TR-2001-00155
21
Table IV. Available Tank 30 Analytic Data Including Si for SRS 3H Evaporator Drop Tank
Date Description/Reference
Height(inchs)
Al(M)
Cl(M)
CO3
(M)F
(M)NO2
(M)NO3
(M)OH(M)
PO4
(M)SO4
(M)Fe
(M)K
(M)Si
(M)U
(M)Na
Calc(M)
NaMeas(M)
wtsalt,g/L
Denscalcg/ml
Densmeasg/ml
Dip (Tank surface) and Variable Depth Supernate Samples12/01/00 200125276 surface 0.74 0.01 0.02 0.01 2.09 3.03 4.44 0.01 0.02 5.59E-04 0.06 2.80E-03 3.11E-05 10.36 674.61 1.43 1.47
12/01/00 1of 3nonroutine
240 0.80 0.01 0.02 0.01 1.33 2.83 4.99 0.01 0.02 4.87E-03 0.06 3.44E-04 6.60E-05 10.00 634.45 1.42 1.44
12/01/00 2 of 3nonroutine
200 0.79 0.01 0.02 0.01 1.35 2.85 4.96 0.01 0.02 3.68E-04 0.06 3.35E-04 4.30E-05 10.00 635.14 1.42 1.14
12/01/00 3 of 3nonrouting(surface)
170 0.79 0.01 0.02 0.01 1.40 2.80 5.05 0.01 0.02 5.59E-04 0.06 4.41E-04 2.00E-05 10.09 637.60 1.42 1.08
08/21/00 Tk30H-S2 179 0.79 0.01 0.02 0.01 1.39 2.95 5.17 0.01 0.02 3.65E-04 0.06 8.35E-04 4.37E-05 10.35 10.35 654.70 1.43 1.41
08/21/00 Tk30H-S1 348 0.79 0.01 0.02 0.01 1.66 2.79 4.54 0.01 0.02 5.55E-04 0.06 3.69E-04 1.77E-05 9.83 9.83 634.02 1.41 1.40
02/01/00 Tk30H-S1 surface 0.66 0.01 0.02 0.01 1.62 2.72 4.43 0.01 0.02 2.63E-04 0.06 5.52E-04 1.95E-05 9.48 9.48 605.54 1.40 1.37
02/01/00 Tk30H-S2 surface 0.60 0.01 0.02 0.01 1.91 3.20 5.20 0.01 0.02 4.40E-04 0.06 5.62E-04 1.53E-05 10.96 10.96 690.23 1.46 1.38
02/01/00 Tk30H-VDS unknown 0.64 0.01 0.02 0.01 1.31 2.78 4.87 0.01 0.02 8.67E-04 0.06 6.41E-04 2.23E-05 9.66 9.66 605.12 1.40 1.34
Average 0.73 0.01 0.02 0.01 1.50 2.86 4.90 0.01 0.02 1.04E-03 0.06 4.97E-04 3.09E-05 10.05 10.06 637.10 1.42 1.21
Salt Samples8/21/00 VDS-Salt 8 0.80 0.01 0.02 0.01 1.99 4.23 7.46 0.01 0.02 4.84E-03 0.06 1.43E-03 6.60E-05 14.53 14.53 897.71 1.60 1.68
Historic Samples11/24/92 199672 dip 0.36 0.02 0.42 0.01 1.16 2.98 3.64 0.01 0.07 3.58E-06 0.04 2.55E-04 1.73E-05 9.14 9.1 579.77 1.38 1.36
Notes: data indicated in cyan was not used in modeling (see text); data indicated in gray was recalculated to match the measured and calculated Na+
concentrations; data indicated in yellow was missing data that had to be estimated from historic measurements; data indicated in red appeared to beinconsistent density measurements and the calculated density was used preferentially; magenta values for Na+ molarities are calculated based on adjustments tothe OH-, NO3
-, and NO2- and are shown to agree well with the measured Na concentrations; values of Si(M) for 02/01/00 dip samples are calculated from the Si
detection limit of the analysis
WSRC-TR-2001-00155
22
Table V. Tank 32 Modeling Data for SRS 3H Evaporator Feed Tank
Date Description/Reference
Height(inchs)
Al(m)
Cl(m)
CO3
(m)F
(m)NO2
(m)NO3
(m)OH(m)
PO4
(m)SO4
(m)Fe(m)
K(m)
Si(m)
U(m)
NaCalc(m)
NO2+NO3
(m)Dip Samples (Tank surface)09/4/00 surface dip* 250 1.04E+00 1.55E-02 2.32E-02 7.07E-03 1.91E+00 4.53E+00 6.43E+00 1.06E-02 2.00E-02 1.89E-05 6.81E-02 9.75E-04 2.44E-05 1.40E+01 6.43E+00
08/21/00 surface dipt 209 5.95E-01 1.33E-02 1.99E-02 6.05E-03 9.45E-01 1.57E+00 5.04E+00 9.11E-03 1.71E-02 6.40E-04 5.83E-02 7.55E-04 2.09E-05 8.22E+00 2.52E+00
02/1/00 TK32H-S1t dip 6.47E-01 1.36E-02 2.03E-02 6.19E-03 1.21E+00 1.87E+00 3.90E+00 9.31E-03 1.75E-02 2.09E-04 5.96E-02 6.59E-04 1.41E-05 7.70E+00 3.08E+00
02/1/00 TK32H-S1t dip 6.67E-01 1.36E-02 2.04E-02 6.21E-03 1.25E+00 1.93E+00 4.02E+00 9.35E-03 1.75E-02 2.16E-04 5.98E-02 6.62E-04 1.37E-05 7.93E+00 3.18E+00
Average 7.27E-01 1.40E-02 2.09E-02 6.36E-03 1.31E+00 2.40E+00 4.80E+00 9.57E-03 1.79E-02 2.81E-04 6.12E-02 7.56E-04 1.81E-05 9.31E+00 3.71E+00
Variable Depth Samples 70-120” From Tank Bottom In Vicinity of Feed Pump (89" From Bottom)09/4/00 120"* 120 1.04E+00 1.52E-02 2.27E-02 6.91E-03 2.02E+00 3.76E+00 6.65E+00 1.04E-02 1.95E-02 7.63E-04 6.65E-02 1.08E-03 3.17E-05 1.35E+01 5.78E+00
09/4/00 90"* 90 4.39E-01 1.46E-02 2.19E-02 6.66E-03 1.54E+00 4.05E+00 5.20E+00 1.00E-02 1.88E-02 4.44E-04 6.42E-02 8.60E-04 1.21E-03 1.13E+01 5.59E+00
09/4/00 70"* 70 9.43E-01 1.51E-02 2.26E-02 6.88E-03 1.61E+00 4.02E+00 5.43E+00 1.03E-02 1.94E-02 2.82E-03 6.62E-02 9.49E-04 3.64E-05 1.21E+01 5.63E+00
08/21/00 120"t 120 7.21E-01 1.37E-02 2.04E-02 6.23E-03 1.10E+00 2.02E+00 6.07E+00 9.38E-03 1.76E-02 5.82E-04 6.00E-02 6.99E-04 1.69E-05 9.98E+00 3.13E+00
08/21/00 90"t 90 7.41E-01 1.38E-02 2.06E-02 6.29E-03 1.25E+00 2.14E+00 5.88E+00 9.47E-03 1.78E-02 3.75E-04 6.06E-02 8.08E-04 1.14E-03 1.01E+01 3.39E+00
08/21/00 70"t 70 7.26E-01 1.37E-02 2.05E-02 6.24E-03 1.11E+00 2.03E+00 6.10E+00 9.39E-03 1.76E-02 4.84E-04 6.00E-02 7.22E-04 1.80E-05 1.00E+01 3.14E+00
02/1/00 TK32H-S1** 89 6.62E-01 1.38E-02 2.06E-02 6.28E-03 1.08E+00 2.35E+00 4.33E+00 9.46E-03 1.77E-02 2.94E-04 6.05E-02 1.15E-03 1.88E-05 8.48E+00 3.42E+00
02/1/00 TK32H-S1** 89 6.02E-01 1.36E-02 2.04E-02 6.21E-03 1.00E+00 2.18E+00 4.02E+00 9.34E-03 1.75E-02 3.84E-04 5.98E-02 1.05E-03 1.76E-05 7.88E+00 3.18E+00
Average 7.30E-01 1.42E-02 2.12E-02 6.45E-03 1.33E+00 2.78E+00 5.45E+00 9.71E-03 1.82E-02 7.47E-04 6.21E-02 9.13E-04 3.10E-04 1.04E+01 4.11E+00
Historic Samples11/24/92 199674 dip 4.23E-01 1.21E-02 1.21E-02 1.21E-02 1.50E+00 3.87E+00 2.18E+00 1.21E-02 7.25E-02 4.33E-06 2.30E-02 2.58E-05 1.30E-05 8.17E+00 5.37E+00
* after recycle of Tank 30 to 32 t before recycle of Tank 30 to 32** within a few hours after recycle of Tank 30 to Tank 32 at depth of the feed pump (89”)m = molal (mole/Kg H2O)
WSRC-TR-2001-00155
23
Table VI. Tank 30 Modeling Data for SRS 3H Evaporator Drop Tank
Date Description/Reference
Height(inchs)
Al(m)
Cl(m)
CO3
(m)F
(m)NO2
(m)NO3
(m)OH(m)
PO4
(m)SO4
(m)Fe(m)
K(m)
Si(m)
U(m)
NaCalc(m)
NO2+NO3
(m)Recent Samples12/01/00 1of 3
nonroutine240 1.03E+00 1.90E-02 1.95E-02 6.76E-03 1.70E+00 3.61E+00 6.36E+00 1.16E-02 2.03E-02 6.22E-03 7.79E-02 4.38E-04 8.42E-05 1.28E+01 5.30E+00
12/01/00 2 of 3nonroutine
200 1.01E+00 1.90E-02 1.95E-02 6.77E-03 1.73E+00 3.64E+00 6.33E+00 1.16E-02 2.03E-02 4.70E-04 7.79E-02 4.27E-04 5.49E-05 1.28E+01 5.37E+00
12/01/00 3 of 3nonroutine(surface)
170 1.01E+00 1.90E-02 1.95E-02 6.76E-03 1.79E+00 3.58E+00 6.44E+00 1.16E-02 2.03E-02 7.13E-04 7.78E-02 5.63E-04 2.55E-05 1.29E+01 5.36E+00
08/21/00 Tk30H-S2 179 1.02E+00 1.92E-02 1.97E-02 6.82E-03 1.79E+00 3.79E+00 6.64E+00 1.17E-02 2.04E-02 4.70E-04 7.85E-02 1.07E-03 5.62E-05 1.33E+01 5.59E+00
08/21/00 Tk30H-S1 348 1.02E+00 1.92E-02 1.97E-02 6.82E-03 2.14E+00 3.59E+00 5.84E+00 1.17E-02 2.05E-02 7.14E-04 7.85E-02 4.74E-04 2.28E-05 1.27E+01 5.73E+00
02/01/00 Tk30H-S1 surface 8.29E-01 1.88E-02 1.93E-02 6.70E-03 2.05E+00 3.44E+00 5.60E+00 1.15E-02 2.01E-02 3.33E-04 7.71E-02 6.97E-04 2.47E-05 1.20E+01 5.49E+00
02/01/00 Tk30H-S2 surface 7.88E-01 1.94E-02 2.00E-02 6.91E-03 2.49E+00 4.17E+00 6.79E+00 1.19E-02 2.07E-02 5.75E-04 7.96E-02 7.34E-04 1.99E-05 1.43E+01 6.66E+00
02/01/00 Tk30H-VDS unknown 8.03E-01 1.86E-02 1.91E-02 6.63E-03 1.64E+00 3.48E+00 6.09E+00 1.14E-02 1.99E-02 1.08E-03 7.63E-02 6.77E-04 2.79E-05 1.21E+01 5.13E+00
Average 9.38E-01 1.90E-02 1.95E-02 6.77E-03 1.91E+00 3.66E+00 6.26E+00 1.16E-02 2.03E-02 1.32E-03 7.79E-02 6.35E-04 3.95E-05 1.28E+01 5.57E+00
Historic Samples11/24/92 199672 dip 4.48E-01 2.49E-02 5.23E-01 1.24E-02 1.44E+00 3.71E+00 4.53E+00 1.24E-02 8.71E-02 4.46E-06 4.85E-02 3.18E-04 2.15E-05 1.14E+01 5.15E+00
m = molal (mole/Kg H2O)
WSRC-TR-2001-00155
24
No modeling was performed on samples that were analyzed from the “Zone of Turbidity”so that the data interpretation would not be confounded with analytic sampling fromregions not accessible to the Tank 32 feed pump. For example, Wilmarth extensivelycharacterized two variable depth samples (VDS) taken from Tank 32 in February 2000.36
The height at which the two VDS samples were taken is unknown. The analyses inWilmarth’s report shows that these samples were enriched in Fe and Mn suggesting thatthey were taken close to the surface of the sludge. In addition, the VDS samples taken inAugust 2000 at a height of 54” from the bottom of the tank, only 6 inches above thesludge layer, was highly enriched in Fe (see Table III).37 This sample was also highlyenriched in silica. The data from this sample was not used in modeling.
4.4.2 Tank 30H (Drop Tank)
There is a salt layer in Tank 30 at a depth of ~8”. One incomplete analysis by Wilmarth ofthis sample was not used in the modeling. The remainder of the supernate was consideredto be one chemical population. One sample analyzed in December 2000 by the F-arealaboratory was not used in modeling due to analytic bias as discussed in Section 4.3 andshown in Table IV. The remaining data in Table IV are from the SRTC laboratory andspan the period from February 2000 to December 2000.
5.0 MODELING APPROACH
The molar tank compositions given in Table III and Table IV were converted into molalunits which are the units of preference in the GWB software. The conversion formulatakes the form5
[ ] [ ]∑ρ−ρ
=−+
−+
solutes
M/
m/ i
i
[4]
where [ ]M/i −+ and [ ]m/i −+ are the molar and molal concentrations of ionic species i,
respectively, ρ is the solution density in kg/L, and Σρsolutes is the sum of the partial densitiesof the dissolved solids. The solution density is calculated using Equation 2. For eachionic species, the partial dissolved solids density is the product of its molarity and its ionicweight in g/mole. Ionic weights for the most prevalent species in basic solutions are used.These are Al(OH)4
-, Cl-, CO32-, F-, NO2
-, NO3-, OH-, PO4
3-, SO42-, Fe(OH)4
-, K+, H2SiO42-,
(UO2)3(OH)7-, and Na+. Table V and Table VI reflect the input data in molalities used for
modeling.
There is limited solubility data for amorphous SiO2 and Al(OH)3 in very basic high ionicstrength solutions such as those in the SRS 3H Evaporator. This is discussed in moredetail in Part I.3 Comparison with available SiO2 solubility data in the literature showed
WSRC-TR-2001-00155
25
that the solubility data used in GWB appeared to adequately represent amorphous SiO2
equilibria in basic pH. GWB has the mononuclear silicate species H4SiO4 calledSiO2(aq), H3SiO4
- and H2SiO4
2- of which the H2SiO4
2- species is the most prevalent at pHvalues >13.43 GWB also contains the two most abundant44,43 polynuclear silicate species,the tetrameric H4(H2SiO4)4
4- and H6(H2SiO4)4
2- of which the tetrameric H4(H2SiO4)4
4- is themost prevalent species at pH values >13.43 Polynuclear Si(IV) species are onlysignificant at pH>10 and a total dissolved Si concentrations larger than 10-3M.45 Inaddition, the significance of the polynuclear Si(IV) species tends to decrease withincreasing temperature.46 Since the SRS 3H Evaporator Si concentrations are in the 10-
4M concentration range (Table III and Table IV) and the polynuclear Si(IV) species are ofminimal importance at the elevated evaporator operating temperatures, the absence of theremaining polynuclear Si(IV) species in the GWB database is not considered tosignificantly impact the modeling.
Examination of the gibbsite solubility data in GWB with that in the literature indicatedthat Russell’s47 solubility data at a sodium molality of 8.5 would be more appropriate formodeling at the high ionic strength of the SRS Evaporators. The Russel solubility datafor gibbsite (alpha aluminum trihydrate) and diaspore (alpha aluminum monohydrate)was added to GWB database and designated as “gibbsite-M” and “diaspore-M” todistinguish these modified aluminum hydroxides from the gibbsite and diasporesolubility already in GWB. The Russel gibbsite-M and diaspore-M were used formodeling the SRS 3H Evaporator solutions. The data for the solubility of NaAlO2 andAlO2
-2 of Reynolds and Herting48 were also added to GWB for completeness. Detaileddescriptions of the manner in which the data were added to the GWB database appear inPart I.3
The data of Ejaz22 for the solubility of the NAS gel and Zeolite-A was added to the GWBdatabase as was the data of Gasteiger17 for an amorphous precipitate containing Zeolite-Aand nitrited sodalite, hereafter referred to as “mixed zeolite.” Ejaz measured solubilitiesby dissolving Zeolite-A and NAS gel precipitate in 3.02, 3.32, 3.89, and 4.39 molar NaOHsolutions. Temperatures for the Ejaz measurements were 30°C, 50°C, 65°C, and 80°C.At the highest temperature and concentration, the NAS solubilities decreased significantly.Ejaz attributed this decrease to crystallization of zeolites from solution. Ejaz’s data for theNAS gel and Zeolite-A were extrapolated to a sodium molarity of 8.5 appropriate to theSRS evaporator solutions. This extrapolation is discussed in greater detail in Part I.3
Gasteiger measured mixed zeolite solubilities by observing rates of precipitation from“green liquor” solutions that were supersaturated with aluminates and silicates. (“Greenliquor” is a term from the pulp and paper industry that describes solutions that dissolvewood pulp). Green liquor is a basic solution that contains sodium carbonates, sodiumsulfides, and a small amount of sodium sulfates.) The Gasteiger measurements wererestricted to one temperature, 95°C, so it was not possible to determine an activationenergy for the variation of solubility with temperature. In the absence of this information,the measured mixed zeolite solubility at 95°C was combined with the activation energy forthe NAS gel. A comparison of activity diagrams for NAS gel and Gasteiger’s mixedzeolite justifies the substitution of the NAS gel activation energy. This comparisonshowed that the NAS gel and the mixed zeolites had nearly identical aluminate and silicate
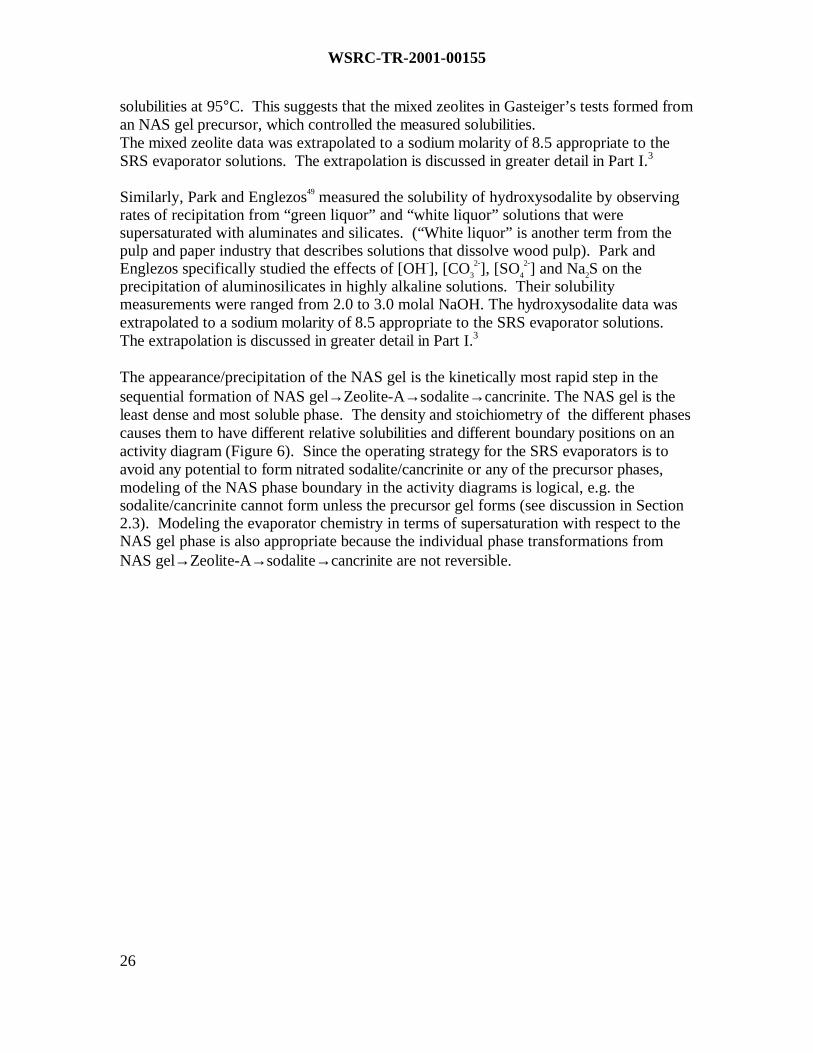
WSRC-TR-2001-00155
26
solubilities at 95°C. This suggests that the mixed zeolites in Gasteiger’s tests formed froman NAS gel precursor, which controlled the measured solubilities.The mixed zeolite data was extrapolated to a sodium molarity of 8.5 appropriate to theSRS evaporator solutions. The extrapolation is discussed in greater detail in Part I.3
Similarly, Park and Englezos49 measured the solubility of hydroxysodalite by observingrates of recipitation from “green liquor” and “white liquor” solutions that weresupersaturated with aluminates and silicates. (“White liquor” is another term from thepulp and paper industry that describes solutions that dissolve wood pulp). Park andEnglezos specifically studied the effects of [OH-], [CO3
2-], [SO4
2-] and Na2S on theprecipitation of aluminosilicates in highly alkaline solutions. Their solubilitymeasurements were ranged from 2.0 to 3.0 molal NaOH. The hydroxysodalite data wasextrapolated to a sodium molarity of 8.5 appropriate to the SRS evaporator solutions.The extrapolation is discussed in greater detail in Part I.3
The appearance/precipitation of the NAS gel is the kinetically most rapid step in thesequential formation of NAS gel→Zeolite-A→sodalite→cancrinite. The NAS gel is theleast dense and most soluble phase. The density and stoichiometry of the different phasescauses them to have different relative solubilities and different boundary positions on anactivity diagram (Figure 6). Since the operating strategy for the SRS evaporators is toavoid any potential to form nitrated sodalite/cancrinite or any of the precursor phases,modeling of the NAS phase boundary in the activity diagrams is logical, e.g. thesodalite/cancrinite cannot form unless the precursor gel forms (see discussion in Section2.3). Modeling the evaporator chemistry in terms of supersaturation with respect to theNAS gel phase is also appropriate because the individual phase transformations fromNAS gel→Zeolite-A→sodalite→cancrinite are not reversible.
WSRC-TR-2001-00155
27
SODALITE-OH
MIXEDZEOLITE
-12 -11 -10 -9 -8 -7 -610
11
12
13
14
15
16
log a SiO2(aq)
æ
NaAlO2(c)
GIBBSITE-M
NAS
80°C
ZEOLITE-Alo
g a
Al (
OH
) 4- /
H+
Figure 6. Relative Stability Boundaries of NAS gel, “mixed zeolite,” Zeolite-A andhydroxysodalite.
The first step in preparing activity diagrams is to enter the average molal concentrationof the ionic species for each set of measured tank chemistries in a given depth populationinto the GWB REACT subroutine. Equilibrium with air is specified by specifying theoxygen fugacity of air as input. This allows the oxidation states of iron, uranium, nitrate,etc to be speciated for solutions in equilibrium with air in the calculations. REACToutputs the pertinent activities of all ionic species. To account for mineral equilibriumunder supersaturated conditions, no minerals are allowed to precipitate during theREACT calculation. The activities calculated in REACT from the solutionconcentrations are then used in the ACT2 subroutine to calculate the activity diagrams.This ensures that individual data points from each population are plotted on the activitydiagram calculated from their pooled average chemistry. The approach is discussed indetail in Part I.3
WSRC-TR-2001-00155
28
6.0 ACTIVITY DIAGRAMS FOR THE SRS 3H EVAPORATOR
Activity diagrams were generated at 25°C, which represents the temperature at which thetank solutions were analyzed. In order to evaluate the solution equilibria at the elevatedtemperature (40°C) of the feed and drop tanks, the solution temperature wasincrementally increased, using the polythermal reaction option in GWB. Separatecalculations were performed to generate activity diagrams at the estimated evaporatortemperature of 140°C. These calculations simulated evaporation by a stepwise removalof 40% of the water from the solution. This amount of evaporation changes the solutiondensity from about 1.4 g/cm3 to about 1.6 g/cm3, the latter number being the operationaltarget density for the 3H Evaporator.
6.1 Activity Diagrams at the Solution Measurement Temperature
Activity diagrams were generated at 25°C which represents the equilibrium at thetemperature at which the tank solutions were analyzed. At ambient temperature the NASgel phase and gibbsite, Al(OH)3, and NaAlO2•1.25 H2O are the stable solid phases. Notethat Al(OH)3 is not found to precipitate in the evaporator as the evaporator residencetimes are too short compared to the kinetic formation time of gibbsite. However, theNAS gel is in equilibrium with Al(OH)3 in solution and/or amorphous Al(OH)3. TheNaAlO2•1.25 H2O phase is found in the SRS salt deposits, otherwise, the NaAlO2 is partof the dissolved solids in the tank solutions. At the elevated temperatures in theevaporator, denser aluminate phases such as diaspore (AlOOH) are stable rather thangibbsite and a mixed zeolite phase (partially crystallized with respect to sodalite/cancrinite)will likely be more stable than the NAS gel. The kinetics of diaspore formation in theevaporator are also kinetically slow and it is precluded from precipitating during the shortevaporator residence times.
The silica data from Wilmarth’s various studies36,37, 38 was used preferentially to the F-Area silica data in the modeling of the SRS 3H Evaporator. Figure 7 demonstrates howthe usage of biased silicon analyses can impact evaporator modeling, e.g. the data from F-Area laboratory would indicate that the SRS 2H Evaporator samples are closer to theNAS boundary than the SRTC data although both sets of data indicate that the solutionsare in steady state equilibrium with Al(OH)3. The data plotted in Figure 7 is the surfacedip sample population in the Tank 32 feed tank. The F-area laboratory data is in the 53-59ppm Si range (Table II) while the SRTC data is in the 20 ppm Si range (Table II). Thesource of this bias is discussed in Section 4.3.
The solubility data of Russell47 for Al(OH)3 was used in the modeling of the SRS 3HEvaporator rather than the Al(OH)3 data in GWB. The position of the stability fieldboundary between gibbsite and NAS changes very little when the solubility data in GWBis used (see dashed lines in Figure 8a) instead of the Russell47 data which was obtainedfrom solutions at 8.5 molal Na at 25°C. However, at 140°C, the position of the stabilityfield boundary between AlOOH (diaspore) and NAS changes by about an order of
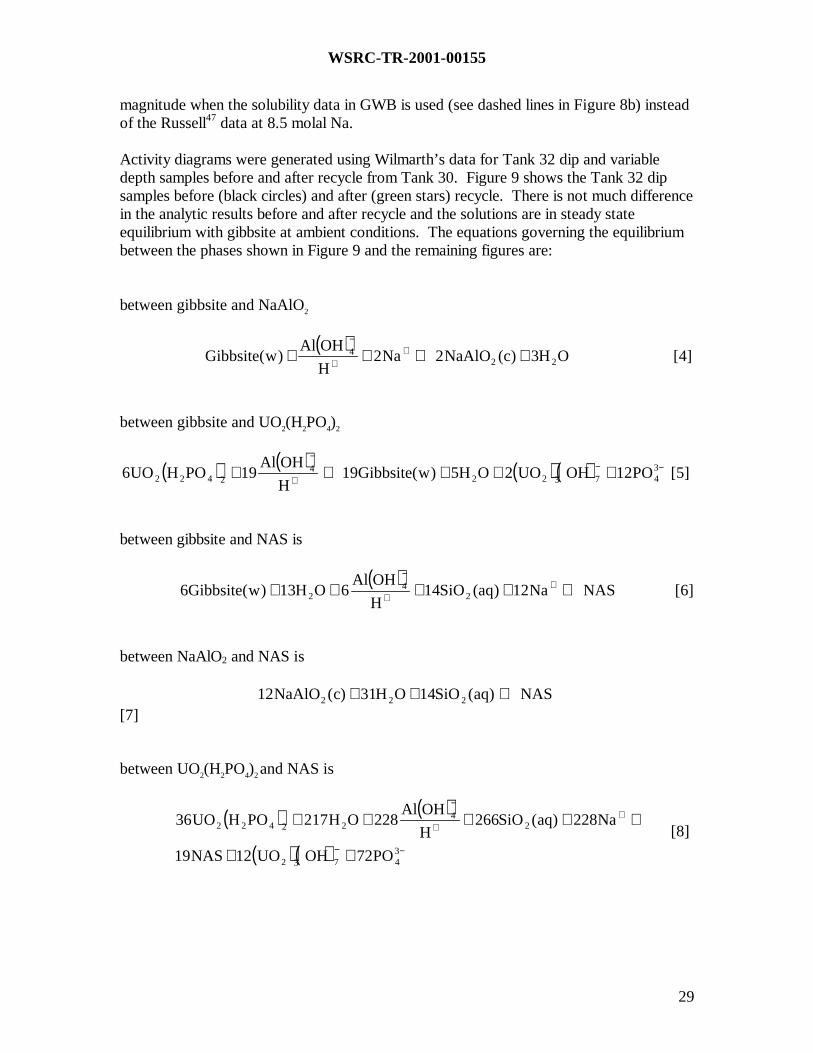
WSRC-TR-2001-00155
29
magnitude when the solubility data in GWB is used (see dashed lines in Figure 8b) insteadof the Russell47 data at 8.5 molal Na.
Activity diagrams were generated using Wilmarth’s data for Tank 32 dip and variabledepth samples before and after recycle from Tank 30. Figure 9 shows the Tank 32 dipsamples before (black circles) and after (green stars) recycle. There is not much differencein the analytic results before and after recycle and the solutions are in steady stateequilibrium with gibbsite at ambient conditions. The equations governing the equilibriumbetween the phases shown in Figure 9 and the remaining figures are:
between gibbsite and NaAlO2
( )
OH3)c(NaAlO2Na2H
OHAl)w(Gibbsite 22
4 +⇔++ ++
−
[4]
between gibbsite and UO2(H2PO4)2
( ) ( ) ( ) ( ) −−+
−
+++⇔+ 347322
42422 PO12OHUO2OH5)w(Gibbsite19
H
OHAl19POHUO6 [5]
between gibbsite and NAS is
( )
NASNa12)aq(SiO14H
OHAl6OH13)w(Gibbsite6 2
42 ⇔++++ +
+
−
[6]
between NaAlO2 and NAS is
NAS)aq(SiO14OH31)c(NaAlO12 222 ⇔++[7]
between UO2(H2PO4)2 and NAS is
( ) ( )
( ) ( ) −−
++
−
++
⇔++++
34732
24
22422
PO72OHUO12NAS19
Na228)aq(SiO266H
OHAl228OH217POHUO36
[8]
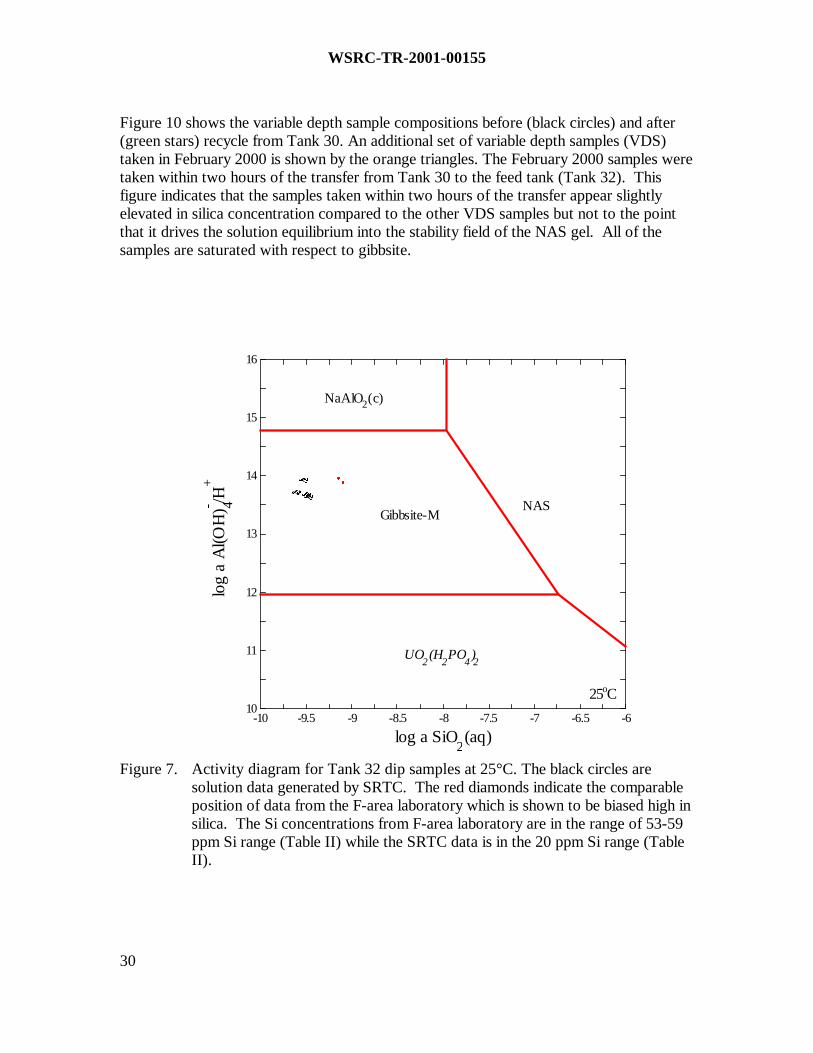
WSRC-TR-2001-00155
30
Figure 10 shows the variable depth sample compositions before (black circles) and after(green stars) recycle from Tank 30. An additional set of variable depth samples (VDS)taken in February 2000 is shown by the orange triangles. The February 2000 samples weretaken within two hours of the transfer from Tank 30 to the feed tank (Tank 32). Thisfigure indicates that the samples taken within two hours of the transfer appear slightlyelevated in silica concentration compared to the other VDS samples but not to the pointthat it drives the solution equilibrium into the stability field of the NAS gel. All of thesamples are saturated with respect to gibbsite.
-10 -9.5 -9 -8.5 -8 -7.5 -7 -6.5 -610
11
12
13
14
15
16
log a SiO2(aq)
log
a A
l(OH
) 4- /H+ é
éæ
æææ
UO2(H
2PO
4)2
NaAlO2(c)
Gibbsite-MNAS
25oC
Figure 7. Activity diagram for Tank 32 dip samples at 25°C. The black circles aresolution data generated by SRTC. The red diamonds indicate the comparableposition of data from the F-area laboratory which is shown to be biased high insilica. The Si concentrations from F-area laboratory are in the range of 53-59ppm Si range (Table II) while the SRTC data is in the 20 ppm Si range (TableII).
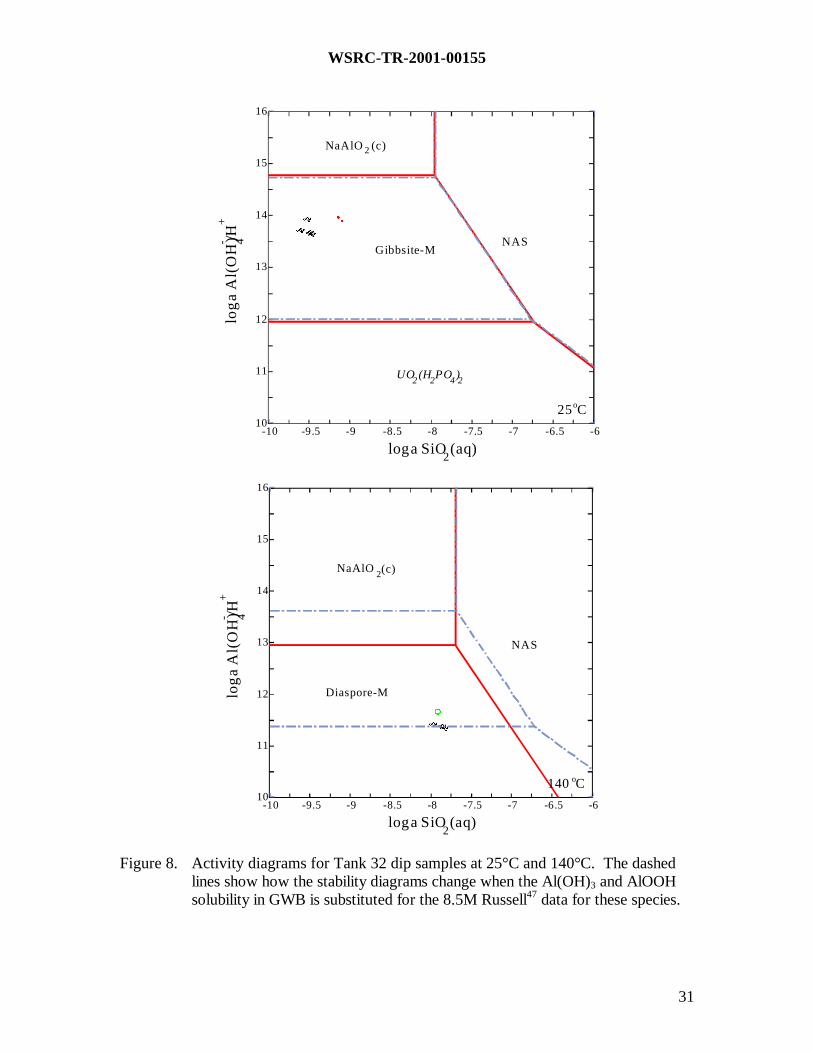
WSRC-TR-2001-00155
31
-10 -9.5 -9 -8.5 -8 -7.5 -7 -6.5 -610
11
12
13
14
15
16
log a SiO2(aq)
log
a A
l(O
H) 4- /H
+ ééæ
æææ
UO2 (H2PO4)2
NaAlO 2 (c)
Gibbsite-MNAS
25oC
-10 -9.5 -9 -8.5 -8 -7.5 -7 -6.5 -610
11
12
13
14
15
16
log a SiO2(aq)
log
a A
l(O
H) 4- /H
+
�
æææ
NaAlO 2(c)
Diaspore-M
NAS
140 oC
Figure 8. Activity diagrams for Tank 32 dip samples at 25°C and 140°C. The dashedlines show how the stability diagrams change when the Al(OH)3 and AlOOHsolubility in GWB is substituted for the 8.5M Russell47 data for these species.

WSRC-TR-2001-00155
32
-10 -9.5 -9 -8.5 -8 -7.5 -7 -6.5 -610
11
12
13
14
15
16
log a SiO2(aq)
log
a A
l(OH
) 4- /H+ �
æææ
UO2(H
2PO
4)2
NaAlO2(c)
Gibbsite-MNAS
25oC
Figure 9 Activity diagram for Tank 32 dip samples at 25°C before and after recyclefrom Tank 30. The black circles are solution data before recycle and the greenstar is the solution data after recycle.

WSRC-TR-2001-00155
33
-10 -9.5 -9 -8.5 -8 -7.5 -7 -6.5 -610
11
12
13
14
15
16
log a SiO2(aq)
log
a A
l(OH
) 4- /H+ �
�
ææ �æ
��
UO2(H
2PO
4)2
NaAlO2(c)
Gibbsite-MNAS
25oC
Figure 10. Activity diagram for Tank 32 variable depth samples at 25°C before and afterrecycle from Tank 30. The black circles are solution data before recycle. Thegreen stars are the solution data after recycle from Tank 30. The orangetriangles are the samples from February 2000 that were taken at the height ofthe feed pump only a few hours after recycle from Tank 30 to Tank 32.
For completeness, the activity diagram for Tank 30 at 25°C (Figure 11) was generated.Figure 11 indicates that the solutions in Tank 30 are not in the stability field of the NASgel but are saturated with respect to gibbsite. The average composition of the solutionsfrom Tank 30 (from Table II) that were used to generate the activity diagram boundaries.
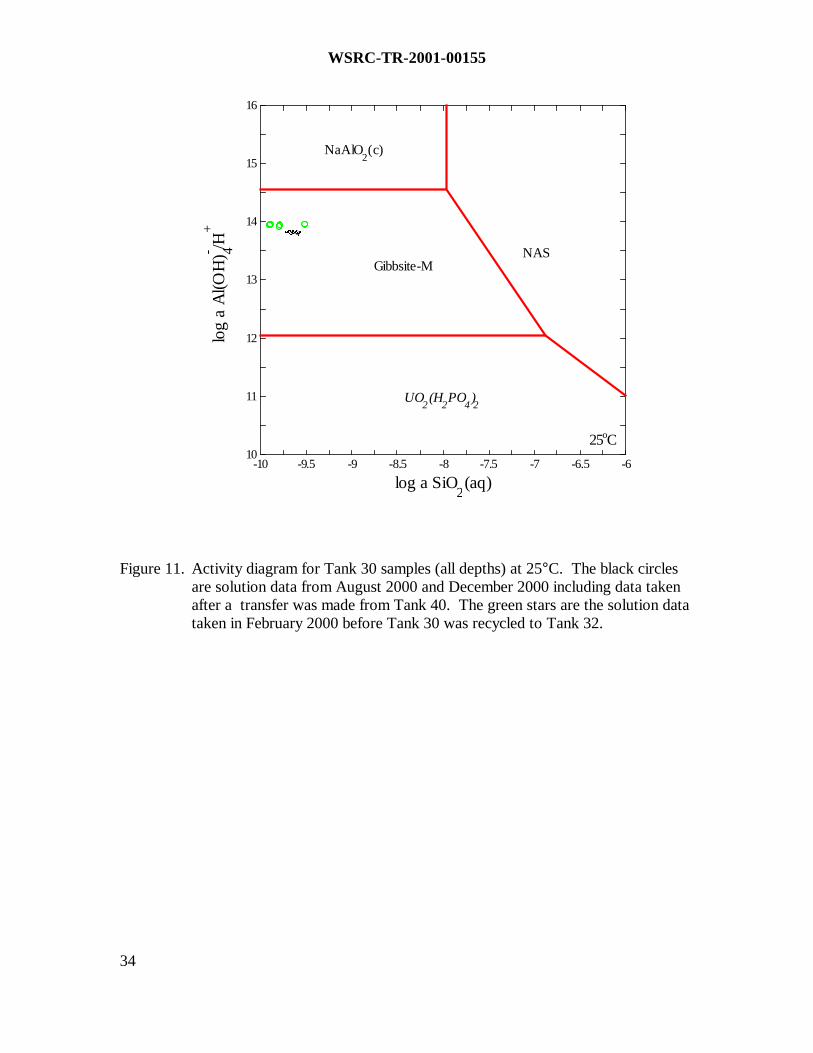
WSRC-TR-2001-00155
34
-10 -9.5 -9 -8.5 -8 -7.5 -7 -6.5 -610
11
12
13
14
15
16
log a SiO2(aq)
log
a A
l(OH
) 4- /H+ ��
ææ��
æ�
UO2(H
2PO
4)2
NaAlO2(c)
Gibbsite-MNAS
25oC
Figure 11. Activity diagram for Tank 30 samples (all depths) at 25°C. The black circlesare solution data from August 2000 and December 2000 including data takenafter a transfer was made from Tank 40. The green stars are the solution datataken in February 2000 before Tank 30 was recycled to Tank 32.

WSRC-TR-2001-00155
35
6.2 Activity Diagrams at the Tank Temperature
Activity diagrams were generated at the nominal temperature (40°C) of the SRS 3Hevaporator feed and drop tanks using the polythermal reaction option in GWB. Theactivity diagram shown in Figure 12 and Figure 13 indicate the dip and variable depthsamples from Tank 32 (the feed tank) are in the stability field of gibbsite at the nominaltank temperatures. Figure 13 indicates that the samples taken within a few hours of thetransfer from Tank 30 (the orange triangles) appear elevated in silica concentration but notto the point that it drives the solution equilibrium out of the gibbsite stability field and intothe stability field of the NAS gel. Likewise Figure 14 indicates that the samples fromvarious depths in Tank 30 (the drop tank) are in steady state equilibrium with gibbsite.Hence, neither the NAS gel, Zeolite-A, nor nitrated cancrinite/sodalite are anticipated toform in the SRS 3H Evaporator feed and drop tanks. Historic data for the feed tank (Tank32) and the drop tank (Tank 30) from 1992 are shown for comparison in Figure 12 andFigure 14.
-11 -10.5 -10 -9.5 -9 -8.5 -8 -7.5 -710
11
12
13
14
15
16
log a SiO2(aq)
log
a A
l(OH
) 4- /H+
�
æææ
�
UO2(H
2PO
4)2
NaAlO2(c)
Gibbsite-M
NAS
40oC
Figure 12. Activity diagram for dip sample (surface sample) compositions in Tank 32(feed tank) at 40°C. Black circles represent the solution analyses beforerecycle from Tank 30 and the green star represents the solution analysis afterrecycle from Tank 30. The red triangle represents historic data from 1992.

WSRC-TR-2001-00155
36
-10 -9.5 -9 -8.5 -8 -7.5 -7 -6.5 -610
11
12
13
14
15
16
log a SiO2(aq)
log
a A
l(OH
) 4- /H+
�
�
ææ �æ
��
UO2(H2PO4)2
NaAlO2(c)
Gibbsite-M NAS
40oC
Figure 13. Activity diagram for variable depth sample compositions in Tank 32 (feedtank) at 40°C. The black circles are solution data before recycle from Tank30. The green stars are the solution data after recycle from Tank 30. Theorange triangles are the samples from February 2000 that were taken at theheight of the feed pump only a few hours after recycle from Tank 30 to Tank32.

WSRC-TR-2001-00155
37
-10 -9.5 -9 -8.5 -8 -7.5 -7 -6.5 -610
11
12
13
14
15
16
log a SiO2(aq)
log
a A
l(OH
) 4- /H+
��ææ
��æ�
�
UO2(H2PO4)2
NaAlO2(c)
Gibbsite-M NAS
40oC
Figure 14. Activity diagram for Tank 30 samples (all depths) at 40°C. The black circlesare solution data from August 2000 and December 2000 including data takenafter a transfer was made from Tank 40. The green stars are the solution datataken in February 2000 before Tank 30 was recycled to Tank 32. The redtriangle is historic data from 1992.
6.3 Activity Diagrams at the Evaporator Temperature
Activity diagrams were generated at the elevated temperature (140°C) of the SRS 3Hevaporator using the polythermal reaction option in GWB. In this section the effects ofelevated temperature on the relative phase stability fields are examined for solutions at aspecific gravity of ~1.45 g/cc, the nominal specific gravity achieved to date in the 3HEvaporator. The effects of an additional evaporation of 40% that would yield evaporatorsolutions of ~1.6 specific gravity are considered in Section 6.4.
At the elevated temperature of 140°C, the gibbsite phase, Al(OH)3 is no longer stable. Themineral diaspore (AlOOH) is the stable alumina phase at 140°C. The higher iron

WSRC-TR-2001-00155
38
concentrations in Table III for Tank 32 cause a field of precipitated (ppd) Fe(OH)3 toappear. The additional equilibria between diaspore, NAS, NaAlO2, UO2(H2PO4)2 andFe(OH)3 are:
between Fe(OH)3 and diaspore
( ) ( ) ( ) DiasporeOHFe2H
OHAl)ppd(OHFe2 4
43 +⇔+ −
+
−
[9]
between Fe(OH)3 and NAS
( ) ( ) ( )−++
−
+⇔++++ 424
23 OHFe12NASNa12)aq(SiO14H
OHAl12OH19)ppd(OHFe12 [10]
between diaspore and NAS
( )NASNa12)aq(SiO14
H
OHAl6OH19Diaspore6 2
42 ⇔++++ +
+
−
[11]
between diaspore and NaAlO2
( )
OH2)c(NaAlO2Na2H
OHAlDiaspore 22
4 +⇔++ ++
−
[12]
and between diaspore and uranyl phosphate (aqueous)
( ) ( ) ( ) ( ) −−+
−
+++⇔+ 347322
42422 PO12OHUO2OH24Diaspore19
H
OHAl19POHUO6 [13]
Neither crystalline Al(OH)3 nor Fe(OH)3 are predicted to actually form in the evaporatorbecause the evaporator residence times are too short and the kinetics of formation of thesespecies is on the order of weeks. Indeed, the formation of amorphous Fe(OH)3 ismetastable.50 However, the higher iron and silica concentrations are well correlated withthe time at which the VDS samples were taken relative to a recycle from Tank 30 to Tank32, i.e. within hours of the recycle (February 2000) and during the tank recycle(September 2000). This indicates that the frequent recycles from Tank 30 to Tank 32 aremixing the feed tank contents and potentially sending more insoluble and/or colloidal silicaand iron to the 3H Evaporator than necessary.
Ejaz.22 has suggested that the NAS phase may not be the stable phase at elevatedtemperature due to the rapid kinetics of the NAS transformation into Zeolite-A and other
WSRC-TR-2001-00155
39
phases. This hypothesis was put forward by Ejaz although he did not have data tosubstantiate his position. A mixture of Zeolite-A and hydroxysodalite, such as thatobserved by Gasteiger et. al.17 at 95°C in evaporators in the paper and pulp industry, ismore likely at 140°C. Therefore, the activity diagrams showing the equilibrium with NASgel will be presented pairwise with the activity diagrams showing the equilibrium with theGasteiger mixed zeolite. It should be noted that the solubility data of Ejaz22 for the NASgel and the solubility data of Gasteiger17 are very similar and confirmatory of each other.However, each of these diagrams is based on solubility extrapolations as discussed inSection 5.0, i.e. the solubility of the NAS gel has been extrapolated from the lowertemperature measurements of Ejaz.22 For the mixed zeolite phase of Gasteiger,17 solubilitywas available for only one temperature, 95°C, and the temperature dependence of thesolubility of the mixed zeolite was estimated using the activation energy of the NAS gel.
The activity diagrams for the SRS 3H Evaporator solutions at 140°C for the dip (surface)sample populations in the feed tank (Tank 32) are shown in Figure 15a and Figure 15b.Figure 15a shows that the solutions are saturated with respect to Fe(OH)3 and will notprecipitate NAS. Likewise, Figure 15b demonstrates that the solutions saturated withrespect to Fe(OH)3 and not the mixed zeolite phase. Since the Fe(OH)3 phase ismetastable,50 this phase was suppressed in Figure 15c, Figure 15d, and subsequent figures.Figure 15c demonstrates that the SRS 3H Evaporator solutions at 140°C for the dip(surface) sample populations in the feed tank are saturated with respect to diaspore andnot NAS gel. This does not mean that diaspore is precipitating since the kinetics ofdiaspore formation is on the order of weeks. Figure 15d indicates that the SRS 3HEvaporator solutions at 140°C are also not in the stability field of mixed zeolite.
The activity diagrams for the SRS 3H Evaporator solutions at 140°C for the variabledepth sample (VDS) populations in the feed tank (Tank 32) are shown in Figure 16a andFigure 16b. Both these figures show that the solutions are saturated with respect todiaspore and will not precipitate NAS or mixed zeolite in the evaporator.
The activity diagrams for the SRS 3H Evaporator solutions at 140°C for all the depthsamples in the drop tank (Tank 30) are shown in Figure 17a and Figure 17b. All of thesamples are saturated with respect to diaspore and neither NAS gel nor mixed zeolite willform.
6.4 Activity Diagrams at the Evaporator Temperature WithSimulated Evaporation
The activity diagrams for the SRS 3H Evaporator solutions at 140°C with a simulated40% evaporation are shown in Figure 18 and Figure 19. The simulated 40% evaporationwould take the specific gravity of the solution from 1.4 to 1.6 g/cm3 which is the nominaloperating target for the evaporators. The historic data through February 2000 indicatesthat the evaporators have not concentrated above about 1.45 g/cc (see Table III and TableIV).
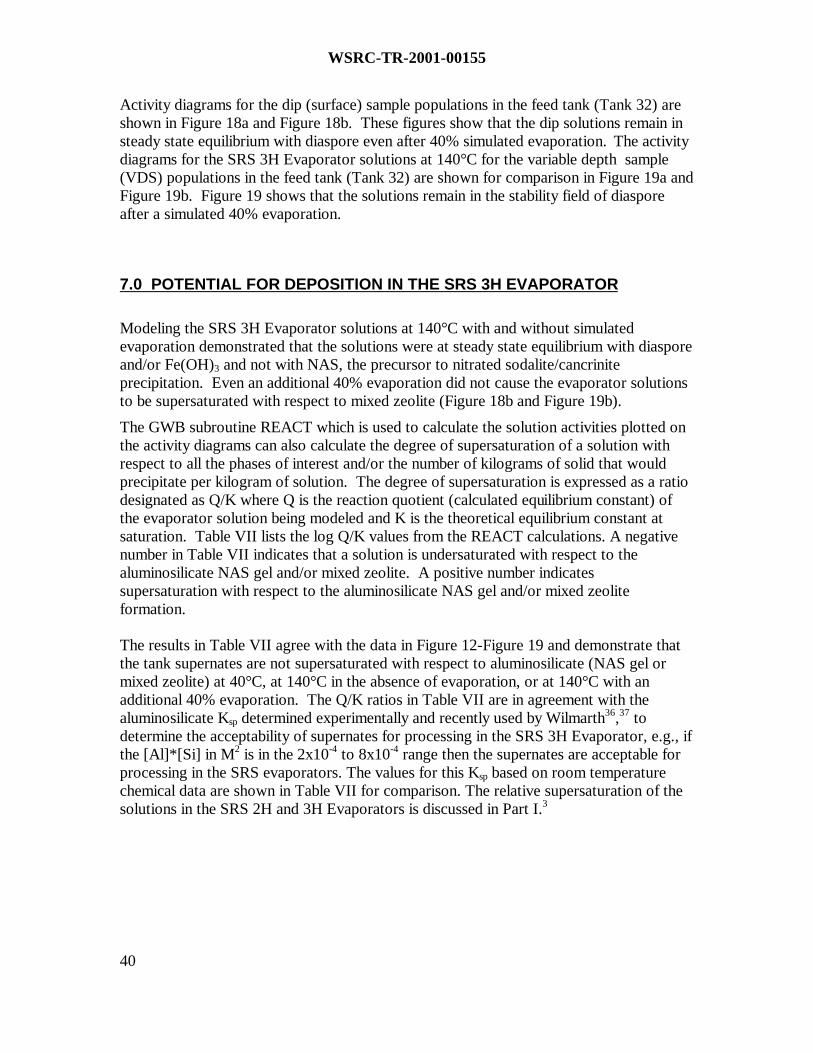
WSRC-TR-2001-00155
40
Activity diagrams for the dip (surface) sample populations in the feed tank (Tank 32) areshown in Figure 18a and Figure 18b. These figures show that the dip solutions remain insteady state equilibrium with diaspore even after 40% simulated evaporation. The activitydiagrams for the SRS 3H Evaporator solutions at 140°C for the variable depth sample(VDS) populations in the feed tank (Tank 32) are shown for comparison in Figure 19a andFigure 19b. Figure 19 shows that the solutions remain in the stability field of diasporeafter a simulated 40% evaporation.
7.0 POTENTIAL FOR DEPOSITION IN THE SRS 3H EVAPORATOR
Modeling the SRS 3H Evaporator solutions at 140°C with and without simulatedevaporation demonstrated that the solutions were at steady state equilibrium with diasporeand/or Fe(OH)3 and not with NAS, the precursor to nitrated sodalite/cancriniteprecipitation. Even an additional 40% evaporation did not cause the evaporator solutionsto be supersaturated with respect to mixed zeolite (Figure 18b and Figure 19b).
The GWB subroutine REACT which is used to calculate the solution activities plotted onthe activity diagrams can also calculate the degree of supersaturation of a solution withrespect to all the phases of interest and/or the number of kilograms of solid that wouldprecipitate per kilogram of solution. The degree of supersaturation is expressed as a ratiodesignated as Q/K where Q is the reaction quotient (calculated equilibrium constant) ofthe evaporator solution being modeled and K is the theoretical equilibrium constant atsaturation. Table VII lists the log Q/K values from the REACT calculations. A negativenumber in Table VII indicates that a solution is undersaturated with respect to thealuminosilicate NAS gel and/or mixed zeolite. A positive number indicatessupersaturation with respect to the aluminosilicate NAS gel and/or mixed zeoliteformation.
The results in Table VII agree with the data in Figure 12-Figure 19 and demonstrate thatthe tank supernates are not supersaturated with respect to aluminosilicate (NAS gel ormixed zeolite) at 40°C, at 140°C in the absence of evaporation, or at 140°C with anadditional 40% evaporation. The Q/K ratios in Table VII are in agreement with thealuminosilicate Ksp determined experimentally and recently used by Wilmarth36,37 todetermine the acceptability of supernates for processing in the SRS 3H Evaporator, e.g., ifthe [Al]*[Si] in M 2 is in the 2x10⁻⁴ to 8x10⁻⁴ range then the supernates are acceptable forprocessing in the SRS evaporators. The values for this Ksp based on room temperaturechemical data are shown in Table VII for comparison. The relative supersaturation of thesolutions in the SRS 2H and 3H Evaporators is discussed in Part I.3
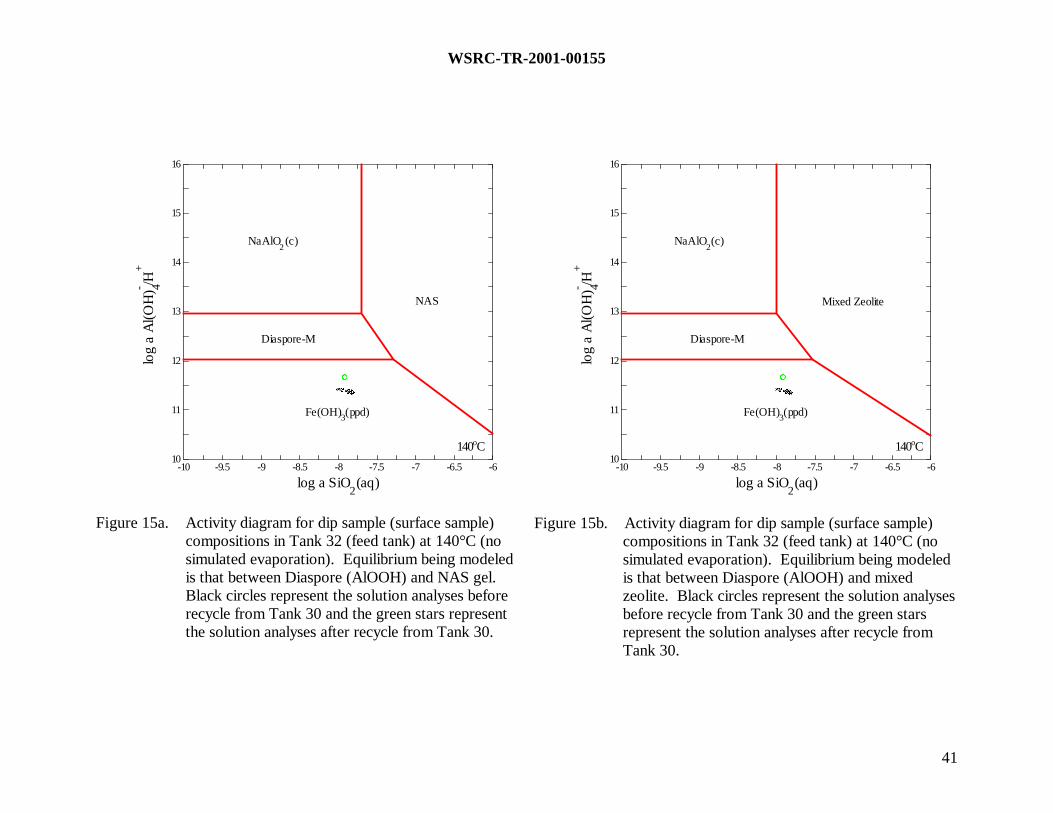
WSRC-TR-2001-00155
41
-10 -9.5 -9 -8.5 -8 -7.5 -7 -6.5 -610
11
12
13
14
15
16
log a SiO2(aq)
log
a A
l(OH
) 4- /H+
�
æææ
NaAlO2(c)
Diaspore-M
NAS
Fe(OH)3(ppd)
140oC
-10 -9.5 -9 -8.5 -8 -7.5 -7 -6.5 -610
11
12
13
14
15
16
log a SiO2(aq)
log
a A
l(OH
) 4- /H+
�
æææ
NaAlO2(c)
Diaspore-M
Mixed Zeolite
Fe(OH)3(ppd)
140oC
Figure 15a. Activity diagram for dip sample (surface sample)compositions in Tank 32 (feed tank) at 140°C (nosimulated evaporation). Equilibrium being modeledis that between Diaspore (AlOOH) and NAS gel.Black circles represent the solution analyses beforerecycle from Tank 30 and the green stars representthe solution analyses after recycle from Tank 30.
Figure 15b. Activity diagram for dip sample (surface sample)compositions in Tank 32 (feed tank) at 140°C (nosimulated evaporation). Equilibrium being modeledis that between Diaspore (AlOOH) and mixedzeolite. Black circles represent the solution analysesbefore recycle from Tank 30 and the green starsrepresent the solution analyses after recycle fromTank 30.

WSRC-TR-2001-00155
42
-10 -9.5 -9 -8.5 -8 -7.5 -7 -6.5 -610
11
12
13
14
15
16
log a SiO2(aq)
log
a A
l(OH
) 4- /H+
�
æææ
NaAlO2(c)
Diaspore-M
NAS
140oC
-10 -9.5 -9 -8.5 -8 -7.5 -7 -6.5 -610
11
12
13
14
15
16
log a SiO2(aq)
log
a A
l(OH
) 4- /H+
�
æææ
NaAlO2(c)
Diaspore-M
Mixed Zeolite
140oC
Figure 15c. Activity diagram for dip sample (surface sample)compositions in Tank 32 (feed tank) at 140°C (nosimulated evaporation) with Fe(OH)3 formationsuppressed. Equilibrium being modeled is thatbetween Diaspore (AlOOH) and NAS gel. Blackcircles represent the solution analyses before recyclefrom Tank 30 and the green stars represent thesolution analyses after recycle from Tank 30.
Figure 15d. Activity diagram for dip sample (surface sample)compositions in Tank 32 (feed tank) at 140°C (nosimulated evaporation) with Fe(OH)3 formationsuppressed. Equilibrium being modeled is thatbetween Diaspore (AlOOH) and mixed zeolite.Black circles represent the solution analyses beforerecycle from Tank 30 and the green stars representthe solution analyses after recycle from Tank 30.
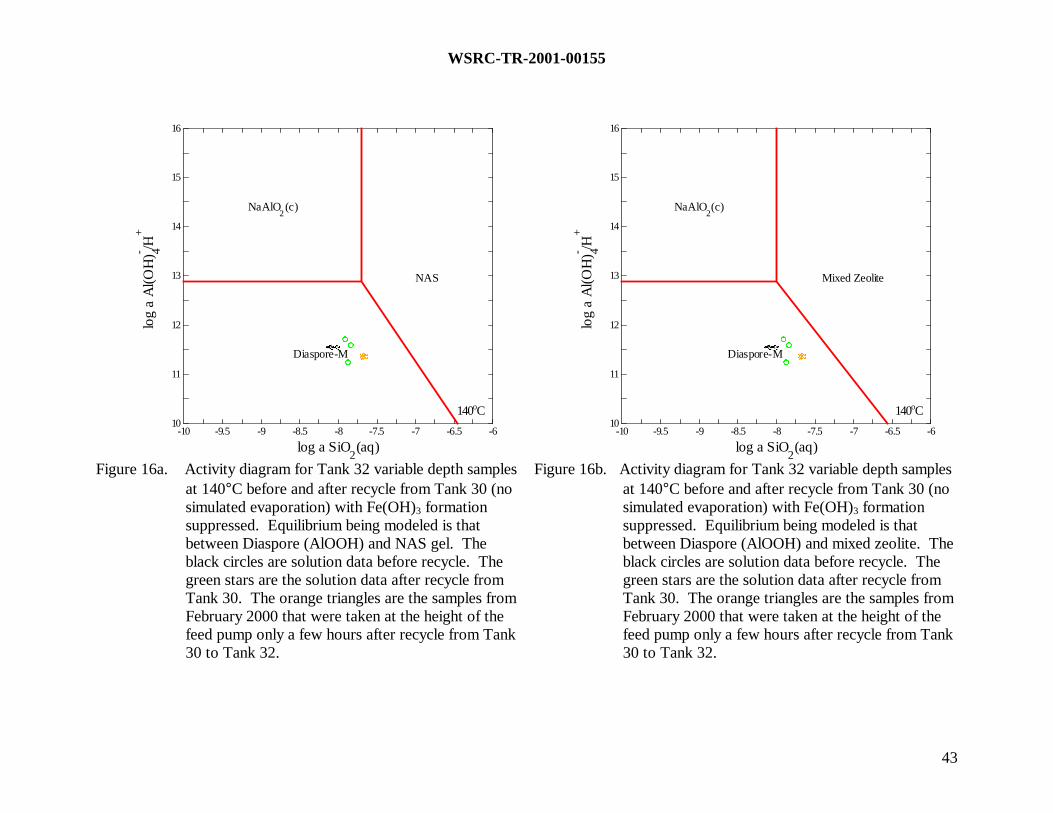
WSRC-TR-2001-00155
43
-10 -9.5 -9 -8.5 -8 -7.5 -7 -6.5 -610
11
12
13
14
15
16
log a SiO2(aq)
log
a A
l(OH
) 4- /H+
�
�
ææ �æ
��
NaAlO2(c)
Diaspore-M
NAS
140oC
-10 -9.5 -9 -8.5 -8 -7.5 -7 -6.5 -610
11
12
13
14
15
16
log a SiO2(aq)
log
a A
l(OH
) 4- /H+
�
�
ææ �æ
��
NaAlO2(c)
Diaspore-M
Mixed Zeolite
140oC
Figure 16a. Activity diagram for Tank 32 variable depth samplesat 140°C before and after recycle from Tank 30 (nosimulated evaporation) with Fe(OH)3 formationsuppressed. Equilibrium being modeled is thatbetween Diaspore (AlOOH) and NAS gel. Theblack circles are solution data before recycle. Thegreen stars are the solution data after recycle fromTank 30. The orange triangles are the samples fromFebruary 2000 that were taken at the height of thefeed pump only a few hours after recycle from Tank30 to Tank 32.
Figure 16b. Activity diagram for Tank 32 variable depth samplesat 140°C before and after recycle from Tank 30 (nosimulated evaporation) with Fe(OH)3 formationsuppressed. Equilibrium being modeled is thatbetween Diaspore (AlOOH) and mixed zeolite. Theblack circles are solution data before recycle. Thegreen stars are the solution data after recycle fromTank 30. The orange triangles are the samples fromFebruary 2000 that were taken at the height of thefeed pump only a few hours after recycle from Tank30 to Tank 32.
WSRC-TR-2001-00155
44
-10 -9.5 -9 -8.5 -8 -7.5 -7 -6.5 -610
11
12
13
14
15
16
log a SiO2(aq)
log
a A
l(OH
) 4- /H+
��ææ
��æ�
NaAlO2(c)
Diaspore-M
NAS
140oC
-10 -9.5 -9 -8.5 -8 -7.5 -7 -6.5 -610
11
12
13
14
15
16
log a SiO2(aq)
log
a A
l(OH
) 4- /H+
��ææ
��æ�
NaAlO2(c)
Diaspore-M
Mixed Zeolite
140oC
Figure 17a. Activity diagram for Tank 30 samples (all depths) at140°C (no simulated evaporation) with the formationof Fe(OH)3 suppressed. Equilibrium being modeledis that between Diaspore (AlOOH) and NAS gel.The black circles are solution data before recycle.The black circles are solution data from August 2000and December 2000 including data taken after atransfer was made from Tank 40. The green stars arethe solution data taken in February 2000 beforeTank 30 was recycled to Tank 32.
Figure 17b. Activity diagram for Tank 30 samples (all depths) at140°C (no simulated evaporation) with the formationof Fe(OH)3 suppressed. Equilibrium being modeledis that between Diaspore (AlOOH) and mixedzeolite. The black circles are solution data beforerecycle. The black circles are solution data fromAugust 2000 and December 2000 including datataken after a transfer was made from Tank 40. Thegreen stars are the solution data taken in February2000 before Tank 30 was recycled to Tank 32.
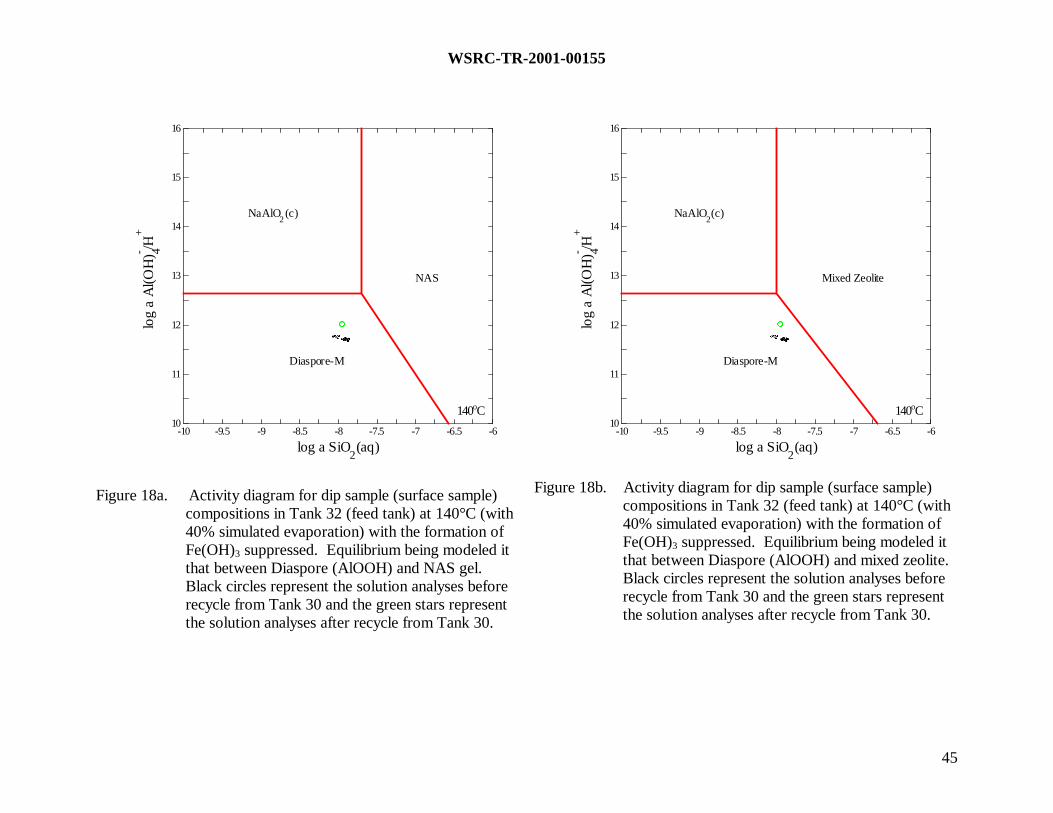
WSRC-TR-2001-00155
45
-10 -9.5 -9 -8.5 -8 -7.5 -7 -6.5 -610
11
12
13
14
15
16
log a SiO2(aq)
log
a A
l(OH
) 4- /H+
�
æææ
NaAlO2(c)
Diaspore-M
NAS
140oC
-10 -9.5 -9 -8.5 -8 -7.5 -7 -6.5 -610
11
12
13
14
15
16
log a SiO2(aq)
log
a A
l(OH
) 4- /H+
�
æææ
NaAlO2(c)
Diaspore-M
Mixed Zeolite
140oC
Figure 18a. Activity diagram for dip sample (surface sample)compositions in Tank 32 (feed tank) at 140°C (with40% simulated evaporation) with the formation ofFe(OH)3 suppressed. Equilibrium being modeled itthat between Diaspore (AlOOH) and NAS gel.Black circles represent the solution analyses beforerecycle from Tank 30 and the green stars representthe solution analyses after recycle from Tank 30.
Figure 18b. Activity diagram for dip sample (surface sample)compositions in Tank 32 (feed tank) at 140°C (with40% simulated evaporation) with the formation ofFe(OH)3 suppressed. Equilibrium being modeled itthat between Diaspore (AlOOH) and mixed zeolite.Black circles represent the solution analyses beforerecycle from Tank 30 and the green stars representthe solution analyses after recycle from Tank 30.

WSRC-TR-2001-00155
46
-10 -9.5 -9 -8.5 -8 -7.5 -7 -6.5 -610
11
12
13
14
15
16
log a SiO2(aq)
log
a A
l(OH
) 4- /H+
�
�
ææ �æ
��
NaAlO2(c)
Diaspore-M
NAS
140oC
-10 -9.5 -9 -8.5 -8 -7.5 -7 -6.5 -610
11
12
13
14
15
16
log a SiO2(aq)
log
a A
l(OH
) 4- /H+
�
�
ææ �æ
��
NaAlO2(c)
Diaspore-M
Mixed Zeolite
140oC
Figure 19a. Activity diagram for Tank 32 variable depth samplesat 140°C before and after recycle from Tank 30(with 40% simulated evaporation) with theformation of Fe(OH)3 suppressed. Equilibriumbeing modeled is that between Diaspore (AlOOH)and NAS gel. The black circles are solution databefore recycle. The green stars are the solution dataafter recycle from Tank 30. The orange trianglesare the samples from February 2000 that were takenat the height of the feed pump only a few hours afterrecycle from Tank 30 to Tank 32.
Figure 19b.Activity diagram for Tank 32 variable depth samples at140°C before and after recycle from Tank 30 (with40% simulated evaporation) with the formation ofFe(OH)3 suppressed. Equilibrium being modeled isthat between Diaspore (AlOOH) and mixed zeolite.The black circles are solution data before recycle. Thegreen stars are the solution data after recycle fromTank 30. The orange triangles are the samples fromFebruary 2000 that were taken at the height of the feedpump only a few hours after recycle from Tank 30 toTank 32.
WSRC-TR-2001-00155
47
While there is no evidence that the SRS 3H Evaporator system is supersaturated withrespect to the precipitation of NAS and hence nitrated sodalite/cancrinite, there isevidence that Tank 30 (the drop tank) has a layer of entrained sludge or precipitatedFe(OH)3 and silica sol deposits at the bottom. This is based on the analysis completed byWilmarth36 of a “salt” sample taken from 8” above the Tank 30 (drop tank) floor that wasenriched in silica four times (4X) compared to the sample taken 348” above the bottom ofthe tank and enriched in silica two times (2X) compared to the sample taken 179” abovethe bottom of the tank in August 2000. This demonstrates the following:
• the transfer jet in Tank 30 that is 4” above the floor needs to be higher inthe tank so that entrained sludge solids, precipitated Fe(OH)3 and/or silicasol deposits are not recycled to Tank 32
The formation and supersaturation of the Na2U2O7 phase has not been modeled in thisstudy since it is known from the work of Hobbs and Karraker35 and Peterson and Pierce51
that the evaporator solutions can be supersaturated with respect to this phase. In theabsence of the NAS phase, 40 years of operational experience at SRS indicates that theNa2U2O7 phase does not accumulate in the evaporator.

WSRC-TR-2001-00155
48
Table VII. Supersaturation of 3H Evaporator Solutions with Respect to Aluminosilicate Formation
Date Sample ID Log Q/Kat 40°Cfor NAS
Log Q/Kat 40°C
forMixedZeolite
Log Q/Kat 140°Cfor NAS
Log Q/Kat 140°C
forMixedZeolite
Log Q/Kat 140°Cfor NAS@ 40%Evap
Log Q/Kat 140°C
for MixedZeolite @
40%Evap
Ksp[Al]*[Si]
M2
at 25°C
Log [Si]M
at 25°C
Tank 32 Dip Samples02/15/01 200138614 -11.82 6.68 -6.75 -3.48 -2.76 0.59 1.6 E-03 -2.6812/05/00 200125277 -10.55 8.05 -5.74 -2.34 -1.67 1.78 1.6 E-03 -2.7209/04/00 surface dip* -16.54 2.88 -11.77 -7.55 -7.72 -3.44 5.8 E-04 -3.1308/21/00 surface dipt -23.09 -3.52 -17.69 -13.35 -13.86 -9.42 3.5 E-04 -3.1802/01/00 TK32H-S1t -20.89 -1.56 -15.52 -11.44 -11.65 -7.47 3.2 E-04 -3.2402/01/00 TK32H-S1t -20.80 -1.44 -15.45 -11.34 -11.57 -7.37 3.3 E-04 -3.24
Tank 32 Variable Depth Samples09/04/00 VDS* 120" -16.63 2.78 -11.80 -7.60 -7.76 -3.50 6.7 E-04 -3.0809/04/00 VDS* 90" -21.34 -2.00 -16.46 -12.34 -12.55 -8.35 2.4 E-04 -3.1609/04/00 VDS* 70" -16.55 2.72 -11.64 -7.58 -7.61 -3.49 5.4 E-04 -3.1308/21/00 VDSt 120" -23.05 -3.23 -17.81 -13.21 -13.92 -9.22 3.7 E-04 -3.2208/21/00 VDSt 90" -21.52 -1.88 -16.32 -11.90 -12.42 -7.91 4.3 E-04 -3.1608/21/00 VDSt 70" -22.84 -3.03 -17.60 -13.02 -13.70 -9.03 3.9 E-04 -3.2102/01/00 TK32H-S1** 89” -26.35 -6.17 -21.08 -16.14 -17.19 -12.16 1.3E-04 -3.6202/01/00 TK32H-S1** 89” -20.85 -5.80 -20.46 -15.72 -16.59 -11.75 1.4 E-04 -3.56
Tank 30 All Depths12/01/00 200125276 -7.90 10.24 -3.13 -0.20 0.92 3.91 2.1 E-03 -2.5512/01/00 1 of 3 nonroutine -22.18 -2.03 -17.29 -12.35 -13.26 -8.25 2.8 E-04 -3.4612/01/00 2 of 3 nonroutine -22.33 -2.17 -17.45 -12.49 -13.42 -8.40 2.7 E-04 -3.4812/01/00 3 of 3 nonroutine -20.82 -0.87 -15.94 -11.20 -11.92 -7.11 3.5 E-04 -3.3608/21/00 Tk30H-S1 -20.81 -0.85 -15.94 -11.20 -11.90 -7.09 2.9 E-04 -3.4308/21/00 Tk30H-S2 -16.89 2.53 -12.05 -7.84 -8.02 -3.74 3.6 E-04 -3.0802/01/00 Tk30H-S1 -19.56 0.04 -14.66 -10.28 -11.11 -6.22 3.4E-04 -3.2602/01/00 Tk30H-S2 -20.19 -0.45 -15.50 -10.96 -11.50 -6.89 6.6E-04 -3.2502/01/00 Tk30H-VDS -19.81 -0.22 -14.91 -10.52 -10.94 -6.48 4.1E-04 -3.19
* = after recycle of Tank 30 to Tank 32; t = before recycle of Tank 30 to Tank 32; ** = within a few hours of a recycle of Tank 30 to 32;shaded data not used in modeling

WSRC-TR-2001-00155
49
8.0 CONCLUSIONS
• Based on the latest available accurate data for the SRS 3H Evaporator feedtank (September 2000), the SRS 3H Evaporator is not precipitating sodiumaluminosilicate (NAS) phases.
• Continued recycle and transfers from the bottom of the drop tank (Tank 30)back to the feed tank (Tank 32) may cause sodium aluminosilicates tosupersaturate beyond the present levels. (Implemented in Spring 2001 whenthe transfer jet was replaced at a height of 150” above the tank floor.)
• The analytical data indicate that the frequent recycles from Tank 30 to Tank 32at a level beneath the sludge layer are stirring and/or agitating the feed tankcontents creating a “Zone of Turbidity” that has the potential to add extra silicaand iron to the feed tank if not allowed to settle for 5-6 hours after a transfer.- The extra silica and iron are recycled through 3H Evaporator if not
allowed to settle out in the feed tank where they can initiate deposits.
• The “salt” layer in Tank 30 has elevated levels of silica (4X), Al, Fe and Mncompared to the remaining supernate indicating that Fe(OH)3, silica soldeposits, and possibly other sludge hydroxides may have precipitated in thedrop tank. This could also be from the one small sludge transfer made to thistank in September 1996.
• A more accurate Si analysis method must be implemented in the F-Arealaboratory immediately.- Recent (December 2000 and January 2001) F-area laboratory silicon
analyses are biased high.
• Routine analytic samples, if used for confirmatory modeling, must be taken atthe height of the feed pump.
- Modeling can be confounded if data taken close to the sludge layer and data taken during tank transfers or within several hours of tank recycles ismodeled.
• Feed tank and drop tank supernate solutions modeled at 25°C and 40°C arenot supersaturated with respect to sodium aluminosilicate (NAS) formation.
• Feed tank and drop tank supernate solutions modeled at 140°C with andwithout simulated evaporation are not saturated with respect to NAS.
• A safe operational strategy is to determine the supersaturation of the feed tanksupernate with respect to the NAS at 40°C: an unsaturated tank supernate feedwill not precipitate in the evaporator at 140°C (at specific gravities of 1.4-1.6g/cc).

WSRC-TR-2001-00155
50
9.0 RECOMMENDATIONS
The following recommendations from this study should be implemented as soon asfeasible:
• The feed pump should always be located >20” above the “Zone of Turbidity”which is ~40” above the sludge layer
• Routine analytic samples, if used for confirmatory modeling, must be taken atthe height of the feed pump
• Analytic samples should not be taken within 5-6 hours of tank transfers and/orrecent tank recycles
• The evaporator should not be fed within 5-6 hours of tank transfers and/orrecent tank recycles
• A more accurate Si analysis method must be implemented in the F-Arealaboratory immediately
• A recent (after September 2000) Tank 32 sample should be analyzedimmediately by a more accurate Si analysis method to ensure that the 3HEvaporator solutions are not moving into the stability field of NAS gelprecipitation
• The drop tank transfer jet must be moved to a higher position in the drop tankto avoid recycling precipitated Fe(OH)3 and/or silica sol deposits, and/orentrained sludge solids back to the feed tank (Completed Spring 2001).
• Inject recycle from Tank 30 above the sludge layer in Tank 32 and notsubsurface to minimize the “Zone of Turbidity” caused by tank transfers andmaximize settling of suspended solids and silica sols
It is desirable that the following recommendations be considered as a longer termstrategy:
• Eliminate recycle directly from Tank 30 to the feed tank (Tank 32): use Tanks39 and/or Tank 35 as settling tanks so that NAS supersaturation andaccumulation of silica sol deposits is no longer a concern

WSRC-TR-2001-00155
51
10.0 ACKNOWLEDGEMENTS
Dr. W. J. Frederick of the Institute of Paper Science and Technology is gratefullyacknowledged for the usage of his unpublished data on the solubility of hydroxysodaliteand Zeolite-A.
Kent Gilbreath from the SRS H-Area Tank farm is thanked for providing the data aboutsludge levels, feed pump levels, and operating temperatures of the SRS 3H from theTank Farm morning reports. Ken Jones of the F-Area laboratory is acknowledged fordiscussions about the F-Area Si analytic methodology and dilution factors.
Many helpful suggestions and discussions with Jeff Pike of SRS are acknowledged.Most notable of his many contributions was assistance in gathering the solubility data forNaAlO2 and AlO2
-2 so that these species could be adequately represented on the activitydiagrams.
This work was performed under contract No. DE-AC09-96SR18500 with the Departmentof Energy and co-funded by the Tank Focus Area under Technical Task Plan # SR-1-9-WT-31.
WSRC-TR-2001-00155
52
11.0 REFERENCES
1 W. R. Wilmarth, C. J. Coleman, A. R. Jurgensen, W. M. Smith, J. C. Hart, W. T.Boyce, D. Missimer, C. M. Conley, “Characterization and Dissolution Studiesof Samples from the 242-16H Evaporator,” WSRC-TR-2000-00038, Rev. 0(January 31, 2000).
2 W. R. Wilmarth, C. J. Coleman, J. C. Hart, and W. T. Boyce, “Characterizationof Samples from the 242-16H Evaporator Wall,” WSRC-TR-2000-00089(March 20, 2000).
3 C.M. Jantzen and J.E. Laurinat, “Thermodynamic Modeling of the SRSEvaporators: Part I. The 2H and 2F Systems (U),” WSRC-TR-2000-00293(May, 2001).
4 W. R. Wilmarth, S. D. Fink, D. T. Hobbs, M. S. Hay, “Characterization andDissolution Studies of Samples from the 242-16H Evaporator Gravity DrainLine,” WSRC-TR-97-0326, Rev.0 (October 16, 1997).
5 R.M. Garrels, “Geology,” Section 6 in Atllas of Electrocemical Equilibria inAqueous Solutions, National Association of Corrosion Engineers, Houston, TX,(English Translation), 89-94 (1966).
6 T. S. Bowers, K. J. Jackson, and H. C. Helgeson, “Equilibrium ActivityDiagrams for Coexisting Minerals and Aqueous Solutions at Pressures andTemperatures to 5kb and 600°C,” Springer-Verlag, New York, 397pp. (1984).
7 R. M. Garrels and C. L. Christ, “Solutions, Minerals, and Equilibria,” Harper &Row, New York, 450pp. (1965).
8 K. V. Ragnarsdottir, “Dissolution Kinetics of Heulandite at pH 2-12 and25°C,” Geochimica et Cosmochimica Acta, 57, 2439-2449 (1993).
9 T. S. Bowers and R. G. Burns, “Activity Diagrams for Clinoptilolite:Susceptibility of this Zeolite toFurther Diagenetic Reactions,” AmericanMineralogist, 75, 601-619 (1990).
10 C. M. Jantzen and J.B. Pickett, “Vitrification of M-Area Mixed (Hazardousand Radioactive) Wastes: I. Sludge and Supernate Characterization,”WSRC-TR-94-0234 (September, 2001). Earlier report with fewer tank analysespublished as DPST-89-351 (March 1, 1989).
11 R. Pierce, WSRC-NB-2000-00054 (June 14, 2000).

WSRC-TR-2001-00155
53
12 E.S. Dana, “A Textbook of Mineralogy,” John Wiley & Sons, Inc., New York,
851pp (1932).
13 W. A. Deer, R. A. Howie, and J. Zussman, “Rock-Forming Minerals, Vol IV,”John Wiley & Sons, Inc., New York, 435pp. (1963).
14 W. Sinkler, T.P. O’Holleran, S.M. Frank, M.K. Richmann, S.G. Johnson,“Characterization of A Glass-Bonded Ceramic Waste Form Loaded with U andPu,” Scientific Basis for Nuclear Waste Management, XXIII, R.W. Smith andD.W. Shoesmith (Eds.), Materials Research Society, Pittsburgh, PA, 423-429(2000).
15 Wilmarth, personnel communication
16 W.J. Frederick, personal communication
17 H. A. Gasteiger, W. J. Frederick, and R. C. Streisel, “Solubility ofAluminosilicates in Alkaline Solutions and a Thermodynamic EquilibriumModel,” Ind. Eng. Chem. Res., 31, 1183-1190 (1992).
18 R. M. Milton, U.S. Patents #2,882,243 and #2,882,244 (1959)
19 Kirk-Othmer Encyclopedia of Chemistry, Vol. 16 (1995).
20 R. M. Barrer, J. W. Baynham, F. W. Bultitude, and W. M. Meier, “HydrothermalChemistry of the Silicates. Part V23I, Low-Temperature Crystal Growth ofAluminosilicates, and of Some Gallium and Germanium Analogues,” 195-208(1959).
21 R.M. Barrer, “Hydrothermal Chemistry of Zeolites,” Academic Press,London(1982).
22 T. Ejaz A.G. Jones and P. Graham, “Solubility of Zeolite-A and Its AmorphousPrecursor Under Synthesis Conditions,” J. Chem. Eng. Data, 44, 574-576(1999).
23 The American Heritage Dictionary, Second College Edition, Houghton MifflinCo., Boston, MA, (1982).
24 G.M. Barrow, “Physical Chemistry,” 2nd edition, McGraw-Hill Book Company,New York, 843pp., (1966).
25 M.C. Barnes, J.A. Mensah, and A.R. Gerson, “The Mechanism of the Sodalite-to-Cancrinite Phase Transformation in Synthetic Spent Bayer Liquor,”Microporous and Mesoporous Materials, 31, 287-302 (1999).

WSRC-TR-2001-00155
54
26 A.R. Gerson and K. Zheng, “Bayer Process Plant Scale: Transformation of
Sodalite to Cancrinite,” J. of Crystal Growth, 171, 209-218 (1997).
27 J.C. Buh. And J. Lons, “Synthesis and Crystal Structure of NitrateEnclathrated Sodalite, Na8[AlSiO 4]6(NO3)2,” Journal of Alloys and Compounds,v.235, 41-47 (1996).
28 W. R. Wilmarth, D. D. Walker, S. D. Fink, “Sodium Aluminosilicate Formationin Tank 43H Simulants,” WSRC-TR-97-00389, Rev. 0 (November 15, 1997).
29 B. Subotic, D. Skrtic, I. Smit, L. Sekovanic, “Transformation of Zeolite-A intoHydroxysodalite,” J. Crystal Growth, 50, 498-508 (1980).
30 S. Bosnar and B. Subotic, “Mechanism and Kinetics of the Growth of ZeoliteMicrocrystals; Part I. Influence of the Alkalinity of the System on the Growth ofZeolite-A Microcrystals,” Microporous and Misoporous Materials, 28, 483-493(1999).
31 D. W. Breck, W. G. Eversole, R. M. Milton, T. B. Reed, and T. L. Thomas,“Crystalline Zeolitesl I. The Properties of a New Synthetic Zeolite, Type A,”J. Am. Chem. Soc., 78 [23], 5963-5971 (1956).
32 J. Maly and V. Vesely, “A Contribution to Sodium Polyuranate Chemistry,” J.Inorg. Nucl. Chem., 7, 119-128 (1958).
33 J. E. Ricci and F. J. Loprest, “Phase Relations in the System Sodium Oxide-Uranium Trioxide-Water at 50 and 75°C,” J. Am. Chem. Soc., 77, 2119-2129(1955).
34 C. A. Wamser, J. Belle, E. Bernsohn and B. Williamson, “The Constitution ofthe Uranates of Sodium,” J. Am. Chem. Soc, 74, 1020-1022 (1952).
35 D. T. Hobbs and D. G. Karraker, “Recent Results on the Solubility of Uraniumand Plutonium in Savannah River Site Waste Supernate,” NuclearTechnology, 114, 318-324 (1996).
36 W.R. Wilmarth and R.A. Peterson, “Analyses of Surface and Variable DepthSamples from Tanks 30H and 32H,” WSRC-TR-2000-00112 (April, 2000).
37 W.R. Wilmarth, J.T. Mills, V.H. Dukes, C.J. Coleman, J.C. Hart, W.T. Boyce, andR.L. Cadle, “Characterization of Samples from the 3H Evaporator SystemIncluding Effects of Recycle,” WSRC-TR-2000-00399 (October, 2000).
38 W.R. Wilmarth, “Tank 30H Sample Analysis Results,” SRT-LWP-2000-00191(January 10, 2001).

WSRC-TR-2001-00155
55
39 D.D. Walker and C.J. Coleman, “Densities and Weight% Solids of SimulatedSalt Solutions,” WSRC-TR-91-176 (April, 1991).
40 C. Coleman, personal communication
41 R.K. Iler, “The Colloid Chemistry of Silica and Silicates,” Cornell UniversityPress, Ithaca, NY, 324pp. (1955).
42 A.K. Varshneya, “Fundamentals of Inorganic Glasses,” Academic Press, Inc.,New York, 570pp. (1994).
43 C.F. Baes, Jr. and R.E. Mesmer, “The Hydrolysis of Cations,” John Wiley & Sons,New York, 489pp. (1976).
44 S. Sjoberg, L.Ohman, N. Ingri, “Equilibrium and Structural Studies of Silicon(IV)and Aluminum(III) in Aqueous Solution. 11. Polysilicate Formation in AlkalineAqueous Solution. A Combined Potentiometric and 29Si NMR Study,” ActaChemica Scandinavica , A39, 93-107 (1985).
45 I. Grenthe, et. al., “Chemical Thermodynamics of Uranium,” North Holland, NewYork (1992).
46 R.H. Busey, R.E. Mesmer, “Inoization Equilibria of Silicic Acid and PolysilicateFormation in Aqueous Sodium Chloride Solutions to 300°C,” Inorg. Chem., 16,2444-2450 (1977).
47 A.S. Russell, J.D. Edwards, and C.S. Taylor, “Solubility and Density ofHydrated Aluminas in NaOH Solutions,” J. of Metals, p.1123-1128 (October,1955).
48 D.A. Reynolds and D.L. Herting, “Solubilities of Sodium Nitrate, SodiumNitrite, and Sodium Aluminate in Simulated Nuclear Waste,” U.S. DOEReport, RHO-RE-SST-14P, Westinghouse Hanford Company, Richland, WA(September, 1984).
49 H. Park and P. Englezos, “Thermodynamic Modeling of SodiumAluminosilicate Formation in Aqueous Alkaline Solutions,” Ind. Eng. Chem.Res., 38, 4959-4965 (1999).
50 T.J. Wolery, “EQ3NR, A Computer Program for Geochemical AqueousSpeciation-Solubility Calculations: Theoretical Manual, User’s Guide, andRelated Documentation (Version 7.0),” U.S. DOE #UCRL-MA-110662, Pt. III,Lawrence Livermore National Laboratory, Livermore, CA (September 14, 1992).

WSRC-TR-2001-00155
56
51 R.A. Peterson and R.A. Pierce, “Sodium Diuranate and Sodium
Aluminosilicate Precipitation Test Results,” WSRC-TR-2000-00156 (May 15,2000).