
EXPERIMENTAL DESIGN Experimental and Pre (Quasi) Experimental Designs.

1
Thermodynamic Analysis of the Experimental
Equilibria for the Liquid-Phase Etherification of
Isobutene with C1 to C4 Linear Primary Alcohols
Jordi H. Badia, Carles Fité*, Roger Bringué, Eliana Ramírez, Fidel Cunill
Chemical Engineering Department, Faculty of Chemistry, University of Barcelona, Martí i
Franquès 1, 08028 Barcelona, Spain
ABSTRACT
The chemical equilibrium of the liquid-phase syntheses of 2-methoxy-2-methylpropane (MTBE),
2-ethoxy-2-methylpropane (ETBE), 2-methyl-2-propoxypropane (PTBE), and 1-tert-
butoxybutane (BTBE) by reaction of isobutene with methanol, ethanol, 1-propanol, and 1-
butanol, respectively, has been studied. Four different ion exchange resins as the catalysts, and
two different reactor systems, namely a batch reactor and a setup of tubular reactors, were used.
Temperature and pressure were in the range 313-383 K and 1.5-2.0 MPa, respectively. MTBE
and ETBE synthesis reactions experiments were carried out mainly to validate the reliability of
the reaction systems. Experiments in PTBE and BTBE etherifications allowed estimating
thermodynamic properties for those reactions and involved species, namely molar standard
enthalpy and entropy changes of reaction and molar enthalpy change of formation of the four
ethers. Comparison of estimated reaction thermodynamic values among the homologous series of
linear alcohols, and with results quoted in the literature, when available, has been made.

2
KEYWORDS: Thermodynamic properties, etherification, isobutene, primary alcohol, ion
exchange resins
1. INTRODUCTION
Experimental studies on thermodynamic properties concerning promising processes are
mandatory to determine their viability. In this sense, all major industrially-operated production
processes have to be preceded by thorough studies on their equilibrium conditions. Recent
examples of this fact, from several disciplines, would be the synthesis of graphene 1,2,
pharmaceutical drugs design 3,4 or novel biofuels production 5–7.
Regarding biofuels, new legislation in European countries is pushing ahead with next
generation fuels to reinforce the struggle started by the EU with directives 2009/28/EC and
2009/30/EC, which promote the usage of renewable sources and establish fuel reformulation
main guidelines. Among fuel additives that help reaching the required standards, oxygenate
ethers arise as a feasible alternative.
Oxygenate additives like methyl tert-butyl ether and ethyl tert-butyl ether, obtained by
isobutene etherification with methanol and ethanol, respectively, have been already studied since
they have been produced worldwide for decades. However, the production of heavier ethers from
alkene etherification with larger primary alcohols has been scarcely studied. An increase of the
number of carbon atoms of ethers leads to a decrease of the vapor pressure and the solubility in
water, and to an increase in its boiling point 8,9. These are desirable characteristics for fuels,
because they entail a reduction of evaporative emissions and risk of water contamination, and
because they contribute to a dilution effect of some harmful components, i.e. aromatics.
Larger linear alcohols, such as 1-propanol or 1-butanol, have been extensively produced at
industrial scale by the oxo process 10–12. Biomass-based production routes have also been
3
studied, namely the condensation of bioethanol and/or biomethanol (Guerbet Catalysis) and the
ABE fermentation 13,14. In this case, ethers from larger alcohols can be considered to contribute
in accomplishing the biofuel target. Prior to scale-up studies on the feasibility of industrializing
these processes, thermodynamic properties analyses based on experimental data must be carried
out. Actually, thermodynamic information of reacting systems where alkenes and several linear
alcohols are involved is scarce. The present study, based on a sound experimental work,
contributes to fill part of this lack of information.
2. EXPERIMENTAL SECTION
2.1. Chemicals
Reactants were methanol (max. water content 0.005% wt.), ethanol (max. water content 0.02%
wt.), 1-propanol (max. water content 0.005% wt.), 1-butanol (max. water content 0.005% wt.),
and either 2-methylpropene (isobutene) or a synthetic C4 mixture as the isobutene source. Some
chemical standards were used for analytical procedures: 2-methyl-2-propanol (TBA), diethyl
ether (DEE), 2,4,4-trimethyl-1-pentene (TMP-1), 2,4,4-trimethyl-2-pentene (TMP-2), 2-
ethoxybutane (ESBE), 2-methoxy-2-methylpropane (MTBE), 2-ethoxy-2-methylpropane
(ETBE), 2-methyl-2-propoxypropane (PTBE), and 1-tert-butoxybutane (BTBE). The source and
purity of all compounds is listed in Table 1.
TABLE 1
Given that mass spectra for both PTBE and BTBE molecules were not found in the published
databases, these mass spectra obtained in our laboratory are provided in the Supporting
Information section in Figures S1 and S2, respectively.
2.2. Catalysts

4
Amberlyst™ 35 (A-35, Rohm & Haas, Chauny, France) was used as catalyst in the majority of
the experimental work. Other similar ion exchange resins were tested for comparative purposes:
Amberlyst™ 15 (A-15, Rohm & Haas, Chauny, France), Purolite® CT275 (CT-275, Purolite
Ltd., Pontyclun, UK) and Lewatit® K 2620 (K2620, LANXESS AG, Cologne, Germany). All
resins were macroreticular, strongly acidic, sulfonated polymers of styrene-divinylbenzene.
Relevant properties are listed in Table 2.
TABLE 2
2.3. Apparatus and Procedure
Experiments were carried out at constant temperature in the range 313-383 K and 1.5-2.0 MPa
to keep all components in the liquid phase. Two different reactors were used to carry out the
experiments. The first experimental setup consisted of a series of catalytic fixed-bed tubular
microreactors (length: 150 mm, i.d.: 7 mm). The second setup consisted of a 200 cm3 stainless-
steel jacketed batch reactor. Initial (batch reactor) or fed (tubular reactor) alcohol/isobutene
molar ratio (RºA/O) ranged from 0.6 to 2.4.
As catalysts were supplied in wet state, they were pretreated to reduce their water content.
Catalysts were firstly dried at room temperature for 48 h to remove most of the free water from
the resin beads and, afterwards, located in an atmospheric oven at 383 K. Catalysts used in the
fixed-bed reactor system were then kept in the oven for at least 14 h until the experiment was
carried out. Catalysts used in the batch reactor system were kept in the atmospheric oven for 2.5
h and, afterwards, placed in a vacuum oven, at 373 K and 0.001 MPa, for 12 h. Final water
content in the resin beads after vacuum-drying was 3-5% wt. (analyzed by Karl-Fischer titration
in the laboratory).

5
The number of reactor units build in series and the feed flow-rate in the fixed-bed reactor
system were chosen for each experiment to achieve a desired liquid hourly space velocity
(LHSV) in the range 1.8-20 h-1. Firstly, a weighed amount of oven-dried catalyst was introduced
into the designated number of reactors, which were afterwards submerged in a thermostatic bath.
Then, only the alcohol was fed to the reactors in order to preheat the catalytic bed and to reduce,
as much as possible, the remaining water in the catalyst by alcohol percolation. By means of this
procedure, the water content in the resin beads can be reduced to less than 1% wt. 15. Afterwards,
while the alcohol flow was kept constant, the pressurized C4 mixture was added to the feed for
the reaction to proceed. Then, pressure was fixed at 1.5 MPa in order to ensure all reactants were
in the liquid state. From that moment onwards, the composition variation at the outlet stream was
monitored by repeated chromatographic analyses. When no significant variation of composition
was observed between consecutive analyses, the experiment was ended, since it was considered
that the system had reached the steady state.
Regarding the experiments carried out in the batch reactor system, procedure was as follows:
the catalyst load, ranging 0.1-10% wt. of the reactant mixture, was introduced into a catalyst
injector and pressurized to 2.0 MPa with nitrogen. The corresponding alcohol was introduced
into the reactor vessel before the heating and the stirring (500-750 rpm) were switched on. The
isobutene, or the C4 mixture, was first kept in a pressure burette, and then introduced into the
reactor by difference of pressures. Once the reactive mixture reached the desired temperature,
controlled within ± 0.1 K by a 1,2-propanediol-water thermostatic mixture, the catalyst was
injected. This instant was considered as the starting point for the reaction. Experiments lasted 5-8
h, until the reactive medium composition showed no significant variation in time.
2.4. Analysis
6
In the fixed-bed reactor setup, samples were taken inline from the reactor inlet and outlet
streams through two sampling valves that injected 0.2 µL of pressurized liquid into an Agilent
gas chromatograph 7890A with a FID detector. In the batch reactor setup, samples were also
taken inline from the reaction medium through a sampling valve that injected 0.2 µL of
pressurized liquid into an Agilent gas chromatograph 6890 with a mass selective detector
HP5973N used to identify and quantify the reaction system components. Both GC were equipped
with a capillary column HP-PONA 19091S-001 (100% dimethylpolysiloxane, 50 m × 0.20 mm ×
0.50 μm; J&W Scientific, Santa Clara, CA). The GC oven temperature ranged 308-343 K, the
carrier gas flowrate (helium) varied from 0.6 to 1.5 mL/min, and the analysis duration was 20-45
min, depending on the considered reaction.
2.5. Calculations
For a chemical reaction at a given time, mass-action ratio, Γx, corresponds to the ratio of
products molar fractions to reactants molar fractions, each raised to the power of the
stoichiometric coefficient, ν. In non-ideal systems, activity coefficients have to be taken into
account, as follows:
j j j
S S S
a j j j xj 1 j 1 j 1
a · xν ν νγγ
= = =
Γ = = = Γ ⋅Γ∏ ∏ ∏ (1)
where S are the species involved in the considered reaction, and Γa and Γγ are the mass-action
ratios expressed in terms of activities, a, and activity coefficients, γ, respectively. In the present
systems, activity coefficients were estimated by means of the modified UNIFAC-Dortmund
method 16.
In a batch stirred tank reactor, chemical equilibrium is reached when the reaction medium
composition becomes constant with time. In a fixed-bed reactor, the outlet stream is considered

7
to be at chemical equilibrium if its composition at the steady state does not change at decreasing
flow rate with the same inlet composition and reaction temperature. When the reaction mixture is
at chemical equilibrium, mass-action ratio equals to the equilibrium constant, namely Kx = Γx,
Kγ = Γγ, and K = Γa, the latest being the thermodynamic equilibrium constant.
3. RESULTS AND DISCUSSION
3.1. Reaction System
The study was focused on a series of analogous syntheses of alkyl tert-butyl ether from
isobutene and C1 to C4 linear primary alcohols. In each part of the experimental work, methanol
(MeOH), ethanol (EtOH), 1-propanol (1-PrOH) or 1-butanol (1-BuOH) were used to obtain,
respectively, methyl tert-butyl ether (MTBE), ethyl tert-butyl ether (ETBE), propyl tert-butyl
ether (PTBE) or butyl tert-butyl ether (BTBE) (reactions R1, R2, R3, and R4, respectively, in
Scheme 1).
SCHEME 1
Possible side-reactions comprise dimerization of isobutene to give TMP-1 and TMP-2,
isobutene hydration to give TBA, alcohol dehydration to give water and the corresponding
symmetric ether and, as 2-butene is present in the synthetic C4 mixture, the etherification
reaction of 2-butene with alcohol to give the corresponding alkyl sec-butyl ether 17–19.
Byproducts formation ranged 0-5.5% wt. and 0-15.7% wt. in the fixed-bed and in the batch
experiments, respectively. When formed, these byproducts where quantified and, therefore,
included in the calculations. Given the extension of some side-reactions in the batch experiments
and their irreversible nature, e.g. isobutene dimerization, in some runs a pseudo equilibrium
situation was reached rather than a true thermodynamic equilibrium situation. The activities
relations corresponding to each equilibrium reaction obtained in such experiments were assumed
8
to be equivalent to the equilibrium constant when they were constant in time, within the
experimental error.
Regarding the thermodynamic properties, enthalpy, ΔrHº, entropy, ΔrSº, and standard Gibbs
free energy, ΔrGº, changes of each reaction at the temperature T, can be estimated from
formation properties of the involved compounds by means of the following expressions:
( )S
o or j f j
j 1
H T Hν=
Δ = Δ∑ (2)
( )S
o or j j
j 1
S T Sν=
Δ =∑ (3)
( )o o or r rG T H T SΔ = Δ − Δ (4)
Among thermochemical data concerning these reaction systems, it has been observed: (i) a
significant discrepancy in published values for some compounds, or (ii) inexistence of data in the
available databases, e.g. BTBE. When available, literature values were compared to experimental
results to select the most reliable sources. For non-available values, two different group-
contribution methods (Joback method 20 and Modified Benson method 21–23) were considered.
Estimates obtained by the modified Benson method were found to present lower discrepancies
with available published data and, consequently, this method was chosen to estimate the missing
values, rather than those obtained by the Joback method. When available, published
experimental values were preferred instead of estimates. Values considered in the present work
are listed in Table 3.
TABLE 3
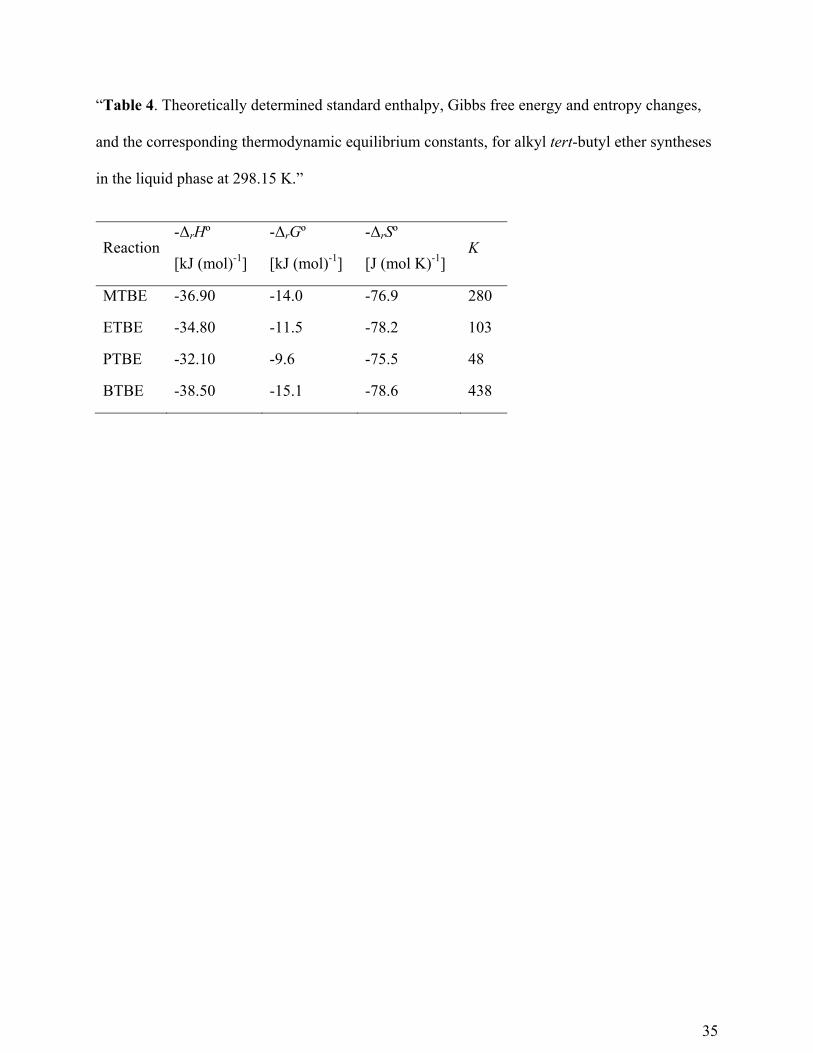
Table 4 lists theoretically estimated values of ΔrHº, ΔrGº and ΔrSº for each alkyl tert-butyl
ether synthesis in the liquid phase at 298.15 K, calculated by means of Eqs. 2-4, and the
9
corresponding thermodynamic equilibrium constants, K, at that temperature according to the
following relation:
o o or r rG H S
ln KRT RT R
−Δ −Δ Δ= = + (5)
TABLE 4
To check that the equilibrium constant, K, for each reaction was only a function of
temperature, that is, to discard possible pressure effects, the Poynting correction factor, P, was
calculated by means of the following expression 20:
S
j jj 1
P 1exp V
RTν
=
⎛ ⎞−= ⎜ ⎟⎝ ⎠
∑P (6)
where Vj is the liquid molar volume of compound j and P is the pressure expressed in atm. Since
values of P were close to unity for the whole experimental conditions range, the assumption of
null pressure effect on equilibrium constants has been accepted.
3.2. Experimental Results
Thermodynamic equilibrium data have been experimentally obtained for the considered series
of analogous reactions. The comparison between experimental equilibrium constants, literature
values, when available, and theoretical constants from formation data is provided in this section
for each synthesis.
MTBE synthesis
Thermodynamic properties of the MTBE synthesis (reaction R1 in Scheme 1) have been
widely studied throughout the years 24–30. Thus, only few experimental runs were carried out,
mainly to compare results with those quoted in literature and to validate the procedure through
which equilibrium data were obtained. MTBE experimental data were obtained in the fixed-bed

10
reactor system. Experimental conditions and results regarding these runs are provided in the
Supporting Information section (Table S1).
Values of the mass-action ratio of chemical compounds activities, Γa, were calculated from the
fixed-bed reactor outlet stream composition at steady state operating at two temperatures, using
different catalysts, and at LHSV values in the range of 2 to 20 h-1. Results depicted in Figure 1
show that, irrespectively of the used catalyst, at LHSV of about 2 h-1 the calculated Γa values can
be considered equal to the thermodynamic equilibrium constant values, KMTBE, quoted in
literature 24–30, within the margin of experimental error, for both temperatures. For higher LHSV,
Γa decreases at increasing LHSV, and reactor outlet stream would not be at equilibrium. In
particular, under the same LHSV and temperature conditions, the calculated value of Γa is larger
when the used catalyst has a higher acid capacity, as a result of its higher catalytic activity.
FIGURE 1
Figure 2 provides a comparison between experimental KMTBE at 323 and 343 K, those quoted in
literature, and theoretically determined equilibrium constants at different temperatures. The
agreement between results proves that the followed procedure to obtain equilibrium constants is
reliable.
FIGURE 2
ETBE synthesis
Even though thermodynamics of the ETBE synthesis (reaction R2 in Scheme 1) has been also
extensively dealt with in literature, for instance 31–36, the lack of agreement between sources has
often led to a discrepancy between theoretically and experimentally obtained equilibrium
constants 36. Thus, part of this study has been devoted to this reaction. In order to confirm the
reliability of the experimental equilibrium obtained in this work, ETBE experiments were carried

11
out in two different reactor systems, in a wider temperature range (313-383 K) and using
different catalysts. Experimental conditions and results for each individual experiment are
provided in the Supporting Information section (Tables S2 and S3).
As example, results of some experimental runs in each setup are shown in Figure 3. Figure 3A,
where a batch experiment performed at 323 K, RºA/O = 0.64, and 10% wt of A-35 as catalyst load
is shown, depicts the evolution in time of each compound molar fraction, x. Given that the
catalyst load was high, isobutene and ethanol quickly reacted to give ETBE, which reached a
molar fraction that hardly evolved in time, within the margin of experimental error.
Concentration of C4 compounds other than isobutene barely changed during the experiment,
because isobutane is an inert compound under the reaction conditions, and 2-butene needs higher
temperatures and ethanol initial concentrations to react in a significant extension. Regarding
side-reactions, TMP-1 and TMP-2 were the more largely formed byproducts.
Figure 3B shows the variation with LHSV of the reactor outlet stream composition, in terms of
xi, for fixed-bed experiments at 333 K, RºA/O = 1.10, and using A-35 as catalyst. As seen in the
figure, no significant variations were detected for different LHSV, what means that ETBE
kinetics was fast enough to reach chemical equilibrium at the reactor outlet in all the
experimental conditions range.
FIGURE 3
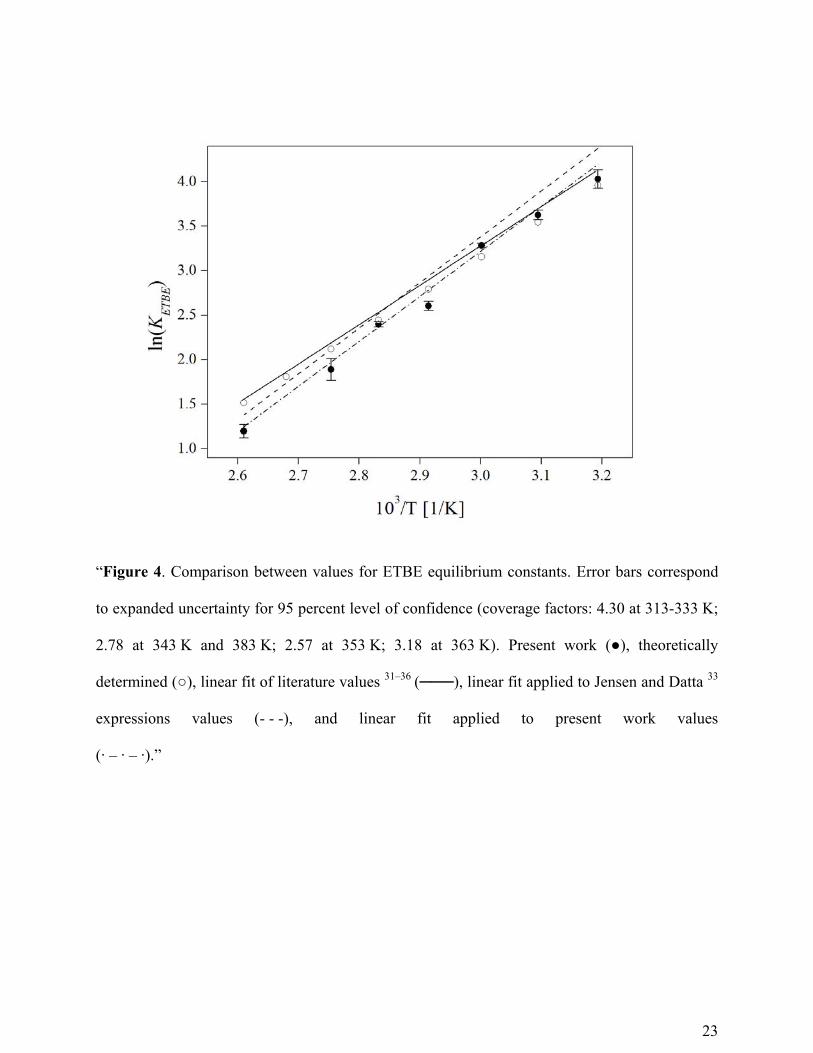
Regarding the equilibrium constant values for the ETBE synthesis, the comparison between
experimental results, those quoted in the literature and theoretical estimated values is provided in
Figure 4. As seen, experimental equilibrium constants, KETBE, are in a relatively good agreement
with both literature and theoretical values. It is noticeable that linear fits applied to experimental
results and to KETBE values derived from the expressions suggested by Jensen and Datta 33 almost
12
coincide in slopes and only a slight discrepancy in intercepts is observed. This fact, adds
reliability to the experimental results presented in the present work.
FIGURE 4
PTBE synthesis
Studies of thermodynamic properties on the PTBE synthesis (reaction R3 in Scheme 1) are
scarce in literature; only few works that studied this reaction were found 37–40. Experiments have
been carried out in the batch stirred tank reactor from different initial alcohol/isobutene molar
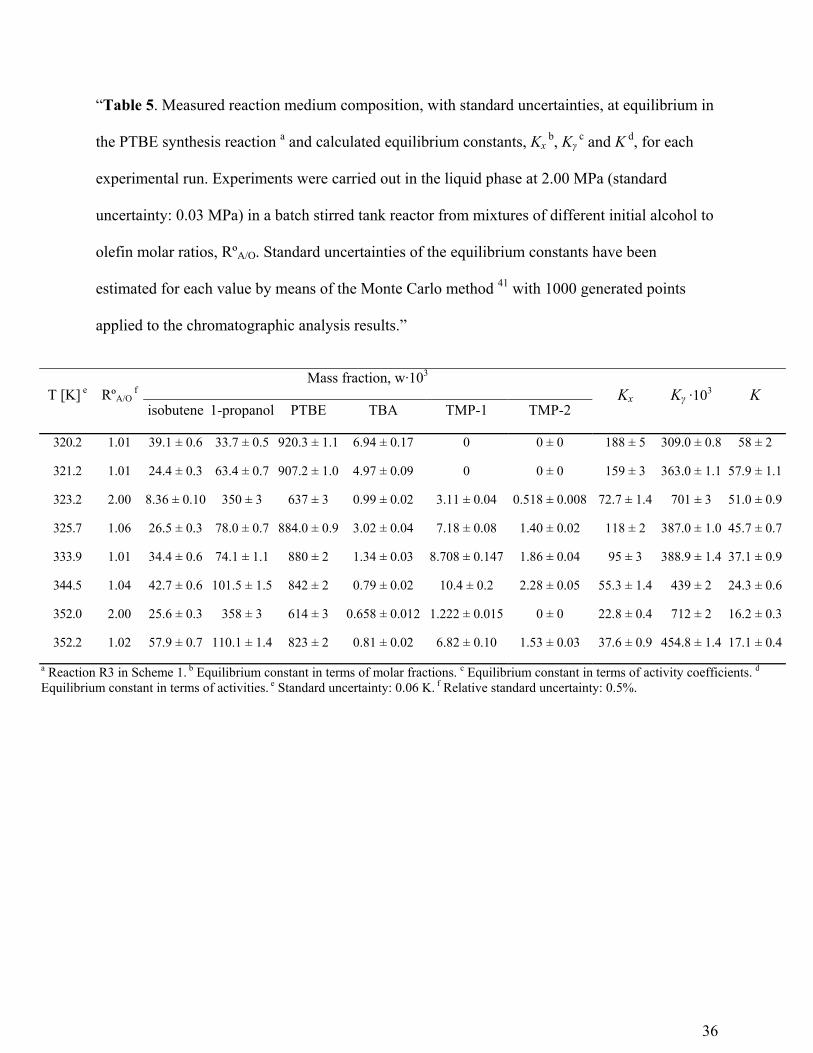
ratio, RºA/O, and at different temperatures, using A-35 as the catalyst. Figure 5 shows the
evolution in time of the PTBE molar fraction until chemical equilibrium was reached in the
different experimental runs. Experimental results at chemical equilibrium are given in Table 5.
FIGURE 5
TABLE 5
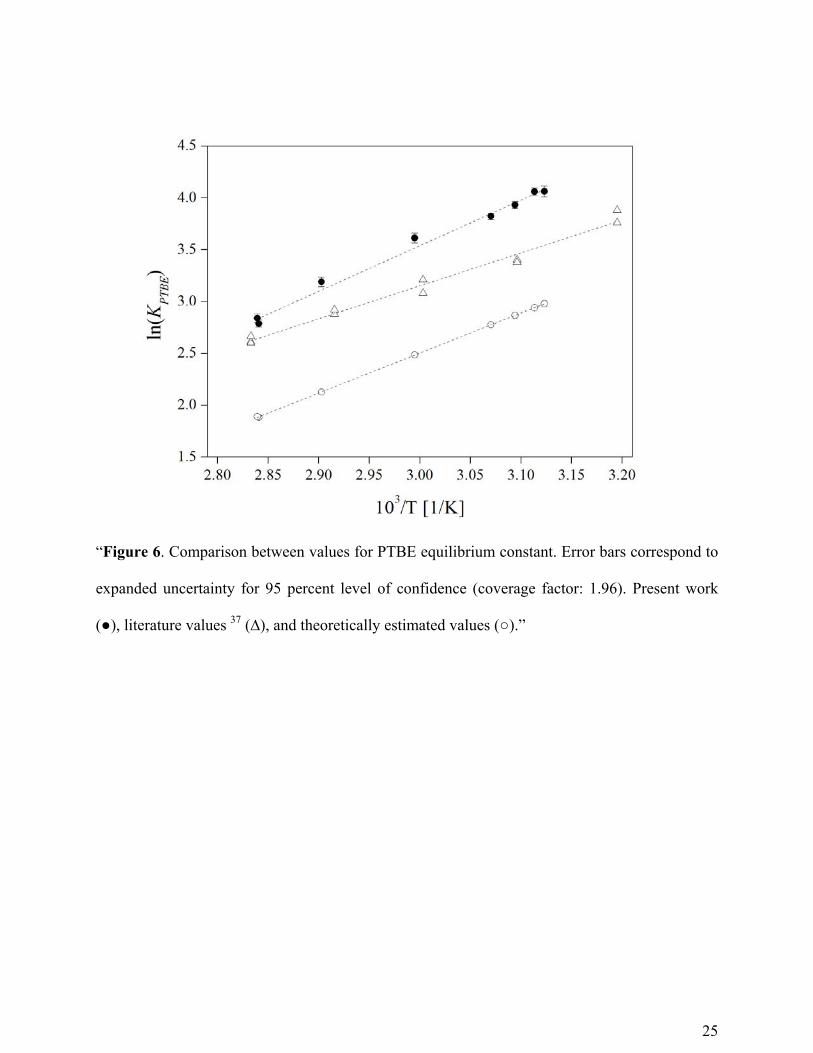
Figure 6 provides a comparison between experimental, published 37, and theoretically
estimated values of KPTBE. Although in that figure some discrepancies are revealed, the slope of
the linear fit of the theoretically determined equilibrium constants and that of the present work
are almost coincident. Regarding values quoted in literature, the trend they describe differs from
that described by both experimental KPTBE of the present work and theoretical values.
FIGURE 6
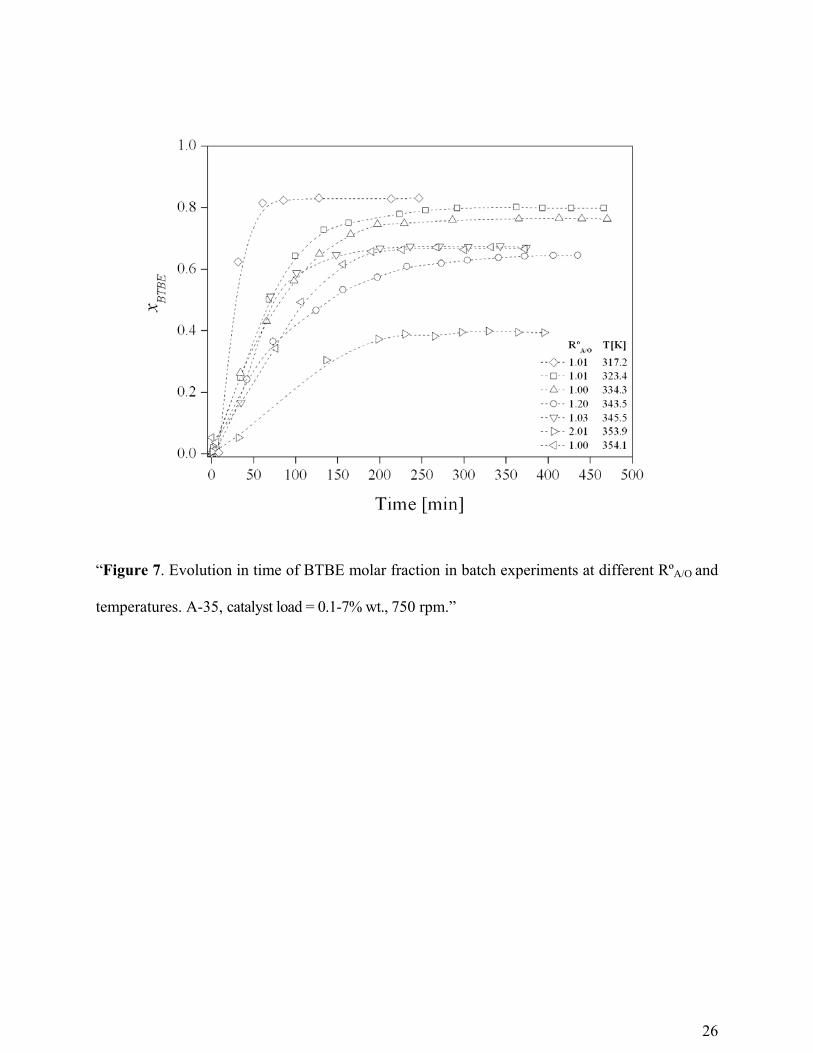
BTBE synthesis
Studies concerning BTBE synthesis (reaction R4 in Scheme 1) equilibrium are hard to find in
literature 42,43. To estimate thermodynamic properties, we followed the same procedure in which
temperature and initial concentrations were varied to reach equilibrium compositions, using A-35
as the catalyst in the batch reactor. Figure 7 shows the evolution in time of the BTBE molar

13
fraction for the different experimental runs until chemical equilibrium was reached.
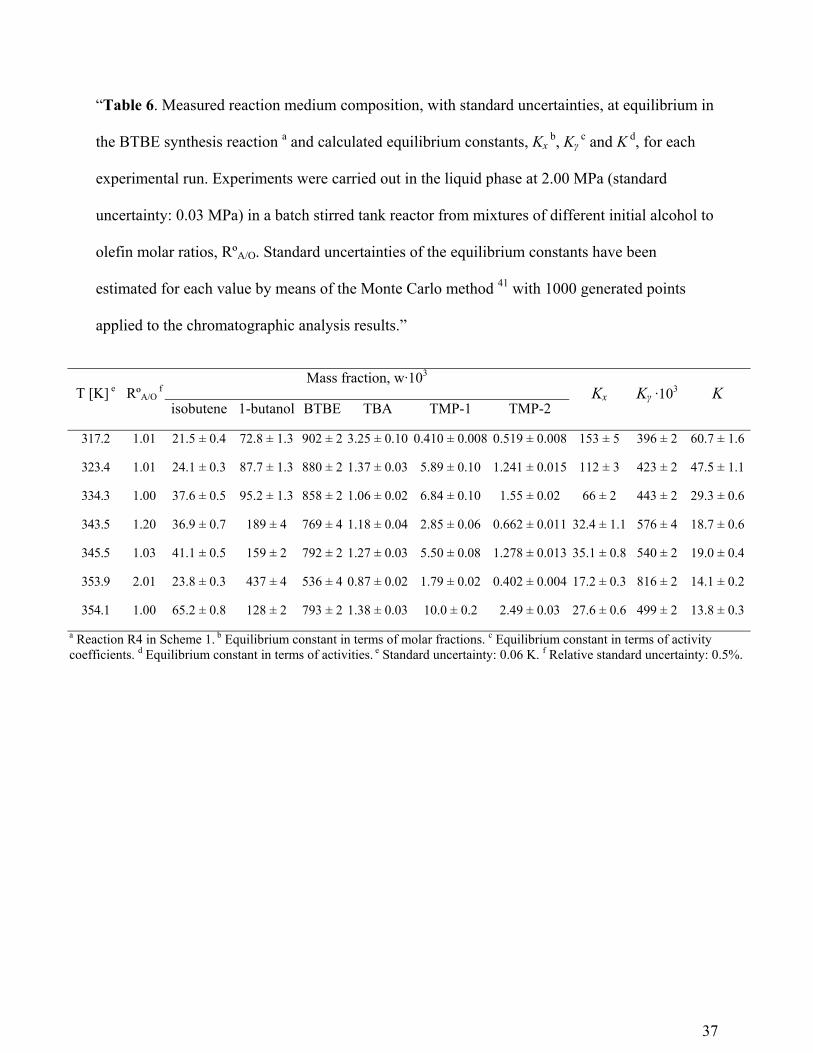
Experimental results at equilibrium are given in Table 6.
FIGURE 7
TABLE 6
In Figure 8, experimental KBTBE values are compared to those reported in literature and to
theoretically determined ones. As it can be seen, experimental data from literature 42 and from
the present work are coincident, whereas a significant discrepancy can be observed regarding
theoretical equilibrium constants. From dashed lines in Figure 8, it becomes clear that
discrepancies between theoretically estimated and experimental values involve intercepts rather
than slopes of linear fits.
FIGURE 8
3.3. Thermodynamic Properties
Figure 9 depicts ln K versus 1/T for the four studied equilibrium reactions, by assuming that
the enthalpy change of etherification reactions can be considered constant within the assayed
temperature range. As seen in the figure, experimental results fit well to straight lines and
therefore reaction enthalpy could be considered independent on temperature (ΔrHº ≠ f(T)).
FIGURE 9
The standard molar enthalpy change of reaction, ΔrHº, can be obtained from the slope and the
standard molar entropy change of reaction, ΔrSº, from the intercept. The resulting fitted
equations obtained by least squares regression are, the uncertainty of the parameters being at the
95 percent level of confidence (coverage factor for parameters in KMTBE and KBTBE: 2.57; KETBE:
2.05; KPTBE: 2.45):
( ) ( )MTBE
4540 1190ln K 9.7 3.5
T
±= − ± (7)

14
( ) ( )ETBE
4860 210ln K 11.46 0.60
T
±= − ± (8)
( ) ( )PTBE
4360 430ln K 9.52 1.29
T
±= − ± (9)
( ) ( )BTBE
4570 340ln K 10.30 0.99
T
±= − ± (10)
Eq. 7 is shown for comparative purposes, since it presents a considerable uncertainty in its
parameters because MTBE experiments were performed at only two temperatures. Thus, the
above expression is not recommended to determine thermodynamic properties of the MTBE
synthesis. The following expression from literature 26 should be used instead.
( ) ( )MTBE
4703 96ln K 10.3 0.1
T
±= − ± (11)
On the other hand, if ΔrHº is considered to be temperature dependent, it can be expressed by
the Kirchoff equation:
j
o Sor
j Pj 1
d HC
dTν
=
Δ =∑ (12)
where j
oPC is the liquid phase molar heat capacity of each compound j in the considered reaction,
which can be calculated as a function of the temperature by the equation and coefficients given
in Table 7.
TABLE 7
Table 7 shows heat capacity coefficients taken from literature, estimated and experimentally
determined. Literature values from different sources are reliable beyond doubt. As example,
ETBE-related values from different works 27,33,36 lead to the same estimated heat capacity. With
respect to unavailable coefficients, estimation of 1-propanol and 1-butanol molar heat capacities
by different estimation methods, i.e. Missenard and Růžička-Domalski methods 20,21, lead to

15
values that are similar to those quoted in literature 44 and consequently they can be considered as
reliable. Missenard estimates were chosen because overall discrepancies with available databases
regarding the four studied alcohols were found to be lower. As for the two missing ethers,
namely PTBE and BTBE, their molar heat capacity variation with temperature was
experimentally determined at the Scientific and Technological Centers (CCiT) of the University
of Barcelona by differential scanning calorimetry (DSC) analysis in the temperature range of 298
to 368 K, which allowed obtaining the coefficients by fitting the equation in Table 7. Figure 10
shows the molar heat capacity values that were not found in the available literature as a function
of temperature.
FIGURE 10
The integrated form of the Kirchoff equation, combined with the equation in Table 7, gives the
following expression for each reaction:
o 2 3 4r K
b c dH I aT T T T
2 3 4Δ = + + + + (13)
where:
S S S S
j j j j j j j jj 1 j 1 j 1 j 1
a a b b c c d dν ν ν ν= = = =
= = = =∑ ∑ ∑ ∑ (14)
The dependence of the equilibrium constant on temperature is described by the van’t Hoff
equation:
or
2
Hd ln K
dT RT
−Δ= (15)
Eq. 15, combined with Eq. 13 and integrated, leads to:
2 3KH
I a b c dln K I lnT T T T
RT R 2R 6 R 12R= − + + + + (16)
16
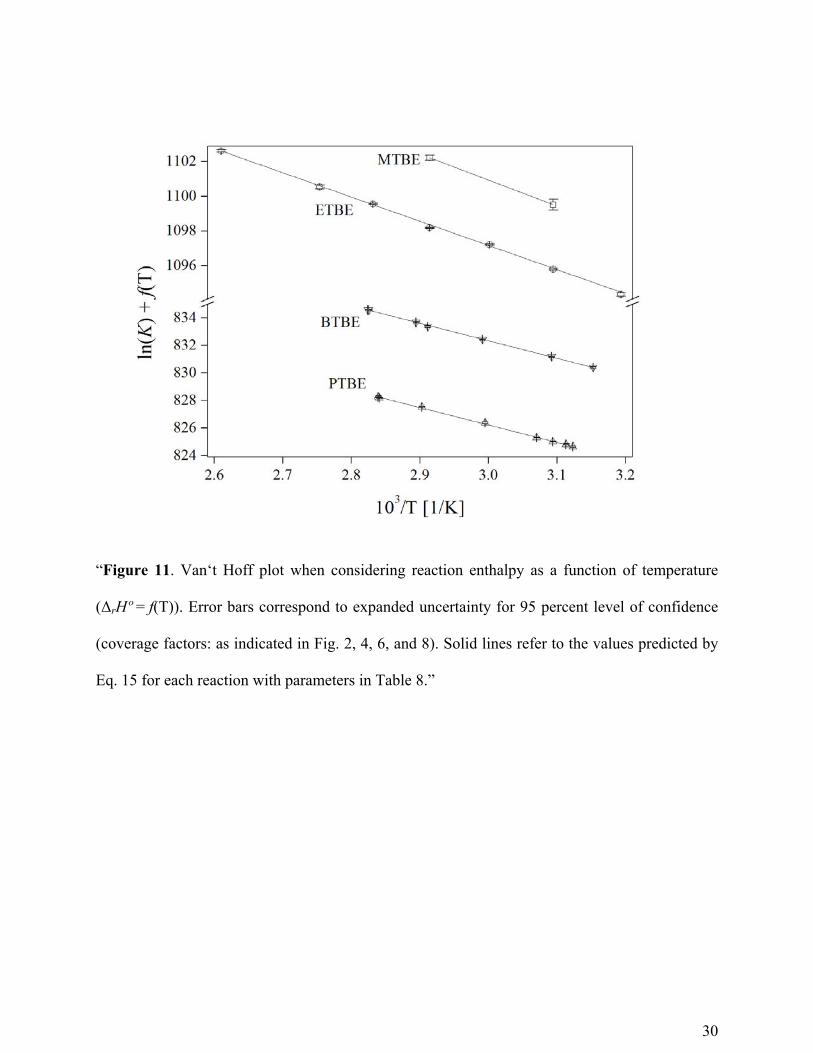
where IK and IH are the integration constants. The fit of Eq. 16 to the experimental values of the
equilibrium constants at different temperatures allows obtaining IK value from the slope and IH
value from the intercept. Figure 11 provides the Van‘t Hoff plot when reaction enthalpy change
is considered temperature dependent (ΔrHº = f(T)).
FIGURE 11
Finally, the standard molar entropy and free energy changes of each reaction, ∆rSº and ∆rGº,
can be evaluated by means of the following expressions:
o 2 3H
c dS RI a a lnT bT T T
2 3Δ = + + + + + (17)
o 2 3 4K H
b c dG I RI T aT lnT T T T
2 6 12Δ = − − − − − (18)
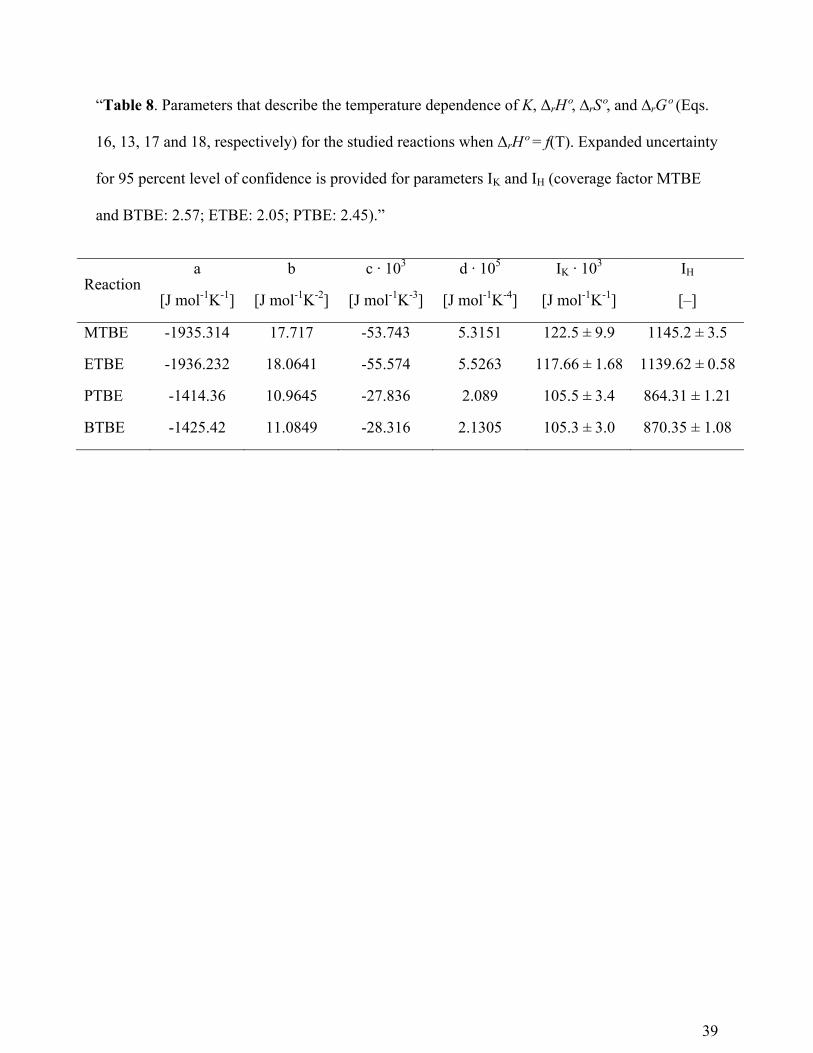
Parameters of Eqs. 13, 16-18 are shown in Table 8. Summary of thermochemical properties
determined for the studied reactions is provided in Table 9.
TABLE 8
TABLE 9
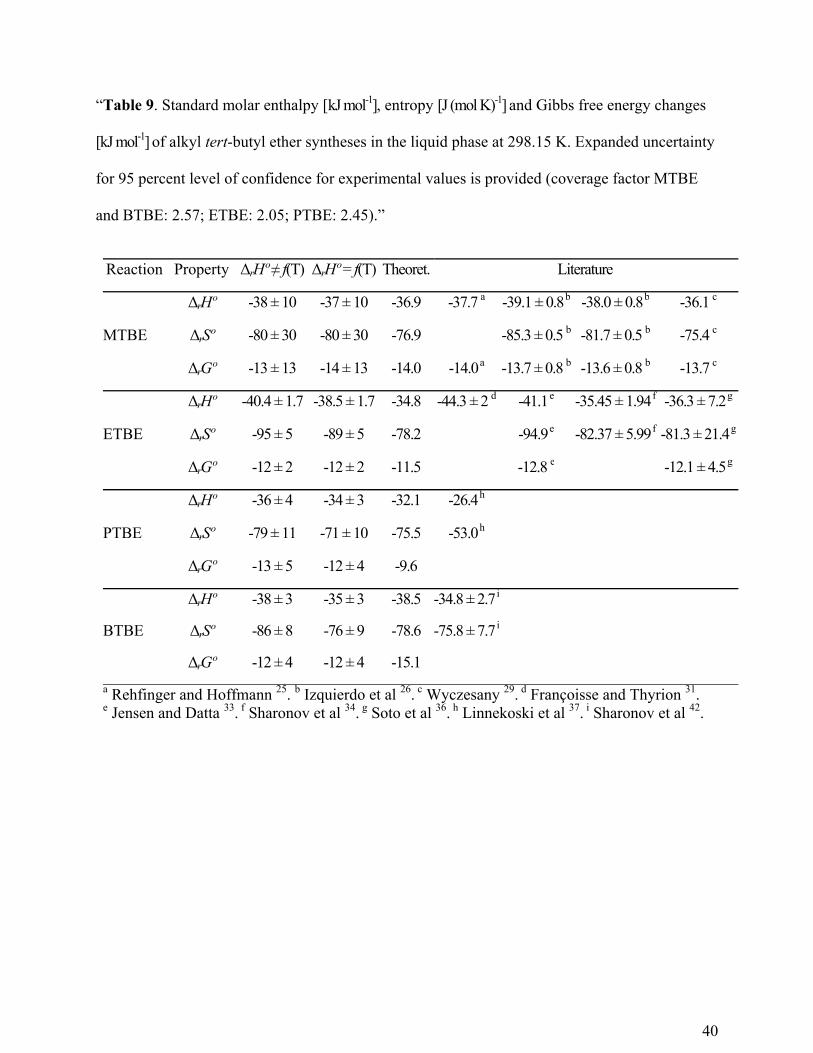
The estimated values of the thermodynamic properties of the studied reactions are globally in
good agreement with the data available in the literature (Table 9). In this work, values for MTBE
synthesis have been obtained from experimental runs at only two temperatures, with a large
relative uncertainty, and, therefore, they are provided for comparative purposes. Consequently,
the use of literature values for MTBE is recommended, especially those by Izquierdo et al 26.
Concerning ETBE synthesis, the estimated values are coincident, within the experimental error,
with those reported by Jensen and Datta 33, obtained from both theoretical relations and
experimental results, and with those by Soto et al 36, determined experimentally in a slightly
different reaction system, the simultaneous production of ETBE and tert-amyl ethyl ether.
Values by Françoisse and Thyrion 31 are a bit larger, and values by Sharonov et al 34 agree with

17
theoretical values. There are very few studies in the available literature devoted to
thermodynamic equilibrium of PTBE and BTBE synthesis. In the PTBE synthesis, the estimated
values are close to the theoretical ones, and differences with Linnekoski et al 37 are regarded as
inconclusive. With respect to BTBE synthesis, the present results agree with the values reported
by Sharonov et al 42, and they are close to the theoretical ones.
A rather good agreement is observed between experimental and theoretically estimated
thermodynamic state functions. Nevertheless, slight differences between theoretical and
experimental thermodynamic properties lead to obvious discrepancies regarding theoretical and
experimentally obtained equilibrium constants, as it has been already commented, given the
exponential dependence defined by the Van’t Hoff equation. These discrepancies are particularly
evident in the intercepts of the Van’t Hoff plots rather than in their slopes. Consequently,
discrepancies between theoretical and experimental entropy changes of reaction are larger than
between enthalpy changes. As example, the theoretical entropy change of the ETBE synthesis
seems to be overestimated, as it can be seen by comparing that value to those reported either in
this work or in literature. In this sense, a remark should be made about the thermochemical data
used to determine theoretical values: experimentally-based databases should be extended
because, even though estimation methods can provide relatively accurate values, small
deviations lead to considerable discrepancies with experimental thermodynamic data.
At this point, thermochemical data of formation of the four ethers produced in these reactions
have been readjusted accordingly with present experimental data, by considering the reaction
enthalpy as a function of temperature (ΔrHº = f(T)). As seen in Table 10, relative differences of
readjusted values, compared to those presented in Table 3, are quite low and, therefore, they can

18
be considered as acceptable. The general agreement between proposed values and either reported
or estimated ones reinforces the reliability of the present study.
TABLE 10
Finally, concerning the two alternatives early used on whether to consider the reaction
enthalpy change as a function of temperature or not (ΔrHº = f(T) or ΔrHºi ≠ f(T)), Table 11 shows
the variation of the enthalpy change of reaction, ΔrHº, in the temperature range 323-353 K. As
seen in the table, maximum relative differences between values are 2.7%, 3.6%, 7.1%, and 7.6%,
for the syntheses of MTBE, ETBE, PTBE, and BTBE, respectively. Thus, enthalpies of reaction
are more sensitive to temperature variations as the size of the produced ether increases,
especially for PTBE and BTBE.
TABLE 11
The variation with temperature of enthalpy changes of reaction regarding the four studied
syntheses are quite close to those previously reported in literature. For instance, observed
enthalpy variations in the syntheses of MTBE and ETBE were 3.4% and 3.6%, respectively, over
the same temperature range, according to values previously reported 26,36. On the other hand, also
from literature values 37,42, the variation with temperature of PTBE and BTBE enthalpy changes
of reaction were 10% and 9%, respectively, over the same temperature range. Therefore,
regarding both PTBE and BTBE syntheses, it would be advisable to consider the enthalpy
change of reaction as temperature dependent.
4. CONCLUSIONS
Extensive experimental data are provided to estimate enthalpy, entropy and free energy
changes of liquid-phase etherification of isobutene with C1 to C4 linear primary alcohols.
Experimental equilibrium results for the involved reactions have been proven to be independent
19
of the catalyst and reactor type. All four chemical reactions have been found to be reversible and
exothermic. Consequently, the amount of produced ethers at equilibrium decreases at increasing
temperature.
If the enthalpy change of reaction is considered as independent on temperature, estimated
values of the liquid-phase standard enthalpy changes of the synthesis reactions of MTBE, ETBE,
PTBE and BTBE are -38 ± 10, -40.4 ± 1.7, -36 ± 4, and -38 ± 3 kJ mol-1, respectively. If the
enthalpy change is considered as a function of temperature, their estimated values at 298.15 K
are -37 ± 10, -38.5 ± 1.7, -34 ± 3 and -35 ± 3 kJ mol-1, respectively. Reaction enthalpies of PTBE
and BTBE synthesis are more sensitive to temperature than those of MTBE and ETBE synthesis.
Liquid-phase standard state thermochemical data concerning the four produced ethers have
been estimated as the following enthalpies of formation: -313.5, -353.6, -373.6 and -399.8 kJ
mol-1, and the following entropies: 264.5, 286.7, 338.5 and 365.0 J (mol K)-1 for MTBE, ETBE,
PTBE and BTBE, respectively.
20
FIGURES
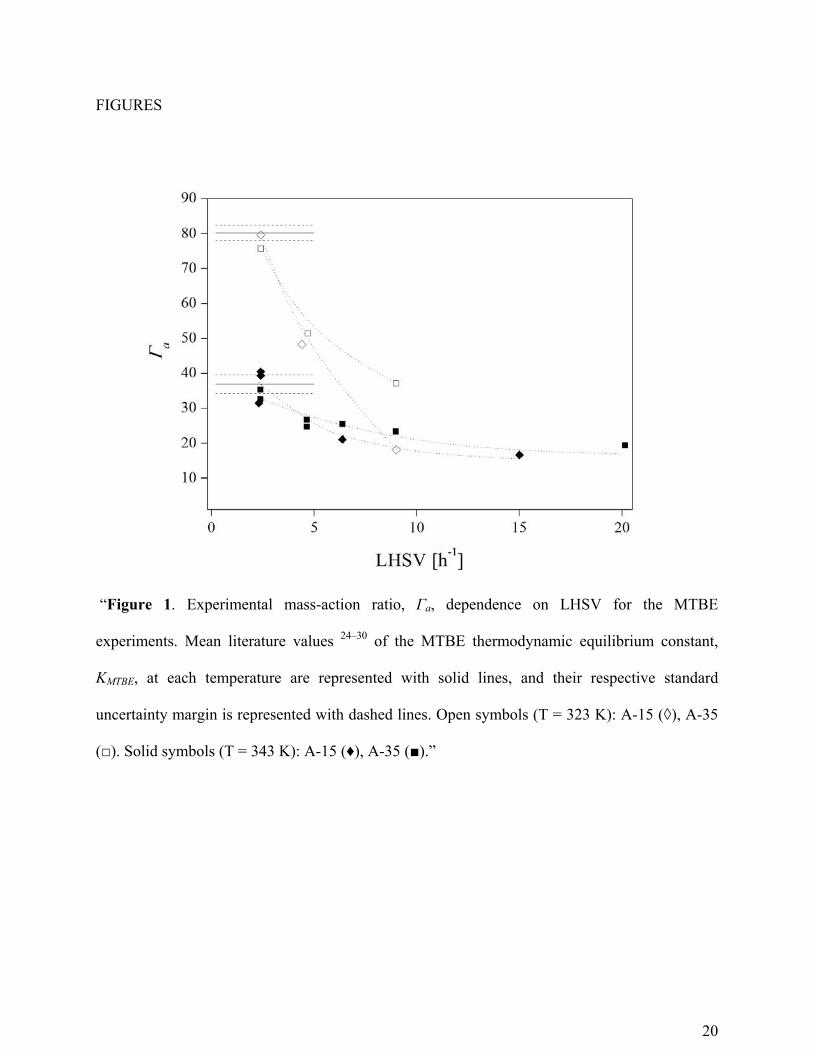
“Figure 1. Experimental mass-action ratio, Γa, dependence on LHSV for the MTBE
experiments. Mean literature values 24–30 of the MTBE thermodynamic equilibrium constant,
KMTBE, at each temperature are represented with solid lines, and their respective standard
uncertainty margin is represented with dashed lines. Open symbols (T = 323 K): A-15 (◊), A-35
(□). Solid symbols (T = 343 K): A-15 (♦), A-35 (■).”

21
“Figure 2. Comparison between MTBE equilibrium constant values. Error bars correspond to
expanded uncertainty for 95 percent level of confidence (coverage factors: 12.71 at 323 K; 2.78
at 343 K). Present work (●), theoretically determined values (○), and linear fit of literature values
24–30 (───).”

22
“Figure 3. Molar fraction evolution in time for the ETBE synthesis in a batch experiment at
T = 323 K, RºA/O = 0.64, stirring speed of 500 rpm, with a catalyst load of A-35 equal to 10% wt. of
the reactant mixture (A), and outlet stream steady-state molar fraction variation with LHSV for the
ETBE synthesis in fixed-bed experiments at T = 333 K, RºA/O = 1.10, using A-35 as catalyst (B).
IB (○), EtOH (□), isobutane (Δ), 2-butene (▽), ETBE ( ), ESBE ( ), DEE (◊), TBA (−),
TMP-1 (×) and TMP-2 (+).”
23
“Figure 4. Comparison between values for ETBE equilibrium constants. Error bars correspond
to expanded uncertainty for 95 percent level of confidence (coverage factors: 4.30 at 313-333 K;
2.78 at 343 K and 383 K; 2.57 at 353 K; 3.18 at 363 K). Present work (●), theoretically
determined (○), linear fit of literature values 31–36 (───), linear fit applied to Jensen and Datta 33
expressions values (- - -), and linear fit applied to present work values
(· – · – ·).”

24
“Figure 5. Evolution in time of PTBE molar fraction in batch experiments at different RºA/O and
temperatures. A-35, catalyst load = 0.1-11% wt., 750 rpm.”
25
“Figure 6. Comparison between values for PTBE equilibrium constant. Error bars correspond to
expanded uncertainty for 95 percent level of confidence (coverage factor: 1.96). Present work
(●), literature values 37 (∆), and theoretically estimated values (○).”
26
“Figure 7. Evolution in time of BTBE molar fraction in batch experiments at different RºA/O and
temperatures. A-35, catalyst load = 0.1-7% wt., 750 rpm.”

27
“Figure 8. Comparison between values for BTBE equilibrium constant. Error bars correspond to
expanded uncertainty for 95 percent level of confidence (coverage factor: 1.96). Present work
(●), literature values 42 (∆), and theoretically estimated values (○).”

28
“Figure 9. Van‘t Hoff plot when considering reaction enthalpy change constant within the
temperature range (ΔrHº ≠ f(T)). Error bars correspond to expanded uncertainty for 95 percent
level of confidence (coverage factors: as indicated in Fig. 2, 4, 6, and 8). Solid lines refer to the
values predicted using Eqs. 7–10.”

29
“Figure 10. Molar heat capacity variation with temperature. Solid lines correspond to predicted
values using the equation and parameters in Table 7. Dashed lines correspond to estimation of
molar heat capacity by Missenard method. Solid symbols refer to experimental determination by
DSC: PTBE (▲), BTBE (▼). Open symbols refer to literature values 44: 1-propanol (○),
1-butanol (□).”
30
“Figure 11. Van‘t Hoff plot when considering reaction enthalpy as a function of temperature
(ΔrHº = f(T)). Error bars correspond to expanded uncertainty for 95 percent level of confidence
(coverage factors: as indicated in Fig. 2, 4, 6, and 8). Solid lines refer to the values predicted by
Eq. 15 for each reaction with parameters in Table 8.”

31
SCHEMES
“Scheme 1. Main reactions involved.”

32
TABLES.
“Table 1. Source, purity, and analysis of used materials.”
Compound Source Mass Fraction Purity
Analysis Method
methanol Panreac ≥ 99.8 gas chromatography ethanol Panreac ≥ 99.8 gas chromatography 1-propanol Sigma-Aldrich ≥ 99.7 gas chromatography 1-butanol Sigma-Aldrich ≥ 99.8 gas chromatography 2-methylpropene Air Liquide ≥ 99.9 gas chromatography
C4 mixture a Abelló-Linde ≥ 99.9 gas chromatography
2-methyl-2-propanol Panreac ≥ 99.7 gas chromatography diethyl ether Panreac ≥ 99.5 gas chromatography 2,4,4-trimethyl-1-pentene Sigma-Aldrich ≥ 98.0 gas chromatography 2,4,4-trimethyl-2-pentene Sigma-Aldrich ≥ 98.0 gas chromatography 2-ethoxybutane TCI Europe ≥ 99.7 gas chromatography 2-methoxy-2-methylpropane Panreac ≥ 99.9 gas chromatography 2-ethoxy-2-methylpropane TCI Europe ≥ 95.0 gas chromatography 2-methyl-2-propoxypropane synthesis ≥ 99.0 b gas chromatography
1-tert-butoxybutane synthesis ≥ 98.0 b gas chromatography nitrogen Air Liquide ≥ 99.9995 – helium Abelló-Linde ≥ 99.998 –
a C4 mixture composition: 25% wt. 2-methylpropene, 40% wt. isobutane, and 35% trans-2-butene. b Purified in our lab through liquid-liquid extraction followed by rectification.
33
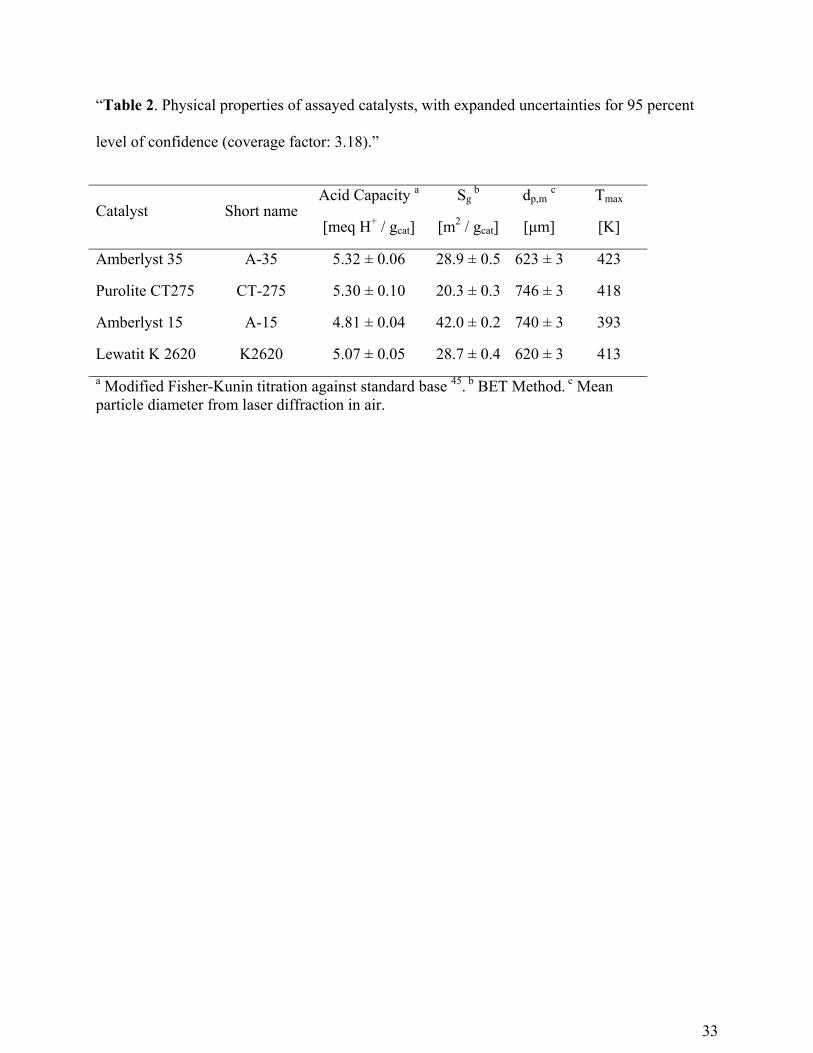
“Table 2. Physical properties of assayed catalysts, with expanded uncertainties for 95 percent
level of confidence (coverage factor: 3.18).”
Catalyst Short name Acid Capacity a
[meq H+ / gcat]
Sg b
[m2 / gcat]
dp,m c
[μm]
Tmax
[K]
Amberlyst 35 A-35 5.32 ± 0.06 28.9 ± 0.5 623 ± 3 423
Purolite CT275 CT-275 5.30 ± 0.10 20.3 ± 0.3 746 ± 3 418
Amberlyst 15 A-15 4.81 ± 0.04 42.0 ± 0.2 740 ± 3 393
Lewatit K 2620 K2620 5.07 ± 0.05 28.7 ± 0.4 620 ± 3 413
a Modified Fisher-Kunin titration against standard base 45. b BET Method. c Mean particle diameter from laser diffraction in air.
34
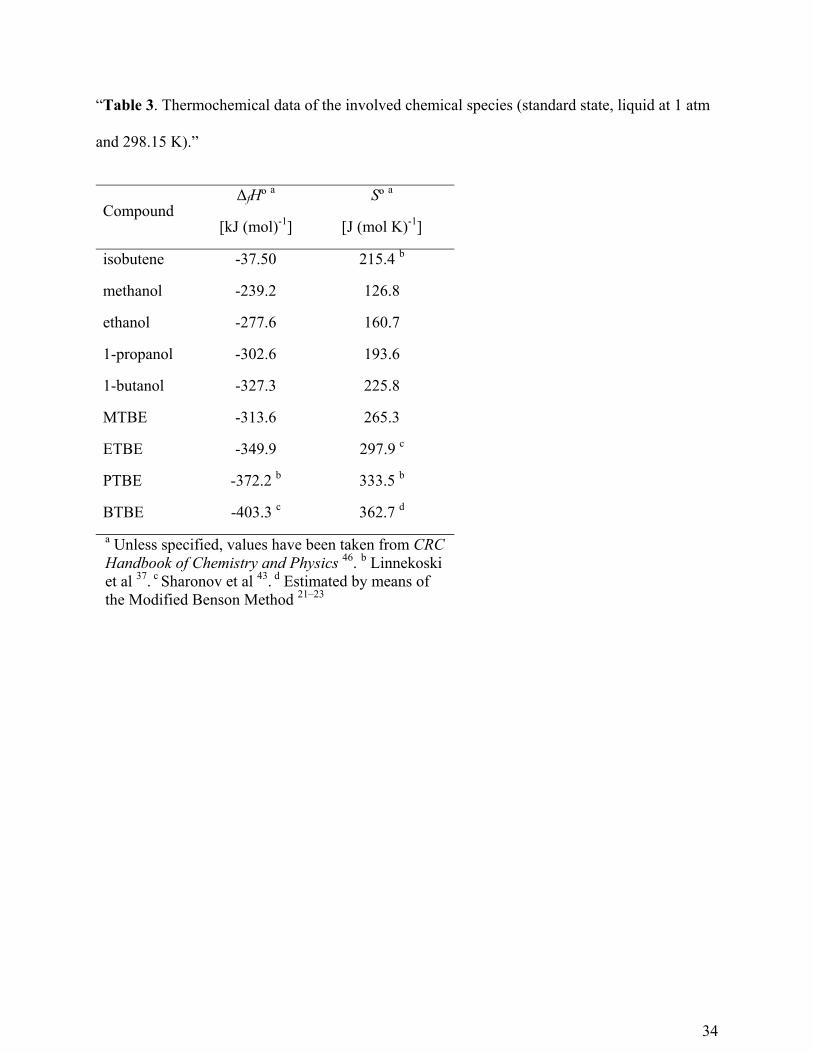
“Table 3. Thermochemical data of the involved chemical species (standard state, liquid at 1 atm
and 298.15 K).”
Compound ΔfHº a
[kJ (mol)-1]
Sº a
[J (mol K)-1]
isobutene -37.50 215.4 b
methanol -239.2 126.8
ethanol -277.6 160.7
1-propanol -302.6 193.6
1-butanol -327.3 225.8
MTBE -313.6 265.3
ETBE -349.9 297.9 c
PTBE -372.2 b 333.5 b
BTBE -403.3 c 362.7 d
a Unless specified, values have been taken from CRC Handbook of Chemistry and Physics 46. b Linnekoski et al 37. c Sharonov et al 43. d Estimated by means of the Modified Benson Method 21–23
35
“Table 4. Theoretically determined standard enthalpy, Gibbs free energy and entropy changes,
and the corresponding thermodynamic equilibrium constants, for alkyl tert-butyl ether syntheses
in the liquid phase at 298.15 K.”
Reaction -ΔrHº
[kJ (mol)-1]
-ΔrGº
[kJ (mol)-1]
-ΔrSº
[J (mol K)-1] K
MTBE -36.90 -14.0 -76.9 280
ETBE -34.80 -11.5 -78.2 103
PTBE -32.10 -9.6 -75.5 48
BTBE -38.50 -15.1 -78.6 438
36
“Table 5. Measured reaction medium composition, with standard uncertainties, at equilibrium in
the PTBE synthesis reaction a and calculated equilibrium constants, Kx b, Kγ
c and K d, for each
experimental run. Experiments were carried out in the liquid phase at 2.00 MPa (standard
uncertainty: 0.03 MPa) in a batch stirred tank reactor from mixtures of different initial alcohol to
olefin molar ratios, RºA/O. Standard uncertainties of the equilibrium constants have been
estimated for each value by means of the Monte Carlo method 41 with 1000 generated points
applied to the chromatographic analysis results.”
T [K] e RºA/O f
Mass fraction, w·103 Kx Kγ ·103 K
isobutene 1-propanol PTBE TBA TMP-1 TMP-2
320.2 1.01 39.1 ± 0.6 33.7 ± 0.5 920.3 ± 1.1 6.94 ± 0.17 0 0 ± 0 188 ± 5 309.0 ± 0.8 58 ± 2
321.2 1.01 24.4 ± 0.3 63.4 ± 0.7 907.2 ± 1.0 4.97 ± 0.09 0 0 ± 0 159 ± 3 363.0 ± 1.1 57.9 ± 1.1
323.2 2.00 8.36 ± 0.10 350 ± 3 637 ± 3 0.99 ± 0.02 3.11 ± 0.04 0.518 ± 0.008 72.7 ± 1.4 701 ± 3 51.0 ± 0.9
325.7 1.06 26.5 ± 0.3 78.0 ± 0.7 884.0 ± 0.9 3.02 ± 0.04 7.18 ± 0.08 1.40 ± 0.02 118 ± 2 387.0 ± 1.0 45.7 ± 0.7
333.9 1.01 34.4 ± 0.6 74.1 ± 1.1 880 ± 2 1.34 ± 0.03 8.708 ± 0.147 1.86 ± 0.04 95 ± 3 388.9 ± 1.4 37.1 ± 0.9
344.5 1.04 42.7 ± 0.6 101.5 ± 1.5 842 ± 2 0.79 ± 0.02 10.4 ± 0.2 2.28 ± 0.05 55.3 ± 1.4 439 ± 2 24.3 ± 0.6
352.0 2.00 25.6 ± 0.3 358 ± 3 614 ± 3 0.658 ± 0.012 1.222 ± 0.015 0 ± 0 22.8 ± 0.4 712 ± 2 16.2 ± 0.3
352.2 1.02 57.9 ± 0.7 110.1 ± 1.4 823 ± 2 0.81 ± 0.02 6.82 ± 0.10 1.53 ± 0.03 37.6 ± 0.9 454.8 ± 1.4 17.1 ± 0.4
a Reaction R3 in Scheme 1. b Equilibrium constant in terms of molar fractions. c Equilibrium constant in terms of activity coefficients. d Equilibrium constant in terms of activities. e Standard uncertainty: 0.06 K. f Relative standard uncertainty: 0.5%.
37
“Table 6. Measured reaction medium composition, with standard uncertainties, at equilibrium in
the BTBE synthesis reaction a and calculated equilibrium constants, Kx b, Kγ
c and K d, for each
experimental run. Experiments were carried out in the liquid phase at 2.00 MPa (standard
uncertainty: 0.03 MPa) in a batch stirred tank reactor from mixtures of different initial alcohol to
olefin molar ratios, RºA/O. Standard uncertainties of the equilibrium constants have been
estimated for each value by means of the Monte Carlo method 41 with 1000 generated points
applied to the chromatographic analysis results.”
T [K] e RºA/O f
Mass fraction, w·103
Kx Kγ ·103 K isobutene 1-butanol BTBE TBA TMP-1 TMP-2
317.2 1.01 21.5 ± 0.4 72.8 ± 1.3 902 ± 2 3.25 ± 0.10 0.410 ± 0.008 0.519 ± 0.008 153 ± 5 396 ± 2 60.7 ± 1.6
323.4 1.01 24.1 ± 0.3 87.7 ± 1.3 880 ± 2 1.37 ± 0.03 5.89 ± 0.10 1.241 ± 0.015 112 ± 3 423 ± 2 47.5 ± 1.1
334.3 1.00 37.6 ± 0.5 95.2 ± 1.3 858 ± 2 1.06 ± 0.02 6.84 ± 0.10 1.55 ± 0.02 66 ± 2 443 ± 2 29.3 ± 0.6
343.5 1.20 36.9 ± 0.7 189 ± 4 769 ± 4 1.18 ± 0.04 2.85 ± 0.06 0.662 ± 0.011 32.4 ± 1.1 576 ± 4 18.7 ± 0.6
345.5 1.03 41.1 ± 0.5 159 ± 2 792 ± 2 1.27 ± 0.03 5.50 ± 0.08 1.278 ± 0.013 35.1 ± 0.8 540 ± 2 19.0 ± 0.4
353.9 2.01 23.8 ± 0.3 437 ± 4 536 ± 4 0.87 ± 0.02 1.79 ± 0.02 0.402 ± 0.004 17.2 ± 0.3 816 ± 2 14.1 ± 0.2
354.1 1.00 65.2 ± 0.8 128 ± 2 793 ± 2 1.38 ± 0.03 10.0 ± 0.2 2.49 ± 0.03 27.6 ± 0.6 499 ± 2 13.8 ± 0.3
a Reaction R4 in Scheme 1. b Equilibrium constant in terms of molar fractions. c Equilibrium constant in terms of activity coefficients. d Equilibrium constant in terms of activities. e Standard uncertainty: 0.06 K. f Relative standard uncertainty: 0.5%.

38
“Table 7. Molar heat capacity coefficients of the equation o 1 1 2 3PC J mol K a bT cT dT− −⎡ ⎤ = + + +⎣ ⎦ ,
where T is expressed in K.”
Compound a b c · 103 d · 105
isobutene a 596.89 -4.6357 14.40 -1.372
methanol a 1391.6 -12.364 37.81 -3.719
ethanol a 1422.5 -12.839 40.31 -4.016
1-propanol b 277.77 -2.0498 7.476 -0.7170
1-butanol b 320.73 -2.2142 7.986 -0.7585
MTBE a 53.176 0.7173 -1.533 0.2241
ETBE a 83.158 0.5894 -0.864 0.1383
PTBE c -539.7 4.279 -5.96 0
BTBE c -507.8 4.235 -5.93 0
a Izquierdo et al 27. b Estimated by Missenard method 20.c Determined by differential scanning calorimetry (DSC).
39
“Table 8. Parameters that describe the temperature dependence of K, ΔrHº, ∆rSº, and ∆rGº (Eqs.
16, 13, 17 and 18, respectively) for the studied reactions when ΔrHº = f(T). Expanded uncertainty
for 95 percent level of confidence is provided for parameters IK and IH (coverage factor MTBE
and BTBE: 2.57; ETBE: 2.05; PTBE: 2.45).”
Reaction a
[J mol-1K-1]
b
[J mol-1K-2]
c · 103
[J mol-1K-3]
d · 105
[J mol-1K-4]
IK · 103
[J mol-1K-1]
IH
[–]
MTBE -1935.314 17.717 -53.743 5.3151 122.5 ± 9.9 1145.2 ± 3.5
ETBE -1936.232 18.0641 -55.574 5.5263 117.66 ± 1.68 1139.62 ± 0.58
PTBE -1414.36 10.9645 -27.836 2.089 105.5 ± 3.4 864.31 ± 1.21
BTBE -1425.42 11.0849 -28.316 2.1305 105.3 ± 3.0 870.35 ± 1.08
40
“Table 9. Standard molar enthalpy [kJ mol-1], entropy [J (mol K)-1] and Gibbs free energy changes
[kJ mol-1] of alkyl tert-butyl ether syntheses in the liquid phase at 298.15 K. Expanded uncertainty
for 95 percent level of confidence for experimental values is provided (coverage factor MTBE
and BTBE: 2.57; ETBE: 2.05; PTBE: 2.45).”
Reaction Property ΔrHº ≠ f(T) ΔrHº = f(T) Theoret. Literature
MTBE
ΔrHº -38 ± 10 -37 ± 10 -36.9 -37.7 a -39.1 ± 0.8b -38.0 ± 0.8 b -36.1 c
ΔrSº -80 ± 30 -80 ± 30 -76.9 -85.3 ± 0.5 b -81.7 ± 0.5 b -75.4 c
ΔrGº -13 ± 13 -14 ± 13 -14.0 -14.0a -13.7 ± 0.8 b -13.6 ± 0.8 b -13.7 c
ETBE
ΔrHº -40.4 ± 1.7 -38.5 ± 1.7 -34.8 -44.3 ± 2 d -41.1e -35.45 ± 1.94 f -36.3 ± 7.2g
ΔrSº -95 ± 5 -89 ± 5 -78.2 -94.9e -82.37 ± 5.99 f -81.3 ± 21.4g
ΔrGº -12 ± 2 -12 ± 2 -11.5 -12.8 e
-12.1 ± 4.5g
PTBE
ΔrHº -36 ± 4 -34 ± 3 -32.1 -26.4h
ΔrSº -79 ± 11 -71 ± 10 -75.5 -53.0h
ΔrGº -13 ± 5 -12 ± 4 -9.6
BTBE
ΔrHº -38 ± 3 -35 ± 3 -38.5 -34.8 ± 2.7i
ΔrSº -86 ± 8 -76 ± 9 -78.6 -75.8 ± 7.7i
ΔrGº -12 ± 4 -12 ± 4 -15.1
a Rehfinger and Hoffmann 25. b Izquierdo et al 26. c Wyczesany 29. d Françoisse and Thyrion 31.e Jensen and Datta 33. f Sharonov et al 34. g Soto et al 36. h Linnekoski et al 37. i Sharonov et al 42.

41
“Table 10. Readjusted thermochemical data of the ethers produced if ΔrHº = f(T) (standard state,
liquid at 1 atm and 298.15 K).”
Compound ΔfHº (difference with literature value a) [kJ (mol)-1]
Sº (difference with literature/estimated value a) [J (mol K)-1]
MTBE -313.5 (0.0%) 264.5 (-0.3%)
ETBE -353.6 (1.1%) 286.7 (-3.9%)
PTBE -373.6 (0.4%) 338.5 (1.5%)
BTBE -399.8 (-0.9%) 365.0 (0.6%)
a Relative difference of readjusted formation data compared to values in Table 3.
“Table 11. Calculated values of the liquid-phase standard molar enthalpy change of reaction,
ΔrHº, for the studied reactions, when it is considered as temperature dependent (Eq. 13).”
T [K] ΔrHº [kJ mol-1]
MTBE ETBE PTBE BTBE
323 -37.5 -39.3 -35.2 -36.9
333 -37.8 -39.7 -36.0 -37.8
343 -38.1 -40.2 -36.8 -38.7
353 -38.5 -40.7 -37.7 -39.7

42
ASSOCIATED CONTENT
Supporting Information. PTBE and BTBE mass spectra are provided in Figures S1 and S2,
respectively. Experimental conditions and results for each individual run in MTBE and ETBE
experiments are provided in Tables S1 to S3. This material is available free of charge via the
Internet at http://pubs.acs.org.
AUTHOR INFORMATION
Corresponding Author
*Email address: [email protected]
ACKNOWLEDGEMENTS
The authors thank Rohm and Haas France, Purolite and Lanxess for providing the ion
exchange resins used in this work.

43
REFERENCES
(1) Nemec, L.; Blum, V.; Rinke, P.; Scheffler, M. Thermodynamic Equilibrium Conditions of Graphene Films on SiC. Phys. Rev. Lett. 2013, 111 (6), 065502.
(2) Zhao, G.; Li, J.; Wang, X. Kinetic and Thermodynamic Study of 1-Naphthol Adsorption from Aqueous Solution to Sulfonated Graphene Nanosheets. Chem. Eng. J. 2011, 173 (1), 185–190.
(3) Martinez, M.; Ahmed, A. H.; Loh, A. P.; Oswald, R. E. Thermodynamics and Mechanism of the Interaction of Willardiine Partial Agonists with a Glutamate Receptor: Implications for Drug Development. Biochemistry 2014.
(4) Wöhri, A. B.; Hillertz, P.; Eriksson, P.-O.; Meuller, J.; Dekker, N.; Snijder, A. Thermodynamic Studies of Ligand Binding to the Human Homopentameric Glycine Receptor Using Isothermal Titration Calorimetry. Mol. Membr. Biol. 2013, 30 (2), 169–183.
(5) Sohel, M. I.; Jack, M. W. Thermodynamic Analysis of Lignocellulosic Biofuel Production via a Biochemical Process: Guiding Technology Selection and Research Focus. Bioresour. Technol. 2011, 102 (3), 2617–2622.
(6) Mortensen, P. M.; Grunwaldt, J. D.; Jensen, P. A.; Knudsen, K. G.; Jensen, A. D. A Review of Catalytic Upgrading of Bio-Oil to Engine Fuels. Appl. Catal. A Gen. 2011, 407 (1-2), 1–19.
(7) Nanda, M. R.; Yuan, Z.; Qin, W.; Ghaziaskar, H. S.; Poirier, M.-A.; Xu, C. C. Thermodynamic and Kinetic Studies of a Catalytic Process to Convert Glycerol into Solketal as an Oxygenated Fuel Additive. Fuel 2014, 117, 470–477.
(8) Snelling, J.; Barnett, M. O.; Zhao, D.; Arey, J. S. Methyl Tertiary Hexyl Ether and Methyl Tertiary Octyl Ether as Gasoline Oxygenates: Assessing Risks from Atmospheric Dispersion and Deposition. J. Air Waste Manage. Assoc. 2006, 56 (10), 1484–1492.
(9) Piel, W. J. Diversify Future Fuel Needs with Ethers. Fuel Reformul. 1994, 4 (2), 28–33.
(10) Pérez, M. A.; Bringué, R.; Iborra, M.; Tejero, J.; Cunill, F. Ion Exchange Resins as Catalysts for the Liquid-Phase Dehydration of 1-Butanol to Di-N-Butyl Ether. Appl.
44
Catal. A Gen. 2014, 482, 38–48.
(11) Gwynn, B. H.; Hirsch, J. H. Production of Alcohols by Oxo Process. US2743302 A, April 24, 1956.
(12) Gubisch, D.; Armbrust, K.; Kaizik, A.; Scholz, B.; Nehring, R. Process for the Production of Higher Oxo Alcohols. US6015928 A, 2000.
(13) Tsuchida, T.; Sakuma, S.; Takeguchi, T.; Ueda, W. Direct Synthesis of N -Butanol from Ethanol over Nonstoichiometric Hydroxyapatite. Ind. Eng. Chem. Res. 2006, 45 (25), 8634–8642.
(14) Pfromm, P. H.; Amanor-Boadu, V.; Nelson, R.; Vadlani, P.; Madl, R. Bio-Butanol vs. Bio-Ethanol: A Technical and Economic Assessment for Corn and Switchgrass Fermented by Yeast or Clostridium Acetobutylicum. Biomass and Bioenergy 2010, 34 (4), 515–524.
(15) Iborra, M.; Tejero, J.; Cunill, F.; Izquierdo, J. F.; Fité, C. Drying of Acidic Macroporous Styrene−Divinylbenzene Resins with 12−20 Cross-Linking Degree. Ind. Eng. Chem. Res. 2000, 39 (5), 1416–1422.
(16) Gmehling, J.; Li, J.; Schiller, M. A Modified UNIFAC Model. 2. Present Parameter Matrix and Results for Different Thermodynamic Properties. Ind. Eng. Chem. Res. 1993, 32 (1), 178–193.
(17) Vila, M.; Cunill, F.; Izquierdo, J.-F.; González, J.; Hernández, A. The Role of by-Products Formation in Methyltert-Butyl Ether Synthesis Catalyzed by a Macroporous Acidic Resin. Appl. Catal. A Gen. 1994, 117 (2), L99–L108.
(18) Tejero, J.; Calderón, A.; Cunill, F.; Izquierdo, J. F.; Iborra, M. The Formation of Byproducts in the Reaction of Synthesis of Isopropyl Tert-Butyl Ether from Isopropyl Alcohol and Isobutene on an Acidic Macroporous Copolymer. React. Funct. Polym. 1997, 33 (2-3), 201–209.
(19) Badia, J. H.; Fité, C.; Bringué, R.; Ramírez, E.; Cunill, F. Byproducts Formation in the Ethyl Tert-Butyl Ether (ETBE) Synthesis Reaction on Macroreticular Acid Ion-Exchange Resins. Appl. Catal. A Gen. 2013, 468, 384–394.
(20) Reid, R. C.; Prausnitz, J. M.; Poling, B. E. The Properties of Gases and Liquids, 4th ed.; McGraw-Hill: New York, 1987.
45
(21) Poling, B. E.; Prausnitz, J. M.; John Paul, O.; Reid, R. C. The Properties of Gases and Liquids, 5th ed.; McGraw-Hill: New York, 2001.
(22) Domalski, E. S.; Hearing, E. D. Estimation of the Thermodynamic Properties of Hydrocarbons at 298.15 K. J. Phys. Chem. Ref. Data 1988, 17 (4), 1637.
(23) Domalski, E. S.; Hearing, E. D. Estimation of the Thermodynamic Properties of C-H-N-O-S-Halogen Compounds at 298.15 K. J. Phys. Chem. Ref. Data 1993, 22 (4), 805–1159.
(24) Colombo, F.; Cori, L.; Dalloro, L.; Delogu, P. Equilibrium Constant for the Methyl Tert-Butyl Ether Liquid-Phase Synthesis Using UNIFAC. Ind. Eng. Chem. Fundam. 1983, 22 (2), 219–223.
(25) Rehfinger, A.; Hoffmann, U. Kinetics of Methyl Tertiary Butyl Ether Liquid Phase Synthesis Catalyzed by Ion Exchange resin—I. Intrinsic Rate Expression in Liquid Phase Activities. Chem. Eng. Sci. 1990, 45 (6), 1605–1617.
(26) Izquierdo, J. F.; Cunill, F.; Vila, M.; Tejero, J.; Iborra, M. Equilibrium Constants for Methyl Tert-Butyl Ether Liquid-Phase Synthesis. J. Chem. Eng. Data 1992, 37 (3), 339–343.
(27) Izquierdo, J. F.; Cunill, F.; Vila, M.; Iborra, M.; Tejero, J. Equilibrium Constants for Methyl Tert-Butyl Ether and Ethyl Tert-Butyl Ether Liquid-Phase Syntheses Using C4 Olefinic Cut. Ind. Eng. Chem. Res. 1994, 33 (11), 2830–2835.
(28) Zhang, T.; Datta, R. Integral Analysis of Methyl Tert-Butyl Ether Synthesis Kinetics. Ind. Eng. Chem. Res. 1995, 34 (3), 730–740.
(29) Wyczesany, A. Thermodynamics of Ether Production. In Handbook of MTBE and Other Gasoline Oxygenates; Hamid, H., Ali, M. A., Eds.; Marcel Dekker, Inc.: New York, 2004.
(30) Solà, L.; Pericàs, M. A.; Cunill, F.; Iborra, M. Reaction Calorimetry Study of the Liquid-Phase Synthesis of Tert-Butyl Methyl Ether. Ind. Eng. Chem. Res. 1994, 33 (11), 2578–2583.
(31) Françoisse, O.; Thyrion, F. C. Kinetics and Mechanism of Ethyl Tert-Butyl Ether Liquid-Phase Synthesis. Chem. Eng. Process. Process Intensif. 1991, 30 (3), 141–149.

46
(32) Vila, M.; Cunill, F.; Izquierdo, J. F.; Tejero, J.; Iborra, M. Equilibrium Constants for Ethyl Tert-Butyl Ether Liquid-Phase Synthesis. Chem. Eng. Commun. 1993, 124 (1), 223–232.
(33) Jensen, K. L.; Datta, R. Ethers from Ethanol. 1. Equilibrium Thermodynamic Analysis of the Liquid-Phase Ethyl Tert-Butyl Ether Reaction (ETBE). Ind. Eng. Chem. Res. 1995, 34 (1), 392–399.
(34) Sharonov, K. G.; Rozhnov, A. M.; Korol’kov, A. V.; Karaseva, S. Y.; Miroshnichenko, E. A.; Korchatova, L. I. Enthalpies of Formation of 2-Methyl-2-Ethoxypropane and 2-Ethyl-2-Ethoxypropane from Equilibrium Measurements. J. Chem. Thermodyn. 1995, 27 (7), 751–753.
(35) Gómez, C.; Cunill, F.; Iborra, M.; Izquierdo, F.; Tejero, J. Experimental Study of the Simultaneous Synthesis of Methyl Tert -Butyl Ether and Ethyl Tert -Butyl Ether in Liquid Phase. Ind. Eng. Chem. Res. 1997, 36 (11), 4756–4762.
(36) Soto, R.; Fité, C.; Ramírez, E.; Bringué, R.; Cunill, F. Equilibrium of the Simultaneous Etherification of Isobutene and Isoamylenes with Ethanol in Liquid-Phase. Chem. Eng. Res. Des. 2014, 92 (4), 644–656.
(37) Linnekoski, J. A.; Krause, A. O. I.; Holmen, A.; Kjetså, M.; Moljord, K. Etherification of Isobutene with 1-Propanol and 2-Propanol. Appl. Catal. A Gen. 1998, 174 (1–2), 1–11.
(38) Macho, V.; Kavala, M.; Polievka, M.; Okresa, M.; Piecka, W. Production of Alkyl Tert-Butyl Ethers. Ropa Uhlie 1982, 24, 397.
(39) Ancillotti, F.; Massi Mauri, M.; Pescarollo, E. Ion Exchange Resin Catalyzed Addition of Alcohols to Olefins. J. Catal. 1977, 46 (1), 49–57.
(40) Slomkiewicz, P. M. The Gas Phase N-Propyl-Tert-Butyl Ether Synthesis. Appl. Catal. A Gen. 2006, 313 (1), 74–85.
(41) Ogilvie, J. F. A Monte-Carlo Approach to Error Propagation. Comput. Chem. 1984, 8 (3), 205–207.
(42) Sharonov, K. G.; Mishentseva, Y. B.; Rozhnov, A. M.; Miroshnichenko, E. A.; Korchatova, L. I. Molar Enthalpies of Formation and Vaporization of T-Butoxybutanes and Thermodynamics of Their Synthesis from a Butanol and 2-Methylpropene I. Equilibria of Synthesis Reactions of T-Butoxybutanes in the Liquid Phase. J. Chem.

47
Thermodyn. 1991, 23 (2), 141–145.
(43) Sharonov, K. G.; Mishentseva, Y. B.; Rozhnov, A. M.; Miroshnichenko, E. A.; Korchatova, L. I. Molar Enthalpies of Formation and Vaporization of T-Butoxybutanes and Thermodynamics of Their Synthesis from a Butanol and 2-Methylpropene: 2. Enthalpies of Combustion and Vaporization of T-Butoxybutanes. J. Chem. Thermodyn. 1991, 23 (7), 636–642.
(44) Domalski, E. S.; Hearing, E. D. Condensed Phase Heat Capacity Data. In NIST Chemistry WebBook, NIST Standard Reference Database Number 69; Linstrom, P. J., Mallard, W. G., Eds.; National Institute of Standards and Technology: Gaithersburg MD, 20899, 20899.
(45) Fisher, S.; Kunin, R. Routine Exchange Capacity Determinations of Ion Exchange Resins. Anal. Chem. 1955, 27 (7), 1191–1194.
(46) Lide, D. R. CRC Handbook of Chemistry and Physics, 85th ed.; CRC Press: Boca Raton, FL, 2004.


![EXPERIMENTAL, QUASI-EXPERIMENTAL, AND …nur.uobasrah.edu.iq/images/pdffolder/Experimental studies 6.pdf · Experimental Design: Experiments (or randomized controlled trials [RCTs])](https://static.fdocuments.us/doc/165x107/5f4c009b337890199f4ada04/experimental-quasi-experimental-and-nur-studies-6pdf-experimental-design.jpg)