Thermodynamic analysis of a stand-alone reverse osmosis desalination system powered by pressure...
11
Thermodynamic analysis of a stand-alone reverse osmosis desalination system powered by pressure retarded osmosis Wei He a , Yang Wang a , Adel Sharif b , Mohammad Hasan Shaheed a, ⁎ a School of Engineering and Materials Science, Queen Mary, University of London, London E1 4NS, UK b Department of Chemical and Process Engineering, University of Surrey, Surrey, Guildford GU2 7XH, UK HIGHLIGHTS • Diagrammatical analysis of the feasibility of stand-alone PRO driven RO • Mathematical model with respect to FC number and ZB constraint is derived. • Feasible operations of stand-alone PRO driven RO is analysed and optimized. • Operations and performance of the PRO subsystem are analysed and optimized. abstract article info Article history: Received 14 April 2014 Received in revised form 1 August 2014 Accepted 3 August 2014 Available online 23 August 2014 Keywords: Pressure retarded osmosis Reverse osmosis Stand-alone Feasibility constant Zero brine discharge In this study, a methodology is developed to assess the feasibility of a reverse osmosis (RO) desalination system powered by a stand-alone salinity driven pressure retarded osmosis (PRO) technology. First, the proposed hybrid RO–PRO system is analysed as a thermodynamic cycle and its feasibility is mathematically interpreted using a feasible condition (FC) number, several dimensionless operational variables and a number of constraints to rep- resent the objective of zero brine discharge. Then, a study of the stand-alone feasibility of a hybrid seawater RO– PRO system is carried out. The results show that lower RO water recovery and higher dimensionless flow rate im- prove the stand-alone feasibility of the system. A subsystem, a look inside the PRO, is developed to study the ap- plied pressure and the required membrane area to achieve the operations with optimum FC numbers. It is found that the optimum applied hydraulic pressure is inversely proportional to the dimensionless flow rate in the fea- sible range of stand-alone operations and more area of membrane is required by a larger FC number. Finally, a case study of a selected operation is presented based on its energy performance, and two influencing factors, the inefficiency of the components and the salinity concentration of the feed water. Crown Copyright © 2014 Published by Elsevier B.V. All rights reserved. 1. Introduction Water is one of the most abundant resources on earth. However, most of it, about 97%, is saline water in the oceans, and the remaining 3% is freshwater. Nowadays, the freshwater provision is becoming an increasingly important issue in various areas of the world [1]. Many of these places are either located in coastal regions with access to an abundance of seawater (SW) or near a volume of brackish ground water. Desalination has been demonstrated to be a promising and vi- able source of drinking water in those areas [2]. But an important fac- tor impeding the wider use of desalination technologies to provide fresh water is the high economic cost involved, especially due to en- ergy consumption [3]. Among the widely used technologies, reverse osmosis (RO) is considered to be the most efficient system to desali- nate saline water with a substantially higher second law efficiency than other desalination processes [4]. However, the overall energy consumption is still enormous due to a huge number of RO plants in operation. According to the International Desalination Association, for 2011, reverse osmosis was used in 66% of installed desalination ca- pacity (44.5 of 67.4 Mm 3 /day), and in almost all new plants [5]. Many investigations have been carried out to reduce the energy cost of a RO process [6] including fabrication of high performance RO membrane with high water permeability and salt rejection [7], fabrication of effi- cient energy recovery devices [8], development of innovative systems [9] and integration with renewable energy sources (RESs) [10–14]. In addition, in the case of a RO system, another significant problem is the brine discharge. For inland desalination RO applications, the cost and technical feasibility of concentration disposal become the primary lim- itations [15]. The extensive development of RO desalination system in coastal areas using surface water discharge as concentrate disposal Desalination 352 (2014) 27–37 ⁎ Corresponding author. Tel.: +44 20 7882 3774. E-mail addresses: [email protected] (W. He), [email protected] (Y. Wang), [email protected] (A. Sharif), [email protected] (M.H. Shaheed). http://dx.doi.org/10.1016/j.desal.2014.08.006 0011-9164/Crown Copyright © 2014 Published by Elsevier B.V. All rights reserved. Contents lists available at ScienceDirect Desalination journal homepage: www.elsevier.com/locate/desal
-
Upload
mohammad-hasan -
Category
Documents
-
view
219 -
download
2
Transcript of Thermodynamic analysis of a stand-alone reverse osmosis desalination system powered by pressure...

Desalination 352 (2014) 27–37
Contents lists available at ScienceDirect
Desalination
j ourna l homepage: www.e lsev ie r .com/ locate /desa l
Thermodynamic analysis of a stand-alone reverse osmosis desalinationsystem powered by pressure retarded osmosis
Wei He a, Yang Wang a, Adel Sharif b, Mohammad Hasan Shaheed a,⁎a School of Engineering and Materials Science, Queen Mary, University of London, London E1 4NS, UKb Department of Chemical and Process Engineering, University of Surrey, Surrey, Guildford GU2 7XH, UK
H I G H L I G H T S
• Diagrammatical analysis of the feasibility of stand-alone PRO driven RO• Mathematical model with respect to FC number and ZB constraint is derived.• Feasible operations of stand-alone PRO driven RO is analysed and optimized.• Operations and performance of the PRO subsystem are analysed and optimized.
⁎ Corresponding author. Tel.: +44 20 7882 3774.E-mail addresses: [email protected] (W. He), yang.wan
[email protected] (A. Sharif), [email protected]
http://dx.doi.org/10.1016/j.desal.2014.08.0060011-9164/Crown Copyright © 2014 Published by Elsevie
a b s t r a c t
a r t i c l e i n f oArticle history:Received 14 April 2014Received in revised form 1 August 2014Accepted 3 August 2014Available online 23 August 2014
Keywords:Pressure retarded osmosisReverse osmosisStand-aloneFeasibility constantZero brine discharge
In this study, a methodology is developed to assess the feasibility of a reverse osmosis (RO) desalination systempowered by a stand-alone salinity driven pressure retarded osmosis (PRO) technology. First, the proposed hybridRO–PRO system is analysed as a thermodynamic cycle and its feasibility is mathematically interpreted using afeasible condition (FC) number, several dimensionless operational variables and a number of constraints to rep-resent the objective of zero brine discharge. Then, a study of the stand-alone feasibility of a hybrid seawater RO–PRO system is carried out. The results show that lower ROwater recovery and higher dimensionless flow rate im-prove the stand-alone feasibility of the system. A subsystem, a look inside the PRO, is developed to study the ap-plied pressure and the requiredmembrane area to achieve the operations with optimum FC numbers. It is foundthat the optimum applied hydraulic pressure is inversely proportional to the dimensionless flow rate in the fea-sible range of stand-alone operations and more area of membrane is required by a larger FC number. Finally, acase study of a selected operation is presented based on its energy performance, and two influencing factors,the inefficiency of the components and the salinity concentration of the feed water.
Crown Copyright © 2014 Published by Elsevier B.V. All rights reserved.
1. Introduction
Water is one of the most abundant resources on earth. However,most of it, about 97%, is saline water in the oceans, and the remaining3% is freshwater. Nowadays, the freshwater provision is becoming anincreasingly important issue in various areas of the world [1]. Manyof these places are either located in coastal regions with access toan abundance of seawater (SW) or near a volume of brackish groundwater. Desalination has been demonstrated to be a promising and vi-able source of drinkingwater in those areas [2]. But an important fac-tor impeding the wider use of desalination technologies to providefresh water is the high economic cost involved, especially due to en-ergy consumption [3]. Among the widely used technologies, reverse
[email protected] (Y. Wang),(M.H. Shaheed).
r B.V. All rights reserved.
osmosis (RO) is considered to be the most efficient system to desali-nate saline water with a substantially higher second law efficiencythan other desalination processes [4]. However, the overall energyconsumption is still enormous due to a huge number of RO plantsin operation. According to the International Desalination Association,for 2011, reverse osmosis was used in 66% of installed desalination ca-pacity (44.5 of 67.4 Mm3/day), and in almost all new plants [5]. Manyinvestigations have been carried out to reduce the energy cost of a ROprocess [6] including fabrication of high performance RO membranewith high water permeability and salt rejection [7], fabrication of effi-cient energy recovery devices [8], development of innovative systems[9] and integration with renewable energy sources (RESs) [10–14]. Inaddition, in the case of a RO system, another significant problem is thebrine discharge. For inland desalination RO applications, the cost andtechnical feasibility of concentration disposal become the primary lim-itations [15]. The extensive development of RO desalination system incoastal areas using surface water discharge as concentrate disposal

28 W. He et al. / Desalination 352 (2014) 27–37
has the potential risk such as salinity variation [16] on the local receiv-ing water and the larger surrounding sea.
Recently, salinity power harvesting frommixed streams with dif-ferent concentrations has drawn significant attention [17–20]. Infact, power from natural salinity gradients has been identified as acandidate RES since the 1950s [21]. Salinity power harvesting pos-sesses a great potential energy capacity, estimated to be 2 TW,which is about 13% of the current world energy consumption [22]. Tothis end, pressure retarded osmosis (PRO) is one of the most exploredtechnologies [23]. PRO applies a hydraulic pressure on a draw streamto extract energy from a permeate stream which becomes pressurizedas it enters the draw via a trans-membrane osmotic pressure difference,converting the chemical potential gradients into electricity by hydro-turbine [24]. After a rapid development in this field in the last decade,it has started to be utilized in reality [25]. In 2009, the world's firstPRO plant was launched in Norway with a 4 kW capacity [26].
It is noted that the PRO process has been researched not only as anindependent power plant [27,42], but also as pre- or post-treatmentprocesses in the hybrid system integratedwith ROplant for the purposeof reducing energy consumption and the discharge of high concentratedbrine [28–30]. Compared with other current energy recovery devices(ERDs) for RO desalination plants (e.g. pressure exchangers andhydro-turbines), PRO is capable to significantly increase the secondlaw efficiency of the process [31]. Feinberg et al. theoretically consid-ered a hybrid RO desalination plant with two-stage PRO osmotic ERDs[32]. Sharqawy and Banchik derived systematic effectiveness-masstransfer unit (ε-MTU) modes of the membrane mass exchangers [33,34], which effectively help in designing the RO, PRO and the hybridmembrane systems. Recently, a pilot system was designed and con-structed to evaluate the RO energy reduction that can be achieved bya PRO process [35]. According to their experimental results, power den-sities for the RO–PRO system ranged from 1.1 to 2.3 W/m2. Naturally aquestion arises. Can the energy consumption of a desalination plantbe fully covered by salinity power? If possible, what operational condi-tions does the salinity power driven desalination plant require?Unfortunately, these answers cannot be directly found in the current lit-eratures. Therefore, in this study, an investigation on the stand-alonefeasibility of the hybrid system is carried out. Furthermore, in order toreduce the concerns on brine discharge, a zero brine discharge con-straint is also considered. The targeted overcome of the hybrid systemhas zero liquid discharge, i.e. performing nearly 100% recovery on abrine stream and not requiring to dispose of any of the brine.
This research therefore aims to study the feasibility of a PRO-basedstand-alone salinity power driven RO desalination plant with zerobrine discharge. First, a hybrid system is proposed to be the basis forthis investigation. Then, the operation of the hybrid system is studiedbased on the thermodynamic analysis in which key states of the salinestreams are discussed. The stand-alone feasibility of the hybrid RO–PRO system, including the objectives of zero carbon emission andbrine discharge, is mathematically interpreted. Furthermore, the
Fig. 1. Schematic diagram of the proposed stand-alon
required operations and the required membrane area of the PROsubsystem are studied. Finally, a case study on the feasible stand-alone operation is developed and the effects from the inefficiencyof the pumps and energy recovery devices are also discussed.
2. Stand-alone salinity power driven reverse osmosis system bypressure retarded osmosis
A proposed stand-alone salinity power driven RO desalinationsystem is illustrated in Fig. 1. The hybrid system consists of twosub-systems: desalination and power generation. In the first sub-system, seawater is desalinated using RO technology. The seawateris pressurized by the high-pressure pump (HP) and the energy re-covery device (ERD) before it flows into the RO membrane modulein order to maintain the reverse water permeation from the highconcentration side to the low concentration side. Accordingly, twostreams flow from the RO module: the permeated water (PW) andthe concentrated brine water (CW). The CW is further used to pres-surize the SW in the ERD before it flows into the PRO sub-system,and the PW is the product of the hybrid system. In another sub-system, the salinity power is generated by the PRO process withthe pressurized brine water from the RO plant as the draw solution.Usually, low concentration impaired water bodies include sewageand waste water from household and industries, brackish water(BW), and other water with impurities [36]. These low concentrationstreams (secondary wastewaters and BW) or mixtures are the po-tential candidates for the feed solution for an osmotic membraneprocess [37]. The salt concentration of these water bodies, mightnot be more than that of the BW. In this study, the BW is selectedas the feed solution for an early-stage investigation. The applied hy-draulic pressure on the draw solution is controlled by adjusting thevalve resistance on the draw solution flow channel. The feed solutionflow rate is controlled by the boost pump (BP) and valves on the feedsolution flow channel. Finally, the draw solution including the per-meated water from the feed water is expanded in the hydro-turbine (HT) to generate electricity.
2.1. Thermodynamic analysis of the stand-alone hybrid RO–PRO system
Before further analysis of the hybrid system, some key states of thesaline streams are presented in the pressure–flow rate (P–Q) diagramas illustrated in Fig. 2(a). At this stage, the pressure loss in the mem-brane and flow channels can be ignored and the efficiency of thepumps is assumed to be 100%. Also, the membrane is considered to beable to reject salt at a rate of 100% with no fouling effect. And due tothe smaller amount of the energy consumed by the BP, in this study,the energy consumption is only considered as the work of the HP inthe RO sub-system.
In Fig. 2(a), the energy consumed, recovered and generated canbe represented by the area of the state diagram i.e., the energy
e salinity power driven RO desalination system.

Fig. 2. Diagrammatic analysis of the stand-alone salinity power driven RO system. In (a), key states of the saline stream are shown in P–Q diagram; and in (b), key states of the salinestreams are shown in P–π diagram.
29W. He et al. / Desalination 352 (2014) 27–37
consumed by HP in pressurizing the SW can be represented by thearea covered by O-0-1-C, the energy recovered from the brinewater in ERD can be represented by the area covered by 3-2-C-Band the energy generated by the PRO process can be representedby the areas covered by O-5-4-B. In the case concerning the energyrecovery, the overall energy surplus between the generation andconsumption of the hybrid system can be represented as the differ-ence between the area of D-1-2-3 and 0-5-4-D. If the overall energysurplus is non-negative, theoretically, the hybrid system can be op-erated as stand-alone. Otherwise, the hybrid system needs an extrapower source to cover the exceeding energy consumption. Thereforein the hybrid system, the distribution of the consumed, recoveredand generated energy is determined by the states of the streams. Ifdifferent state variables are chosen, the energy performance of thehybrid system is different. These key state variables include thestates 2, 3 and 4 in which the operation are controlled by water re-covery of the RO system, applied hydraulic pressure of draw solutionand the flow rate of feed solution of the PRO process, respectively. Inaddition, other states are determined by the local conditions or/andRO thermodynamic restrictions [38].
Additionally, the change of the osmotic pressure of the streamswithin the different states is also crucial. The variation describesthe conversion of osmotic–hydraulic pressure between differentstates, which is the essence of this hybrid system. The change ofthe osmotic pressure is shown in Fig. 2(b). When the osmotic pres-sure is increasing as shown in state transitions 1–2, hydraulic energyreleases and potential salinity energy increases. Conversely, whenosmotic pressure decreases in the state transition such as transitions3–4, the salinity power is harvested. Because the osmotic pressure ismainly dependent on the concentration of the solution, the change ofosmotic pressure is more about change of salinity concentration inthe stand-alone RO–PRO system. Compared with a classical thermo-dynamic cycle, this ‘salinity cycle’ has similar attributes because itcan generate power by the changing states of the salinity concentra-tion. Furthermore, as the hybrid system is aimed at delivering zerobrine discharge, the concentration of outlet streams of both thedraw and feed solution from the PRO process should be less thanthe concentration of SW. For example, in Fig. 2(b), the osmotic pres-sures of states 4 (diluted draw solution) and 7 (concentrated feed so-lution) should be less than the osmotic pressures of states 0 and 1,πSW, due to zero brine discharge constraint.
Therefore in this study, the stand-alone RO–PRO system can be suc-cessfully operated only if the extra energy generated by the HT is no lessthan the overall energy consumed by the RO process. This can beexpressed as
WHT≥WRO ð1Þ
where WHT represents the power generated by the HTwhich equals thearea represented by O-5-4-B and can be further written as
WHT ¼ QDΔPPRO ¼ QCW þ ΔQð ÞΔPPRO ¼ 1−Yð ÞQSW þ ΔQð ÞΔPPRO ð2Þ
in which QD is the flow rate of the draw solution in the PRO process, ΔPPRO is the hydraulic pressure applied on the draw solution, QSW is theflow rate of the seawater, QCW is the flow rate of concentrated brinewater,ΔQ is the flow rate of the permeate through the PROmembrane.Considering the hydraulic energy recovery, furthermore,WRO, the powerrequirement of the RO system represented by the area of O-0-1-2-3-Bcan be further written as
W �RO ¼ QSWΔPRO−QCW ΔPRO−ΔPPROð Þ¼ QSWΔPRO−QSW 1−Yð Þ ΔPRO−ΔPPROð Þ ð3Þ
where ΔPRO is the pressure applied on the feed water in the ROsystem.Therefore, by substituting Eqs. (2) and (3) into Eq. (1), the feasi-bility condition of the stand-alone ‘salinity cycle’ can be rewritten as
ΔW¼ ΔPPROΔQ−ΔPRO QSW−QCWð Þ ¼ QSW ΔPPROYP−ΔPROYð Þ≥0 ð4Þ
where YP is the dimensionless flow rate of the water permeation in thePRO processwith respect to the inlet seawater stream to the RO system.The feasibility condition number, FC, can be defined as
FC ¼ ΔPPROYP
ΔPROY: ð5Þ
In order to achieve the stand-alone hybrid system, certain variablesare needed to be controlled to satisfyFC≥1. Based on the RO thermody-namic restriction, ΔPRO is dependent on the RO water recovery and theseawater concentration which means it can be represented as
ΔPRO ¼ πSW
1−Yð6Þ
whereπSW is the osmotic pressure of seawater andother three variables,ΔPPRO,Y, andYP, can be controlled. This implies that, the selection of ap-propriate values for the three variables is crucial.
For a constant pressure PRO process (C-PRO), with enough mem-brane area available (allowable for full-scale PRO discharge), the ap-plied pressure on the draw solution of the PRO process determines thetermination of water permeation [42]. This means that the water per-meation terminateswhen the net driving force of thewater permeationbetween the two sides of themembrane is zero [42]. In other words, the
30 W. He et al. / Desalination 352 (2014) 27–37
termination happenswhen the osmotic pressure difference at the outletequals the applied pressure [42], which is
ΔPPRO ¼ ΔπOutlet ð7Þ
where ΔπOutlet is the osmotic pressure difference at the outlet. For aco-current PRO process, because both the draw and feed solutionflow towards the same direction, only one outlet needs to be consid-ered. In contrast, for a counter-current PRO process, with a differentapplied pressure selected, the net driving force at either of the twooutlets may satisfy the condition and terminate the water perme-ation [39–41]. Usually, the counter-current scheme performs betterthan the co-current scheme due to their high effectiveness [34]. Forsimplicity, the co-current PRO process is considered first.
In this investigation, the feed water desalinated by the RO systemis assumed as the seawater that is a hypothetical solution with 35 g/Lsalinity and its osmotic pressure can be obtained according to thevan't Hoff's law [42]. Thus, the osmotic pressure difference at theoutlet of the membrane can be expressed as [42]
ΔπOutlet ¼ νRT cOutCW−cOutBW
� �¼ νRT
cCWQCW
QCW þ ΔQ− cBWQBW
QBW−ΔQ
� �ð8Þ
where ν is the number of ions dissolved, R is the gas constant, T is thetemperature, cCW, coutCW, cBW,and coutBW are the inlet and outlet concentra-tion of the CW and BW, respectively and QBW is the inlet flow rate ofthe BW stream. The inlet flow rate of draw solution is the flow rate ofCWwater from the RO systemwith leakage assumed to be negligible.With 100% rejection RO process, the concentration of the CW is de-termined by the water recovery that is cCW ¼ cSW= 1−Yð Þ. If a dimen-sionless flow rate,ϕ, is defined as the ratio of the inlet flow rate of BWto the sum of the inlet flow rate of BW and CW, which is ϕ ¼ QBW=
QBW þ QCWð Þ, the osmotic pressure difference at the outlet of a co-current PRO process can be represented as [42]
ΔπOutlet ¼ νRT
cSW1−Y
1þ YP
1−Y
−cBW
ϕ1−ϕ
ϕ1−ϕ
− YP
1−Y
0BB@
1CCA: ð9Þ
Accordingly, the applied pressure on the draw solution of the PROprocess is determined by Y, YP and ϕ. It is noted that on the P–Q plot(Fig. 2), the possible value of applied hydraulic pressure, ΔPPRO, isfrom zero to the theoretical maximum, ΔPRO. However, in practice,
Fig. 3. Schematic illustration of the calculation of FC num
the PRO membrane cannot maintain as high hydraulic pressure asthe commercial RO membranes [43]. Recently, the highest hydraulicpressure applied on the membrane to harvest the salinity energy bythe PRO process is reported as 48 bar [44] andmany other studies re-ported at the range of 15–24 bar [45,46].
Furthermore, for the purpose of zero brine discharge, the maxi-mum concentration of discharge streams is assumed to be lessthan the seawater salinity concentration. In this case, the conditionsrestricted the final concentration of both the draw and feed solu-tions, defined as ‘zero brine discharge’ (ZB) constraint which arerepresented as
coutBW ¼ cBWQBW
QBW−ΔQ≤cSW
coutCW ¼ cCWQCW
QCW þ ΔQ≤cSW:
ð10Þ
3. Modelling of the stand-alone RO–PRO system
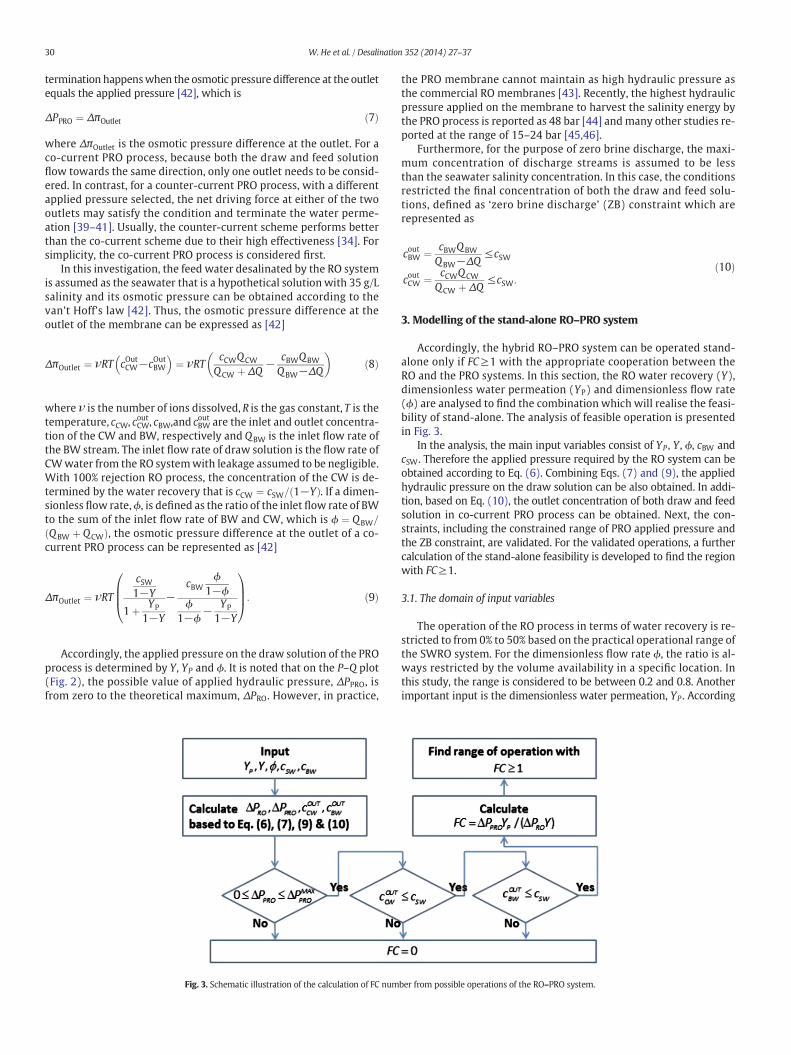
Accordingly, the hybrid RO–PRO system can be operated stand-alone only if FC≥1 with the appropriate cooperation between theRO and the PRO systems. In this section, the RO water recovery (Y),dimensionless water permeation (YP) and dimensionless flow rate(ϕ) are analysed to find the combination which will realise the feasi-bility of stand-alone. The analysis of feasible operation is presentedin Fig. 3.
In the analysis, the main input variables consist of YP , Y , ϕ, cBW andcSW. Therefore the applied pressure required by the RO system can beobtained according to Eq. (6). Combining Eqs. (7) and (9), the appliedhydraulic pressure on the draw solution can be also obtained. In addi-tion, based on Eq. (10), the outlet concentration of both draw and feedsolution in co-current PRO process can be obtained. Next, the con-straints, including the constrained range of PRO applied pressure andthe ZB constraint, are validated. For the validated operations, a furthercalculation of the stand-alone feasibility is developed to find the regionwith FC≥1.
3.1. The domain of input variables
The operation of the RO process in terms of water recovery is re-stricted to from 0% to 50% based on the practical operational range ofthe SWRO system. For the dimensionless flow rate ϕ, the ratio is al-ways restricted by the volume availability in a specific location. Inthis study, the range is considered to be between 0.2 and 0.8. Anotherimportant input is the dimensionless water permeation, YP . According
ber from possible operations of the RO–PRO system.
31W. He et al. / Desalination 352 (2014) 27–37
to the definition of YP , it can be rewritten in terms of ϕ and Y as givenbelow.
YP ¼ ΔQQSW
¼ ΔQQBW
QBW
QCW
QCW
QSW¼ ΔQ
QBW
ϕ1−ϕ
1−Yð Þ ð11Þ
Theoretically, because the water permeation from the BW streamcannot exceed the mass available of the BW, such that ΔQ≤QBW. Onlyif the process is operated reversibly, the maximum permeation wouldbe achieved. Actually, in a C-PRO plant themaximumpermeation is fur-ther less. By applying a certain hydraulic pressure on the draw solution,the maximum permeation is given by [42],
ΔQMAXC‐PRO ¼
ffiffiffiffiffiffiffifficCW
p − ffiffiffiffiffiffiffifficBW
pffiffiffiffiffiffiffifficCW
p þ ϕ1−ϕ
ffiffiffiffiffiffiffifficBW
p QBW ð12Þ
where ΔQMAXC‐PRO represents the maximum water permeation in a C-PRO
process. To this end, the range of YP is
0≤YP≤ϕ
1−ϕ1−Yð Þ Reversible PRO
0≤YP≤ΔQMAX
C‐PRO
QBW
ϕ1−ϕ
1−Yð Þ Constant‐pressure PRO:ð13Þ
Several important parameters used in this study are listed below:temperature 298 K, concentration of seawater 35 g/L, concentrationof brackish water 0.1 g/L. Both seawater and brackish water are con-sidered as the ideal mixtures of pure water and solid sodium chloridesalt [42], which are validated in approximating the osmotic pressureby the linear van't Hoff law with satisfactory tolerance in simulation.Therefore, the number of ions dissolved in the solution, ν, is 2.
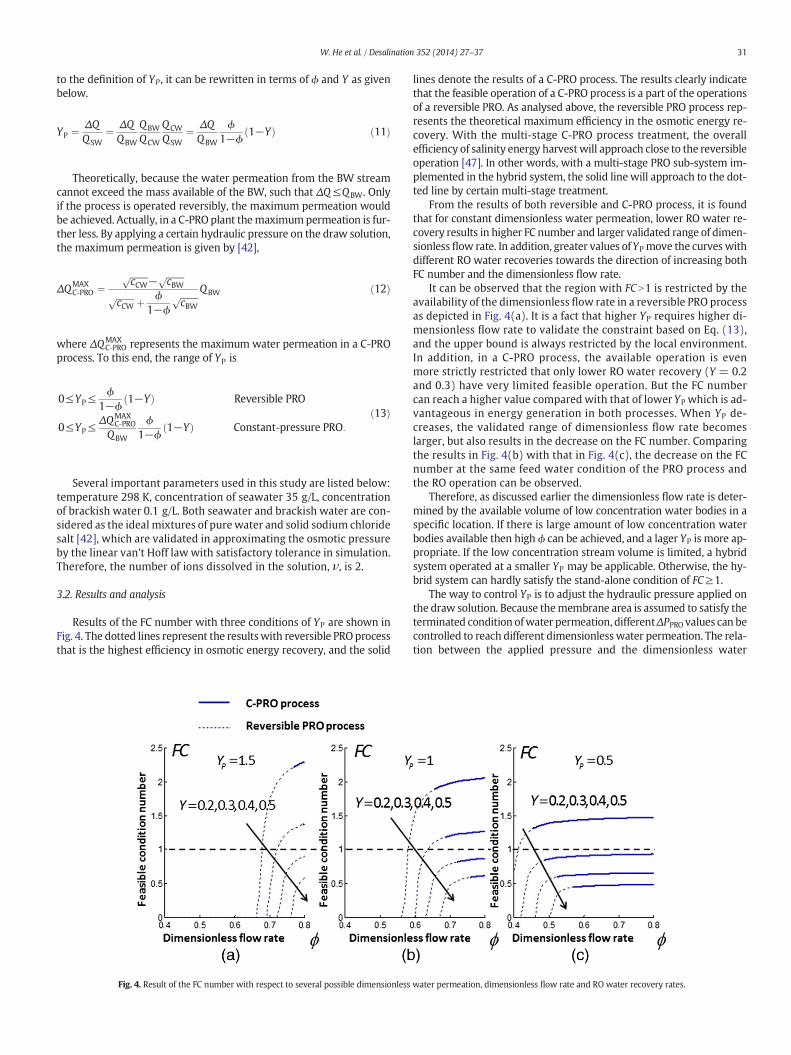
3.2. Results and analysis
Results of the FC number with three conditions of YP are shown inFig. 4. The dotted lines represent the resultswith reversible PROprocessthat is the highest efficiency in osmotic energy recovery, and the solid
Fig. 4. Result of the FC number with respect to several possible dimensionless
lines denote the results of a C-PRO process. The results clearly indicatethat the feasible operation of a C-PRO process is a part of the operationsof a reversible PRO. As analysed above, the reversible PRO process rep-resents the theoretical maximum efficiency in the osmotic energy re-covery. With the multi-stage C-PRO process treatment, the overallefficiency of salinity energy harvestwill approach close to the reversibleoperation [47]. In other words, with a multi-stage PRO sub-system im-plemented in the hybrid system, the solid line will approach to the dot-ted line by certain multi-stage treatment.
From the results of both reversible and C-PRO process, it is foundthat for constant dimensionless water permeation, lower RO water re-covery results in higher FC number and larger validated range of dimen-sionless flow rate. In addition, greater values ofYP move the curves withdifferent RO water recoveries towards the direction of increasing bothFC number and the dimensionless flow rate.
It can be observed that the region with FCN1 is restricted by theavailability of the dimensionless flow rate in a reversible PRO processas depicted in Fig. 4(a). It is a fact that higher YP requires higher di-mensionless flow rate to validate the constraint based on Eq. (13),and the upper bound is always restricted by the local environment.In addition, in a C-PRO process, the available operation is evenmore strictly restricted that only lower RO water recovery (Y = 0.2and 0.3) have very limited feasible operation. But the FC numbercan reach a higher value compared with that of lower YP which is ad-vantageous in energy generation in both processes. When YP de-creases, the validated range of dimensionless flow rate becomeslarger, but also results in the decrease on the FC number. Comparingthe results in Fig. 4(b) with that in Fig. 4(c), the decrease on the FCnumber at the same feed water condition of the PRO process andthe RO operation can be observed.
Therefore, as discussed earlier the dimensionless flow rate is deter-mined by the available volume of low concentration water bodies in aspecific location. If there is large amount of low concentration waterbodies available then high ϕ can be achieved, and a lager YP is more ap-propriate. If the low concentration stream volume is limited, a hybridsystem operated at a smaller YP may be applicable. Otherwise, the hy-brid system can hardly satisfy the stand-alone condition of FC≥1.
The way to control YP is to adjust the hydraulic pressure applied onthe draw solution. Because themembrane area is assumed to satisfy theterminated condition ofwater permeation, differentΔPPRO values can becontrolled to reach different dimensionlesswater permeation. The rela-tion between the applied pressure and the dimensionless water
water permeation, dimensionless flow rate and RO water recovery rates.
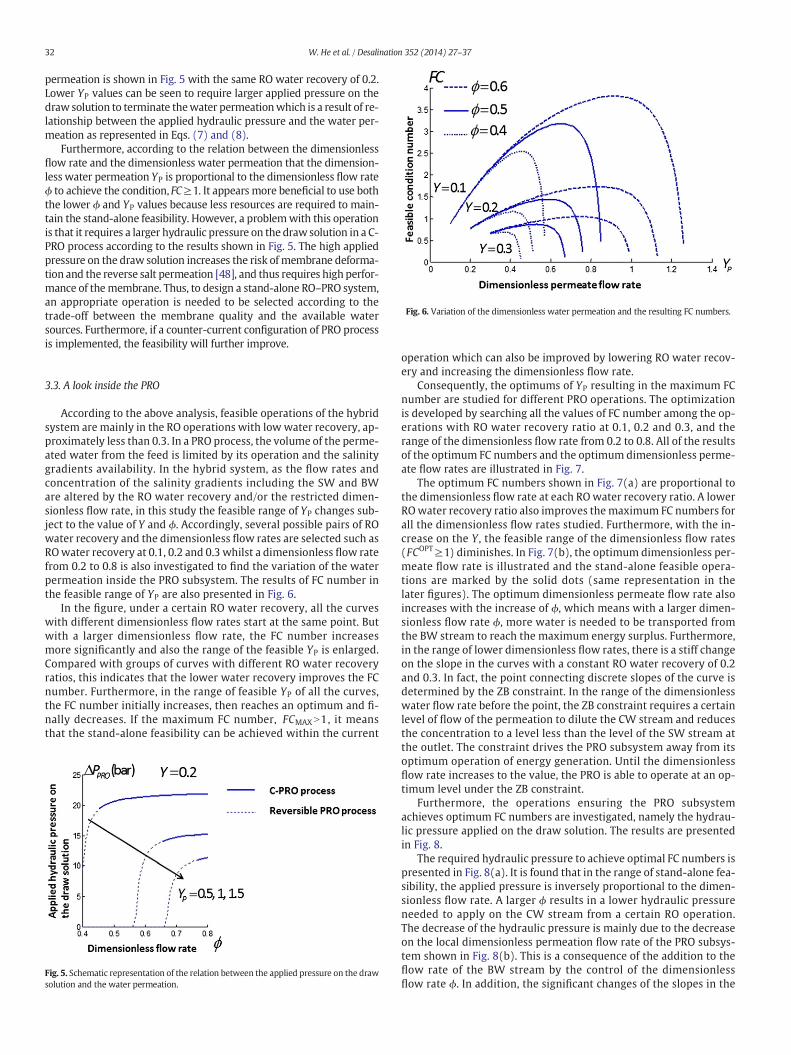
Fig. 6. Variation of the dimensionless water permeation and the resulting FC numbers.
32 W. He et al. / Desalination 352 (2014) 27–37
permeation is shown in Fig. 5 with the same RO water recovery of 0.2.Lower YP values can be seen to require larger applied pressure on thedraw solution to terminate thewater permeationwhich is a result of re-lationship between the applied hydraulic pressure and the water per-meation as represented in Eqs. (7) and (8).
Furthermore, according to the relation between the dimensionlessflow rate and the dimensionless water permeation that the dimension-less water permeation YP is proportional to the dimensionless flow rateϕ to achieve the condition, FC≥1. It appears more beneficial to use boththe lower ϕ and YP values because less resources are required to main-tain the stand-alone feasibility. However, a problemwith this operationis that it requires a larger hydraulic pressure on the draw solution in a C-PRO process according to the results shown in Fig. 5. The high appliedpressure on the draw solution increases the risk of membrane deforma-tion and the reverse salt permeation [48], and thus requires high perfor-mance of themembrane. Thus, to design a stand-alone RO–PRO system,an appropriate operation is needed to be selected according to thetrade-off between the membrane quality and the available watersources. Furthermore, if a counter-current configuration of PRO processis implemented, the feasibility will further improve.
3.3. A look inside the PRO
According to the above analysis, feasible operations of the hybridsystem are mainly in the RO operations with low water recovery, ap-proximately less than 0.3. In a PRO process, the volume of the perme-ated water from the feed is limited by its operation and the salinitygradients availability. In the hybrid system, as the flow rates andconcentration of the salinity gradients including the SW and BWare altered by the RO water recovery and/or the restricted dimen-sionless flow rate, in this study the feasible range of YP changes sub-ject to the value of Y and ϕ. Accordingly, several possible pairs of ROwater recovery and the dimensionless flow rates are selected such asROwater recovery at 0.1, 0.2 and 0.3 whilst a dimensionless flow ratefrom 0.2 to 0.8 is also investigated to find the variation of the waterpermeation inside the PRO subsystem. The results of FC number inthe feasible range of YP are also presented in Fig. 6.
In the figure, under a certain RO water recovery, all the curveswith different dimensionless flow rates start at the same point. Butwith a larger dimensionless flow rate, the FC number increasesmore significantly and also the range of the feasible YP is enlarged.Compared with groups of curves with different RO water recoveryratios, this indicates that the lower water recovery improves the FCnumber. Furthermore, in the range of feasible YP of all the curves,the FC number initially increases, then reaches an optimum and fi-nally decreases. If the maximum FC number, FCMAXN1, it meansthat the stand-alone feasibility can be achieved within the current
Fig. 5. Schematic representation of the relation between the applied pressure on the drawsolution and the water permeation.
operation which can also be improved by lowering RO water recov-ery and increasing the dimensionless flow rate.
Consequently, the optimums of YP resulting in the maximum FCnumber are studied for different PRO operations. The optimizationis developed by searching all the values of FC number among the op-erations with RO water recovery ratio at 0.1, 0.2 and 0.3, and therange of the dimensionless flow rate from 0.2 to 0.8. All of the resultsof the optimum FC numbers and the optimum dimensionless perme-ate flow rates are illustrated in Fig. 7.
The optimum FC numbers shown in Fig. 7(a) are proportional tothe dimensionless flow rate at each ROwater recovery ratio. A lowerROwater recovery ratio also improves the maximum FC numbers forall the dimensionless flow rates studied. Furthermore, with the in-crease on the Y , the feasible range of the dimensionless flow rates(FCOPT≥1) diminishes. In Fig. 7(b), the optimum dimensionless per-meate flow rate is illustrated and the stand-alone feasible opera-tions are marked by the solid dots (same representation in thelater figures). The optimum dimensionless permeate flow rate alsoincreases with the increase of ϕ, which means with a larger dimen-sionless flow rate ϕ, more water is needed to be transported fromthe BW stream to reach the maximum energy surplus. Furthermore,in the range of lower dimensionless flow rates, there is a stiff changeon the slope in the curves with a constant RO water recovery of 0.2and 0.3. In fact, the point connecting discrete slopes of the curve isdetermined by the ZB constraint. In the range of the dimensionlesswater flow rate before the point, the ZB constraint requires a certainlevel of flow of the permeation to dilute the CW stream and reducesthe concentration to a level less than the level of the SW stream atthe outlet. The constraint drives the PRO subsystem away from itsoptimum operation of energy generation. Until the dimensionlessflow rate increases to the value, the PRO is able to operate at an op-timum level under the ZB constraint.
Furthermore, the operations ensuring the PRO subsystemachieves optimum FC numbers are investigated, namely the hydrau-lic pressure applied on the draw solution. The results are presentedin Fig. 8.
The required hydraulic pressure to achieve optimal FC numbers ispresented in Fig. 8(a). It is found that in the range of stand-alone fea-sibility, the applied pressure is inversely proportional to the dimen-sionless flow rate. A larger ϕ results in a lower hydraulic pressureneeded to apply on the CW stream from a certain RO operation.The decrease of the hydraulic pressure is mainly due to the decreaseon the local dimensionless permeation flow rate of the PRO subsys-tem shown in Fig. 8(b). This is a consequence of the addition to theflow rate of the BW stream by the control of the dimensionlessflow rate ϕ. In addition, the significant changes of the slopes in the

Fig. 7. Optimization results of the FC numbers (a) and the dimensionless water permeation flow rates (b). In the figure, solid dots represent conditions which represent stand-alonesystems.
33W. He et al. / Desalination 352 (2014) 27–37
curves when RO water recovery is at 0.2 and 0.3 are also caused bythe ZB constraint.
Furthermore, the required membrane area in the PRO subsys-tem is estimated based on the membrane water permeability of1 L·bar−1·h−1·m−2. At this stage, neither concentration polarizationeffects nor reverse salt permeation is considered. Thus, the effectivemembrane requirement of full-scalewater permeation in a PROprocess
Fig. 8. Operational parameters of the PRO subsystem to achieve the optimum FC numbers. In (asionless permeation flow rates of the PRO subsystem are shown. In the figure, solid dots repre
is determined by the water flux along the membrane from the inlet tothe point that the water flux diminishes to negligibly small. Thus, theminimal required membrane area of a full-scale PRO discharge can bedetermined by the equilibrium transport equation as follows
d ΔQð Þ ¼ JWd AMð Þ ð14Þ
) the required hydraulic pressure applied on the CW is shown and in (b) the local dimen-sent conditions which represent stand-alone systems.

34 W. He et al. / Desalination 352 (2014) 27–37
where JW is the water flux and AM is the membrane area. In this study,with the CW from a RO system as the draw solution and the BW streamas the feed solution, Eq. (14) can be rewritten as
d ΔQOPT� �
¼ QSWd YOPTP
� �
¼ LP νRT
cSW1−Y
1−ϕð Þ
1−ϕ 1− ΔQQBW
� �− cBW
1− ΔQQBW
0BB@
1CCA−ΔPOPT
PRO
0BB@
1CCAd AOPT
M
� �
ð15Þ
where LP is the membrane water permeability and the superscript OPTrepresents the variable in the operations of optimum FC numbers. So,the requiredmembrane area of the optimumoperations can be obtainedbased on Eq. (15) and the results are shown in Fig. 9. Themembrane areais estimated from the inlet to the area where the water flux decreased to0.001 L·h−1·K−1. The results shown in Fig. 9 is the minimal membranearea required per 1 g/L feed stream (SW). From Fig. 9, with ϕ 0.6 and Y0.1, the required membrane area is approximately 0.5 m2·L−1·h. For in-stance, if the flow rate of the feed solution (SW) is 1 kg/s in practice,namely flow rate of BW 1.35 kg/s, about 1800 m2 membrane wouldbe required in a PRO sub-system. Combining the results in Figs. 9and 7(a), it is found that the required membrane area increaseswith increasing optimum FC. In order to reach a larger optimum FCnumber, a greater area of the membrane is required in a fixed ROwater recovery ratio.
When the effect of concentration polarization is considered, a sig-nificant reduction would be expected in the water flux [49]. To thisend, if the concentration polarization phenomena results in 50% re-duction on the averaged water flux compared with theoretical calcu-lation, the membrane area requirement would be increased toapproximately twice the values estimated in Fig. 9 at different flowrates.
3.4. Energy performance of a stand-alone RO–PRO process
For a designed hybrid RO–PRO system, when YP and ϕ are main-tained at selected values, different energy performances of the hy-brid system can be obtained by adjusting RO water recovery, Y . Acase study of YP ¼ 1 and ϕ = 0.7 is analysed and the results areshown in Fig. 10(a) in which work done by the RO system consider-ing the hydraulic energy recovery, and osmotic energy generated by
Fig. 9.The requiredmembrane area of the PRO subsystem in the operations of the optimumFCn
the HT in the PRO system are included. The overall energy surplus ofthe hybrid system, ΔEOverall, can be represented as,
ΔEOverall ¼ EPRO‐Generated−ERO‐Consumed
where EPRO‐Generated is the energy generated by the HT in PRO sub-system, and ERO‐Consumed is the total energy consumed by the ROsub-system considering the hydraulic energy recovery. The effect ofthe FC number is shown in Fig. 10(b). Accordingly, if the energy dif-ference is positive, the FC number satisfies FCN1.
Fig. 10(a) shows that both the energy consumed by RO consideringrecovered energy by ERD, and the energy generated by PRO decreaseswith the increase of RO water recovery. Furthermore, with the de-creased overall energy surplus (ΔEOverall ), the FC number decreaseswith respect to increasing RO water recovery. The limiting FC conditionis achieved at Y = 0.34. In the range of RO water recovery between 0and 0.34, the hybrid system can be operated stand-alone. For instance,with a RO water recovery value of 0.3 selected for a 10 m3/day waterproduction system, the power dynamic of the hybrid system is shownin Table 1. In the table, the overall water recovery is the ratio of theflow rate of the PW stream to the flow rate sum of the SW and theBW streams.
4. Influencing factors of efficiency of the components and salinity ofthe streams
4.1. Effects of efficiency of pumps and energy recovery devices
The efficiency of all the components has so far been assumed to be100%. In practice, however, this is not the case. In the hybrid RO–PROprocess, if the efficiency of HP,ηHP, efficiency of ERD,ηERD, and efficiencyof HT,ηHT are considered, thework doneby the RO, thepower generatedby the PRO and the FC number can be rewritten as
WRO ¼ QSWΔPRO−ηERDQCW ΔPRO−ΔPPROð ÞηHP
¼ QSWΔPRO−ηERDQSW 1−Yð Þ ΔPRO−ΔPPROð ÞηHP
ð16Þ
WHT ¼ ηHTQDΔPPRO ¼ ηHT 1−Yð ÞQSW þ ΔQð ÞΔPPRO ð17Þ
umbers. In thefigure, soliddots represent conditionswhich represent stand-alone systems.

Fig. 10. Energy performance of the stand-alone RO–PRO system with respect to different RO water recoveries.
35W. He et al. / Desalination 352 (2014) 27–37
FC ¼ΔPPRO 1−Yð Þ ηHT−
ηERDηHP
� �þ YP
� �
ΔPRO1−ηERD 1−Yð Þ
ηHP
� � : ð18Þ
The effects of the inefficiency of the pumps and ERD is considered inthe previous case study of the hybrid RO–PRO system with dimension-less water permeation of 1 and dimensionless flow rate of 0.7. Two cat-egories of efficiencies are considered and the results are presented inFig. 11. It is observed that the inefficiency reduces the extra energygained by the hybrid system and shortened the feasible region of thestand-alone condition. This means that the feasible range of RO waterrecovery is shortened significantly or becomes unavailable, and thepower surplus also decreases. In fact, the inefficiency drives the hybridsystem to more consumption of the RO subsystem and less generationfrom the PRO system. As a consequence, the decreased energetic perfor-mance requires larger water permeation and corresponding moreavailable volume of feed solution. As such in Fig. 11, the red curvewith largerYP andϕ values has a larger overall energy surplus (a greaterFC number) and a larger domain of stand-alone feasible operation. Afterall, for thepurpose of achieving stand-alone feature in consecutive oper-ations in practice, the high efficiency of the pumps and ERD is preferred.
4.2. Effects of the concentration of the saline streams
For a salinity power driven SWRO system by the PRO technology,the concentration of the feed solution affects the performance of thesalinity power generation. Previously, in this study, the feed solution
Table 1Energy performance of a case study of the stand-alone RO–PRO systemwith ROwater re-covery of 0.3, dimensionless flow rate of 0.7 and dimensionlesswater permeation of 1. Thesystem listed is under consideration of 10 m3/day capacity.
Performance Value Representation by area
Power generated by HT (kW) 1.0041 SO-5-4-BPower required by RO (kW) 0.9048 SO-0-1-2-3-BWork done by HP (kW) 1.6378 SO-0-1-CEnergy recovered by ERD (kW) 0.7330 SB-3-2-COverall energy surplus (kW) 0.0993 S0-5-4-D–SD-1-2-3Overall water recovery 0.1139FC number 1.2021
is assumed as the brackish water whose concentration is high in thepotential feed solutions. In fact, the smaller concentration of the feedsolution, the larger net driving force of the water permeationachieved, improving the salinity power generation. In fact, the pre-treated sewage and wastewater from the household and industrieshave much lower salts concentration. Therefore, two kinds of feedwater are studied and the results of the reversible PRO process areshown in Fig. 12. The two feed solutions represent the brackishwater and the freshwater or wastewater (with the same concentra-tion of freshwater) from private households and industries. The di-mensionless water permeation YP is 1. The figure shows that thefeed solution with lower concentration requires lower dimension-less flow rate and achieves larger FC number. This means that thestand-alone hybrid RO–PRO system is capable of desalinating moreseawater with less usage of the dilute stream.
5. Conclusions
In this study, a hybrid RO–PRO system is investigated to find apossible solution of the stand-alone salinity power driven desalina-tion process. First, a thermodynamic analysis of the saline streamsusing P–Q and P–π plot is presented (Fig. 2). Based on the analysis,a methodology to determine the stand-alone feasibility of the hybridsystem is developed mathematically including the feasible constantthat represents the availability of the stand-alone RO–PRO, zerobrine discharge constraint and other variables restricted in practice.Secondly, an investigation into the PRO subsystem is developed tostudy its required operations. Finally, a case study of the possible op-eration is validated and two influencing factors, the efficiency of thecomponents and the salinity of the feed water, are discussed. Basedon the results obtained, the following conclusions can be drawn: 1)The stand-alone feasibility of the hybrid RO–PRO can be determinedby checking the value of the FC number. 2) The dimensionless waterpermeation YP is proportional to the dimensionless flow rate ϕ inorder to increase the FC number at certain RO water recovery Y . 3)Lower ROwater recovery and higher ratio of the PRO feed volumetricflow rate to the combined PRO feed and draw flow rates improve thestand-alone feasibility of the hybrid system and the feasible range ofthe dimensionless water permeation. 4) For the samewater recoveryof the RO system, higher applied hydraulic pressure, but lower mem-brane area, is required to achieve the optimum FC numbers at thelower dimensionless water permeation rates. 5) With the decrease
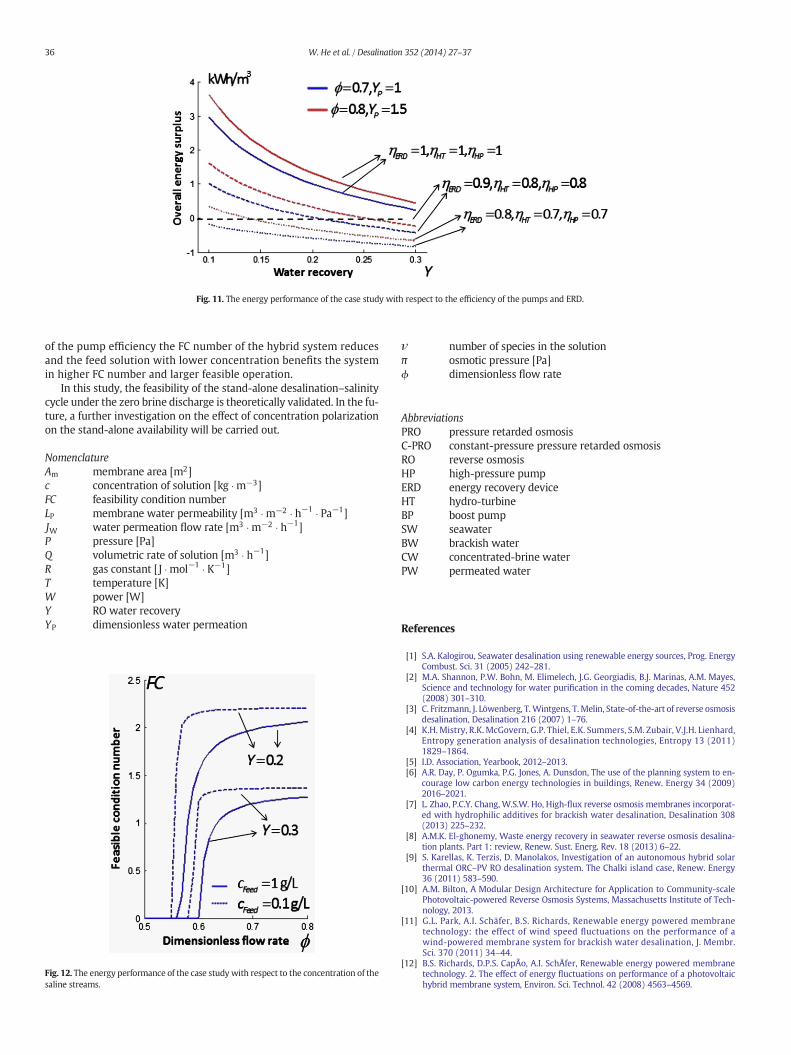
Fig. 11. The energy performance of the case study with respect to the efficiency of the pumps and ERD.
36 W. He et al. / Desalination 352 (2014) 27–37
of the pump efficiency the FC number of the hybrid system reducesand the feed solution with lower concentration benefits the systemin higher FC number and larger feasible operation.
In this study, the feasibility of the stand-alone desalination–salinitycycle under the zero brine discharge is theoretically validated. In the fu-ture, a further investigation on the effect of concentration polarizationon the stand-alone availability will be carried out.
NomenclatureAm membrane area [m2]c concentration of solution [kg �m−3]FC feasibility condition numberLP membrane water permeability [m3 �m−2 � h−1 � Pa−1]JW water permeation flow rate [m3 �m−2 � h−1]P pressure [Pa]Q volumetric rate of solution [m3 � h−1]R gas constant [J �mol−1 � K−1]T temperature [K]W power [W]Y RO water recoveryYP dimensionless water permeation
Fig. 12. The energy performance of the case study with respect to the concentration of thesaline streams.
ν number of species in the solutionπ osmotic pressure [Pa]ϕ dimensionless flow rate
AbbreviationsPRO pressure retarded osmosisC-PRO constant-pressure pressure retarded osmosisRO reverse osmosisHP high-pressure pumpERD energy recovery deviceHT hydro-turbineBP boost pumpSW seawaterBW brackish waterCW concentrated-brine waterPW permeated water
References
[1] S.A. Kalogirou, Seawater desalination using renewable energy sources, Prog. EnergyCombust. Sci. 31 (2005) 242–281.
[2] M.A. Shannon, P.W. Bohn, M. Elimelech, J.G. Georgiadis, B.J. Marinas, A.M. Mayes,Science and technology for water purification in the coming decades, Nature 452(2008) 301–310.
[3] C. Fritzmann, J. Löwenberg, T.Wintgens, T.Melin, State-of-the-art of reverse osmosisdesalination, Desalination 216 (2007) 1–76.
[4] K.H. Mistry, R.K. McGovern, G.P. Thiel, E.K. Summers, S.M. Zubair, V.J.H. Lienhard,Entropy generation analysis of desalination technologies, Entropy 13 (2011)1829–1864.
[5] I.D. Association, Yearbook, 2012–2013.[6] A.R. Day, P. Ogumka, P.G. Jones, A. Dunsdon, The use of the planning system to en-
courage low carbon energy technologies in buildings, Renew. Energy 34 (2009)2016–2021.
[7] L. Zhao, P.C.Y. Chang, W.S.W. Ho, High-flux reverse osmosis membranes incorporat-ed with hydrophilic additives for brackish water desalination, Desalination 308(2013) 225–232.
[8] A.M.K. El-ghonemy, Waste energy recovery in seawater reverse osmosis desalina-tion plants. Part 1: review, Renew. Sust. Energ. Rev. 18 (2013) 6–22.
[9] S. Karellas, K. Terzis, D. Manolakos, Investigation of an autonomous hybrid solarthermal ORC–PV RO desalination system. The Chalki island case, Renew. Energy36 (2011) 583–590.
[10] A.M. Bilton, A Modular Design Architecture for Application to Community-scalePhotovoltaic-powered Reverse Osmosis Systems, Massachusetts Institute of Tech-nology, 2013.
[11] G.L. Park, A.I. Schäfer, B.S. Richards, Renewable energy powered membranetechnology: the effect of wind speed fluctuations on the performance of awind-powered membrane system for brackish water desalination, J. Membr.Sci. 370 (2011) 34–44.
[12] B.S. Richards, D.P.S. CapÃo, A.I. SchÄfer, Renewable energy powered membranetechnology. 2. The effect of energy fluctuations on performance of a photovoltaichybrid membrane system, Environ. Sci. Technol. 42 (2008) 4563–4569.
37W. He et al. / Desalination 352 (2014) 27–37
[13] B.S. Richards, A.I. Schäfer, Chapter 12 renewable energy powered water treatmentsystems, in: C.E. Isabel, I.S. Andrea (Eds.), Sustainability Science and Engineering,Elsevier, 2010, pp. 353–373.
[14] Schäfer, A. Broeckmann, Richards, Renewable energy powered membranetechnology. 1. Development and characterization of a photovoltaic hybridmembrane system, Environ. Sci. Technol. 41 (2006) 998–1003.
[15] L.F. Greenlee, D.F. Lawler, B.D. Freeman, B. Marrot, P. Moulin, Reverse osmosis desa-lination: water sources, technology, and today's challenges, Water Res. 43 (2009)2317–2348.
[16] R. Smith, A. Purnama, H.H. Al-Barwani, Sensitivity of hypersaline Arabian Gulf toseawater desalination plants, Appl. Math. Model. 31 (2007) 2347–2354.
[17] M. Tedesco, A. Cipollina, A. Tamburini, W. van Baak, G. Micale, Modelling the reverseelectrodialysis process with seawater and concentrated brines, Desalin. Water Treat.49 (2012) 404–424.
[18] C.M. Werner, B.E. Logan, P.E. Saikaly, G.L. Amy, Wastewater treatment, energy re-covery and desalination using a forward osmosis membrane in an air-cathode mi-crobial osmotic fuel cell, J. Membr. Sci. 428 (2013) 116–122.
[19] Y.C. Kim, Y. Kim, D. Oh, K.H. Lee, Experimental investigation of a spiral-woundpressure-retarded osmosis membrane module for osmotic power generation, Envi-ron. Sci. Technol. 47 (2013) 2966–2973.
[20] R.D. Cusick, Y. Kim, B.E. Logan, Energy capture from thermolytic solutions in micro-bial reverse-electrodialysis cells, Science 335 (2012) 1474–1477.
[21] R.E. Pattle, Production of electric power bymixing fresh and salt water in the hydro-electric pile, Nature 174 (1954) 660.
[22] F. La Mantia, M. Pasta, H.D. Deshazer, B.E. Logan, Y. Cui, Batteries for efficient energyextraction from a water salinity difference, Nano Lett. 11 (2011) 1810–1813.
[23] B.E. Logan, M. Elimelech, Membrane-based processes for sustainable power genera-tion using water, Nature 488 (2012) 313–319.
[24] G. Han, S. Zhang, X. Li, T.-S. Chung, High performance thin film composite pressureretarded osmosis (PRO) membranes for renewable salinity-gradient energy genera-tion, J. Membr. Sci. 440 (2013) 108–121.
[25] S.E. Skilhagen, Osmotic power — a new, renewable energy source, Desalin. WaterTreat. 15 (2010) 271–278.
[26] A. Achilli, A.E. Childress, Pressure retarded osmosis: from the vision of Sidney Loebto the first prototype installation — review, Desalination 261 (2010) 205–211.
[27] S.E. Skilhagen, J.E. Dugstad, R.J. Aaberg, Osmotic power — power production basedon the osmotic pressure difference between waters with varying salt gradients, De-salination 220 (2008) 476–482.
[28] Y.C. Kim, M. Elimelech, Potential of osmotic power generation by pressure retardedosmosis using seawater as feed solution: analysis and experiments, J. Membr. Sci.429 (2013) 330–337.
[29] A. Altaee, Guillermo Zaragoza, Adel Sharif, Pressure retarded osmosis for powergeneration and seawater desalination: performance analysis, Desalination 344(2014).
[30] H. Wei, W. Yang, M.H. Shaheed, Modelling and simulation of osmotic energy fromsalinity gradients: a case study from River Thames, International Conference on Re-newable Energy Research and Applications (ICRERA), 2013, 2013, pp. 907–912.
[31] M.H. Sharqawy, S.M. Zubair, V.J.H. Lienhard, Second law analysis of reverse osmosisdesalination plants: an alternative design using pressure retarded osmosis, Energy36 (2011) 6617–6626.
[32] B.J. Feinberg, G.Z. Ramon, E.M.V. Hoek, Thermodynamic analysis of osmotic energyrecovery at a reverse osmosis desalination plant, Environ. Sci. Technol. 47 (2013)2982–2989.
[33] L.D. Banchik, M.H. Sharqawy, V.J.H. Lienhard, Effectiveness-mass transfer units(ε-MTU) model of a reverse osmosis membrane mass exchanger, J. Membr.Sci. 458 (2014) 189–198.
[34] M.H. Sharqawy, L.D. Banchik, V.J.H. Lienhard, Effectiveness-mass transfer units (ε-MTU) model of an ideal pressure retarded osmosis membrane mass exchanger, J.Membr. Sci. 445 (2013) 211–219.
[35] A. Achilli, J.L. Prante, N.T. Hancock, E.B. Maxwell, A. Childress, Experimental resultsfrom RO–PRO: a next generation system for low-energy desalination, Environ. Sci.Technol. 48 (2014) 6437–6443.
[36] V.G. Gude, N. Nirmalakhandan, S. Deng, Renewable and sustainable approaches fordesalination, Renew. Sust. Energ. Rev. 14 (2010) 2641–2654.
[37] Y. Zhang, L. Pinoy, B. Meesschaert, B. Van der Bruggen, A natural driven membraneprocess for brackish and wastewater treatment: photovoltaic powered ED and FOhybrid system, Environ. Sci. Technol. 47 (2013) 10548–10555.
[38] A. Zhu, P.D. Christofides, Y. Cohen, Energy consumption optimization of reverse os-mosis membrane water desalination subject to feed salinity fluctuation, Ind. Eng.Chem. Res. 48 (2009) 9581–9589.
[39] K.Y. Wang, T.-S. Chung, G. Amy, Developing thin-film-composite forward osmosismembranes on the PES/SPSf substrate through interfacial polymerization, AICHE J.58 (2012) 770–781.
[40] A. Sagiv, R. Semiat, Finite element analysis of forward osmosis process using NaClsolutions, J. Membr. Sci. 379 (2011) 86–96.
[41] D.H. Jung, J. Lee, D.Y. Kim, Y.G. Lee, M. Park, S. Lee, et al., Simulation of forward os-mosis membrane process: effect of membrane orientation and flow direction offeed and draw solutions, Desalination 277 (2011) 83–91.
[42] N.Y. Yip,M. Elimelech, Thermodynamic and energy efficiency analysis of power gen-eration from natural salinity gradients by pressure retarded osmosis, Environ. Sci.Technol. 46 (2012) 5230–5239.
[43] S. Zhang, T.-S. Chung,Minimizing the instant and accumulative effects of salt perme-ability to sustain ultrahigh osmotic power density, Environ. Sci. Technol. 47 (2013)10085–10092.
[44] A.P. Straub, N.Y. Yip, M. Elimelech, Raising the bar: increased hydraulic pressure al-lows unprecedented high power densities in pressure-retarded osmosis, Environ.Sci. Technol. Lett. 1 (2013) 55–59.
[45] Y.C. Kim, M. Elimelech, Adverse impact of feed channel spacers on the performanceof pressure retarded osmosis, Environ. Sci. Technol. 46 (2012) 4673–4681.
[46] X. Song, Z. Liu, D.D. Sun, Energy recovery from concentrated seawater brine by thin-film nanofiber composite pressure retarded osmosis membranes with high powerdensity, Energy Environ. Sci. 6 (2013) 1199–1210.
[47] W. He, Y. Wang, M.H. Shaheed, Energy and thermodynamic analysis of powergeneration using a natural salinity gradient based pressure retarded osmosis pro-cess, Desalination 350 (2014) 86–94.
[48] Q. She, D. Hou, J. Liu, K.H. Tan, C.Y. Tang, Effect of feed spacer inducedmembrane de-formation on the performance of pressure retarded osmosis (PRO): implications forPRO process operation, J. Membr. Sci. 445 (2013) 170–182.
[49] N.Y. Yip, M. Elimelech, Performance limiting effects in power generation from salinitygradients by pressure retarded osmosis, Environ. Sci. Technol. 45 (2011) 10273–10282.