Thermocatalytic CO2-Free Production of Hydrogen … CO 2-FREE PRODUCTION OF HYDROGEN FROM...
29
THERMOCATALYTIC CO 2 -FREE PRODUCTION OF HYDROGEN FROM HYDROCARBON FUELS Nazim Muradov Florida Solar Energy Center, 1679 Clearlake Road, Cocoa, FL 32922 Abstract Conventional processes of hydrogen production are among major producers of CO 2 emissions. It has been proposed recently that CO 2 produced in steam reforming (or partial oxidation) processes could be captured and sequestered under the ocean or underground. However CO 2 sequestration is an energy intensive and costly process associated with ecological uncertainties. CO 2 -free production of hydrogen via thermocatalytic decomposition of hydrocarbon fuels as a viable alternative to the conventional processes is discussed in this paper. The technical approach is based on a single-step decomposition (pyrolysis) of hydrocarbons over carbon catalysts in air/water free environment. This approach eliminates the need for water-gas shift reactor, CO 2 removal, and the catalyst regeneration, which significantly simplifies the process. Clean carbon is also produced as a valuable byproduct of the process. Over 30 different samples of carbon were screened for the catalytic activity in methane decomposition reaction and several of them were selected for the further evaluation. The factors affecting carbon catalyst activity and long term stability in hydrocarbon decomposition reactions were studied. It was found that the crystallographic structure and the surface area of carbon species mostly determine the catalytic activity of carbon catalysts. Carbon species produced in the process were characterized by XRD and SEM methods. A kinetic model of methane decomposition over carbon catalysts was developed, and major kinetic parameters of methane decomposition reaction (rate constants, activation energies, etc.) over selected catalysts were determined. Various conceptual designs for the hydrocarbon decomposition reactor, including packed bed, tubular, free volume, fluid wall and fluidized bed reactors, were evaluated. A bench-scale thermocatalytic fluidized bed reactor was designed, fabricated and tested. The reactor was tested using methane, propane, methane-
Transcript of Thermocatalytic CO2-Free Production of Hydrogen … CO 2-FREE PRODUCTION OF HYDROGEN FROM...

THERMOCATALYTIC CO2-FREE PRODUCTION OF HYDROGENFROM HYDROCARBON FUELS
Nazim MuradovFlorida Solar Energy Center,
1679 Clearlake Road, Cocoa, FL 32922
Abstract
Conventional processes of hydrogen production are among major producers of CO2 emissions. Ithas been proposed recently that CO2 produced in steam reforming (or partial oxidation) processescould be captured and sequestered under the ocean or underground. However CO2 sequestrationis an energy intensive and costly process associated with ecological uncertainties. CO2-freeproduction of hydrogen via thermocatalytic decomposition of hydrocarbon fuels as a viablealternative to the conventional processes is discussed in this paper. The technical approach isbased on a single-step decomposition (pyrolysis) of hydrocarbons over carbon catalysts in air/water free environment. This approach eliminates the need for water-gas shift reactor, CO2
removal, and the catalyst regeneration, which significantly simplifies the process. Clean carbon isalso produced as a valuable byproduct of the process. Over 30 different samples of carbon werescreened for the catalytic activity in methane decomposition reaction and several of them wereselected for the further evaluation. The factors affecting carbon catalyst activity and long termstability in hydrocarbon decomposition reactions were studied. It was found that thecrystallographic structure and the surface area of carbon species mostly determine the catalyticactivity of carbon catalysts. Carbon species produced in the process were characterized by XRDand SEM methods. A kinetic model of methane decomposition over carbon catalysts wasdeveloped, and major kinetic parameters of methane decomposition reaction (rate constants,activation energies, etc.) over selected catalysts were determined. Various conceptual designs forthe hydrocarbon decomposition reactor, including packed bed, tubular, free volume, fluid wall andfluidized bed reactors, were evaluated. A bench-scale thermocatalytic fluidized bed reactor wasdesigned, fabricated and tested. The reactor was tested using methane, propane, methane-
WebShare Station
Proceedings of the 2000 Hydrogen Program Review NREL/CP-570-28890

propane mixture, and gasoline, and CO/CO2-free production of hydrogen-rich gas and carbonwas demonstrated. Preliminary techno-economic assessment of the process indicated that thehydrogen could be produced at a cost of $5.0/MMBTU (if carbon sold at $100/t), which is lessthan that for steam reforming process coupled with CO2 sequestration. Comparative assessmentof CO2 emissions from different hydrogen production processes clearly demonstrated thesignificant ecological advantages of the thermocatalytic decomposition of natural gas.
Background
Given the advantages inherent in fossil fuels, such as their availability, cost-competitiveness,convenience of storage and transportation, they are likely to play a major role in global energysupply for the 21st century. On the other hand, fossil fuels are major source of anthropogenic CO2
emissions into the atmosphere. There are several possible ways to mitigate CO2 emissionproblem. Among them are traditional (e.g. more efficient use of fossil fuel energy resources,increase the use of non-fossil fuels, etc.) as well as novel approaches which include:
• hydrogen production by conventional processes (steam reforming, partial oxidation, etc.)coupled with CO2 sequestration
• hydrogen production via decomposition (pyrolysis) of hydrocarbons with co-production ofcarbon
Steam reforming (SR) of natural gas (NG) is the most efficient and widely used process for theproduction of hydrogen. The theoretical energy requirement per mole of hydrogen produced forthe overall process is equal to 40.75 kJ/mole H2. There is no by-product credit for the processand, in the final analysis, it does not look environmentally benign due to large CO2 emissions. Thetotal CO2 emissions (including stack gases) from SR process reach up to 0.3-0.4 m3 CO2 per eachm3 of hydrogen produced. In partial oxidation (PO) and autothermal reforming (AR) processes afuel, oxygen and steam are combined in proportions such that a fuel is converted into a mixture ofH2 and CO. PO process can be carried out catalytically or non-catalytically. The maximumtheoretical concentration of hydrogen in the effluent gas using pure oxygen is 66.7 v.%, however,the concentration drops to 40.9 v.% if air is used as an oxidizer. Amount of CO2 produced by POprocess depends on the composition of the feedstock used and could reach up to 0.5 m3 CO2 pereach m3 of hydrogen produced.
CO2 Sequestration
The perspectives of CO2 capture and sequestration is actively discussed in the literature(Nakicenovic 1993, Block et al. 1997, Audus et al. 1996). The commercially available processesfor CO2 capture include: physical and chemical absorption, physical and chemical adsorption, lowtemperature distillation and gas-separation membranes. It should be noted that the capture,transportation and sequestration of CO2 are energy intensive processes. The total electric energyconsumption to capture CO2 from both concentrated and diluted (stack) gases, pressurize,transport 100-500 km and inject it to the underground disposal site was estimated atapproximately 5000 kJ/kg CO2 (Muradov 2000). World average for CO2 emission associatedwith the electricity production is 0.153 kg of CO2 per each kWh produced (Block et al. 1997). In

consequence, the total CO2 emissions from CO2 sequestration could potentially reach 0.25 kgCO2 per kg of sequestered CO2.
There have been some estimates reported in the literature on the economics of CO2 sequestrationassociated with hydrogen production from fossil fuels. Thus, according to Audus et al. (1996),the capture and disposal of CO2 (80-85% of CO2 captured from the concentrated streams of SRprocess) add about 25-30% to the cost of hydrogen produced by the SR of NG. The capture anddisposal of CO2 from diluted stack gases is even more costly. For example, it was estimated thatthe cost of eliminating CO2 emissions from stack gases of advanced power generation plantsrange from $35 to 264 per ton of CO2 (IEA 1998). Thus, CO2 sequestration is an energyintensive and expensive process and, in the final analysis, does not completely eliminate CO2
emission. In addition to this problem, some uncertainties remain regarding the duration andextent of CO2 retention (underground or under the ocean) and its possible environmental effect.
Methane Decomposition
One alternative to the conventional hydrogen production processes is decomposition ofhydrocarbon fuels (e.g. NG) into hydrogen and carbon, e.g.
CH4 → C + 2H2 ∆Ho= 17.8 kcal/mole
Methane decomposition reaction is moderately endothermic process. The energy requirement permole of hydrogen produced (8.9 kcal/mole H2) is somewhat less than that for the SR process. Due to a relatively low endothermicity of the process, less than 10% of the heat of methanecombustion is needed to drive the process. In addition to hydrogen as a major product, theprocess produces a very important byproduct: clean carbon. Unlike SR and PO processes, NGdecomposition process does not include water-gas shift (WGS) reaction and energy intensive gasseparation stages.
There has been attempts to use catalysts in order to reduce the maximum temperature of methanethermal decomposition (Calahan 1974, Muradov 1993). It was found that the majority oftransition metals (d-metals) to some extent exhibited catalytic activity toward methanedecomposition. Some of them, for example Ni, Fe, Co and others, demonstrated a remarkableactivity in methane dissociation reaction. However, there is a catalyst deactivation problemassociated with the carbon build up on the catalyst surface. Carbon is produced as a byproduct ofthe process and over period of time it accumulates on the catalyst surface affecting its activity andin some cases causing the reactor clogging. Thus, in the vast majority of related publications andpatents (e.g. Pourier 1997) carbon produced was burned off the catalyst surface in order toremove it from the reactor and regenerate the original catalytic activity. Since all the carbonproduced from hydrocarbon is burned, the amount of CO2 produced is comparable to that of theconventional processes (SR and PO), and no byproduct carbon is produced in this process. Allthese factors impose serious limitations to overcome before the process becomes commercial.

Technical Approach
Our technical approach is based on thermocatalytic decomposition of hydrocarbons over carbon-based catalysts in air/water-free environment. The use of carbon-based catalysts offers thefollowing advantages over metal catalysts:
• no need for the separation of carbon from the catalyst• no need for the regeneration of the catalyst by burning carbon off the catalyst surface• no CO/CO2 production due to the combustion of carbon• no contamination of hydrogen with carbon oxides and, consequently, no need for the
additional gas purification (e.g. via methanation)• the process could be arranged in a continuous mode similar to the industrial processes of fluid
coking or fluid catalytic cracking.
Current Year Objectives:
• To demonstrate the technical feasibility of CO2-free production of hydrogen and carbon viacatalytic decomposition of hydrocarbons
• To determine efficient carbon catalysts and conditions for sustainable production of hydrogen-rich gases from different hydrocarbons (methane, propane, gasoline)
• To determine factors affecting catalyst activity and long-term stability• To evaluate different conceptual designs for the thermocatalytic reactor suitable for
simultaneous production of hydrogen and carbon• To preliminarily estimate economic benefits of producing hydrogen and carbon in comparison
with steam reforming coupled with CO2 sequestration
Results and Discussion
Methane Decomposition over Carbon Catalysts
We determined the catalytic activity of the variety of carbon-based materials of different structureand origin toward methane decomposition. Table 1 summarizes the experimental results ofmethane decomposition reaction in the presence of different modifications of elemental carbonincluding wide range of activated carbons (AC), carbon blacks (CB), carbon fiber, glassy carbon,and crystalline graphites, and others, at 850oC and residence time of approximately 1 s. Eachcarbon sample was characterized by two important parameters: initial activity presented as aninitial methane conversion rate, in mmole/min-g (Km
o) and sustainability displayed in the Table 1as the ratio of methane conversion rate after one hour to the initial methane conversion rate(Km
1/Kmo). The available data on the surface area (SA) of carbon samples tested are also
presented in the Table 1.
It is understood that higher are both Kmo and Km
1/Kmo parameters, better is the carbon catalyst.
The experiments indicated that, in general, activated carbons exhibited highest initial activity (perunit of catalyst weight), but relatively low sustainability (Km
1/Kmo). It is noteworthy that AC

samples of different origin and surface area displayed relatively close initial activity (Kmo) in the
range of 1.6-2.0 mmole/min-g.
Table 1. Comparative Assessment of Different Carbon Catalystsin Methane Decomposition Reaction
Carbon Catalyst SA,m2/g
Kmo,
mmole/min-g
Km1/
Kmo
Carbon Catalyst SA,m2/g
Kmo,
mmole/min-g
Km1/
Kmo
AC, Coconut KE 1150 1.76 0.05 Acetylene Black 80 0.22 0.98
AC, Coconut CL 1650 1.67 0.18 CB, Black Pearls 25 0.22 0.48
AC, Coconut GI 1300 1.90 0.07 CB, Regal 330 94 0.42 0.40
AC, Hardwood 1500 2.04 0.32 CB, Vulcan XC72 254 0.48 0.41
AC, G-60 900 1.63 0.28 CB, Black Pearls 1500 1.15 0.60
AC, Lignite 650 1.77 0.31 Glassy Carbon - 0.95 0.06
AC, Peat RO 900 1.63 0.19 Diamond Powder - 0.16 0.48
AC, petrol. coke - 1.29 0.47 Carbon FibersPAN - 0.05 0.50
Graphite, natural 4-6 0.02 2.87 Carbon Nanotubes - 0.08 0.92
Graphite, crystal. 3-10 0.10 0.63 Soot (Fullerene) - 1.90 0.63
Graphite, crystal. 10-12 0.07 0.82 Fullerenes C60/70 - 1.34 0.11
Carbon black catalysts (including acetylene black) exhibited somewhat lower initial activity thanAC, but better sustainability. Carbons with the ordered structure (graphite, diamond, carbonfiber) demonstrated the lowest initial activity toward methane decomposition reaction. FullerenesC60/70 and fullerene soot displayed relatively high initial activity, whereas, multi-walled carbonnanotubes showed very low catalytic activity in methane decomposition.
It was found that besides the nature of carbon material, its relative catalytic activity in methanedecomposition reaction was proportional to the surface area of carbon. Figure 1 depicts themethane conversion rate (in mmole/min-g) as a linear function of the surface area of carboncatalysts in semi-log coordinates. The plot includes data for all the modifications of carbontested, including AC, CB, graphites and others. It should be noted that only limited number ofcarbon catalysts could be compared based on the unit of surface area. For example, activatedcarbon (KBB) produced from hardwood (with SA=1500 m2/g) demonstrated the initial methaneconversion rate of 1.36 µmole/min-m2, comparing to 0.77 µmole/min-m2 for carbon black (BP-2000) with the same surface area.
Figure 2 (a) demonstrates the kinetic curves of methane decomposition over different types ofAC, CB and graphite at 850oC and different residence times. It can be seen that at comparable

surface area, m2/g
10 100 1000 10000
CH
4 co
nver
sion
rat
e, m
mol
e/m
in-g
0.1
1
conditions AC catalysts have higher initialactivity than CB catalysts, although, CB-catalyzed decomposition of methane is moresustainable than AC-catalyzed. At relatively highresidence times AC catalysts produced H2/CH4
mixtures with the initial hydrogen concentrationsreaching up to 90 v.% and higher, which is anindication of the high catalytic activity. This,however, was followed by the rapid drop in thecatalytic activity and the decrease in methanedecomposition rate. CB-catalyzed methanedecomposition reached quasi-steady state rateover 20-30 min and remained practically stablefor several hours, followed by the gradual decline in the reaction rate.
Figure 1 - Methane Conversion Rate as a Function of Catalyst Surface Area
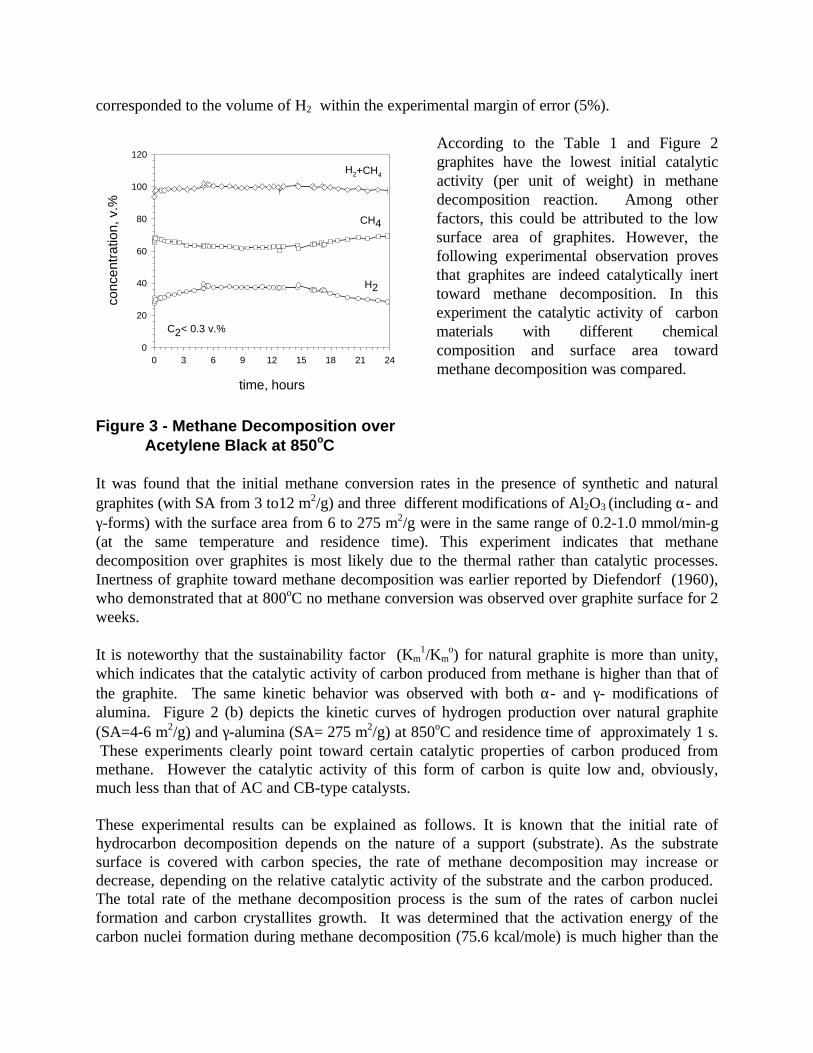
The initial rate of methane decomposition over amorphous carbons (e.g. acetylene black andothers) was relatively low, but the process demonstrated good sustainability over long period oftime. Figure 3 demonstrates the kinetic curves of methane decomposition over acetylene blackwhich was conducted at 850oC and residence time of 12 s for almost 24 hours.
time, min.
0 60 120 180 240 300 360
H2
conc
entr
atio
n, v
.%
0
1
2
3
4
5
6
7
8
natural graphite
γ- alumina
time, min.
0 20 40 60 80 100 120
H2
conc
entr
atio
n, v
.%
0
20
40
60
80
100
Surface area (m2/g), residence time (s):
AC-KE, 1150 (12)CB, X-72, 254 (10)AC, KBB, 1500 (1.0)CB, BP-2000, 1500 (0.5)graphite, 12 (1.0)
a b
Figure 2 - Methane Decomposition over Different Carbon Catalysts at 850oC
Over period of 6 hours the process reached quasi-state regime which lasted for 9 hours, afterwhich the methane decomposition rate slowly declined. No methane decomposition productsother than hydrogen and carbon and small amounts of C2 hydrocarbons (Σ(C2H4+C2H6)< 0.3 v.%)were detected in the effluent gas during the entire process. The amount of carbon produced
time, hours
0 3 6 9 12 15 18 21 24
conc
entr
atio
n, v
.%
0
20
40
60
80
100
120
H2
CH4
H2+CH4
C2< 0.3 v.%
corresponded to the volume of H2 within the experimental margin of error (5%).
According to the Table 1 and Figure 2graphites have the lowest initial catalyticactivity (per unit of weight) in methanedecomposition reaction. Among otherfactors, this could be attributed to the lowsurface area of graphites. However, thefollowing experimental observation provesthat graphites are indeed catalytically inerttoward methane decomposition. In thisexperiment the catalytic activity of carbonmaterials with different chemicalcomposition and surface area towardmethane decomposition was compared.
Figure 3 - Methane Decomposition over Acetylene Black at 850oC
It was found that the initial methane conversion rates in the presence of synthetic and naturalgraphites (with SA from 3 to12 m2/g) and three different modifications of Al2O3 (including α- andγ-forms) with the surface area from 6 to 275 m2/g were in the same range of 0.2-1.0 mmol/min-g(at the same temperature and residence time). This experiment indicates that methanedecomposition over graphites is most likely due to the thermal rather than catalytic processes.Inertness of graphite toward methane decomposition was earlier reported by Diefendorf (1960),who demonstrated that at 800oC no methane conversion was observed over graphite surface for 2weeks.
It is noteworthy that the sustainability factor (Km1/Km
o) for natural graphite is more than unity,which indicates that the catalytic activity of carbon produced from methane is higher than that ofthe graphite. The same kinetic behavior was observed with both α- and γ- modifications ofalumina. Figure 2 (b) depicts the kinetic curves of hydrogen production over natural graphite(SA=4-6 m2/g) and γ-alumina (SA= 275 m2/g) at 850oC and residence time of approximately 1 s. These experiments clearly point toward certain catalytic properties of carbon produced frommethane. However the catalytic activity of this form of carbon is quite low and, obviously,much less than that of AC and CB-type catalysts.
These experimental results can be explained as follows. It is known that the initial rate ofhydrocarbon decomposition depends on the nature of a support (substrate). As the substratesurface is covered with carbon species, the rate of methane decomposition may increase ordecrease, depending on the relative catalytic activity of the substrate and the carbon produced. The total rate of the methane decomposition process is the sum of the rates of carbon nucleiformation and carbon crystallites growth. It was determined that the activation energy of thecarbon nuclei formation during methane decomposition (75.6 kcal/mole) is much higher than the
activation energy of the carbon crystallites growth (54.2 kcal/mole) (Tesner 1987). Thus, ingeneral, the rate of carbon crystallites growth tends to be higher than the rate of carbon nucleiproduction. The carbon particles produced during methane decomposition over AC catalysts,most likely, tend to have an ordered graphite-like structure and the rate of carbon crystallitegrowth exceeds that of nuclei formation. The catalyst surface is rapidly covered with relativelylarge graphite-like crystallites, which occupy active sites and result in inhibition of the catalyticactivity toward methane decomposition. In the case of CB-type catalysts, the rates of crystallitesgrowth and nuclei formation become comparable, resulting in the quasi-steady state methanedecomposition. Low initial hydrogen production rate over alumina and natural graphite surfaceis due to high activation energy of nuclei formation over these materials. The increase inhydrogen production rate after the short induction period can be explained by the increase in theconcentration of carbon nuclei on the surface and the methane decomposition rate over relativelysmall carbon crystallites. This is followed by the growth of the existing carbon crystallites and,as a result, the reduction of the active surface area and gradual decrease in methanedecomposition rate. It case of graphite, methane decomposition rate slowly reached the steadystate conversion rate controlled by the catalytic activity of carbon produced from methane. Thenature of active sites responsible for the efficient decomposition of methane over the fresh surfaceof AC and CB catalysts is yet to be understood.
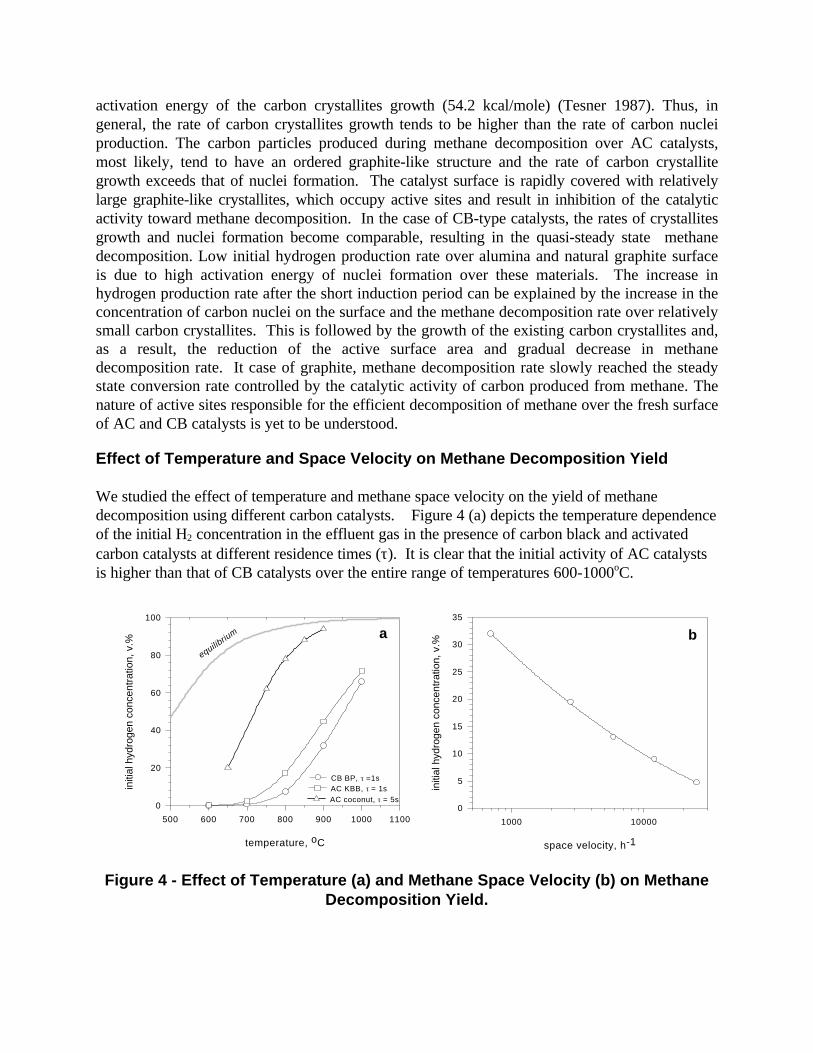
Effect of Temperature and Space Velocity on Methane Decomposition Yield
We studied the effect of temperature and methane space velocity on the yield of methanedecomposition using different carbon catalysts. Figure 4 (a) depicts the temperature dependenceof the initial H2 concentration in the effluent gas in the presence of carbon black and activatedcarbon catalysts at different residence times (τ). It is clear that the initial activity of AC catalystsis higher than that of CB catalysts over the entire range of temperatures 600-1000oC.
space velocity, h-1
1000 10000
initi
al h
ydro
gen
conc
entr
atio
n, v
.%
0
5
10
15
20
25
30
35
temperature, oC
500 600 700 800 900 1000 1100
initi
al h
ydro
gen
conc
entr
atio
n, v
.%
0
20
40
60
80
100
equilibriu
m
CB BP, τ =1sAC KBB, τ = 1sAC coconut, τ = 5s
a b
Figure 4 - Effect of Temperature (a) and Methane Space Velocity (b) on MethaneDecomposition Yield.

At sufficiently high temperatures (e.g. 900oC and higher) and residence times (e.g. 5 s and higher)the initial concentration of hydrogen in the effluent gas approaches the thermodynamicequilibrium concentration, which is an indication of high catalytic activity at these conditions. At650oC and below the methane conversion rate was negligible.
Figure 4 (b) demonstrates the effect of methane space velocity on the initial concentration ofhydrogen in the effluent gas produced by methane decomposition over carbon black (BP-2000) at850oC, presented in semi-log coordinates. Ten fold increase in space velocity of methane resultsin 3-4 fold decrease in methane decomposition yield. It should be noted that in this paper, for thesake of comparability, both the residence time and the space velocity relate to the volume of thecarbon catalyst within the reactor.
Kinetic Model and Major Kinetic Parameters of CH4 Decomposition
We developed a kinetic model of the methane decomposition reaction over carbon catalysts. Itwas assumed that CH4 decomposition over the surface of carbon catalyst is controlled by twosimultaneous processes:
1. decrease in methane decomposition rate due to the blocking of catalytic active sites by thecarbon species produced via methane decomposition:
])[1(][
4114 CHSk
dt
CHdθ−=−
where, k1- rate constant, S1- catalyst surface area, θ- the fraction of catalyst surfacecovered by carbon produced from methane; θ is a function of time
2. increase in methane decomposition rate due to the formation of catalytically active carbonspecies produced from methane
The sum of two components results in the following kinetic equation for the methane conversion:
tSkCH e )1(11
4
θχ −−= + )1(][
][22
4
4 tSk
o
e eCH
CH −−
where, χCH4 is methane conversion, [CH4]o and [CH4]e are the initial and quasi-steadystate methane concentrations in the effluent gas, respectively, S2 and k2, are catalyst surfacearea and rate constant, respectively, for methane decomposition over carbon particlesproduced from methane; S2 is a function of time
The first component of the equation describes the decrease in methane conversion by theexponential decay law, whereas, the second component represents exponential rise to maximum,i.e. to the quasi-steady state value of methane conversion.

The kinetic equation obtained satisfactorilydescribes the experimental data during theinitial stage of the methane decompositionprocess (1-1.5 hour). For example, Figure 5compares the experimental results for methanedecomposition over carbon black (BP-2000)catalyst at 850oC (circles) with the curveproduced by fitting the data to the abovekinetic model (gray line). The model canexplain the peculiarities of the kinetic curvesfor methane decomposition over different typesof carbon catalysts.
Figure 5 - Experimental Data (circles) and Curve Fit Using Kinetic Model (gray line)
The initial catalytic activity of AC is much higher than that of carbon produced from methane,therefore, the second component of the kinetic equation could be neglected, which results in atypical exponential drop shape of the kinetic curve. In contrast to AC, graphite catalysts(particularly, natural graphite) have very low initial catalytic activity toward methanedecomposition reaction, therefore the first component of the kinetic equation is negligible, and theresulting kinetic curve is either flat, or is described by the exponential rise to maximum law (seealso Figure 2, b). The same is true for the methane decomposition over alumina surface. We determined the kinetic parameters of methane decomposition reaction over different carboncatalysts. Table 2 summarizes the major kinetic parameters (apparent reaction rate constants,frequency factors and activation energies) for CB and AC catalysts at the range of temperatures700-900oC.
Table 2. Apparent Reaction Rate Constants and Activation Energiesfor CH4 Decomposition over CB and AC Catalysts
Catalyst ToC k, s-1 Ea, kCal/mol α, s-1
750 0.035850 0.480
Carbon black,BP-2000
SA= 1500 m2/g 950 2.125
56.3 4.3×10⁹
600 0.0015
700 0.026800 0.178
Activatedcarbon, KBB
SA= 1500 m2/g
900 0.602
47.9 4.9×10⁸
time, min.
0 10 20 30 40 50 60 70 80
norm
aliz
ed C
H4
conv
ersi
on
0.0
0.2
0.4
0.6
0.8
1.0
1.2

Thus, the apparent rate constants for methane decomposition in the presence of carbon black BP-2000 (kCB ) and activated carbon KBB (kAC ) catalysts could be expressed as follows:
kCB= 4.3×10⁹ exp (-56.3/RT) 750-950oC
kAC = 4.9×10⁸ exp (-47.9/RT) 600-900oC
Figure 6 depicts the Arrhenius plot formethane decomposition over AC (KBB)catalyst. The activation energies of methanedecomposition reactions over carboncatalysts are characteristic of surfacereaction rate controlled processes.
Figure 6 - Arrhenius Plot for CH4 Decomposition
Propane Pyrolysis over Carbon Catalysts
Due to a relatively weak C – H bond in propane molecule (96 kcal/mol) it is somewhat easier tosplit propane than methane molecule (methane C – H bond energy is 105 kcal/mol). 6.2 kcal isrequired to produce one mole H2 from propane, comparing that to 8.9 kcal for methane:
C3H8 → 3C + 4H2 ∆Ho= 24.8 kcal/mol
However thermal cracking of propane at high temperatures proceeds via a thermodynamicallymore favorable formation of methane and ethylene:
C3H8 → CH4 + C2H4 ∆Ho= 19.4 kcal/mol
Therefore, during pyrolysis of propane, in most cases, we observed the production of gaseousmixture containing hydrogen, methane, ethylene and small amounts of ethane and propylene. Figure 7 depicts the experimental results of propane catalytic pyrolysis over CB (a) and AC (b)type catalysts at 800oC in a packed bed reactor. Similar to methane decomposition, activatedcarbon demonstrated high initial activity followed by the rapid drop in catalytic activity. At theonset of the process hydrogen and methane were the only products of propane pyrolysis. Practically no C2
+ byproducts were found in the effluent gas during first 10 min.
1/T x 10-4
8 9 10 11 12
k, s
-1
0.001
0.01
0.1
1

time, min.
0 20 40 60 80 100 120 140
conc
entr
atio
n, v
.%
0
20
40
60
80
100
a b
time, min.
0 20 40 60 80 100 120 140 160
conc
entr
atio
n, v
.%
0
20
40
60
80
100
H2
CH4
C2H6
C2H4
H2
CH4
C2H6
C2H4
a
Figure 7 - Propane Pyrolysis over CB (XC-72) (a) and AC (KE) (b) at 800oC
Quasi-steady state pyrolysis of propane was established after 30-40 min with methane being themajor product of pyrolysis and significant concentration of ethylene in the effluent gas. Thecomposition of the effluent gas of propane pyrolysis over AC catalyst approximatelycorresponded to the following chemical equation:
C3H8 → 0.8 H2 + CH4 + 0.6C2H4 + 0.8C ∆Ho= 14.4 kcal/mol
Propane pyrolysis over carbon black was characterized by lower initial rate, but was moresustainable comparing to AC catalyst, as shown on Figure 7 (a). Quasi-steady state rate ofpropane pyrolysis was reached in approximately 5 min and the process remained stable forapproximately 2 hours. Hydrogen was a major component of the effluent gas during CB-catalyzed pyrolysis of propane.
XRD Studies of Carbon Catalysts
We conducted X-ray diffraction (XRD) studies of the original carbon catalysts and carbonsamples produced during hydrocarbon (methane or propane) decomposition. Carbon black BP-2000 with the surface area of 1500 m2/g and activated carbon Darco KBB (produced fromhardwood) with the same surface area were used in these studies. Figure 8 depicts XRD spectraof the original carbon black (BP-2000) sample (top) and the carbon produced by propanepyrolysis at 850oC (bottom). It was found that the original sample had one- or, possibly, sometwo-dimensional ordering, whereas, sample produced from propane had ordering in the“columnar” or stacking (003) direction. The following diagram illustrates this concept:
a_________b_________c_________ d d-spacinga_________ ↑ columnar direction (003)

where, a, b, and c are alternating arrangements of carbon ring plates. The d-spacing (latticespacing) or spacing between plates is practically uniform, so that the (003) columnar reflection isclearly present. Thus, carbon produced during propane pyrolysis clearly has a typical graphite a-b-c-a type stacking of the carbon ring plates.
The actual d-spacing (d =3.4948 Å) of this(003) peak is larger than that of thestandard graphite structure (d = 3.3480Å), which indicates that the plates areslightly further apart in the columnarstacking direction. This reflection isalmost absent in the original carbon blacksample which indicates that the plates arenot stacked in a columnar arrangement,but, instead, are randomly oriented withrespect to each other. The other twocrystalline diffraction peaks in carbonsample produced by propanedecomposition (43.5 and 46.2o2θ) alsoresult from the three dimensional ordering,and result from the regular arrangement ofspacings in various directions with respectto the columnar direction. The peaks 62.2and 67. 2o2θ are due to scattering ratherthan to crystalline diffraction.
Figure 8 - XRD Spectra of Carbon Samples
The peak at 62.2 is due to C – C atomic distance for atoms which are out-of-plane, and the peakat 67.2 results from the C – C atomic distance for the in-plane carbon atoms. The size of graphite crystallite produced by propane decomposition was estimated at 23 Angstrom. XRDspectrum of the sample of activated carbon (Darco KBB) also indicated the lack of clear threedimensional ordering.
Thus, XRD studies confirmed that carbon species produced by decomposition of alkanes(methane and propane) at 850oC predominantly have an ordered (graphite-like) structure. Thisfact explains the gradual drop in the activity of AC and other carbon catalysts during methane andpropane pyrolysis.
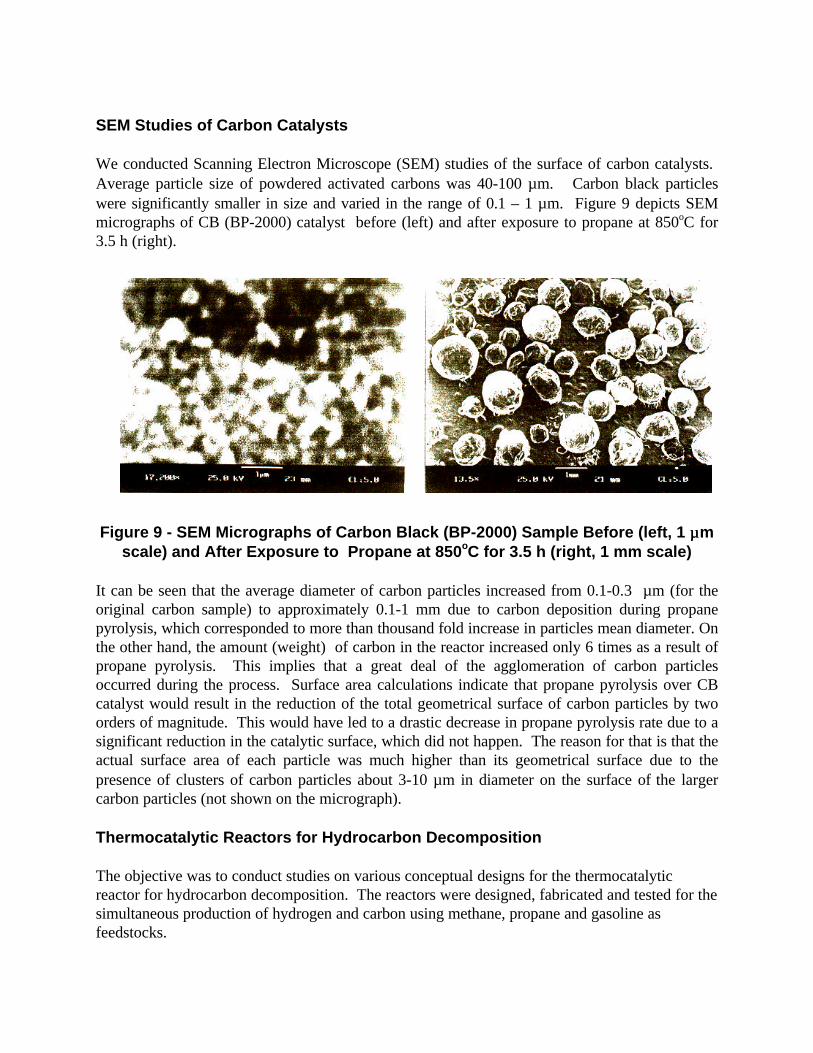
SEM Studies of Carbon Catalysts
We conducted Scanning Electron Microscope (SEM) studies of the surface of carbon catalysts. Average particle size of powdered activated carbons was 40-100 µm. Carbon black particleswere significantly smaller in size and varied in the range of 0.1 – 1 µm. Figure 9 depicts SEMmicrographs of CB (BP-2000) catalyst before (left) and after exposure to propane at 850oC for3.5 h (right).
Figure 9 - SEM Micrographs of Carbon Black (BP-2000) Sample Before (left, 1 µµm
scale) and After Exposure to Propane at 850oC for 3.5 h (right, 1 mm scale)
It can be seen that the average diameter of carbon particles increased from 0.1-0.3 µm (for theoriginal carbon sample) to approximately 0.1-1 mm due to carbon deposition during propanepyrolysis, which corresponded to more than thousand fold increase in particles mean diameter. Onthe other hand, the amount (weight) of carbon in the reactor increased only 6 times as a result ofpropane pyrolysis. This implies that a great deal of the agglomeration of carbon particlesoccurred during the process. Surface area calculations indicate that propane pyrolysis over CBcatalyst would result in the reduction of the total geometrical surface of carbon particles by twoorders of magnitude. This would have led to a drastic decrease in propane pyrolysis rate due to asignificant reduction in the catalytic surface, which did not happen. The reason for that is that theactual surface area of each particle was much higher than its geometrical surface due to thepresence of clusters of carbon particles about 3-10 µm in diameter on the surface of the largercarbon particles (not shown on the micrograph).
Thermocatalytic Reactors for Hydrocarbon Decomposition
The objective was to conduct studies on various conceptual designs for the thermocatalyticreactor for hydrocarbon decomposition. The reactors were designed, fabricated and tested for thesimultaneous production of hydrogen and carbon using methane, propane and gasoline asfeedstocks.

5 different types of reactors for hydrocarbon decomposition were considered:
• packed bed reactor (PBR)• tubular reactor (TR)• free volume reactor (FVR)• fluid wall reactor (FWR)• fluidized bed reactor (FBR)
filter PBR H2
FBR
heater evaporator
syringe pump catalyst heater Ar CH4 catalyst GC TC
collector CH4
vent
GC- gas chromatograph, TC- thermocouple
Figure 10 - Schematic Diagram of the Experimental Set-upwith PBR (left) and FBR (right) Reactors
Figure 10 demonstrates the experimental set-up with a packed bed reactor (left) used for thedecomposition of methane, propane and gasoline. It should be noted that the same experimentalset-up was also used for testing of the fluidized bed (right) and other reactors.
Packed Bed Reactor
PBR was mainly used for carbon catalysts screening, and studies on the effect of operationalparameters (temperature, space velocity) on hydrogen yield, and kinetic measurements. Severalexamples of PBR test runs are presented in the Table 3. In some cases, it was difficult to conductlong run experiments with PBR due to carbon build up within the reactor and potential reactorclogging. It is apparent that the continuous removal of carbon from PBR would be a dauntingtechnical problem, therefore, this type of the reactor is unlikely to be used in large scale hydrogenproduction units.

Tubular Reactor
We conducted a series of experiments on methane decomposition using tubular reactors. Theobjective was to thermally decompose methane into hydrogen and carbon in a continuous process. Tubular reactors with the internal diameters of 3-6 mm and a small reaction zone enabling toachieve the residence times in the range of 1-20 milliseconds, were used in these experiments. Preheated (400oC) methane stream entered the reaction zone where it was subjected todecomposition (pyrolysis) at the temperatures of 1000-1300oC. At these conditions theconversion of methane was a function of the residence time. For example, at the residence time of1.0, 2.0 and 6.2 ms, methane conversions were (mol.%): 0.1, 2.0 and 16.1, respectively. Hydrogen, carbon and unconverted methane accounted for more than 80-90 m.% of the products.Unsaturated (mostly, C2H4) and aromatic (including polynuclear) hydrocarbons were alsoproduced in significant quantities as byproducts of methane decomposition. For example, at theresidence time of 6.2 ms the yields of gaseous and liquid products were as follows (mol.%): C2H6-0.9, C2H4- 3.3, C2H2- 5.8, C3-C6- 1.5, polynuclear aromatics (mostly, naphthalene)- 2.0. Unidentified liquid products of pyrolysis accounted for approximately 5 w.% of methane pyrolysisproducts. Carbon (coke) was mostly deposited on the reactor wall down-stream of the reactionzone, which indicated that methane decomposition reaction occurred predominantlyhomogeneously in gas phase. At higher residence times (tens of seconds), the yields of C2
+ andpolyaromatic hydrocarbons dramatically dropped. These experiments demonstrated that TRcould potentially be scaled up for the use in full scale methane decomposition process, although, itwould require the elevated temperatures (above 1000oC) and special surface-treated tubes toprevent carbon deposition in the reaction zone.
Free Volume Reactor
Free volume reactor is designed to carry out high temperature reactions by contacting a reagentgas with a stream of preheated carrier gas. FVR could be advantageous for the conducting ofdifferent dissociation reactions with formation of solid phase products, including methane decomposition reaction. For example, Shpilrain et al. (1999) reported on testing of a regenerativetype FVR in a cyclic methane decomposition process. In our work we designed and tested FVRfor a continuous production of hydrogen and carbon via methane decomposition. Methanedecomposition occurred homogeneously by contacting a hot carrier gas such that carbon wasproduced in a free volume of the reactor and carried away by the gaseous stream, thus preventingcarbon from deposition on the reactor wall. Two options for introducing thermal energy into thereaction zone were considered: by the stream of inert gas (Ar) or hydrogen. Figure 11 showsthe schematic diagram of FVR used for decomposition of methane and propane.
Methane was introduced into the reactor through the inner ceramic tube, and the heat carrier gasentered the space between the inner and outer (quartz) tubes of FVR. We used Ar or hydrogenas heat carrier gases in a ratio 4:1 (by volume) to methane. The heat carrier gas was heated bythe electric heater to 1200-1300oC and entered the reaction zone where it contacted the preheated
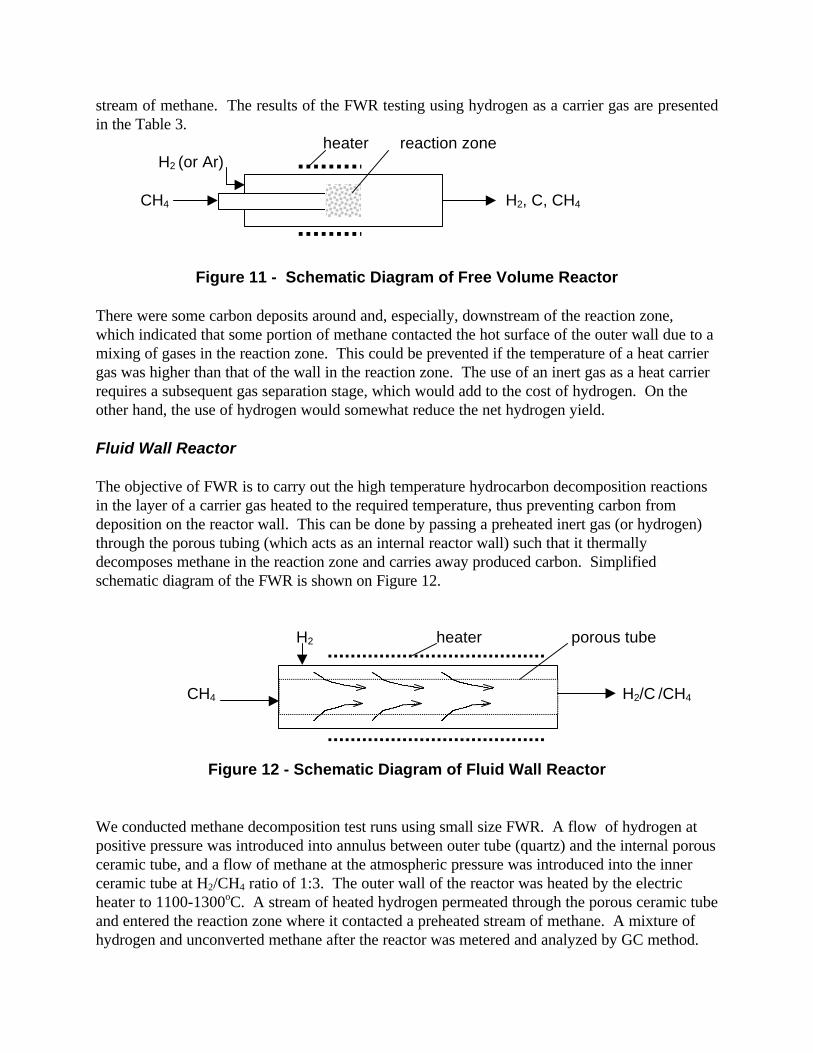
stream of methane. The results of the FWR testing using hydrogen as a carrier gas are presentedin the Table 3. heater reaction zone H2 (or Ar)
CH4 H2, C, CH4
Figure 11 - Schematic Diagram of Free Volume Reactor
There were some carbon deposits around and, especially, downstream of the reaction zone, which indicated that some portion of methane contacted the hot surface of the outer wall due to amixing of gases in the reaction zone. This could be prevented if the temperature of a heat carriergas was higher than that of the wall in the reaction zone. The use of an inert gas as a heat carrierrequires a subsequent gas separation stage, which would add to the cost of hydrogen. On theother hand, the use of hydrogen would somewhat reduce the net hydrogen yield.
Fluid Wall Reactor
The objective of FWR is to carry out the high temperature hydrocarbon decomposition reactionsin the layer of a carrier gas heated to the required temperature, thus preventing carbon fromdeposition on the reactor wall. This can be done by passing a preheated inert gas (or hydrogen)through the porous tubing (which acts as an internal reactor wall) such that it thermallydecomposes methane in the reaction zone and carries away produced carbon. Simplifiedschematic diagram of the FWR is shown on Figure 12.
H2 heater porous tube
CH4 H2/C /CH4
Figure 12 - Schematic Diagram of Fluid Wall Reactor
We conducted methane decomposition test runs using small size FWR. A flow of hydrogen atpositive pressure was introduced into annulus between outer tube (quartz) and the internal porousceramic tube, and a flow of methane at the atmospheric pressure was introduced into the innerceramic tube at H2/CH4 ratio of 1:3. The outer wall of the reactor was heated by the electricheater to 1100-1300oC. A stream of heated hydrogen permeated through the porous ceramic tubeand entered the reaction zone where it contacted a preheated stream of methane. A mixture ofhydrogen and unconverted methane after the reactor was metered and analyzed by GC method.

Methane conversion was about 10-15%. Carbon was collected in the down stream trap. Moreexperiments will be conducted to optimize the yield of products. These proof-of-conceptexperiments demonstrated that FWR could potentially be suitable for medium and large scaleunits for the simultaneous production of hydrogen and carbon from NG and other hydrocarbons. Fluidized Bed Reactor
Fluidized bed reactors are widely used in chemical, metallurgical and petroleum industries. FBRcould be particularly suitable for hydrocarbon decomposition process since it allows tocontinuously remove carbon from the reactor, similar to fluid catalytic cracking processes. Aschematic diagram of FBR used in our experiments is shown on Figure 3 (right). It was foundthat an adequate fluidization of carbon (particularly, CB) particles could be achieved at spacevelocities of 300-600 h-1. Preheated to 400-500oC a hydrocarbon stream entered the FBR fromthe bottom, and contacted with the fluidized bed of carbon particles heated to 850-950oC in thereaction zone, where decomposition (pyrolysis) of hydrocarbons occurred. A hydrogen-rich gasexited from the top of the reactor through a ceramic wool filter. FBR reactor was tested usingmethane, propane, methane-propane mixtures, gasoline vapor and gasoline-methane mixture asfeedstocks. Because of relatively short residence times (1-3 s) in the reaction zone methanedecomposition yields were relatively low, whereas, propane and gasoline were almostquantitatively converted into hydrogen-rich gas using FBR. Figure 13 depicts the experimentalresults of propane and gasoline vapor pyrolysis over CB (BP-2000) catalyst at 850oC using FBR.
time, min.
0 30 60 90 120 150 180 210 240
conc
entr
atio
n, v
.%
0
10
20
30
40
50
60
70
80H
2CH
4C
2H6
C2H4
C3H8
C3H6
time, min.
0 30 60 90 120 150 180 210 240 270
conc
entr
atio
n, v
.%
0
10
20
30
40
50
60H
2CH4C2H6
C2H4
C3H8C3H6
a b
Figure 13 - Thermocatalytic Pyrolysis of Propane (a) and Gasoline (b)over CB (BP-2000) at 850oC Using FBR
It is noteworthy that pyrolysis of propane and gasoline in FBR produce more C2+ byproducts
comparing to PBR. Thermocatalytic pyrolysis of gasoline over CB catalyst lasted more than 3.5

hours during which the gaseous mixture with the average hydrogen concentration of 50 v.% wasproduced.
Comparative Assessment of Different Reactors for Hydrocarbon Decomposition
The results of testing of different thermocatalytic reactors for decomposition/pyrolysis ofmethane, propane and gasoline using carbon catalysts are presented in Table 3. Note that the dataon the hydrocarbon conversion and the effluent gas composition relate to the average quasi-steadystate values.
Table 3. Thermocatalytic Reactor Test Results
Gaseous Products, v.%Hydrocarbon Catalyst
Reac-tor ToC
Conver-sion, % H2 CH4 C2H6 C2H4
(C2H2)ΣC3 C4
+
Methane CB, BP-2000
PBR 950 30.9 47.2 52.7 0 0.1 0 0
Methane AcetyleneBlack
PBR 850 23.3 37.8 61.9 0.1 0.2 0 0
Methane CB, XC-72 PBR 850 28.0 43.7 56.2 0 0.1 0 0Methane CB, BP-
2000FBR 850 9.1 16.7 83.1 0 0.2 0 0
Methane - TR 1200 53.8 63.8 27.4 0.1 1.2(7.5)
0 0
CH4/H2
(4:1)- FVR 1200 89.3 10.7 0 0 0 0
CH4/C3H8
(3:1)CB, BP-
2000FBR 850 38.2 50.1 2.1 9.0 0.6 0
CH4/C2H4
(3:1)CB, BP-
2000FBR 850 36.2 53.9 2.0 7.9 0 0
Propane AC, KE PBR 800 100.0 88.3 11.7 0 0 0 0Propane Acetylene
BlackPBR 850 100.0 62.1 37.9 0 0 0 0
Propane CB, BP-2000
FBR 850 98.0 27.0 39.5 1.5 29.4 2.6 0
Gasoline AC, KE PBR 800 100.0 49.4 37.6 2.1 9.8 0.6 0.5Gasoline CB, BP-
2000FBR 850 100.0 52.0 33.2 2.1 11.1 0.7 0.9
CH4 /gasoline CB, BP-2000
FBR 850 40.0 55.5 0.3 3.0 0.5 0.7

Economic Analysis
We conducted a preliminary economic analysis of the thermocatalytic decomposition (TCD)process for production of hydrogen and carbon from natural gas. Figure 14 depicts the simplifiedflow diagram of the thermocatalytic process employing a fluidized bed reactor (FBR).
H2/CH4 fresh catalyst H2=50 v.%
2
H2 1 99 v.% 3
Nat. gas 4
product carbon
Figure 14 - Simplified Flow Diagramof TCD Process for Production of Hydrogen and Carbon. 1- FBR,2- heater, 3- membrane, 4- grinder
Therefore, for the preliminary estimate, the capital cost of the FC plant (including grinder) and itsannual operational costs were taken as a basis for the hydrogen cost estimate for TCD process (itwas assumed that FC and TCD have the same capacity on a feedstock BTU basis) (Garrett 1989).
It was estimated that the usage of 17% of the non-permeate gas as a process fuel would coverthermal requirements of the TCD process. Carbon is a valuable byproduct of the process, withprices from several hundreds to several thousands of dollars per ton depending on its quality. Thus, the credit for byproduct carbon could significantly reduce the cost of hydrogen. For thepurpose of our estimate we used a conservative sale price of carbon at $100/ton, which is theaverage cost of carbon (in the form of petroleum coke) used in metallurgical industry (Kirk-Othmer 1978). The following Table demonstrates the results of the economic evaluation of TCD plant with the capacity of 106 m3/day (which is close to that of a typical steam reformingplant).
According to this flow diagram hydrogenconcentration in the reactor effluent gas is 50v.%, with balance being methane and smallamounts of C2
+ hydrocarbons. Thus, theemployment of the membrane gas separationunit is required to produce 99 v.% hydrogen. Non-permeate is recycled back to thereactor. Product carbon is removed fromFBR and some portion of it is ground andrecycled to maintain the average particle sizein the range suitable for fluidization (100 –500 µm). The catalyst is heated in the heaterto the required temperature 800-900oC. Thus, the technological scheme of theprocess is very close to that of fluid coking(FC) process, except, in case of FC processthe temperature is lower (510-550oC), andthe hydrocarbon feedstock is heavier.

Cost of hydrogen production from natural gas by thermocatalytic decomposition process wascompared to that of steam reforming process. Figure 15 depicts the comparative assessment ofTCD of NG (with and without carbon credit) and SR of NG (with and without CO2 sequestration)processes.
Table 4. Cost of Hydrogen Production by TCD Process
Capacity: 106 m3 H2/dayH2 purity: 99.0 v.%Natural gas: $2.5/MMBTU
$106 $106/Year $/MMBTU
Capital Cost: Reactor/ Heater/ Grinder (from FCplant) Membrane Hydrogen Separator Total Capital Cost
Annual Operating Cost: Feedstock (Natural Gas) Catalyst/reagents/desulfurization Power Labor Depreciation (10%)
Total Hydrogen Production CostCarbon Credit ($100/t)Net Hydrogen Production Cost
18.02.0
20.0
33.91.00.30.12.0
10.77.1
5.0

SR w/out CO2 sequestration
SR with CO2 sequestration
TCD without carbon credit
TCD with carbon credit
cost
of h
ydro
gen,
$/M
MB
TU
0
2
4
6
8
10
Steam
ReformingTCD
Figure 15 - Comparative Assessment of Hydrogen ProductionCost by SR and TCD Processes
For the purpose of the comparative economic evaluation we used the cost of hydrogen producedby modern methane steam reforming plant (Ogden 1997). As mentioned in the Backgroundsection, capture of CO2 from concentrated streams of SR plant and its disposal adds 25-30% tothe cost of hydrogen production by SR process. One should also add to it the cost of eliminatingCO2 emissions from the diluted (stack) gases of SR process.
The results of the comparative economic assessment of different options for hydrogen productionfrom NG are as follows. TCD with carbon credit is the most cost effective process followed bySR without CO2 sequestration. Note that the cost of hydrogen produced by the TCD withoutcarbon credit (that is, carbon is not sold, but stored for the future use) is still lower than that ofSR coupled with CO2 sequestration (assuming that the cost of carbon storage is negligiblecompared to that of CO2 sequestration). This is a preliminary economic assessment of TCDprocess, and more detailed cost analysis will be conducted upon testing pilot scale unit.
Current and Future Markets for Carbon
Currently, the total world production of carbon black is close to 6 mln tons per year, with pricesvarying in the range of hundreds to thousands dollars per ton, depending on the carbon quality(Fulcheri 1995). For example, prices for the good quality carbon black could reach $1000-4000per ton. The carbon black has a great market potential both in traditional (rubber industry,plastics, inks, etc.) and new areas. For example, Gaudernack et al. (1996) identified themetallurgical industry as a very promising market for carbon black. Carbon black is particularlyvaluable as a reducing reagent for the production of SiC and other carbides, and as a carbonadditive (carburizer) in steel industry. The carbon black market for these applications in Europecurrently approaches 0.5 mln ton/year with the prices for the high quality materials reaching $615per ton. Carbon-based composite and construction materials potentially can absorb a tremendousamount of produced carbon. Besides the traditional markets for carbon, some novel applicationsfor the carbon produced via methane decomposition are discussed in the literature. For example,

Kvaerner has initiated R&D program to investigate the potential of novel grades of carbon blackas a storage medium for hydrogen, and as a feedstock for the production of solar grade silicone(Linum 1998).
A market for carbon-based materials is continuously growing, however, it is unlikely that all thecarbon produced via NG decomposition for mitigating the global warming will be absorbed by thetraditional and perspective application areas. In this case, carbon can be stored for the future use,as discussed by Muradov 1993, and Steinberg 1999). No significant energy consumption wouldbe expected with regard to the storage of solid carbon (comparing to CO2 sequestration).
Comparison of CO2 Emissions from Different Hydrogen Production Processes
A comparative assessment of CO2 emissions produced by different hydrogen productionprocesses is shown on Figure 16. The following NG-based processes were compared:
- SR (without and with CO2 sequestration),- partial oxidation (without and with CO2 sequestration),- plasma-assisted decomposition (PAD), and- TCD (with CH4 and H2 as a process fuel options).
PAD of methane is a well developed technology for the production of hydrogen and carbon blackvia high temperature decomposition of natural gas (Linum 1998). However, it consumes up to1.9 kWh of electric energy to produce one normal cubic meter of hydrogen. Due to relativelylow endothermicity of the methane decomposition process, the thermal energy requirements of theTCD process could be covered either by 10% of methane feedstock, or 14% of hydrogenproduced in the process.
processes
1 2 3 4 5 6 7
H2/
CH
4 an
d C
O2/
CH
4, m
3 /m
3
0.0
0.5
1.0
1.5
2.0
2.5
3.0
CO2 / CH4H2 / CH4
Hydrogen Production Processes:
1- Steam Reforming2- Steam Reforming with CO2 Sequestration3- Partial Oxidation4- Partial Oxidation with CO2 Sequestration5- Plasma Decomposition6- TCD with CH4 as a Fuel7- TCD with H2 as a Fuel
Figure 16 – Comparison of CO2 Emissions from Different Hydrogen Production Processes
The comparison is based on two parameters, which reflect the energetic and ecological features of

the processes. The E1-parameter is equal to the volume of H2 produced from the unit volume ofNG consumed as a feedstock and a process fuel (E1 =H2/NG, m3/m3). The E2-parameter is equalto the total volume of CO2 (from the process and stack gases) produced from a unit volume ofNG (E2= CO2/H2, m
3/m3). Evidently, the higher is E1 and lower is E2 parameter, the better is thehydrogen production process.
For the sake of simplicity and comparability, it was assumed that NG was the primary fuel for thesupply of both thermal and electric energy for all the processes, including PAD of NG, and forCO2 sequestration. Almost 80% of the total world energy supply is based on fossil fuels, and NGaverage share is 19% (Nakicenovic 1993). Since NG produces 1.9 and 1.7 times less CO2 (perkWh produced) than oil and coal, respectively, this assumption would result in somewhat moreconservative values for CO2 emissions.
The following conclusions can be extracted from Figure 16.
• Plasma decomposition of NG has lowest hydrogen yield and highest CO2 emissionsbecause of large consumption of electric energy (note that this estimate is based on theworld average energy production scenario, therefore, in countries with a large non-fossilfuel energy sector, e.g. hydroelectric, nuclear energy, both E1 and E2 parameters could behigher and lower, respectively).
• PO produces less hydrogen than SR process per unit of NG, although, both processeshave comparable CO2 emission levels.
• TCD of NG (with NG as a fuel option) produces almost half of the CO2 emissionsproduced by SR with CO2 sequestration.
• TCD of NG (with H2 as a fuel option) produces hydrogen in quantities comparable withthat of PO and SR (with CO2 sequestration), however, it does not produce any CO2. Thus, it is the only fossil fuel based process which shows a real potential to be acompletely CO2-free hydrogen production process.
Experimental
Reagents. Methane (99.99%v.) (Air Products and Chemicals, Inc.) was used without furtherpurification. Samples of activated carbons, graphites, glassy carbon, synthetic diamond powder,fullerenes, carbon nanotubes and acethylene black were obtained from Alfa Aesar and usedwithout further purification. Barneby Sutcliffe Corp. and Cabot Corp. supplied different CB andAC (coconut) samples, respectively. All carbon samples were used in the form of fine powder(<100µm). Activated alumina samples (Fisher Scientific and Alfa Aesar) were used withoutfurther purification.
Apparatus. The experimental set-up depicted on Figure 3- was used for the screening of carboncatalysts, kinetic measurements and testing of different thermocatalytic reactors. The set-upconsisted of 3 main subsystems: (1) a thermocatalytic reactor (with temperature-controlledelectric heater and pre-heater), (2) a feedstock metering and delivery sub-system for gaseous andliquid hydrocarbons, and (3) analytical sub-system. The catalytic reactors were made out of afused quartz or ceramic (alumina) in order to reduce the effect of the reactor material on the rate

of hydrocarbon decomposition. The reactor temperature was maintained at a constanttemperature via a type K thermocouple and Love Controls microprocessor. Amount of carboncatalyst used in the experiments varied in the range of 0.03-5.0 g. Gaseous hydrocarbons flowrates varied from 5 ml/min to 2 l/min.
Gaseous hydrocarbons (methane, propane) were metered by flow meters, and liquid hydrocarbonswere metered and delivered to the reactor by a syringe pump via a temperature-controlledevaporator. Gaseous products of hydrocarbon decomposition passed through a condenser (forseparation of liquid byproducts), a filter (for separation of airborne carbon particles and aerosols)and were analyzed gas-chromatographically).
Analysis. The analysis of the products of methane decomposition was performed gaschromatographically: SRI- 8610A (a thermal conductivity detector, Ar carrier gas, a silicagelcolumn, temperature programming from 27 to 180oC) and Varian-3400, FID, He-carrier gas,Hysep Db. SEM studies were performed using Amray 1810 scanning electron microscope. XRDstudies were conducted using Rigaku diffractometer with D/MAX 2200T/PC ULTIMAaccessory. Polynuclear aromatic byproducts were analyzed spectrophotometrically (ShimadzuUV-2401PC).
Summary
• The technical feasibility of CO2-free production of hydrogen via one-step thermocatalyticdecomposition of hydrocarbons was demonstrated. Methane, propane and gasoline wereefficiently converted into hydrogen and carbon using carbon catalysts.• The catalytic activity and stability of more than 30 different forms and modifications of carbonwere examined, and several of them were selected for further evaluation.• The effect of operational parameters on the H2 yield was determined. H2 concentration in theeffluent gas varied in the range of 30-90 v.%, the balance being CH4 and small amount of C2
+
hydrocarbons. CO or CO2 were not detected among the products. Intermediate and byproductsof methane and propane decomposition reactions were identified and quantified.• The factors affecting carbon catalyst activity and long term stability in hydrocarbondecomposition reactions were studied. It was found that the surface area and crystallographicstructure of carbon species mostly determine the catalytic activity of carbon catalysts. This wasconfirmed by XRD and SEM studies of carbon catalysts.• A kinetic model for methane decomposition over carbon catalysts was developed. Majorkinetic parameters of methane decomposition reaction (rate constants, activation energies, etc.)over selected catalysts were determined.• Various conceptual designs for the thermocatalytic reactors suitable for simultaneousproduction of hydrogen and carbon were evaluated. The following reactors were built and tested:packed bed, tubular, fluidized bed, free volume and fluid wall reactors. • A bench-scale thermocatalytic fluidized bed reactor was designed and fabricated. The reactorwas successfully tested using methane, propane, methane-propane mixture, and gasoline asfeedstocks. Simultaneous production of hydrogen-rich gas (free of carbon oxides) and carbonwas demonstrated.

• Preliminary techno-economic assessment of the TCD process indicated that thethermocatalytic unit with the capacity of an average steam reforming plant would yield hydrogenat a cost of $5.0/MMBTU (if carbon sold at $100/t), which is less than that from steamreforming process coupled with CO2 sequestration.• Comparative assessment of CO2 emissions from different hydrogen production processes wasconducted. It was shown that the TCD is the only fossil fuel based process which shows a realpotential to be completely free of CO2 emissions.• If cost effective processes of hydrogen production via decomposition of NG will be developedand implemented, there would be practically no environmental constraints on using fossil fuels ona large scale.
Current Year Publications:
1. “Hydrogen from Fossil Fuels without CO2 Emissions”, N. Muradov, in Advances inHydrogen Energy, Kluwer Academic/Plenum Publishers, 2000, p.1-16
2. “On Perspectives of CO2-free Production of Hydrogen from Hydrocarbon Fuels for Small Scale Applications”, N. Muradov, Symposium on Hydrogen Production, Storage andUtilization, 1999 ACS Meeting, New Orleans
3. “Hydrocarbon-based Systems for CO2-free Production of Hydrogen”, N. Muradov, 13thWorld Hydrogen Energy Conference, Beijing, China, 2000
4. “Compact Fuel Reformer for Mobile/Stationary Applications”, N. Muradov, Summit onMiniaturization of Energy, Chemical and Biomedical Systems, Orlando, 1999
5. “Thermocatalytic Process for CO2-free Production of Hydrogen and Carbon fromHydrocarbon Fuels”, N. Muradov, U.S. Patent Application No. 60/194828, filed04/05/2000, assignee: University of Central Florida
Acknowledgements
This work was supported by the U.S. Department of Energy and the Florida Solar Energy Center.
References
Audus, H., O. Kaarstad, and M. Kowal. 1996. “Decarbonization of Fossil Fuels: Hydrogen as anEnergy Carrier.” In Proceedings of 11th World Hydrogen Energy Conference, 525. Stuttgart,GermanyBlok, K., R. Williams, R.Katofsky, and C. Hendriks. 1997. “Hydrogen Production from NaturalGas, Sequestration of Recovered CO2 in Depleted Gas Wells and Enhanced Natural GasRecovery.” Energy, 22: 161Calahan, M. 1974. “Catalytic Pyrolysis of Methane and Other Hydrocarbons.” In Proceedings ofConference on Power Sources. 26: 181Diefendorf, R. 1960. J. Chem. Physics, 57, 3, 815Fulcheri, L., and Y. Schwob 1995. “From Methane to Hydrogen, Carbon Black and Water.” Int. J. Hydrogen Energy, 20: 197Garrett, D. 1989. Chemical Engineering Economics. New York: Van Nostrand Reinhold

Gaudernack, B., and S. Lynum. 1996. “Hydrogen from Natural Gas without Release of CO2 tothe Atmosphere.” In Proceedings of 11th World Hydrogen Energy Conference, Stuttgart,Germany, 511-523.International Energy Agency. 1998. Carbon Dioxide Capture from Power Stations. IEAKirk-Othmer Encyclopedia of Chemical Technology. 1978. V. 4. New York: John Wiley & SonsNakicenovic, N. 1993. “Energy Gases: The Methane Age and Beyond.” IIASA, Working Paper-93-033, Laxenburg, Austria, 1-13Lynum, S., R. Hildrum, K. Hox, and J. Hugdabl. “Kvarner Based Technologies forEnvironmentally Friendly Energy and Hydrogen Production.” In Proceedings of 12th WorldHydrogen Energy Conference, 697. Buenos Aires, ArgentinaMuradov, N. 1993. “How to Produce Hydrogen from Fossil Fuels without CO2 Emission.”Intern. J. Hydrogen Energy, 18: 211Muradov, N. 1998. “CO2-free Production of Hydrogen by Catalytic Pyrolysis of HydrocarbonFuel.” Energy & Fuels, 12:41Muradov, N. 2000. Hydrogen from Fossil Fuels without CO2 Emissions.” In Advances inHydrogen Energy. New York: Kluwer Academic/Plenum PublishersOgden, J., M. Steinbugler, and T. Kreutz. 1997. “Hydrogen as a Fuel for Fuel Cell Vehicles: aTechnical and Economic Comparison.” In Proceedings of the *th Annual U.S. HydrogenMeeting, 469. Alexandria, VA: NHAPourier, M., and C. Sapundzhiev. 1997. “Catalytic Decomposition of Natural Gas to Hydrogenfor Fuel Cell Applications.” Intern. J. Hydrogen Energy, 22:429Shpilrain, E., V. Shterenberg, and V. Zaichenko. 1999. “Comparative Analysis of DifferentNatural Gas Pyrolysis Methods. Intern. J. Hydrogen Energy, 24: 613Steinberg, M. 1999. “Fossil Fuel Decarbonization Technology for Mitigating Global Warming.”Intern. J. Hydrogen Energy, 24: 771Tesner, A. 1987. The Kinetics of Carbon Black Production. VINITI: Moscow

List of Figures
Figure 1 - Methane Conversion Rate as a Function of Catalyst Surface Area
Figure 2 - Methane Decomposition over Different Carbon Catalysts at 850oC
Figure 3 - Methane Decomposition over Acetylene Black at 850oC
Figure 4 - Effect of Temperature (a) and Methane Space Velocity (b) on Methane DecompositionYield.
Figure 5 - Experimental Data (circles) and Curve Fit Using the Kinetic Model (gray line)
Figure 6 - Arrhenius Plot for CH4 Decomposition
Figure 7 - Propane Pyrolysis over CB (XC-72) (a) and AC (KE) (b) at 800oC
Figure 8 - XRD Spectra of Carbon Samples
Figure 9 - SEM Micrographs of Carbon Black (BP-2000) Sample Before (left, 1 µm scale) andAfter Exposure to Propane at 850oC for 3.5 h (right, 1 mm scale)
Figure 10 - Schematic Diagram of the Experimental Set-up

with PBR (left) and FBR (right)
Figure 11 - Schematic Diagram of Free Volume Reactor
Figure 12 - Schematic Diagram of Fluid Wall Reactor
Figure 13 - Thermocatalytic Pyrolysis of Propane (a) and Gasoline (b)over CB (BP-2000) at 850oC Using FBR
Figure 14 - Simplified Flow Diagram of TCD Process for Production of Hydrogen and Carbon1- FBR, 2- heater, 3- membrane, 4- grinder
Figure 15 - Comparative Assessment of Hydrogen Production Cost by SR and TCD Processes
Figure 16 – Comparison of CO2 Emissions from Different Hydrogen Production Processes