Thermal Properties Automotive Polymers V. Flammability ......investigate the flammability...
52
Thermal Properties of Automotive Polymers V. Flammability Test for Fire Retardant Polymens. lsmat A. Abu-lsa Delphi Research Labs & Shehdeh Jodeh HP Microsystems Summary Motor vehicle safety standard MVSS 302 applies to the flammability of certain materials found in automotive interiors. A burn test was developed to investigate the flammability characteristics of selected automotive polymers under more severe fire conditions than those used for the MVSS 302 standard. The test was conducted using two infrared heaters to warm up the surfaces of the sample from both sides, to a desired temperature, prior to ignition. For this report samples were mounted at a 45' angle, and ignited using a :35-mm diameter Meeker burner. Two load cells were used, one to measure total weight loss due to dripping and combustion, and the other to measure the mass of material generated by melt dripping. The flammability behavior of two grades each of fire retardant polypropylene and nylon 66 and their base resins were determined using the burn test. Similar studies were also conducted for a nylon 6 base polymer and a nano-composite based on that polymer. Burn tests were carried out on samples preheated to three different temperatures, controlled at around 200 OF, 250 OF, and 300 OF prior to the introduction of the flame. Generally, burn spread rate and degree of dripping were more highly accelerated by increased preheat temperatures for samples that do not contain fire retardants. For fire retardant samples some preheat 1
Transcript of Thermal Properties Automotive Polymers V. Flammability ......investigate the flammability...
Thermal Properties of Automotive Polymers
V. Flammability Test for Fire Retardant Polymens.
lsmat A. Abu-lsa
Delphi Research Labs
&
Shehdeh Jodeh
HP Microsystems
Summary
Motor vehicle safety standard MVSS 302 applies to the flammability of
certain materials found in automotive interiors. A burn test was developed to
investigate the flammability characteristics of selected automotive polymers
under more severe fire conditions than those used for the MVSS 302 standard.
The test was conducted using two infrared heaters to warm up the surfaces of
the sample from both sides, to a desired temperature, prior to ignition. For this
report samples were mounted at a 45' angle, and ignited using a :35-mm
diameter Meeker burner. Two load cells were used, one to measure total weight
loss due to dripping and combustion, and the other to measure the mass of
material generated by melt dripping.
The flammability behavior of two grades each of fire retardant
polypropylene and nylon 66 and their base resins were determined using the
burn test. Similar studies were also conducted for a nylon 6 base polymer and a nano-composite based on that polymer.
Burn tests were carried out on samples preheated to three different
temperatures, controlled at around 200 OF, 250 O F , and 300 OF prior to the
introduction of the flame. Generally, burn spread rate and degree of dripping
were more highly accelerated by increased preheat temperatures for samples
that do not contain fire retardants. For fire retardant samples some preheat
1

Thermal Properties of Automotive Polymers
V. Flammability Test for Fire Retardant Polymers.
lsmat A. Abu-lsa
Delphi Research Labs
&
Shehdeh Jodeh
HP Microsystems
Summary
Motor vehicle safety standard MVSS 302 applies to the flarnmability of
certain materials found in automotive interiors. A burn test was developed to
investigate the flammability characteristics of selected automotive polymers
under more severe fire conditions than those used for the MVSS 302 standard.
The test was conducted using two infrared heaters to warm up the surfaces of
the sample from both sides, to a desired temperature, prior to ignition. For this
report samples were mounted at a 45O angle, and ignited using a 35-mm
diameter Meeker burner. Two load cells were used, one to measure total weight
loss due to dripping and combustion, and the other to measure the mass of
material generated by melt dripping.
The flammability behavior of two grades each of fire retardant
polypropylene and nylon 66 and their base resins were determined using the
burn test. Similar studies were also conducted for a nylon 6 base polymer and a nano-composite based on that polymer.
Burn tests were carried out on samples preheated to three different
temperatures, controlled at around 200 OF, 250 O F , and 300 O F prior to the
introduction of the flame. Generally, burn spread rate and degree of dripping
were more highly accelerated by increased preheat temperatures for samples
that do not contain fire retardants. For fire retardant samples some preheat
1
treatment-related acceleration in burn rate and dripping was observed. Both
phosphorous-based and halogen-based fire retardants were effective in slowing
the ignition, propagation, and melt dripping at higher sample pre-ignition
temperature as has been previously observed for samples ignited at room
temperature.
Introduction
This study was funded by GM pursuant to an agreement between GM and
the U S . Department of Transportation. The specific purpose of the work
described in this report was to develop a flammability test methodology for
selected polymeric materials used in the engine compartment. More severe fire
conditions than those specified in the MVSS 302, were introduced in order to
reflect underhood thermal environments experienced by underhood materials
during some post-crash fires.
A variety of tests have been developed to assess materials flammability
properties. An extensive list of flammability tests was compiled by Hilado [l].
These include tests for smolder susceptibility, materials ignitability, flash-fire
propensity, flame spread, heat release, fire endurance, ease of extinguishment,
smoke evolution, toxic gas evolution, and corrosive gas evolution. Many of the
tests and standards originating in the United States of America are the work of
four organizations, namely, the American Society for Testing andl Materials
(ASTM) [2], Underwriters’ laboratories (UL) [3], National Fire Protection
Association (NFPA) [3], and International Conference of Building Officials (ICBO)
141.
Most of the tests are small-scale laboratory tests, because they are more
easily and more economically replicated than large-scale tests. However large-
scale tests involving tunnels, rooms, or whole products have been developed
2

and are used as a check on the results of small-scale tests. It is often difficult to
develop correlation between laboratory and large-scale tests.
For small-scale tests many ignition sources are employed to start the
sample on fire. For example, ignition could be started by heated air, radiant
heaters, a hot surface, a hot wire, an arc, a burner, a liquid fuel, or a solid
combustible. For tests using a burner flame ignition source, the samples could
be mounted horizontally (for example in ASTM D 635, UL 94H, and MVSS 302),
mounted at a 45O angle (ASTM D 1230), or mounted vertically (ASTM D 568, UL
94v). In these tests, sample ignitability as a function of time, or oxygen
concentration (ASTM D 2863) is evaluated. For samples that ignite, the speed of
flame travel across the length of the sample is also evaluated. Tlhe sample is
preconditioned to specified humidity before ignition. Ignition is started in a
chamber at room temperature. For most tests the igniter flame is; only 3 mm in
diameter, and 20 mm high. Under these conditions the environment is very mild
and involves only a small area of the sample and its immediate vicinity. Only
material factors are evaluated. Other tests such as the ASTM E 906 that employ
radiant heat flux (The Ohio State University Apparatus, or the cone calorimeter),
employ intense heating. In most instances the polymeric sample under
investigation is in a molten or liquid form at the time of ignition. Which of these
types of test should be used is decided by the characteristics of the fire scenario
one is trying to simulate.
For the automotive industry, the MVSS 302 standard regulates the
flammability of materials used in the interiors of cars and trucks. The FMVSS
302 test is run on samples mounted horizontally, and ignited withi a 3-mm
diameter, 20-mm long Bunsen burner flame. A materials flammability standard
used by General Motors for evaluating flammability of engine cornpartment
sound absorbing materials is the GM 269M standard. The test procedures for
this standard are described in GM9883P. In this test, the sample is mounted at
a 45" angle and ignited by a Meeker burner with a grid diameter of 33 mm. The
3

flame height is adjusted to 100 mm. The sample is exposed to the ignition
source for 15 seconds.
The test methodology described in this report is based upon the GM
9833P test procedure. The test was modified to be more quantitlative, and to
represent a more severe flammability environment. All modifications will be
discussed in the experimental section. The test was used to investigate the
flammability behavior of two types of automotive polymers, nylon and
polypropylene. For each polymer type, commercial grades with 8~ without fire
retardant additives were investigated. These polymers were chosen because
they are the two most widely used for automotive exteriors and under hood
applications[6].
Experimental
Materials:
The different grades of polypropylene and nylon used in the study have
been described in a previous report [7]. Base polypropylene graldes Pro-fax SB-
786 and 8523 were obtained from Montell, while the fire retardanit grades based
on these base polymers, RTP 151 and RTPI56, were obtained from the RTP
company (a supplier company of fully formulated plastic materials). RTP 151
contains phosphorous compounds as fire retardant additives, while the fire
retardancy in RTP I56 is based on bromine antimony chemistry.
Two grades of nylon 66 were also obtained from RTP. Compound 200H
contains a halogenated fire retardant additive, while compound 2!99 is the base
polymer without fire retardant. A non-halogenated fire retardant grade of nylon
66 Ultramid A3X2G5 was obtained from BASF, along with its ba!;e polymer
Ultramid A3K. Two grades of nylon 6 were also investigated. One of the grades
is a base resin and the other is a nano-composite made from the same resin.
4
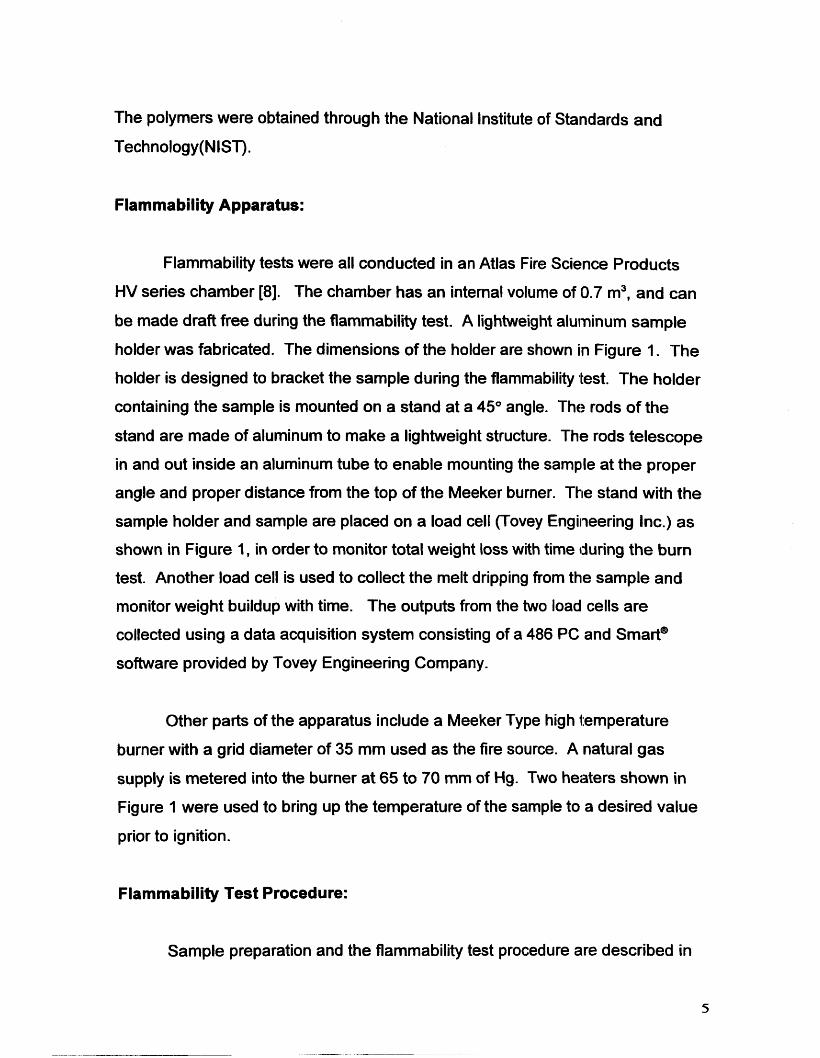
The polymers were obtained through the National Institute of Standards and
Technology( N IST).
Flammability Apparatus:
Flammability tests were all conducted in an Atlas Fire Science Products
HV series chamber [8]. The chamber has an internal volume of 0.7 m3, and can
be made draft free during the flammability test. A lightweight aluminum sample
holder was fabricated. The dimensions of the holder are shown in Figure 1. The
holder is designed to bracket the sample during the flammability test. The holder
containing the sample is mounted on a stand at a 45O angle. The rods of the
stand are made of aluminum to make a lightweight structure. The rods telescope
in and out inside an aluminum tube to enable mounting the sample at the proper
angle and proper distance from the top of the Meeker burner. The stand with the
sample holder and sample are placed on a load cell (Tovey Engineering Inc.) as
shown in Figure 1, in order to monitor total weight loss with time during the burn
test. Another load cell is used to collect the melt dripping from the sample and
monitor weight buildup with time. The outputs from the two load cells are
collected using a data acquisition system consisting of a 486 PC and Smart@
software provided by Tovey Engineering Company.
Other parts of the apparatus include a Meeker Type high temperature
burner with a grid diameter of 35 mm used as the fire source. A natural gas
supply is metered into the burner at 65 to 70 mm of Hg. Two heaters shown in
Figure 1 were used to bring up the temperature of the sample to a desired value
prior to ignition.
Flammability Test Procedure:
Sample preparation and the flammability test procedure are described in
5

details in Appendix I I of this report. To summarize, a 300 mm lorig x 100-mm
wide polymer sample is used. The preferred thickness is 2 to 8 nnm. The
sample is placed in a frame, which in turn is mounted on a stand at a 45O angle.
The whole assembly is placed on a load cell in a flammability test chamber.
Initial weight of the sample is noted using the data acquisition sy!;tem connected
to the load cells. The polymer sample is heated, on both surfaces, to the desired
temperature using infrared heaters. The ignition source is then introduced. The
source is a 35" grid Meeker burner supplied with natural gas ;at a pressure of
65 to 70 mm of Hg, to produce a flame 100 mm tall. Ignition is attempted by
exposing the sample to the flame for 15 seconds. If combustion is sustained, the
sample is allowed to burn for five minutes, or until it self-extinguishes, whichever
comes first. If the sample self-extinguishes within ten seconds of removal of the
flame, the ignition protocol is repeated eight times. During the test, the chamber
is kept draft free. At the end of the test, fumes are exhausted from the HV
chamber, before opening the large glass panel door. Nitrogen giaS is used to
extinguish samples that continue to burn at run termination.
The data collected during the run include sample weight loss due to
combustion and melt dripping, collected by one load cell, and the weight of the
melt dripping by itself collected by a second load cell. Other information noted
for each test include the number of ignition attempts, and whether or not the melt
drip supports fire.
Results and Discussion
Many fire tests have been developed by a number of laboratories around
the world to determine the flammability properties of materials used in different
applications [reference 1, Chapter 41. Some of these tests are generic in nature
and are aimed at determining materials properties. Others are aimed at testing
6
materials used in specific applications to determine the level of fllamrnability
resistance expected of these materials for proper in-service performance. Some
of the tests such as UL 94 H [3] are conducted under mild fire conditions to
assess flammability resistance of materials exposed to a low energy source such
as a lit candle or cigarette. Other tests, such as those conducted in the cone
calorimeter, employ an intense heat source to simulate intense fires sometimes
experienced during building fires or fuel fed automotive fires. The test subjects
samples to radiant heat from a source that generates a flux up to 100 kW/m2.
Samples are allowed to melt, degrade, and generate gaseous decomposition
products, which are ignited by a small flame source placed above the sample
tray. In this case the total sample is heated to very high temperatures and
undergoes a phase change before it is involved in the fire. The sample will
behave differently as a fuel source than in other tests, where onky a small portion
of the sample, i.e. area directly involved in the fire and its immediate
surrounding, actually undergoes a phase change.
not always possible. Actually, some materials such as nano-comlposite nylon
exhibit excellent flammability performance in cone calorimeter tests [9], but fail
the UL-94 H test. Most other materials show better performance when
measured by the UL-94 test. For this reason, specific tests are designed for
specific applications to insure a level of fire resistance under specific fire
conditions.
.
Correlation between tests is
In addition to flame spread rate or heat release rate, other flammability
tests are aimed at measurements of other effects of fire on materials such as the
nature and amounts of combustion products and the amount of smoke
generated during combustion.
For the automotive industry, the goal of fire testing thus far is to insure
that fire spread through materials used in the passenger compartment is slow
enough to allow occupants time to safely escape a burning vehicle. Flammability
test MVSS 302 uses a candle-like source to ignite a sample held in a horizontal
orientation. For other automotive applications, such as the fuel tank and parts
7
used in the engine compartment, tests other than the MVSS 302 are in use or
are being developed to insure flammability resistance for materials used in these
applications.
One such test was designed by GM for flammability testing of engine
compartment sound absorbers (GM 9833P). The test uses a 35-mm grid
Meeker burner having a 100 mm long flame. This represents a much more
intense fire source than the 3-mm wide, 20 mm high Bunsen burner flame source
used for the MVSS 302 test. The sample in the GM test is oriented at a 45"
angle to encourage flame propagation. In this test, flammability resistance was
measured by the amount of sample weight loss due to buming and melt dripping.
The test also stipulates that the melt dripping should not be flaming.
Our test was designed around the GM 9833P test. It was designed to be
more quantitative by using load cells to measure the weight of saimple consumed
by the fire as a function of time, and the weight of melt dripping, i&O as a
function of time. The other modification was to use infrared heatlers to warm up
the surfaces of samples to desired temperatures prior to ignition. This
recognizes the fact that engine compartment service temperatures are normally
above room temperature. A realistic flammabillty test should take this fact into
account.
The polymers tested, along with the name of supplies are shown in Table
1. Also shown in the table are the density, tensile properties, flexural modulus,
heat deflection, and impact strength. All these properties had been determined
and reported in a previous study [7]. Flammability tests on five of these
polymers were conducted on samples preheated to 200 k 5 O F , 2:50 k 5 O F , and
300k 5 OF prior to ignition. The results of this study, combined with results
obtained previously [7] at room temperature, are shown In Table 2, and Figures
2 through 8. Table 2 contains data on percent total weight loss and percent melt
8

dripping after the flammability tests.
Total Mass Loss
Figure 2 is a plot of percent mass loss of polypropylene, nlylon 66, and
nylon 6 samples after the flammability test. For each polymer, weight loss was
plotted versus the temperature to which the sample is pre-heatedl prior to
ignition. The reported weight loss is the result of combustion andl melt dripping.
All samples exhibited higher weight loss when the sample was heated to higher
temperatures prior to ignition. In the case of polypropylene, an accelerated
weight loss is observed for sample preheated to 250 OF and 300 OF prior to
ignition. For the nylon samples weight loss increased, more or less, linearly with
pre-ignition sample temperatures. Comparing the performance of polypropylene
sample 8523 with the fire retardant grade sample RTP156, it is obvious that the
fire retardant is very effective in limiting the involvement of polypropylene in fire,
for all pre-ignition sample temperatures. On the other hand a nano-composite of
nylon 6 exhibits higher weight loss than the nylon 6 base polymer, again at all
pre-ignition sample temperatures.
The results of measurements of melt dripping (Figure 3) show the same
patterns as the weight loss results when plotted versus sample temperature
(Figure 2). This is not surprising since most of the sample weight loss during the
flammability test is caused by melt dripping.
The total weight loss of samples during the fire test is plotrted versus time
in Figures 4 through 8. For polypropylene, weight loss exhibits a linear relation
with time during the initial stage of burning. An accelerated rate is exhibited
later. The accelerated rate starts after one minute after ignition for samples
heated to 250° and 300° F prior to ignition. At the lower sample pre-ignition
temperature, accelerated weight loss does not start till after four minutes of
9

burning. For fire retardant polypropylene (RTP 156), the cumulative mass loss
rate is lower than the cumulative mass loss of the base polypropylene polymer
as seen by comparing the results in Figures 4 & 5. For this polymer, a relatively
fast rate of mass loss is observed within the first minute after igniition, followed by
a linear rate. Significant acceleration in the rate of weight loss is observed only for the sample heated to 300' F prior to ignition.
For the nylon 66 sample, mass loss rate is linear with timet at all pre-
ignition sample temperatures (Figure 6). The rate of mass loss is even lower
than the fire retardant polypropylene sample. As expected, higher weight loss is
observed for samples pre-heated to higher temperatures. The mass loss rate for
Nylon 6 samples is also low (Figure 7), although higher than that of Nylon 66.
Acceleration in weight loss versus time for this polymer is observed for the
sample heated to 200° F or higher. A nano-composite formulation based on the
same nylon 6 grade shows a higher weight loss rate than the base polymer, as
seen by comparing Figures 7 and 8. Acceleration in the rate of mass loss is
observed for all samples within the first minute of burn. The sarriple at room
temperature shows a constant mass loss rate after about 2.5 minutes of burn
(Figure 8), similar to the behavior observed for the base polymer (Figure 7).
Weight of Melt Dripping
The total sample mass loss includes both mass losses due to combustion
as well as due to melt dripping. In order to separate the two effects, a load cell
was installed and dedicated to measuring the weight of melt dripping by itself.
From the total mass loss and the weight of dripping one calculates the mass loss
due to combustion. The results on melt dripping of polymer samiples preheated
to 250' F prior to ignition are shown in Figures 9 through 18. For polypropylene
samples, the weight of melt dripping is relatively slow during the first two minutes
of burning. Dripping accelerates thereafter, reaching a maximurn weight at about
10

2.5 minutes (Figures 9 & IO ) . Continued, weight loss is observed because for
this sample the molten polymer supports flames and continues to burn after
dripping. For phosphorus-based fire retardant polypropylene (RTP 1 51), drip
rate is linear with time (Figure 11). Very little melt dripping takes place (less than
a gram after 5 minutes of burn) as compared to the polypropylene samples that
do not contain fire retardants (18 to 30 gram). Halogen-based fire retardant
polypropylene sample RTP 156 exhibits the same low level of melt dripping
(Figure 12). For nylon 66 (A3K) obtained from BASF, melt dripping starts at a
high rate, and continues to accelerate reaching a maximum weight of 6.5 grams
at about 2.5 minutes (Figure 13). Subsequently, melt starts to show weight loss
due to continued combustion. The rate of dripping and the rate of combustion of
the melt determine the shape of the cumulative mass of drip versus time curve.
For the non-halogenated fire retardant polymer based on the above grade of
nylon 66 (A3X2G5), melt dripping is much reduced and does not support
combustion (Figure 14). Two other grades of nylon 66 were also investigated, a
base polymer grade (299X) and a halogenated fire retardant gracde (200 H) both
obtained from RTP. Both polymers exhibited a small amount of non-flaming melt
dripping (Figures 15 and 16). Nylon 6 base polymer and a nano-composite
based on this polymer both exhibited a large degree of dripping (Figures I 7 &
A8). The melt dripping in both cases supported combustion. The nano-
composite showed a higher degree of dripping than the base pollymer.
Weight of Sample Consumed by Fire
The weight of sample consumed by combustion is obtained by subtracting
the weight of melt dripping obtained by one load cell from the to1,aI weight loss,
as measured by the other load cell. The results of the weight of sample
consumed by fire versus time of combustion are plotted in Figures 19 through
28. A best-fit polynomial curve passing through the origin is also shown in the
graphs. In these figures y stands for mass loss and x stands for time of
11

combustion. Since the data is obtained by subtracting inputs obtained by two load cells, neither of which is in a stable environment, a large degree of data
scatter is observed especially at the initial stage of combustion. Both load cells
are placed inside the combustion chamber and are exposed to vlarying
temperatures and air currents caused by Bunsen burner and sample flames.
In addition, combustion of the sample is not occurring under steady state
conditions. A polymer sample under fire undergoes partial melting and dripping,
thus providing fresh surfaces for fire propagation unhindered by char or other
burning products normally formed during combustion. A further complication is
that the data presented includes combustion of both the sample itself and the
melt drip collecting on the second load cell. Thus it will be very clifFicult to model
behavior of materials under the complex and non-steady state fire conditions
used in this test. The equations presented in the graph are only curve fitting and
are not based on fundamental materials properties.
However examining the curves in Figures 19 through 28, *three types of
behavior are observed. The first type of behavior is exhibited by polymer
samples that do not contain fire retardants. These include two propylene
samples profax SB 786, and 8523, nano-composite nylon 6 samples, and to
some extent nylon 66 sample RTP 299X. For these polymers the rate of mass
consumed by fire accelerates with time of combustion (see Figures 19-22) in a
similar manner to the rate of oxygen consumption observed during auto catalytic
polymer aging [IO]. A differential equation generated by curve fitting of the data
can be represented by:
dyldx = ax + b
where y is the mass consumed by fire and x is the time of combustion. The rate
of mass consumed is a function of the value of a. For polypropylene high values
12
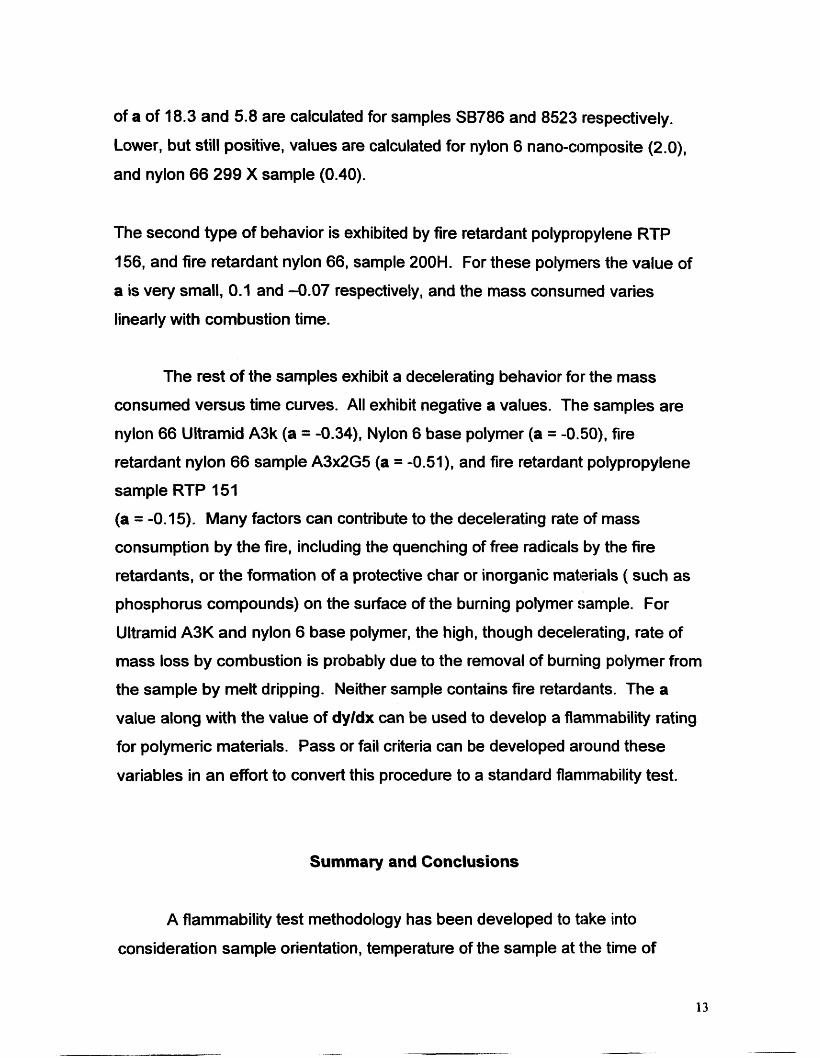
of a of 18.3 and 5.8 are calculated for samples SB786 and 8523 respectively.
Lower, but still positive, values are calculated for nylon 6 nano-composite (2.0),
and nylon 66 299 X sample (0.40).
The second type of behavior is exhibited by fire retardant polypropylene RTP
156, and fire retardant nylon 66, sample 200H. For these polymers the value of
a is very small, 0.1 and -0.07 respectively, and the mass consumed varies
linearly with combustion time.
The rest of the samples exhibit a decelerating behavior for the mass
consumed versus time curves. All exhibit negative a values. The samples are
nylon 66 Ultramid A3k (a = -0.34), Nylon 6 base polymer (a = -0.50), fire
retardant nylon 66 sample A3x2G5 (a = -0.51), and fire retardant polypropylene
sample RTP 151
(a = -0.15). Many factors can contribute to the decelerating rate of mass
consumption by the fire, including the quenching of free radicals by the fire
retardants, or the formation of a protective char or inorganic materials ( such as
phosphorus compounds) on the surface of the burning polymer sample. For
Ultramid A3K and nylon 6 base polymer, the high, though decelerating, rate of
mass loss by combustion is probably due to the removal of burniing polymer from
the sample by melt dripping. Neither sample contains fire retardants. The a
value along with the value of dyldx can be used to develop a flammability rating
for polymeric materials. Pass or fail criteria can be developed around these
variables in an effort to convert this procedure to a standard flammability test.
Summary and Conclusions
A flammability test methodology has been developed to take into
consideration sample orientation, temperature of the sample at t.he time of
13

ignition, and ignition source total energy and intensity. These variables can be
chosen to simulate conditions to which a part may be subjected in an engine
compartment fire. A limited number of samples were evaluated using this
methodology. Fire retardant and base polymer polypropylene arid nylon 66
samples were examined. In addition, nano-composite and base polymer nylon 6
samples were investigated. We found that when samples are heated above
room temperature prior to ignition, their rates of combustion and melt dripping
are accelerated. We also found that fire retardants reduce these rates under fire
conditions used in this method. On the other hand, a nano-composite nylon 6,
which exhibits fire retardancy characteristics when tested using EI cone
calorimeter, does not perform well under the conditions of our test.
The methodology allows the quantification of burn rate, melt drip rate, and
total amount of burning.
References
1- Carlos J. Hilado, “Flammability Handbook For Plastics”, Chapter 4,
Technomic Publishing Company, Lancaaster, PA, 1990.
2- American Society for Testing and Materials, Philadelphia, PA.
3- Undenvriters’ Laboratories, Northbrook, IL.
4- National Fire Protection Association, Quincy, MA.
5- International Conference of Building Officials, Whittier, CA.
6. Automotive Plastics Monthly Newsletter, March 1999, Market Search Inc.,
Toledo, Ohio.
7. lsmat A. Abu-lsa and Shehdeh Jodeh “Thermal Properties of Automotive
polymers, 111. Thermal Characteristics and Flammability of Fire Retardant
Polymers”. General Motors Research & Development Center Publication R&D
9027, November 17,1999.
14
8. The Atlas Electric Devices Company, Chicago, IL
9. Jeffrey W. Gilman and Takashi Kashiwagi, SAMPE Journal 33(4), 40(1997)
10. Tibor Kelen, "Polymer Degradation", Published by Van Nostrand Reinhold
Company, New York, 1983. Chapter 6 "Oxidative Degradation".
Appendix I
ProPosed Flammabilitv Test Procedure For Polymeric Maiterials Used
Underhood
I Sample preparation
1.1
1.2
I .3
I .4
For this test, the preferred specimen size is 4mm thick x 100" wide x
300 mm long.
Sample width should always be 100"; however, sample thickness could
vary between 2mm and 8 mm, and sample length between 100" and
300".
The sample can be obtained from extruded or molded sheets or articles.
The sample is dried in a vacuum oven set at 200 f 5 OF for 2 hours. After
drying, the sample is placed in a desiccator for 45 minutes to cool down to
room temperature.
Sample is weighed
2Sample setup inside the chamber
2.1 Place sample in the holder (Figure 1)
2.2 Mount the holder on the supporting rods at a 45" angle in such a manner
that the lowest point of the sample is positioned 25 mm above the top of
the Meeker Burner (Figure 1).
2.3 The sample holder and positioning rods are placed in a ventilated HVAA
flammability chamber made by Atlas Electric Devices Cornpany .
16
2.4. Place aluminum foil on both load cells to collect any drippiing from the
sample. One of the load cells is used for monitoring the weight loss from
the sample during fire. This includes weight loss due to combustion and
melt dripping. The other load cell is positioned under the sample to collect
and provide a continuous measure of the weight of dripping from the
sample during burning.
Turn the PC computer on using the Smart software and tare the weight for
both cells.
2.5 After loading the sample, write down the weight by reading it from the
computer. This can be done by going to the Smart directory in the hard
drive, then main menu, then configure meters (meter 1 is lor cell no .I and
meter 2 for cell no. 2) then press the log function in the menu and read
the weight in grams from channel 1.
2.6 Two infrared heaters are used to warm up the sample to ai preset
temperature before starting the flammability experiment. 'Turn on the IR
heaters. Adjust the power to obtain the desired temperature. Allow at
least one hour for the sample to equilibrate.
3. Meeker Burner
3.1
3.2
Adjust the gas pressure on the control panel at 65 to 70 mm of Hg.
Adjust the flow rate of the gas to reach a flame height of100 mm.
4. Thermocouples Placement
4.1 Attach four Stickon thermocouples (RDF Corporation) to the surface of the
sample at two inches from the top and bottom edges of thte sample in both
17
sides. The sample temperature is recorded by using a Fluke 51 K/J
Thermometer made by John Fluke MFG. CO. INC at the four different
spots.
5. Procedure
5.1
5.2
5.3
5.4
5.5
5.6
5.7
Shut off the exhaust blower
Weigh the sample before applying the flame and denote it as (Wb) as
Described in 2.5.
Read the temperature of the surface of the sample as described in 4.1.
Shut the large sliding glass panel and wait at least five minutes so the
surface temperature of the sample gets back to the set temperature.
Using the small entry port at the bottom of the cabinet, position the burner
so that the center of the fla.me is on the edge of the sample.
Simultaneously, slide the flame underneath the center of the bottom edge
of the sample and start the timer.
After 15 seconds, push the burner away from the sample. Collect data for
weight changes using the computer to monitor the output of both load
cells. Cell 1 is dedicated to measure the weight loss of the sample and
cell 2 is for measuring the weight of melt drip, which comes from the
sample after it gets exposed to the flame. Measurements are conducted
for five minutes, or until the sample self extinguishes, whichever comes
first. However, if the sample self extinguishes right after the flame is
drawn away, ignition is attempted 8 times, using the above procedure.
Exhaust the fumeskmoke from the HVAA cabinet before opening the
18
large glass panel and extinguish the flame by introducing nitrogen gas.
5.8 Carefully remove the tested sample from the sample holder and
dry in an oven following the procedures described in part ‘I .3.
Weigh the tested specimen and record the result as weight after (Wa).
6. Data Analysis
6.1 Calculate the weight loss from the formula:
%m LOSS = 2 x [o(vb-w~)M/b] x 100
The factor 2 in the above equation is used to account for the fact that half
the sample is covered by the frame, and not allowed to burn.
6.2 Plot the total weight loss versus time curves.
6.3 Plot the total mass of melt dripping versus time.
6.4 Calculate the weight of sample consumed by combustion, and plot it
against time.
Melt dripping should be observed & documented as to whlether or not it
continues to burn.
Record the number of ignitions attempted to start the sample on fire.
19

20

m cv m 00 cv m I I
8 * cz 0 (3 w t I I
(u (c 0 *
(3 * 0 * (0 b 0 cv
v) co v) .c
m m v-
0 s I 12 m m eo I 0
v) e4 I
v) 00 b
m z
L .- a 5 a t ([I B Q) 0
0 r 7- m v)
- 0 P
0 0 0 .- co I
r eo
n t ([I
0
ON 0 Q) co I
rc 0 <n Q) Q C
m CI) c 0
.- c
a a - n n
a 5, c m
c 0
t LJ)
.- .- CI
.- I
2 P Y
0) c 3 U
..I L
rc 0
U
D
3 ? - cv
m 9 0
cv aq €9
cv 9 F
0 x =t: c\i T
9 D
D u
b c9 T
(0 ? T
b 9 7
0
2 v-
T s T
9 F F
0 0
v ri b x
F
0
cv ? F
0 Y
0
C3
CV C?
3
N 2 a0 x (0
C? r-
n
E Ln (3
2 a c 9
m
N N
0 m cv 0
b
0
2 2 sr 0
m 9 . F rc
0
0 N
<o 00 Q,
? 2
r- 0
0 2 2
F
m c3 z a5 2 2
ab F 2 2 ' 2 N
F
r- 3
N * v 2 2 2
5 Q, x z 42 ab rc F
0 0
Q) OD
9 F
u! .- 0 x F
a0 In t s % s1 F
m x m cu
Q, F
c9 x 8 42 F
00 r- 'c-
0 F 7 s s k .c
U C a 0 0
m s 2 r-
(v m OD
? v) 6 N 2
v 2 8 v)
m F uj N
2 w- 0
U c n en W
n en

.. r(
Figure 2: Total mass loss versus sample temperature at the time of ignition for polypropylene and nylon samples
80
70
60
50
40
30
20
I O
0 0 50 100 150 200 250 300 350
+PP 8523
+PP 156
+-A3X2G5
*Nylon Stand *Nylon Nan0
Temperature, (OF)
24
Figure 3: Weight of melt dripping of polypropylene and nylon samples versus sample temperature at the time of ignition.
70
60
50
s E 40 n n n
.- ‘E
z IC 0
E Q 30 3
20
10
Nylon 6 Bsae Polymer
0 50 100 150 200 250 300 350
Sample Temperature (F)
25
Figure 4:Cumulative mass loss of polypropylene Profax 8523 versus time during flammability test conducted at different pre-ignition sample temperatures.
75
65
55
45
35
25
15
5
I
5.0
-15 J Time(min)
+ 70 OF
+ 200 OF
t, 2500F
3000F
26
Figure 5: Cumulative mass loss of polypropylene RTP 156 versus time during flammability test conducted at different pre-ignition sample temperatures.
7.0
5.0
3.0
1 .o
I
-1 -0
d -70 F +ZOO F +250 F +300 F
Time (min)
27
Figure 6: Cumulative mass loss of Nylon 66 Ultramid A3X2G5 versus time during flammability test conducted at different pre-ignition sample temperatures.
3.0
2.2
1.4
0.6
( -0.2
-1 .o
k
Time(Min)
+70 F +200 F +250 F *300 F
28
Figure 7: Cumulative mass loss of nylon 6 standard versus time during flammability test conducted at different pre- ignition sample temperatures.
12.0
10.0
8.0
6.0
4.0
2.0
0.0 1
0
-2.0
+77 F +ZOO F +250 F *300 F
1
1 .o 2.0 3.0 4.0 5.
Time (min)
30
Figure 8: Cumulative mass loss of nylon 6 nano-composites versus time during flammability test conducted at different pre-ignition sample temperatures.
40
35
30
25
20
15
10
5
0
-5
.
1
1 .o 2.0 3.0 4.0 5.0
Time (min)
+77 F +200F 4 2 5 0 F e 3 0 0 F
31

Figure 9: Cumulative weight of melt-dripping versus time for polypropylene Profax SB 786 sample during flammability test conducted at pre-ignition sample temperature of 250 OF.
35
30
25
20
15
10
5
O ! r I I I 1 I
0.0 0.5 1 .o 1.5 2.0 2.5 3.0
Time (min)
32

Figure I O : Cumulative mass of melt-dripping versus time for polypropylene Profax 8532 sampleduring flammability test conducted at pre-ignition sample temperature of 250 OF.
24.0
16.0
8.0
0.0 I : 1 I I I I
0.0 1 .o 2.0 3.0 4.0 5.(
Time (min)
33

Figure 1 1 : Cumulative mass of melt-dripping versus time for polypropylene RTP 151 sample during flammability test conducted at pre-ignition sample temperature of 250 F.
I
9 fn m 2
?
i 3
5 m
0.8
0.7
0.6
0.5
0.4
0.3
0.2 4 I I I I 1
0.0 1 .o 2.0 3.0 4.0 5.0
Time (min)
34

Figure 12: Cumulative mass of melt-dripping versus time for polypropylene RTP 156 sample during flammability test conducted at pre-ignition sample temperature of 250 OF.
1.2
1 .o
0.8
0.6
0.4
0.2
0.0 0.0
ttt
1 .o 2.0 3.0
Time (min)
4.0 5.0
35
Figure 13: Cumulative mass of melt-dripping versus time for nylon Ultramid A3K sample during flammability test conducted at pre-ignition sample temperature of 250 OF.
7.0
6.0
5.0
n 0
v) 4.0
2 .- B c. cu 3 - 5 3.0 0
2.0
I .o
0.0 0.0 1 .o 2.0 3.0
Time (min)
4.0 5.0
36
Figure 14: Cumulative mass of melt-dripping versus time for Nylon A3X2G5 sample during flammability test conducted at pre-ignition sample temperature of 250 OF.
0.0
1.6
1.2
0.8
0.4
I I 1 I I I
37

Figure 15: Cumulative mass of meltdripping versus time for nylon 66 299X sample during flammability test conducted at pre-ignition sample temperature of 250 OF.
0.3
0.28
0.26
0.24
n 0.22 rr, u) u)
v
9 9 0.2 .- c. m 3 E
0.18
0.16
0.14
0.12
0.1 0.0 1 .o 2.0 3.0
Time (min)
4.0 5.0
38
Figure 16: Cumulative mass of melt-dripping versus time for nylon 66 200H sample during flammability test conducted at pre-ignition sample temperature of 250 F.
1’11
0.35
0.3
0.25
0.2
0.15
0.1
0.05
0
f
0.0 0.5 I .o 1.5 2.0 2.5 3.0
Time (min)
39
Figure 17: Cumulative mass of melt-dripping versus time for nylon 6 base polymer sample during flammability test conducted at pre-ignition sample temperature of 250 OF.
14.0
10.0
6.0
2.0
2.0 3.0
-2.0 J
Time (min)
4.0 5.0
40
Figure 18: Cumulative mass of melt-dripping versus time for nylon 6 nano-composites sample during flammability test conducted at pre-ignition sample temperature of 250 OF.
19.0
14.0
9.0
4.0
I 1 I I 1
1 .o 2.0 3.0 4.0 5.0 -1 .o
Time (min)
41
Figure 19: Mass consumed by fire versus time for polypropylene Profax-SB 786 sample during flammability test conducted at pre-ignition sample temperature of 250 OF.
60.0
48.0
36.0
24.0
12.0
0.0
y = 9 . 1 4 0 9 ~ ~ - 3.6433~ R2 = 0.9848
-12.0 ! Time (min)
42
Figure 20: Mass consumed by fire versus time for polypropylene Profax 8523 sample during flammability test conducted at pre-ignition sample temperature of 250 OF.
38.0
30.0
22.0
14.0 -
6.0
y = 2.85842 - 4.8503~ R2 = 0.9661
1
5.0 -2.0
Time (min)
43
Figure 21 : Mass consumed by fire versus time for Nylon 6 Nano-composites sample during flammability test conducted at pre-ignition sample temperature of 250 F.
16.0
12.0
8.0
4.0
0.0
y = 0 . 4 8 5 8 ~ ~ + 1.0697~ R2 = 0.981 1
0.0 1 .o 2.0 3.0
Time (min)
4.0 5.0
44
Figure 22: Mass consumed by fire versus time for nylon 66 299X sample during flammability test conducted at pre- ignition sample temperature of 250 OF.
11.0
9.0
7.0
5.0
3.0
1.0
y = 0.19882 + 0.8678~ R2 = 0.9665
-1.0 1 Time (min)
45

Figure 23: Mass consumed by fire versus time for polypropylene RTP 156 sample during flammability test conducted at pre-ignition sample temperature of 250 OF.
9.0
7.0
5.0
3.0
y = 0.04972 + 1.1339~ R2 = 0.9529
1
5.0
Time (min)
46

Figure 24: Mass consumed by fire versus time for nylon 66 200H sample during flammability test conducted at pre ignition sample temperature of 250 OF.
5.0
4.5
4.0
3.5
3.0
2.5
2.0
1.5
1 .o
0.5
-0.5
y = -0.03652 + 1.5565~ R2 = 0.9784 /
0.3 1.1 1.9
Time (min)
:2.7 3.5
47

Figure 25: Mass consumed by fire versus time for nylon Ultramid A3K sample during Ranimability test conducted at pre-ignition sample temperature of 250 F.
12.0
10.0
8.0
h 2 6.0 2 cn v
&!
E )r n
4.0
3 v) c 8 v) v)
2.0 3!
0.0 I
-4.0
y = -0.17292 + 2.8676~ R2 = 0.7799
Time (min)
48
Figure 26: Mass consumed by fire versus time for nylon 6 base polymer sample during flmmability test conducted at pre-ignition sample temperature of 250 OF.
10.0
8.0
6.0
4.0
2.0
0.0 0.0
y = -0.2507~~ + 2.7751~ R2 = 0.9719
1 .o 2.0 3.0
Time (min)
4.0 5.0
49

Figure 27: Mass consumed by fire versus time for nylon 66 A3X2G5 sample during flamrnability test conducted at pre-ignition sample temperature of 250 OF.
1.8
1.4
1 .o
0.6
0.2
-0.2
y = -0.2533~~ + 1 .202~ R2 = 0.8429
1
3.0
Time (min)
50
Figure 28: Mass consumed by fire versus time for polypropylene RTP 151 sample during flammability test conducted at pre-ignition sample temperature of 250 OF.
1.6
1.2
0.8
0.4
0.0 (
-0.4
Time (min)
y = -0.0777~~ + 0.6004~
1
5.0
51