Thermal Packaging - SmartCAE€¦ · of thermal packaging ... Configuring the Box Walls Under the...
6
Calculate transient temperature curve of thermal packaging PCM materials for walls and cold packs Time dependent ambient temperature Time dependent surface heat flux caused by solar radiation Short computing time and interactive use (a few minutes on standard laptop) Tailored, easy-to-use graphical user interface THERMAL PACKAGING SOFTWARE Thermal Packaging
Transcript of Thermal Packaging - SmartCAE€¦ · of thermal packaging ... Configuring the Box Walls Under the...

Calculate transient temperature curve of thermal packaging
PCM materials for walls and cold packs
Time dependent ambient temperature
Time dependent surface heat flux caused by solar radiation
Short computing time and interactive use (a few minutes on standard laptop)
Tailored, easy-to-use graphical user interface
Fast and easy-to-use simulation of temperature-sensitive product packaging
THERMAL PACKAGING SOFTWARE
Thermal Packaging

Calculate transient temperature curve of thermal packaging
Place virtual sensors at any point of thermal packaging
Include any number of layers and materials
PCM materials for walls and cold packs
Time dependent ambient temperature
Time dependent surface heat flux caused by solar radiation
Radiation heat transfer at surfaces
Database to build a library of custom wall components, thermal packs, and thermal cycles
Short computing time and interactive use (a few minutes on standard laptop)
Tailored, easy-to-use graphical user interface
Benefits:Main Features:
Quickly optimize package designs
Predict and evaluate the impact of ambient temperature excursions on product integrity
Compare alternate distribution routes virtually
Reduce cost and effort of thermal testing and prototype development
Create confidence in product integrity at all points in supply chain
Utilities for weather data integration

Configuring the Box WallsUnder the rubric “Wall Construction” you define the layers constituting the walls of the box. This can be done separately for each side of the box. Each layer can be assigned a custom label, a material loaded from a database with customizable ther-mal characteristics, and thickness. There is no limit to the number of layers the wall can consist of. The example shows an aluminized EPS wall.
Configuring the cooling elements ("bricks")Under the rubric “Bricks” you can load the material of the brick and specify its dimensions. In the “Sketch” section in the screenshot an exemplary brick is de-picted, a cross section of the brick, and a discretization graphic. In the section
“Cover Layer” the material covering the PCM-material (or plain water) can be se-lected from a customized database.
Assembling the BoxUnder the rubric “Box” you can assign your predefined wall to each side of the box. In the “Content” section you are able to assemble your own virtual box accord-ing to your packout diagram. The “Sum-mary” shows an interactive explosion plot of the shipper for an easy inspection.
CONFIGURE SHIPPER
WORKFLOW of Thermal Packaging Software
Determine the Ambient Temperature for a Specific Location In the top row you enter date, time range, and location. The bottom part shows two graphs visualizing the temperature statis-tics. Statistical data are generated by the tool from its access to historical weather data. The left graph shows the mean (red) and median (blue) temperature for the speci-fied time range. The right graph shows the 95%-quantile (colored boxes), maximum and minimum temperature (error bars), mean (solid line), and median temperature (dashed line). The data can be exported as input for the thermal simulation.
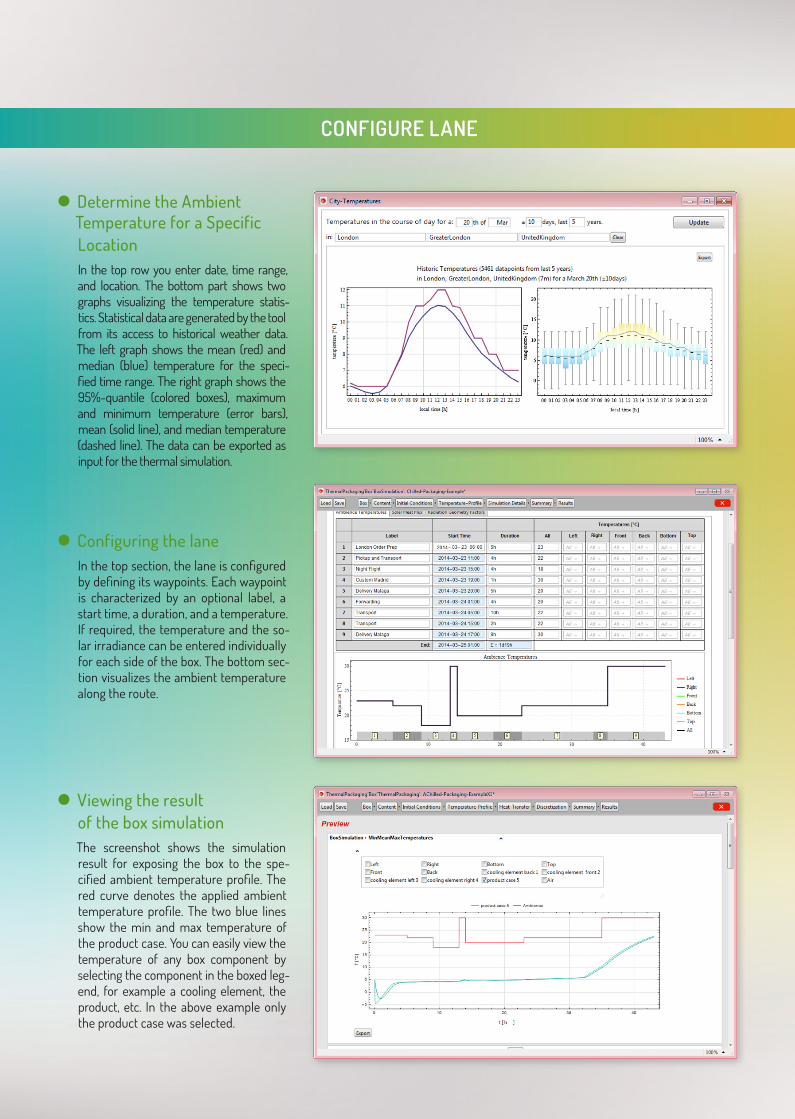
Configuring the laneIn the top section, the lane is configured by defining its waypoints. Each waypoint is characterized by an optional label, a start time, a duration, and a temperature. If required, the temperature and the so-lar irradiance can be entered individually for each side of the box. The bottom sec-tion visualizes the ambient temperature along the route.
Viewing the result of the box simulationThe screenshot shows the simulation result for exposing the box to the spe- cified ambient temperature profile. The red curve denotes the applied ambient temperature profile. The two blue lines show the min and max temperature of the product case. You can easily view the temperature of any box component by selecting the component in the boxed leg-end, for example a cooling element, the product, etc. In the above example only the product case was selected.
CONFIGURE LANE RUN & REVIEW RESULTS

RUN & REVIEW RESULTS
Configuring the temperature sensorsThe left part of the screenshot is a transparent 3D plot of the box, showing three exemplary temperature read out sensors at the product center, the center of the left brick, and the center of the left wall. You can add any number of sensors to your virtual box. The location of the sensors can be specified before or after the simulation.
Viewing the recordings of the virtual sensorsThe red curve shows the ambient lane temperature. The other curves show the temperature recorded by the virtual sensors. You can determine the temperature at any point in the box, at any time on the lane, by placing a virtual sensor.
REVIEWING the charge state of the cooling elements along the laneYou can review the simulated charge state of each cooling element on the entire lane. In the boxed legend, each of the cooling elements can be selected separately. A state of charge of 100% corresponds to an entirely frozen PCM cool-ant. Besides latent heat a PCM coolant can also store energy in form of specific heat. The state of charge is greater than 100%, if the temperature of the cooling element is below the freezing temperature. The state of charge is lower than 0%, if the temperature is above the melting temperature. In the screenshot the selected cooling elements are discharged af-ter about 32 hours.
Reviewing the temperature Distribution inside the boxThe left figure shows an exploded view of the box, color-coded according to its temperature at the time specified in the top slider. The right figure shows a cross section of the box, again in temperature color-code. Cross sections can be taken along all box dimensions.

SmartCAE Stefan Braun
Am Mitterfeld 3D-81829 MunichGermany
For more Information:Mr. Stefan BraunPhone: +49 (0)89 45108878-10Fax +49 (0)89 43738061E-Mail: [email protected]
www.smartcae.de