THERMAL HISTORY RECONSTRUCTION IN THE ATAA-1, GANE-1, …
250
Geotrack International Pty Ltd ABN 16006 883 209 37 Melville Road, Brunswick West, Victoria 3055 Australia tel: +613 9380 1077 fax: +613 9380 1477 email: [email protected] website: www.geotrack.com.au THERMAL HISTORY RECONSTRUCTION IN THE ATAA-1, GANE-1, GANT-1, GRO-3 and UMIIVIK-1 BOREHOLES, ONSHORE WEST GREENLAND, BASED ON AFTA ® , VITRINITE REFLECTANCE AND APATITE (U-Th)/He DATING GEOTRACK REPORT #883 A report prepared for GEUS by Geotrack International Pty Ltd Report prepared by: P.F. Green AFTA determinations by: M.E. Moore, C. O’Brien (U-Th)/He age determinations by: P.V. Crowhurst (CSIRO, Sydney) November 2003
Transcript of THERMAL HISTORY RECONSTRUCTION IN THE ATAA-1, GANE-1, …

Geotrack International Pty Ltd ABN 16006 883 209 37 Melville Road, Brunswick West, Victoria 3055 Australia tel: +613 9380 1077 fax: +613 9380 1477
email: [email protected] website: www.geotrack.com.au
THERMAL HISTORY RECONSTRUCTION IN THE ATAA-1, GANE-1,
GANT-1, GRO-3 and UMIIVIK-1 BOREHOLES, ONSHORE WEST
GREENLAND, BASED ON AFTA®, VITRINITE REFLECTANCE AND
APATITE (U-Th)/He DATING
GEOTRACK REPORT #883
A report prepared for GEUS
by Geotrack International Pty Ltd
Report prepared by: P.F. Green AFTA determinations by: M.E. Moore, C. O’Brien (U-Th)/He age determinations by: P.V. Crowhurst (CSIRO, Sydney)
November 2003

Geotrack International Pty Ltd and its officers and employees assume no responsibility and make no
representation as to the productivity or profitability of any mineralisation, oil, gas or other material in connection with which this report may be used.
AFTA® and Geotrack® are registered trademarks owned and maintained by
Geotrack International Pty Ltd.

Geotrack Report #883: Thermal History reconstruction in five boreholes, Onshore West Greenland
THERMAL HISTORY RECONSTRUCTION IN THE ATAA-1, GANE-1, GANT-1, GRO-3 and UMIIVIK-1 BOREHOLES, ONSHORE WEST
GREENLAND, BASED ON AFTA®, VITRINITE REFLECTANCE AND APATITE (U-Th)/He DATING
GEOTRACK REPORT #883
CONTENTS
Page Executive Summary i-xvi AFTA Paleotemperature analysis summaries; Table i v AFTA Paleogeothermal gradient estimates; Table ii vi Removed section estimates; Table iii, iv, v vii Timing constraints derived from AFTA data in individual samples from five boreholes and one outcrop sample, Figure i x Schematic illustrations of thermal history interpretations; Figures ii, iii, iv, v, vi, vii xi-xvi 1. Introduction 1.1 Aims and Objectives 1 1.2 Report Structure 2 1.3 Data Quality 3 1.4 Apatite Compositions 4 2. Interpretation strategy 2.1 Thermal history interpretation of AFTA data 6 2.2 Thermal history interpretation of VR data 8 2.3 Comparison of paleotemperature estimates from AFTA and VR 9 2.4 Estimates of paleogeothermal gradients and mechanisms of heating and cooling 9 2.5 Determination of removed section 11 2.6 (U-Th)/He dating of apatite as a thermal history tool 14 3. Thermal history interpretation of AFTA data 3.1 Introduction 18 3.2 Contamination in samples from the Gro-3 borehole 18 3.3 General features of the AFTA data 19 3.4 Evidence for elevated paleotemperatures from AFTA 20 3.5 Magnitude of paleotemperatures and timing of cooling from AFTA 21 3.6 Identification of paleo-thermal episodes 22 4. Apatite (U-Th)/He dating 4.1 Results 47 4.2 (U-Th)/He ages vs depth and elevation 47 4.3 Quantitative thermal history interpretation of the (U-Th)/He ages and integration
with AFTA data 48 5. Thermal history interpretation of VR data, integration of AFTA,
(U-Th)/He and VR data, paleotemperature profiles and mechanisms of heating and cooling
5.1 Thermal history interpretation of VR data 71 5.2 Integration of AFTA, (U-Th)/He and VR data, paleotemperature profiles and
mechanisms of heating and cooling 72

Geotrack Report #883: Thermal History reconstruction in five boreholes, Onshore West Greenland
6. Paleogeothermal gradients and removed section 6.1 Introduction 99 6.2 Quantitative estimation of paleogeothermal gradients 99 6.3 Estimation of removed section 103 6.4 Regional geological synthesis 107 7. Thermal and Burial history reconstruction 124 References 135-136
Appendix A - Sample Details, Geological Data and Apatite Compositions A.1 - A.6 Appendix B - Sample Preparation, Analytical Details and Data Presentation B.1 - B.44 Appendix C - Principles of interpretation of AFTA data in Sedimentary Basins C.1 - C.24 Appendix D - Vitrinite Reflectance Measurements D.1 - D.8 Appendix E - (U-Th)/He dating of apatite: Technical and analytical details E1 – E.9

Geotrack Report #883: Thermal History reconstruction in five boreholes, Onshore West Greenland
TABLES Page Table 3.1 - Summary of AFTA data and default history predictions 24 Table 3.2 - Thermal history interpretation summary of AFTA data 25-30 Table 3.3 - Estimates of timing and magnitude of elevated paleotemperatures from AFTA data 31-37 Table 5.1 - Maximum paleotemperatures from VR data in five boreholes 76-77 Table 5.2 - Erosion surface and Kelly Bushing/outcrop elevations for five
West Greenland boreholes and one outcrop sample 78 Table 6.1 - Paleogeothermal gradient estimates, West Greenland boreholes 109 Table 6.2 - Removed section estimates, Eocene-Oligocene episode 110 Table 6.3 - Removed section estimates, Late Miocene episode 111 Table 6.4 - Removed section estimates, Latest Miocene to Pliocene episode 112 Table 7.1 - Paleogeothermal gradients and removed section values used in three
thermal and burial history reconstructions 128 Table A.1 - Details of AFTA samples and apatite yields A.4 Table A.2 - Summary of stratigraphy A.5 Table A.3 - Lower limits of detection for apatite analyses A.6 Table A.4 - Percent errors in chlorine content A.6 Table B.1 - Apatite fission track analytical results B.10-B.11 Table B.2 - Length distribution summary data B.12 Table B.3 - AFTA data in compositional groups B.13-B.19 Glossary B.22 Analytical data B.23-B.44 Table D.1 - VR-paleotemperature nomogram D.3 Table D.2 - VR-reflectance sample details and results supplied by client D.4-D.8 Table E.1 - Borehole samples selected for (U-Th)/He dating E.7 Table E.2 - Apatite (U-Th)/He age determinations E.8 Table E.3 - Apatite (U-Th)/He age alpha particle ejection corrections E.9
FIGURES Figure 1.1 Sample location map with regional geology 5 Figure 2.1 Paleotemperature profiles 16 Figure 2.2 Definition: Paleo-burial vs erosion 17 Figure 3.1a - AFTA parameters plotted against sample depth for Umiivik –1 38 Figure 3.1b - AFTA parameters plotted against sample depth for Gane –1 38 Figure 3.1c - AFTA parameters plotted against sample depth for Gant –1 39 Figure 3.1d - AFTA parameters plotted against sample depth for Ataa –1 39 Figure 3.1e - AFTA parameters plotted against sample depth for Gro –3 40 Figure 3.2 - Relationships between fission track ages in apatites from the
Gro-3 borehole 41 Figure 3.3 - Relationship between fission track age and chlorine content in apatite
grains from the Gro-3 borehole 42 Figure 3.4 - Fission track ages in samples from the Gro-3 borehole, plotted against
sample depth 43 Figure 3.5 - Fission track ages plotted against depth with respect to kb, in samples
from five boreholes and one outcrop location 44 Figure 3.6 - Fission track ages plotted against depth with respect to mean sea level 45 Figure 3.7 - Timing constraints derived from AFTA data in individual samples 46 Figure 4.1 - Measured (U-Th)/He ages plotted against depth for all samples 60 Figure 4.2 - Measured (U-Th)/He ages plotted against depth with respect to mean sea level for all samples 61

Geotrack Report #883: Thermal History reconstruction in five boreholes, Onshore West Greenland
FIGURES (continued) Figure 4.3 - Measured (U-Th)/He ages plotted against depth with respect to mean
sea level 62 Figure 4.4 - Apatite (U-Th)/He age vs grain radius for sample GC883-1 (Umiivik-1) 63 Figure 4.5 - Apatite (U-Th)/He age vs grain radius for sample GC883-3 (Gane-1) 64 Figure 4.6 - Apatite (U-Th)/He age vs grain radius for sample GC883-4 (Gant-1) 65 Figure 4.7 - Apatite (U-Th)/He age vs grain radius for sample GC883-5 (Gant-1) 66 Figure 4.8 - Apatite (U-Th)/He age vs grain radius for sample GC883-8 (Gro-3) 67 Figure 4.9 - Apatite (U-Th)/He age vs grain radius for sample GC883-9 (Gro-3) 68 Figure 4.10 - Apatite (U-Th)/He age vs grain radius for sample GC883-10 (Gro-3) 69 Figure 4.11 - Apatite (U-Th)/He age vs grain radius for sample GC883-13
(Itilli Valley outcrop) 70 Figure 5.1 - Vitrinite reflectance values supplied by GEUS from five boreholes 79 Figure 5.2a - VR values supplied by GEUS from borehole Umiivik-1, plotted against
depth 80 Figure 5.2b - VR values supplied by GEUS from borehole Gane-1, plotted against
depth 81 Figure 5.2c - VR values supplied by GEUS from borehole Gant-1, plotted against
depth 82 Figure 5.2d - VR values supplied by GEUS from borehole Ataa-1, plotted against
depth 83 Figure 5.2e - VR values supplied by GEUS from borehole Gro-3, plotted against
depth 84 Figure 5.3a - Burial history derived from the preserved section in borehole Umiivik-1 85 Figure 5.3b - Burial history derived from the preserved section in borehole Gane-1 86 Figure 5.3c - Burial history derived from the preserved section in borehole Gant-1 87 Figure 5.3d - Burial history derived from the preserved section in borehole Ataa-1 88 Figure 5.3e - Burial history derived from the preserved section in borehole Gro-3 89 Figure 5.4a - Paleotemperature constraints from AFTA, (U-Th)/He and VR data in
Umiivik-1 90 Figure 5.4b - Paleotemperature constraints from AFTA, (U-Th)/He and VR data in
Gane-1 91 Figure 5.4c - Paleotemperature constraints from AFTA, (U-Th)/He and VR data in
Gant-1 92 Figure 5.4d - Paleotemperature constraints from AFTA, (U-Th)/He and VR data in
Ataa-1 93 Figure 5.4e - Paleotemperature constraints from AFTA, (U-Th)/He and VR data in
Gro-3 94 Figure 5.5 Eocene-Oligocene paleotemperature constraints from AFTA, (U-Th)/He
and VR data in five boreholes and one outcrop sample 95 Figure 5.6 Late Miocene paleotemperature constraints plotted against depth 96 Figure 5.7 Late Miocene paleotemperature constraints plotted against depth
from erosion surface 97 Figure 5.8 Late Miocene to Pliocene paleotemperature constraints plotted against
depth from erosion surface 98 Figure 6.1 Eocene-Oligocene paleogeothermal gradients and removed section for
borehole Gro-3 113 Figure 6.2 Eocene-Oligocene paleogeothermal gradients and removed section with
present-day sea level for boreholes Gro-3 and Gane-1 114 Figure 6.3 Eocene-Oligocene paleogeothermal gradients and removed section for
boreholes Gane-1, Umiivik-1 and outcrop sample GC861-13 115 Figure 6.4 Eocene-Oligocene paleogeothermal gradients and removed section for
borehole Gant-1 116 Figure 6.5 Late Miocene paleogeothermal gradients and removed section for
borehole Gro-3 117

Geotrack Report #883: Thermal History reconstruction in five boreholes, Onshore West Greenland
FIGURES (continued) Figure 6.6 Late Miocene paleogeothermal gradients and removed section for
four boreholes 118 Figure 6.7 Late Miocene paleogeothermal gradients with respect to the Neogene
erosion surface for four boreholes 119 Figure 6.8 Late Miocene paleogeothermal gradients with respect to the Neogene
erosion surface for three boreholes and one outcrop sample 120 Figure 6.9 Late Miocene to Pliocene paleogeothermal gradients and removed
section for borehole Gro-3 121 Figure 6.10 Latest Miocene to Pliocene paleogeothermal gradients and removed
section with respect to the erosion surface 122 Figure 6.11 Paleogeothermal gradient estimates for three paleo-thermal episodes 123 Figure 7.1 Possible burial history reconstruction for borehole Gro-3 129 Figure 7.2 Schematic illustration of a possible thermal history reconstruction for
borehole Gro-3 130 Figure 7.3 Alternative possible burial history reconstruction for borehole Gro-3 131 Figure 7.4 Schematic illustration of an alternative thermal history reconstruction for
borehole Gro-3 132 Figure 7.5 A third possible burial history reconstruction for borehole Gro-3 133 Figure 7.6 Schematic illustration of a third possible thermal history reconstruction for
borehole Gro-3 134 Figure B.1 - Construction of a radial plot B.20 Figure B.2 - Simplified structure of radial plots B.21 Figure C.1a Comparison of mean length in Otway Basin reference wells with predictions of Laslett et al. (1987) model C.17 Figure C.1b - Comparison of mean length in apatites of the same Cl content as Durango from Otway Group samples with predictions of Laslett et al. (1987) model C.17 Figure C.2 - Comparison of mean length in apatites of differing chlorine compositions C.18 Figure C.3 - Comparison of mean length in Otway Basin reference wells with predictions of new multi-compositional annealing model C.18 Figure C.4 - Histogram of Cl contents in typical samples C.19 Figure C.5 - Comparison of mean length in Otway Basin reference wells with predictions of Crowley et al. (1991) model for F-apatite C.20 Figure C.6 - Comparison of mean length in Otway Basin reference wells with predictions of Crowley et al. (1991) model for Durango apatite C.20 Figure C.7 - Changes in radial plots of post-depositional annealing C.21 Figure C.8 - Typical AFTA parameters: a. Maximum temperatures now b. Hotter in the past C.22 Figure C.9 - Constraint of paleogeothermal gradient C.23 Figure C.10 - Estimation of section removed C.24
i
Geotrack Report #883: Thermal History reconstruction in five boreholes, Onshore West Greenland
THERMAL HISTORY RECONSTRUCTION IN THE ATAA-1, GANE-1, GANT-1, GRO-3 and UMIIVIK-1 BOREHOLES, ONSHORE WEST
GREENLAND, BASED ON AFTA®, VITRINITE REFLECTANCE AND APATITE (U-Th)/He DATING
GEOTRACK REPORT #883
EXECUTIVE SUMMARY
Introduction and Objectives
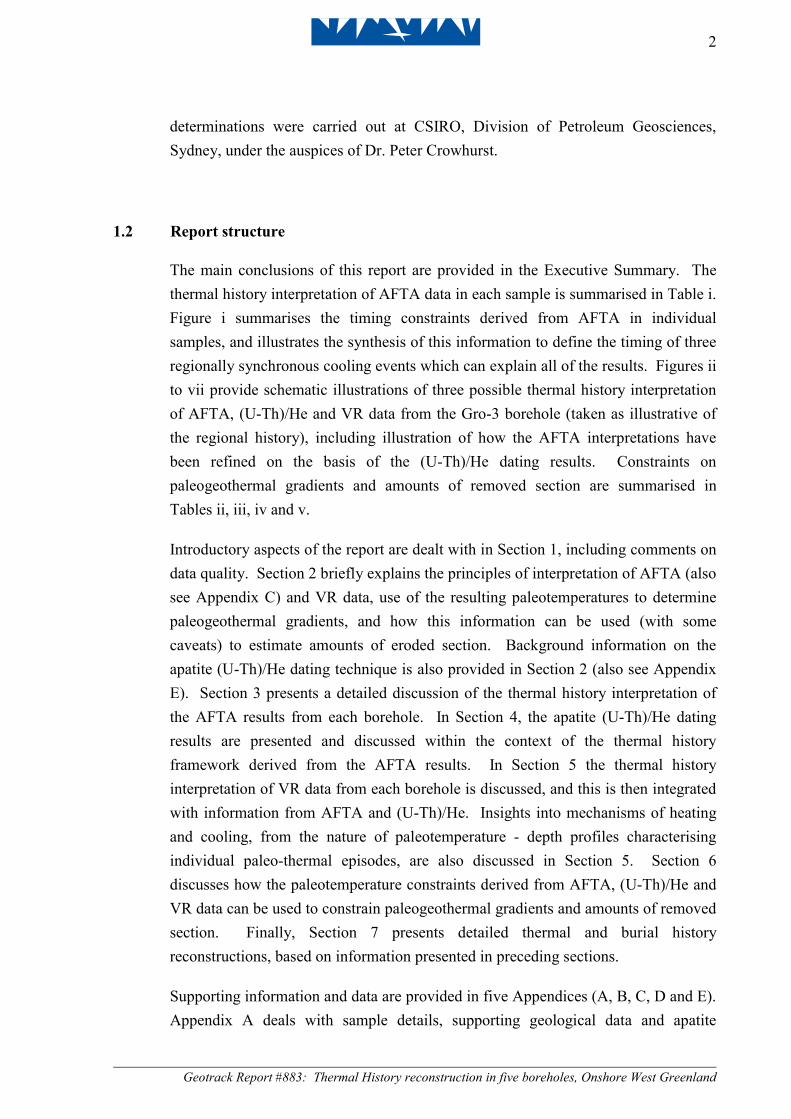
This report describes a thermal history reconstruction study of the Ataa-1, Gane-1, Gant-1, Gro-3, and Umiivik-1 boreholes, Nuussuaq Basin, onshore West Greenland, for GEUS, Copenhagen. The study is based on Apatite Fission Track Analysis (AFTA®) in sixteen samples, and apatite (U-Th)/He dating in selected samples, plus vitrinite reflectance data provided by GEUS. AFTA and (U-Th)/He data have been used to identify, characterise and quantify any episodes of heating and cooling which have affected the samples. This information is then combined with VR data to provide a coherent thermal history framework for the sedimentary section intersected in these boreholes. Information from all samples is then integrated into a regional synthesis. This report represents an extension of earlier studies of samples from the same region, presented in Geotrack Reports #850, 858 and 861.
Summary Conclusions
Integrated AFTA, (U-Th)/He and VR data from five boreholes reveal a high degree of uniformity in the regional thermal history framework, showing that the analysed sedimentary units have been much hotter than present temperatures at some time since deposition. AFTA reveals a series of cooling episodes since Paleogene times, with cooling from maximum paleotemperatures beginning in the interval 40-30 Ma (Eocene-Oligocene), and from subsequent lower paleotemperature peaks at 11-10 Ma (Late Miocene) and 7-2 Ma (latest Miocene to Pliocene). Apatite (U-Th)/He data are generally consistent with the thermal history interpretations derived from AFTA, in some cases allowing significant refinement of Late Miocene paleotemperatures. VR data indicate maximum paleotemperatures which are highly consistent with those derived from AFTA. Eocene-Oligocene paleo-temperatures were caused by a combination of deeper burial (~1700 metres), elevated basal heat flow (paleogeothermal gradient ~50% higher than present-day value) and enhanced surface temperature. Various explanations of the peak paleotemperatures at 11-10 Ma can be accommodated by the data, but all involve burial by over 1500 metres of section which has been subsequently eroded. Late Pliocene paleotemperatures can be explained purely in terms of depth below a regional Neogene erosion surface, and this most recent cooling episode can be explained solely by the incision of the present-day relief across the region.

ii
Geotrack Report #883: Thermal History reconstruction in five boreholes, Onshore West Greenland
TECHNICAL SUMMARY
AFTA data
1: AFTA data show that all samples have been hotter in the past, and define a series of cooling episodes since Paleogene times. Integration of results from all samples from this report, together with data from an outcrop sample from an adjacent locality presented in Geotrack Report #861 reveals three major cooling episodes, beginning at some time in the following intervals:
40 to 30 Ma 11 to 10 Ma 7 to 2 Ma
2: Estimates of the magnitude of the maximum or peak paleotemperatures and the timing of cooling from that value, derived from AFTA data in individual samples, are summarised in Table i.
3: AFTA data obtained for this report are considered to be of excellent quality, and the associated thermal history interpretations are regarded as highly reliable.
Apatite (U-Th)/He data
4: Results from apatite (U-Th)/He dating in seven samples are generally consistent with the thermal history solutions derived from the AFTA data, with the exception of one sample (GC883-8) in which all (U-Th)/He ages are anomalously old. In two samples the (U-Th)/He data allow some refinement of the AFTA solutions (as summarised in Table i).
VR data
5: VR data confirm that the sedimentary section intersected in each borehole has been much hotter in the past. Maximum paleotemperatures derived from the measured VR values in each borehole are highly consistent with those indicated by AFTA in four of the boreholes. The exception is the Ataa-1 borehole, in which results from AFTA and VR are less consistent. Given the uncertainty regarding data from Ataa-1, results from this borehole have not been included in the regional synthesis.
Mechanisms of heating and cooling
6: The variation of Eocene-Oligocene paleotemperatures with depth suggests that this episode is best explained in terms of heating due to a combination of deeper burial and elevated basal heat flow, with the section intersected in the Gant-1 borehole having undergone a slightly greater degree of heating (maybe deeper burial and/or higher heat

iii
Geotrack Report #883: Thermal History reconstruction in five boreholes, Onshore West Greenland
flow) compared to other locations. Cooling was dominated by decrease in heat flow and surface temperature, possibly combined with exhumation, though this is not certain.
7: Similar aspects of the Late Miocene paleotemperatures suggest that this episode reflects heating due primarily to deeper burial and cooling due to exhumation, with a heat flow regime similar to that of the present-day or perhaps only slightly higher.
8: Latest Miocene to Pliocene paleotemperatures also suggest heating due to depth of burial and cooling due to exhumation.
Paleogeothermal gradients and removed section
9: The ranges of paleogeothermal gradients consistent with paleotemperature constraints in each of the three paleo-thermal episodes identified from AFTA, (U-Th)/He dating and VR data, for a variety of combinations of data, are summarised in Table ii. Eocene-Oligocene paleogeothermal gradients were clearly much higher than at the present-day, while values in the two later events were generally lower.
10: Estimates of the amounts of removed section required to explain the Eocene-Oligocene paleotemperatures in each episode, for various data combinations, are summarised in Table iii, while Tables iv and v provide similar summaries for the Late Miocene and Latest Miocene to Pliocene episodes.
Regional geological synthesis
11: The results of this study emphasise the essential uniformity of paleo-thermal effects across the region. While differential effects may be present across the region, these are evidently of minor importance (maybe equivalent to offsets of around one hundred to a few hundred metres of eroded section) compared to the magnitude of effects revealed by AFTA, (U-Th)/He and VR data (on a kilometre scale).
12: Latest Miocene to Pliocene paleotemperatures can be explained solely in terms of depth of samples in relation to the Neogene erosion surface, with a thermal gradient around 30°C, which is the assumed present-day value. Similarly, cooling from these paleotemperatures can be understood purely in terms of incision of the modern-day relief across the region.
13: Late Miocene paleotemperatures may be explained either by paleogeothermal gradients around 30°C/km (close to the assumed present-day value) and burial by between 350 and 950 metres above the present-day level of the regional Neogene erosion surface, or slightly higher paleogeothermal gradients and lesser amounts of missing section (Table iv).

iv
Geotrack Report #883: Thermal History reconstruction in five boreholes, Onshore West Greenland
14: Eocene-Oligocene paleotemperatures clearly require elevated paleogeothermal gradients in the range 45 to 50°C/km, with between 1350 and 1650 metres of additional section (above the present-day sea level, and/or the ground surface at Gro-3, Gane-1 and Umiivik-1).
Thermal and Burial history reconstruction
15: While the origin of the Eocene-Oligocene and latest Miocene to Pliocene episodes appears well-constrained, the Late Miocene episode can be explained in a variety of ways, within the constraints imposed by the data (Tables i – v). With this in mind, three possible thermal and burial/exhumation history reconstructions are illustrated in Figures ii through vii, which satisfy all of the paleotemperature constraints derived from AFTA, (U-Th)/He and VR data in this report. Results from the Gro-3 borehole are used as a basis of this discussion, as they typify results from across the region, which are characterised by a high degree of uniformity. Integration with geological constraints, in the form of regional unconformities and depositional patterns, etc, is required in order to place further constraints on the most viable interpretation of the results of this study.

v
Geotrack Report #883: Thermal History reconstruction in five boreholes, Onshore West Greenland
Table i: Paleotemperature analysis summary: AFTA data in sixteen samples from five boreholes, Onshore West Greenland (Geotrack Report #883)
Eocene Miocene L. Miocene-Recent
Sample No. GC883-
Depth
(m)
Strati- graphic
age
(Ma)
Present temp-
erature*1
(°C)
Maximumpaleo-
temper-ature*2 (°C)
Onset of
cooling *2
(Ma)
Maximumpaleo-
temper-ature*2 (°C)
Onset of
cooling *2
(Ma)
Maximum paleo-
temper-ature*2 (°C)
Onset of
cooling *2
(Ma) UMIIVIK-1
1 278-291 89-87 9 100-110 45-15 40-80 20-0 1*6 65-75 10 ≤60 4 2 1027-1030 112-90 31 >120*3 100-30*3 ≤105 20-0 GANE-1
3 510-515 63-62 15 100-115 48-22 70-85 13-2 GANT-1
4 146-153 76-65 4 95-105 40-16 45-70 11-0 4*6 60-70 10 ≤60 4 5 749-758 81-76 23 >115 49-28 85-95 17-4 ATAA-1
6 17-26 85-80 0 70-100 >20 <75 35-0 16 17-26 85-80 0 65-100 post-dep <75 32-0 7 555 85-80 16 60-95 >10 <80 60-0 17 555 85-80 16 65-90 post-dep <75 40-0 GRO-3
8 750-780 70-65 23 >105 44-21 30-80 27-0 9 1000-1020 74-70 30 115-140 51-24 50-105 27-0 9*6 75-105 10 ≤75 4 10 1705-1715 112-89 51 160-180*4 >25 125-135 22-7 65-120 7-0 11 2105-2115 112-89 63 >120 20-10 <120 10-0 12 2370-2415 112-89 72 >120 16-8 <120 8-0 13 2760-2780 112-89 83 >115 15-8 <125 8-0 14 2965-2980 112-89 89 >115 10-2 OUTCROP*7
GC861-13 95-65 0 85-95 50-25 30-60 20-0
combined timing estimates (Ma)*5:
40-30
11-10
7-2
*1 Present temperature estimates based on an assumed surface temperature of 0°C and a present-day thermal gradient of 30°C/km.
*2 Thermal history interpretation of AFTA data is based on assumed heating and cooling rates of 1°C/Ma and 10°C/Ma, respectively (see Section 2). Quoted ranges for paleotemperature and onset of cooling correspond to ±95% confidence limits. Where quoted maximum paleotemperatures represent a lower limit (e.g. <120°C), the times quoted for the onset of cooling refer in these samples to the time at which the sample cooled through the quoted paleotemperature.
*3 While AFTA data in sample GC883-2 would allow a paleotemperature >100°C any time prior to 15 Ma, a maximum paleotemperature of 140°C at this depth suggested by the trend of VR data is only allowed earlier than 30 Ma.
*4 The maximum paleotemperature of 160 to 180°C quoted for sample GC883-10 is derived from VR data, while AFTA data show that cooling from these paleotemperatures must have been prior to 25 Ma.
*5 Combined timing estimates, assuming that data from all samples represent the effects of regionally synchronous cooling episodes.
*6 Refined constraints derived from integration of AFTA and (U-Th)/He data. *7 Originally presented in Geotrack Report #861.

vi
Geotrack Report #883: Thermal History reconstruction in five boreholes, Onshore West Greenland
Table ii: Paleogeothermal gradient estimates, West Greenland boreholes (Geotrack Report #883)
Paleo-thermal episode
Constraints Maximum Likelihood Estimate (°C/km)
Lower 95% confidence
limit (°C/km)
Upper 95% confidence
limit (°C/km)
Eocene-Oligocene (40 to 30 Ma)
Gro-3 Gro-3 and Gane-1 Gro-3, Gane-1, Umiivik-1 and GC861-13 Gant-1
40.5
46.0
47.5
44.5
35.0
40.0
43.5
32.5
45.5
51.5
52.0
57.0
Late Miocene (11-10 Ma)
Gro-3 All boreholes and GC861-13 (wrt sea level) All boreholes and GC861-13 (wrt erosion surface) All except Gant-1 (wrt erosion surface)
52.0*1
35.5
40.0
40.5
25.5
25.5
27.0
34.5
87.0
47.5
56.0
48.0
Latest Miocene to Pliocene (7 to 2 Ma)
Gro-3 All boreholes and GC861-13 (wrt Neogene erosion surface)
28.5*1
27.5
17.5
20.0
50.0
34.0
*1 Paleogeothermal gradients estimated from paleotemperature constraints derived from AFTA, (U-Th)/He dating and selected VR data, using methods described in Section 2.4.
*2 These maximum likelihood values are not well defined, due to the width of the paleotemperatures constraints from AFTA, but upper and lower limits are still valid.

vii
Geotrack Report #883: Thermal History reconstruction in five boreholes, Onshore West Greenland
Table iii: Removed section estimates, Eocene - Oligocene episode: West Greenland boreholes (Geotrack Report #883)
Gro-3*1 Gro-3 and
Gane-1*2 Gro-3,
Gane-1, Umiivik-1
and GC861-13*2
Gant-1*1
Maximum Likelihood estimate of removed section (metres)
2050
1600
1450
1700
Lower and upper 95% confidence limits (metres)
1650-2550
1300-1950
1300-1700
1250-2550
Removed section values corresponding to specified paleogeothermal gradients*3
10°C/km not allowed not allowed not allowed not allowed 20°C/km not allowed not allowed not allowed not allowed 30°C/km not allowed not allowed not allowed ~2750 35°C/km 2500-2700 not allowed not allowed 2300-2450 40°C/km 1950-2150 1900-2100 not allowed 1900-2100 45°C/km 1650-1750 1500-1700 1550-1650 1600-1800 50°C/km not allowed 1350-1450 1350-1450 1400-1600 60°C/km not allowed not allowed not allowed not allowed
*1 Removed section estimated with respect to the unconformity at the present-day ground surface in each well (i.e. total removed section), assuming a mean surface temperature of 20°C.
*2 “Removed section” estimated with respect to sea level – i.e. the amount of sediment above present-day sea level at the time that cooling from maximum paleotemperatures began, assuming a mean surface temperature of 20°C.
*3 From Figures 6.1, 6.2, 6.3, 6.4.
Notes:
Determination of the amount of removed section depends on the assumption that paleogeothermal gradients were linear through both the removed section and the preserved section, in each well. This assumption will not be valid if heating involved non-linear paleogeothermal gradients, which may result either because of vertical contrasts in thermal conductivity through the section, or if heating was not directly related to depth of burial but was due e.g. to hot fluid circulation. In such cases, the estimates quoted here are likely to over-estimate true amounts of removed section. The quoted values are based on an assumed paleo-surface temperature of 20°C. These can easily be converted to apply to other values, by subtracting or adding the difference in depth equivalent to the change in paleo-surface temperature, for the appropriate paleo-gradient. For example, for a paleogeothermal gradient of 50°C/km, an increase of 10°C in the paleo-surface temperature is equivalent to a reduction of 200 metres in the amount of removed section.

viii
Geotrack Report #883: Thermal History reconstruction in five boreholes, Onshore West Greenland
Table iv: Removed section estimates, Late Miocene episode: West Greenland boreholes (Geotrack Report #883)
Gro-3*1 All boreholes
and GC861-13 (wrt sea
level)*2
All boreholes and GC861-
13 (wrt erosion
surface)*3
All boreholes except
GANT-1, and GC861-13
(wrt erosion surface)*3
Maximum Likelihood estimate of removed section (metres)
-*4
1550
0
-*4
Lower and upper 95% confidence limits (metres)
0-1900
1000-2450
0-950
0-500
Removed section values corresponding to specified paleogeothermal gradients*5
20°C/km not allowed not allowed not allowed not allowed 25°C/km not allowed 2250-2700 not allowed not allowed 30°C/km 1950-2350 1650-2250 350-950 not allowed 35°C/km 1450-1800 1250-1850 0-500 350-550 40°C/km 1050-1450 1050-1550 <250 50-350 45°C/km 750-1100 950-1250 not allowed <50 50°C/km 500-900 850-1050 not allowed not allowed 60°C/km 150-450 not allowed not allowed not allowed 70°C/km <150 not allowed not allowed not allowed
*1 Removed section estimated with respect to the unconformity at the present-day ground surface in each well (i.e. total removed section), assuming a mean surface temperature of 10°C.
*2 “Removed section” estimated with respect to sea level – i.e. the amount of sediment above present-day sea level at the time that cooling from maximum paleotemperatures began, assuming a mean surface temperature of 10°C.
*3 “Removed section” estimated with respect to erosion surface– i.e. the amount of sediment above the erosion surface at the time that cooling from maximum paleotemperatures began, assuming a mean surface temperature of 10°C.
*4 Maximum likelihood values are not well defined, but upper and lower limits are still valid. *5 From Figures 6.5, 6.6, 6.7, 6.8.
Notes:
Determination of the amount of removed section depends on the assumption that paleogeothermal gradients were linear through both the removed section and the preserved section, in each well. This assumption will not be valid if heating involved non-linear paleogeothermal gradients, which may result either because of vertical contrasts in thermal conductivity through the section, or if heating was not directly related to depth of burial but was due e.g. to hot fluid circulation. In such cases, the estimates quoted here are likely to over-estimate true amounts of removed section.
The quoted values are based on an assumed paleo-surface temperature of 10°C. These can easily be converted to apply to other values, by subtracting or adding the difference in depth equivalent to the change in paleo-surface temperature, for the appropriate paleo-gradient. For example, for a paleogeothermal gradient of 40°C/km, an increase of 10°C in the paleo-surface temperature is equivalent to a reduction of 250 metres in the amount of removed section.
ix
Geotrack Report #883: Thermal History reconstruction in five boreholes, Onshore West Greenland
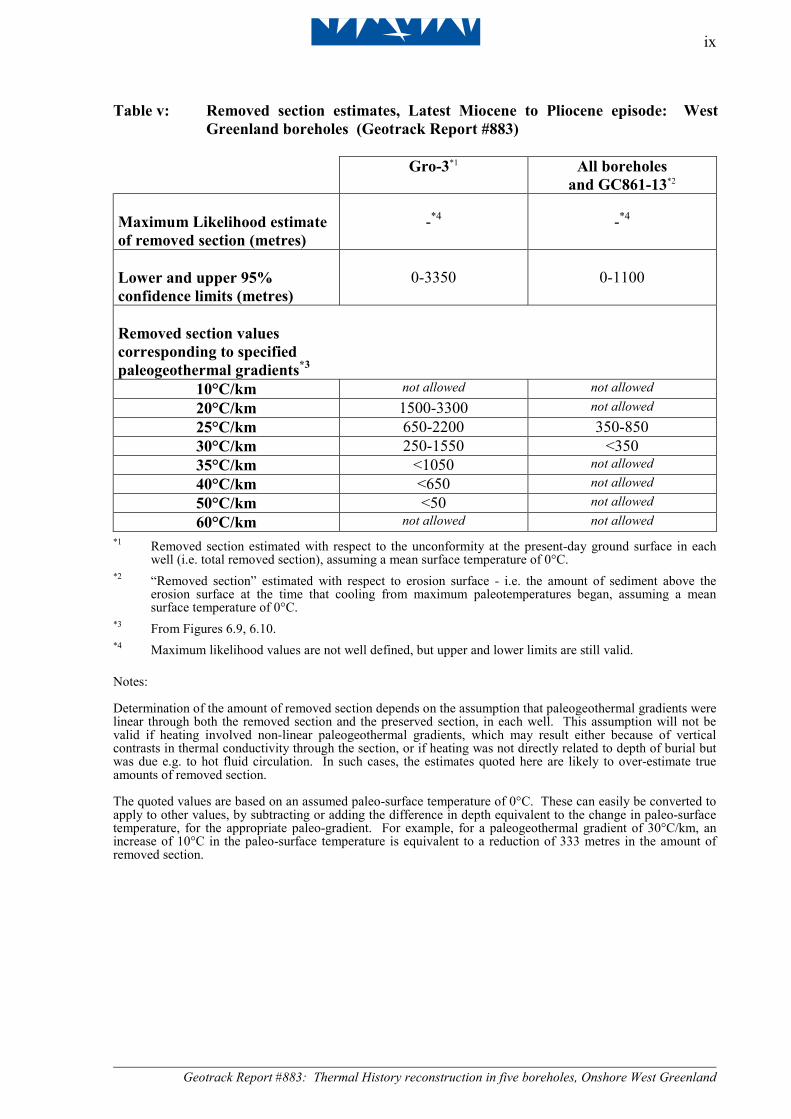
Table v: Removed section estimates, Latest Miocene to Pliocene episode: West Greenland boreholes (Geotrack Report #883)
Gro-3*1 All boreholes
and GC861-13*2 Maximum Likelihood estimate of removed section (metres)
-*4
-*4
Lower and upper 95% confidence limits (metres)
0-3350
0-1100
Removed section values corresponding to specified paleogeothermal gradients*3
10°C/km not allowed not allowed 20°C/km 1500-3300 not allowed 25°C/km 650-2200 350-850 30°C/km 250-1550 <350 35°C/km <1050 not allowed 40°C/km <650 not allowed 50°C/km <50 not allowed 60°C/km not allowed not allowed
*1 Removed section estimated with respect to the unconformity at the present-day ground surface in each well (i.e. total removed section), assuming a mean surface temperature of 0°C.
*2 “Removed section” estimated with respect to erosion surface - i.e. the amount of sediment above the erosion surface at the time that cooling from maximum paleotemperatures began, assuming a mean surface temperature of 0°C.
*3 From Figures 6.9, 6.10. *4 Maximum likelihood values are not well defined, but upper and lower limits are still valid.
Notes:
Determination of the amount of removed section depends on the assumption that paleogeothermal gradients were linear through both the removed section and the preserved section, in each well. This assumption will not be valid if heating involved non-linear paleogeothermal gradients, which may result either because of vertical contrasts in thermal conductivity through the section, or if heating was not directly related to depth of burial but was due e.g. to hot fluid circulation. In such cases, the estimates quoted here are likely to over-estimate true amounts of removed section. The quoted values are based on an assumed paleo-surface temperature of 0°C. These can easily be converted to apply to other values, by subtracting or adding the difference in depth equivalent to the change in paleo-surface temperature, for the appropriate paleo-gradient. For example, for a paleogeothermal gradient of 30°C/km, an increase of 10°C in the paleo-surface temperature is equivalent to a reduction of 333 metres in the amount of removed section.

x
Geotrack Report #883: Thermal History reconstruction in five boreholes, Onshore West Greenland
Time (Ma)
GC883-1GC883-2
GC883-3
GC883-4GC883-5
GC883-6
GC883-7
UMIIVIK-1
GANE-1
GANT-1
ATAA-1
0102030405060708090100110120130140150
GC883-8GC883-9GC883-10GC883-11GC883-12GC883-13GC883-14
GRO-3
GC883-16
GC883-17
GC861-13
7-2 MaLate Miocene
-Pliocene
11-10 MaLate Miocene
OUTCROP
40-30 MaEocene-
OligoceneStratigraphic age range
Figure i: Timing constraints derived from AFTA data in individual samples from boreholes in the Nuussuaq Basin, West Greenland analysed for this report together with outcrop sample GC861-13 from a nearby location, originally presented in Geotrack Report #861, Timing constraints are summarised in Table i, while Table 3.3 provides more details of the thermal history interpretation of data from individual samples. Synthesis of results from all samples, assuming that the data represent the effects of synchronous cooling across the region, suggests at least three discrete cooling episodes, as shown by the vertical columns. Pale colours (samples GC883-6, -7, -16 and –17 from the Ataa-1 borehole and sample GC883-2 from the Umiivik-1 borehole) represent episodes that are allowed but not definitely required by the data. Results in individual samples are attributed to specific events by the corresponding colour, as illustrated.

xi
Geotrack Report #883: Thermal History reconstruction in five boreholes, Onshore West Greenland
PMOEPK
Gro-3
VolcanicDanianMaastrichtianCampanian
Albian-Coniacian
020406080100120
0
25
50
75
100
125
150
175
200
225
250
Possible reconstruction - 1
Time (Ma)
GC883-11GC883-10
GC883-14
GC883-8
GC883-12
GC883-9
GC883-13
Figure ii: Schematic illustration of a possible thermal history interpretation of AFTA, (U-Th)/He and VR data from the Gro-3 borehole, Nuussuaq basin, West Greenland, considered as typifying results from the region. Coloured lines illustrate the histories of individual AFTA samples. Combining timing constraints from AFTA data in individual samples from this and other boreholes analysed for this report suggests three discrete paleo-thermal episodes, involving cooling beginning in the intervals 40 - 30 Ma, 11 - 10 Ma and 7 - 2 Ma, as indicated by the vertical grey bars (also see Figure i).
This reconstruction is based on continuous deposition through Eocene-Oligocene
times. The 40-30 Ma paleo-thermal maximum is attributed to burial by 1700 metres of additional section, combined with an elevated basal heat flow (paleogeothermal gradient ~50% higher than present-day value). Cooling beginning at 40-30 Ma is due to a combination of decreasing heat flow and a drop in surface temperature, with no discrete phase of exhumation in this interval. The Late Miocene episode (11-10 Ma) is due to further decrease in both heat flow and surface temperature, combined with exhumation involving erosional removal of a total of 1800 metres of section, 1000 metres of which is removed in the latest Miocene-Pliocene event (beginning between 7 and 2 Ma), representing incision of the modern-day relief below the regional Neogene erosion surface.
xii
Geotrack Report #883: Thermal History reconstruction in five boreholes, Onshore West Greenland
GC883-11GC883-10GC883-14
Gro-3
PMOEPK
020406080100120
0
25
50
75
100
125
150
175
200
225
250
Possible reconstruction - 1
Time (Ma)
GC883-8GC883-12
PMOEPK
020406080100120
0
25
50
75
100
125
150
175
200
225
250
Time (Ma)
PMOEPK
020406080100120
0
25
50
75
100
125
150
175
200
225
250
Time (Ma)
PMOEPK
020406080100120
0
25
50
75
100
125
150
175
200
225
250
Time (Ma)
GC883-9GC883-13
He
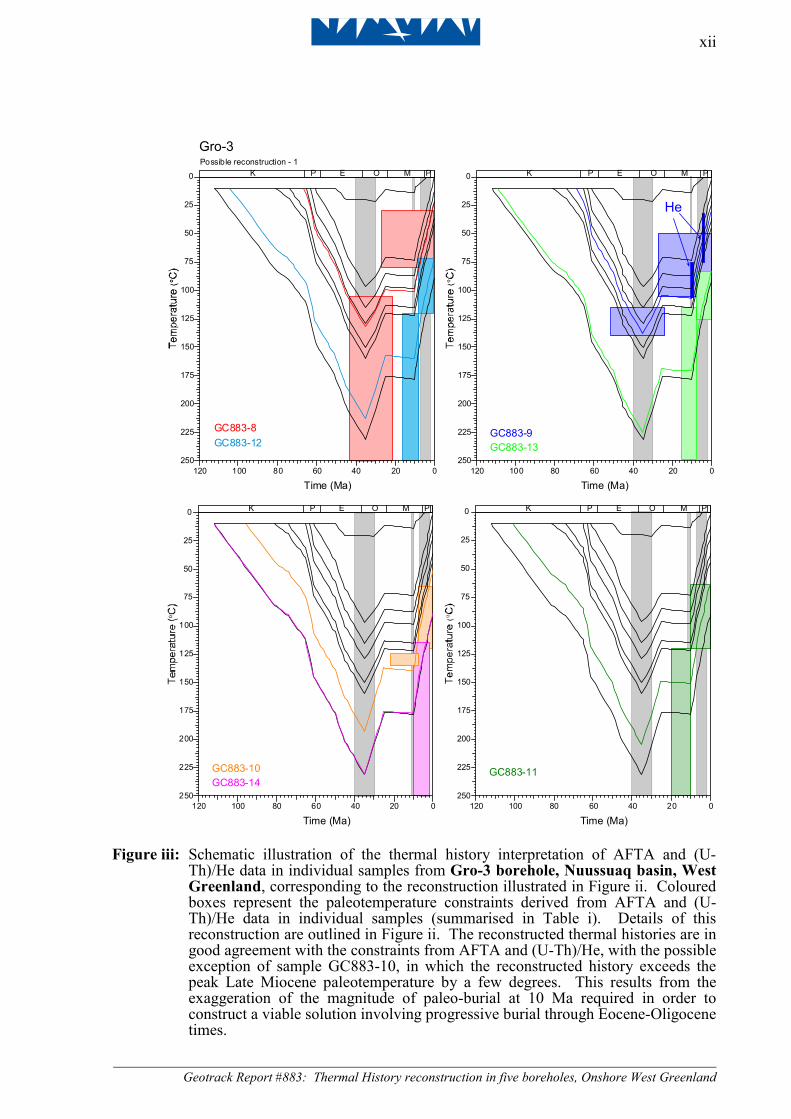
Figure iii: Schematic illustration of the thermal history interpretation of AFTA and (U-Th)/He data in individual samples from Gro-3 borehole, Nuussuaq basin, West Greenland, corresponding to the reconstruction illustrated in Figure ii. Coloured boxes represent the paleotemperature constraints derived from AFTA and (U-Th)/He data in individual samples (summarised in Table i). Details of this reconstruction are outlined in Figure ii. The reconstructed thermal histories are in good agreement with the constraints from AFTA and (U-Th)/He, with the possible exception of sample GC883-10, in which the reconstructed history exceeds the peak Late Miocene paleotemperature by a few degrees. This results from the exaggeration of the magnitude of paleo-burial at 10 Ma required in order to construct a viable solution involving progressive burial through Eocene-Oligocene times.

xiii
Geotrack Report #883: Thermal History reconstruction in five boreholes, Onshore West Greenland
PMOEPK
Gro-3
VolcanicDanianMaastrichtianCampanian
Albian-Coniacian
020406080100120
0
25
50
75
100
125
150
175
200
225
250
Possible reconstruction - 2
Time (Ma)
GC883-11GC883-10
GC883-14
GC883-8
GC883-12
GC883-9
GC883-13
Figure iv: Schematic illustration an alternative thermal history interpretation of AFTA, (U-Th)/He and VR data from the Gro-3 borehole, Nuussuaq basin, West Greenland. Details as in Figure ii.
In this reconstruction, the 40-30 Ma paleo-thermal maximum is again attributed to
burial by 1700 metres of additional section, combined with an elevated basal heat flow, as in Figures ii and iii. Cooling beginning at 40-30 Ma is due to a combination of decreasing heat flow and a drop in surface temperature combined with a discrete phase of exhumation in this interval in which 900 metres of section were removed (but as noted in the text, this amount is not well constrained). The Late Miocene episode (11-10 Ma) is again due to further decrease in both heat flow and surface temperature, combined with exhumation involving erosional removal of a total of 1650 metres of section, 1000 metres of which is removed in the latest Miocene-Pliocene event (beginning between 7 and 2 Ma), representing incision of the modern-day relief below the regional Neogene erosion surface.

xiv
Geotrack Report #883: Thermal History reconstruction in five boreholes, Onshore West Greenland
GC883-11GC883-10GC883-14
Gro-3
PMOEPK
020406080100120
0
25
50
75
100
125
150
175
200
225
250
Possible reconstruction - 2
Time (Ma)
GC883-8GC883-12
PMOEPK
020406080100120
0
25
50
75
100
125
150
175
200
225
250
Time (Ma)
PMOEPK
020406080100120
0
25
50
75
100
125
150
175
200
225
250
Time (Ma)
PMOEPK
020406080100120
0
25
50
75
100
125
150
175
200
225
250
Time (Ma)
GC883-9GC883-13
He
Figure v: Schematic illustration of the thermal history interpretation of AFTA and (U-Th)/He data in individual samples from Gro-3 borehole, Nuussuaq basin, West Greenland, corresponding to the reconstruction illustrated in Figure iv. Coloured boxes represent the paleotemperature constraints derived from AFTA and (U-Th)/He data in individual samples (summarised in Table i). Details of this reconstruction are outlined in Figure iv. The reconstructed thermal histories are in good agreement with the constraints from AFTA and (U-Th)/He, and this type of scenario is considered most realistic for the region.

xv
Geotrack Report #883: Thermal History reconstruction in five boreholes, Onshore West Greenland
PMOEPK
Gro-3
VolcanicDanianMaastrichtianCampanian
Albian-Coniacian
020406080100120
0
25
50
75
100
125
150
175
200
225
250
Possible reconstruction - 3
Time (Ma)
GC883-11GC883-10
GC883-14
GC883-8
GC883-12
GC883-9
GC883-13
Figure vi: Schematic illustration of a third alternative thermal history interpretation of AFTA, (U-Th)/He and VR data from the Gro-3 borehole, Nuussuaq basin, West Greenland. Details as in Figure ii.
In this reconstruction, The 40-30 Ma paleo-thermal maximum is again attributed
to burial by 1700 metres of additional section, combined with an elevated basal heat flow, as in Figures ii and iv. Cooling beginning at 40-30 Ma is due to a combination of decreasing heat flow and a drop in surface temperature combined with a discrete phase of exhumation in this interval in which 900 metres of section were removed (but as noted in the text, this amount is not well constrained). The Late Miocene episode (11-10 Ma) is due to a combination of further decrease in heat flow and exhumation involving erosional removal of a total of 2150 metres of section, 1000 metres of which is removed in the latest Miocene-Pliocene event (beginning between 7 and 2 Ma), representing incision of the modern-day relief below the regional Neogene erosion surface. Thus, this interpretation maximises the amount of Late Miocene burial.

xvi
Geotrack Report #883: Thermal History reconstruction in five boreholes, Onshore West Greenland
GC883-11GC883-10GC883-14
Gro-3
PMOEPK
020406080100120
0
25
50
75
100
125
150
175
200
225
250
Possible reconstruction - 3
Time (Ma)
GC883-8GC883-12
PMOEPK
020406080100120
0
25
50
75
100
125
150
175
200
225
250
Time (Ma)
PMOEPK
020406080100120
0
25
50
75
100
125
150
175
200
225
250
Time (Ma)
PMOEPK
020406080100120
0
25
50
75
100
125
150
175
200
225
250
Time (Ma)
GC883-9GC883-13
He
Figure vii: Schematic illustration of the thermal history interpretation of AFTA and (U-Th)/He data in individual samples from Gro-3 borehole, Nuussuaq basin, West Greenland, corresponding to the reconstruction illustrated in Figure vi. Coloured boxes represent the paleotemperature constraints derived from AFTA and (U-Th)/He data in individual samples (summarised in Table i). Details of this reconstruction are outlined in Figure vi. The reconstructed thermal histories are in good agreement with the constraints from AFTA and (U-Th)/He, but this type of scenario is considered less realistic than that illustrated in Figures iv and v.

1
Geotrack Report #883: Thermal History reconstruction in five boreholes, Onshore West Greenland
1. Introduction
1.1 Aims and objectives
This report describes a thermal history study of samples from the Ataa-1, Gane-1, Gant-1, Gro-3, and Umiivik-1 boreholes, onshore West Greenland supplied by GEUS, Copenhagen. The study is based on new Apatite Fission Track Analysis (AFTA®) and apatite (U-Th)/He dating analyses of core and cuttings samples from sedimentary rocks of Cretaceous to Paleocene age, together with vitrinite reflectance data provided by GEUS. This report represents an extension of earlier studies of samples from the same region, presented in Geotrack Reports #850, 858 and 861. Sample locations are shown together with the regional geology in Figure 1.1.
AFTA® and apatite (U-Th)/He dating have been used to identify, characterise and quantify any episodes of heating and cooling which have affected the samples. This information has then been combined with vitrinite reflectance data provided by GEUS to provide a thermal history framework for the sedimentary section intersected in each borehole. Specific objectives were to define the magnitude and timing of possible paleo-thermal events which may have affected the section intersected in each borehole, to determine likely mechanisms of heating and cooling, and to constrain amounts of section removed as a result of uplift and erosion, in order to constrain the history of Cenozoic exhumation.
Overall, sixteen samples from the five boreholes listed above were processed using AFTA, as summarised in Table A.1 (Appendix A). Duplicates of each AFTA sample originally supplied from the Ataa-1 borehole were analysed, in order to eliminate possible confusion regarding the origin of the original samples. A seventeenth sample, GC883-15, thought to be from the Kuugannguaq-1 borehole, was also originally provided, but it was subsequently discovered that this sample had been taken from another well and that sample has been excluded from this report.
Apatite (U-Th)/He dating analyses are also presented in this report from seven of the AFTA samples (apatites from sample GC883-15 were also analysed but these results are not included here due to the confusion over the origin of the core sample). For the (U-Th)/He analyses, most of the AFTA sample intervals were resampled to obtain additional material, due to the relatively small amount of apatite obtained from the original AFTA samples (though sufficient apatites were obtained for AFTA). Sample GC883-3, in which apatites for (U-Th)/He analyses were taken from the original AFTA sample, is the only exception to this. The (U-Th)/He age
2
Geotrack Report #883: Thermal History reconstruction in five boreholes, Onshore West Greenland
determinations were carried out at CSIRO, Division of Petroleum Geosciences, Sydney, under the auspices of Dr. Peter Crowhurst.
1.2 Report structure
The main conclusions of this report are provided in the Executive Summary. The thermal history interpretation of AFTA data in each sample is summarised in Table i. Figure i summarises the timing constraints derived from AFTA in individual samples, and illustrates the synthesis of this information to define the timing of three regionally synchronous cooling events which can explain all of the results. Figures ii to vii provide schematic illustrations of three possible thermal history interpretation of AFTA, (U-Th)/He and VR data from the Gro-3 borehole (taken as illustrative of the regional history), including illustration of how the AFTA interpretations have been refined on the basis of the (U-Th)/He dating results. Constraints on paleogeothermal gradients and amounts of removed section are summarised in Tables ii, iii, iv and v.
Introductory aspects of the report are dealt with in Section 1, including comments on data quality. Section 2 briefly explains the principles of interpretation of AFTA (also see Appendix C) and VR data, use of the resulting paleotemperatures to determine paleogeothermal gradients, and how this information can be used (with some caveats) to estimate amounts of eroded section. Background information on the apatite (U-Th)/He dating technique is also provided in Section 2 (also see Appendix E). Section 3 presents a detailed discussion of the thermal history interpretation of the AFTA results from each borehole. In Section 4, the apatite (U-Th)/He dating results are presented and discussed within the context of the thermal history framework derived from the AFTA results. In Section 5 the thermal history interpretation of VR data from each borehole is discussed, and this is then integrated with information from AFTA and (U-Th)/He. Insights into mechanisms of heating and cooling, from the nature of paleotemperature - depth profiles characterising individual paleo-thermal episodes, are also discussed in Section 5. Section 6 discusses how the paleotemperature constraints derived from AFTA, (U-Th)/He and VR data can be used to constrain paleogeothermal gradients and amounts of removed section. Finally, Section 7 presents detailed thermal and burial history reconstructions, based on information presented in preceding sections.
Supporting information and data are provided in five Appendices (A, B, C, D and E). Appendix A deals with sample details, supporting geological data and apatite

3
Geotrack Report #883: Thermal History reconstruction in five boreholes, Onshore West Greenland
compositional measurements (Cl contents), with details of all AFTA samples summarised in Table A.1 (Appendix A). This Table also contains information on the yields and quality of detrital apatite obtained after mineral separation. Sample preparation and analytical procedures for AFTA are described in Appendix B, followed by the presentation of all AFTA data, including raw track counts, fission track ages and the chlorine contents of dated grains. Basic AFTA data are summarised in Tables B.1 and B.2 (Appendix B), and are broken down into discrete compositional groups in Table B.3. Appendix C outlines the principles employed in interpreting the AFTA data in terms of thermal history. Appendix D provides some information on the benefits of integrating information from vitrinite reflectance measurements with AFTA data (although no VR data are available for this report). Appendix E summarises technical aspects of the apatite (U-Th)/He dating technique, and its application as a thermal history tool in sedimentary basins, as well as providing a list of the samples analysed and full details of the analytical results in Tables E.1, E.2 and E.3.
1.3 Data quality
AFTA data
Due to the excellent yields of apatite obtained from all but two of the sixteen AFTA samples, as summarised in Table A.1 (Appendix A), the AFTA data obtained for this report are considered to be of excellent quality. Fission track ages were determined in 20 grains or more in fourteen samples, with 100 or more confined track lengths measured in four samples and between 10 and 70 lengths in seven more samples. Smaller number of ages and lengths were measured in the remaining samples, but in general, all samples provided data of sufficient quality to allow reliable interpretations. Quality of the etched surfaces of the apatites analysed for this report was also generally very high. For these reasons, the AFTA results and interpretations presented in this report are regarded as highly reliable.
(U-Th)/He age data
The (U-Th)/He dating technique was applied to five single grains of apatite from each of the seven samples to which this technique was applied, except for sample GC883-9, in which only four ages were measured. Most samples yielded apparently reliable results from the majority of grains, although in some samples the scatter in values exceeds that allowed by analytical errors alone, and the interpretation of these

4
Geotrack Report #883: Thermal History reconstruction in five boreholes, Onshore West Greenland
data is less reliable. These aspects of the results are discussed in greater detail in Section 4.
VR data
Vitrinite reflectance data were provided by GEUS with no indication of data quality, and these data have been interpreted at face value. In general, comparison of these data with the AFTA results presented here suggest that the values are reliable.
1.4 Apatite Compositions
The annealing kinetics of fission tracks in apatite are affected by chemical composition, specifically the Cl content, as explained in more detail in Appendix C. For this study, chlorine compositions were determined for all individual apatite grains analysed for this study (i.e. all grains in which fission track ages were determined and/or lengths were measured). Knowledge of chlorine contents is essential in interpreting AFTA data, and provides both improved accuracy and precision in establishing the time and magnitude of thermal events.
The measured ranges of chlorine contents of dated grains and/or grains used for confined track length measurements are shown in histogram format in the Fission Track Age Data Sheet at the end of Appendix B. Table B.3 (Appendix B) contains single grain fission track age and track length data collected into discrete compositional groups, on the basis of the chlorine contents of the grains from which the data were derived. In addition, for each sample a plot of single grain age versus weight % chlorine is shown in the Fission Track Age Data Sheet (Appendix B), which also lists the chlorine contents of individual age grains.

5
Geotrack Report #883: Thermal History reconstruction in five boreholes, Onshore West Greenland
Nuussuaq
72°
71°
72°
51°53°
71°
70°
69°
55°W 51°W
SvartenhukHalvø
Inland Ice
Uummannaq
Vaigat
Disko
Disko BugtIlulissatQeqertarsuaq
(Godhavn)
Hareøen Gro-3
Kuugannguaq-1
SampleGC851-13
Gant- 1
Gane-1
UbekendtEjland
Ataa-1
Umiivik-1
50 km
Greenland
Palaeogene basalts
Maastrichtian–Paleocenesediments
Albian–Campaniansediments
Precambrian basement
Extensional fault
Fault with lateral oralternating displacements
Deep well
and seepageIntensive oil staining
Nuu
ssua
q Ba
sin
Figure 1.1: Location map, showing locations of boreholes from which samples have been analysed for this report, with respect to regional geology (sample GC861-13 was analysed for the previous study described in Geotrack Report #861).
6
Geotrack Report #883: Thermal History reconstruction in five boreholes, Onshore West Greenland
2. Interpretation strategy
2.1 Thermal history interpretation of AFTA data
Basic principles
Interpretation of AFTA data in this report begins by assessing whether the fission track age and track length data in each sample could have been produced if the sample has never been hotter than its present temperature at any time since deposition. To this end, we consider a "Default Thermal History" for each sample, which forms the basis of interpretation. Default Thermal Histories throughout a well are derived from the stratigraphy of the preserved sedimentary section, combined with constant values for paleogeothermal gradient and paleo-surface temperature which are adopted from present-day values. For outcrop samples, the Default Thermal Histories simply represent long-term residence at the prevailing surface temperature.
Using this history, AFTA parameters are predicted for each sample. If the measured data show a greater degree of fission track annealing (in terms of either fission track age reduction or track length reduction) than expected on the basis of this history, the sample must have been hotter at some time in the past. In this case, the AFTA data are analysed to provide estimates of the magnitude of the maximum paleotemperature in that sample, and the timing of cooling from the thermal maximum.
Because of the possible presence of tracks inherited from sediment source terrains, it is possible that track length data might show definite evidence that the sample has been hotter in the past (since deposition) while fission track ages are still greater than predicted from the Default Thermal History (which only refers to tracks formed after deposition). Similarly in samples in which all or most fission tracks were totally annealed in a paleo-thermal episode, and which have subsequently been cooled and then reburied, fission track age data might show clear evidence of exposure to higher temperatures in the past while track length data may be dominated by the present-day thermal regime and will not directly reveal the paleo-thermal effects. In circumstances such as these, evidence from either track length or fission track age data alone is sufficient to establish that a sample has been hotter in the past.
As AFTA data provide no information on the approach to a thermal maximum, they cannot independently constrain the heating rate and a value must therefore be assumed in order to interpret the data. The resulting paleotemperature estimates are
7
Geotrack Report #883: Thermal History reconstruction in five boreholes, Onshore West Greenland
therefore conditional on this assumed value. AFTA data do provide some control on the history after cooling from maximum paleotemperatures, through the lengths of tracks formed during this period.
Wherever possible, data from each sample are interpreted in terms of two episodes of heating and cooling, using assumed heating and cooling rates during each episode, with the maximum paleotemperature being reached during the earlier episode. The timing of the onset of cooling and the peak paleotemperatures during the two episodes are varied systematically, and by comparing predicted parameters with measured data, the range of conditions giving predictions which are compatible with the data can be defined. Resolution of one additional episode of heating and cooling after the onset of cooling from maximum paleotemperature is usually straightforward from a typical AFTA data set, provided that peak paleotemperatures in the two episodes were separated by ~30°C or more and the timing of each cooling episode differ sufficiently. In some cases the data may be explained by a single episode of heating and cooling, in which case fixed heating and cooling rates are assumed and the range of values of maximum paleotemperature and the time of cooling defined as before. Two events closely spaced in time may give the illusion of a single event, particularly where samples yield data of lesser quality, while two event scenarios may represent more complex histories involving multiple heating and cooling episodes, in which case the resulting interpretation may represent the two most dominant events or alternatively may represent simply an approximation to the overall history.
If AFTA data show a lower degree of fission track annealing (age and/or length reduction) than expected on the basis of the Default Thermal History, this either suggests present temperatures may be overestimated or temperatures have increased very recently. In such cases, the data may allow a more realistic estimate of the present temperature, or an estimate of the time over which temperatures have increased.
AFTA data are predicted using a multi-compositional kinetic model for fission track annealing in apatite developed by Geotrack, described in more detail in Appendix C.
Specific to this report
For all samples analysed for this report, chlorine content has been determined in every apatite grain analysed (i.e., for both fission track age and track length measurement), as explained in more detail in Appendix A. For rigorous thermal

8
Geotrack Report #883: Thermal History reconstruction in five boreholes, Onshore West Greenland
history interpretation the age and length data have been grouped into 0.1 wt% Cl divisions (see Table B.3, Appendix B).
In this report, AFTA data in all samples have been interpreted using heating rates of 1°C/Ma and cooling rates of 10°C/Ma. These values are assumed arbitrarily, and all paleotemperature estimates are conditional on the assumed rates. For the kinetics characterising both AFTA and VR, increasing or decreasing heating rates by an order of magnitude is equivalent to raising or lowering the required maximum paleotemperature by about 10°C.
2.2 Thermal history interpretation of VR data
Basic principles
Interpretation of VR data follows similar principles to those used in interpreting the AFTA data (Section 2.1). If a measured VR value is higher than the value predicted from the Default Thermal History (making due allowance for analytical uncertainty), the sample must have been hotter at some time in the past. In this case, VR data provide an independent estimate of maximum paleotemperature, which can be calculated using an assumed heating rate and timing information provided from AFTA data, if available (otherwise, assumed). Cooling rates do not significantly affect VR values, which are dominated by the maximum paleotemperature provided that cooling occurs immediately after reaching the thermal maximum. If both AFTA and VR data are available from the same sample or well, then identical heating and cooling rates must be used to obtain consistent paleotemperature estimates.
If a measured VR value is lower than expected on the basis of the Default Thermal History, either present temperatures may have been overestimated or temperatures have increased very recently. In such cases, the measured VR value may allow an estimate of the true present-day temperature. Alternatively the measured VR value may underestimate the true maturity for some other reason, e.g., suppression of reflectance in certain organic macerals, misidentification of true "in-situ" vitrinite, presence of caved material etc. Comparison of AFTA and VR data usually allows such factors to be identified, and where applicable they are discussed in the relevant section of text.
Vitrinite reflectance values (specifically Romax values) are predicted using the distributed activation energy model describing the evolution of VR with temperature and time developed by Burnham and Sweeney (1989) (see also Sweeney and

9
Geotrack Report #883: Thermal History reconstruction in five boreholes, Onshore West Greenland
Burnham, 1990). Values of VR less than 0.32% and greater than 4% cannot be assigned to a specific maximum paleotemperature with confidence, and such values are given a maximum limit of 50°C and a minimum limit of 250°C, respectively, appropriate to the heating and cooling rates assumed in this study (see below).
Further discussion of the methodology employed in interpreting VR data are given in Appendix D, which also briefly discusses the benefits of integrating AFTA and VR data.
Specific to this report
For this report, VR data in all samples have been interpreted using heating and cooling rates of 1 and 10°C/Ma (respectively), for consistency with interpretation of the AFTA data, as specified in Section 2.1. Maximum paleotemperatures determined for the VR samples are attributed to one of the paleo-thermal episodes identified by AFTA on the basis of comparison of the VR-derived maximum paleotemperature with observed paleo-heating of a similar style in adjacent AFTA samples.
2.3 Comparison of paleotemperature estimates from AFTA and VR
Maximum paleotemperatures derived from AFTA and VR (Romax) using the strategies outlined above are usually highly consistent. Estimates of maximum paleotemperature from AFTA (Table i) are often quoted in terms of a range of paleotemperatures, as the data can often be explained by a variety of scenarios. Paleotemperature estimates from VR (Table i) are usually quoted to the nearest degree Celsius, as the value which predicts the exact measured reflectance. This is not meant to imply VR data can be used to estimate paleotemperatures to this degree of precision. VR data from individual samples typically show a scatter equivalent to a range of between ±5 and ±10°C. Estimates from a series of samples are normally used to define a paleotemperature profile in samples from a well, or a regional trend in paleotemperatures from outcrop samples.
2.4 Estimates of paleogeothermal gradients and mechanisms of heating and cooling
Basic principles
A series of paleotemperature estimates from AFTA and/or VR over a range of depths can be used to reconstruct a paleotemperature profile through the preserved section.

10
Geotrack Report #883: Thermal History reconstruction in five boreholes, Onshore West Greenland
The slope of this profile defines the paleogeothermal gradient. As explained by Bray et al. (1992), and as illustrated in Figure 2.1, the shape of the paleotemperature profile and the magnitude of the paleogeothermal gradient provides unique insights into the origin and nature of the heating and cooling episodes expressed in the observed paleotemperatures.
Linear paleotemperature profiles with paleogeothermal gradients close to the present-day geothermal gradient provide strong evidence that heating was caused by greater depth of burial with no significant increase in basal heat flow, implying in turn that cooling was due to uplift and erosion. Paleogeothermal gradients significantly higher than the present-day geothermal gradient suggest that heating was due, at least in part, to increased basal heat flow, while a component of deeper burial may also be important as discussed in the next section. Paleogeothermal gradients significantly lower than the present-day geothermal gradient suggest that a simple conductive model is inappropriate, and more complex mechanisms must be sought for the observed heating. One common cause of low paleogeothermal gradients is transport of hot fluids shallow in the section. However the presence of large thicknesses of sediment with uniform lithology dominated by high thermal conductivities can produce similar paleotemperature profiles and each case has to be considered individually.
A paleotemperature profile can only be characterised by a single value of paleogeo-thermal gradient when the profile is linear. Departures from linearity may occur where strong contrasts in thermal conductivities occur within the section, or where hot fluid movement or intrusive bodies have produced localised heating effects. In such cases a single value of paleogeothermal gradient cannot be calculated, and different values (possibly negative) may apply through different parts of the section. However it is important to recognise that the validity of the paleotemperatures determined from AFTA and/or VR are independent of these considerations, and can still be used to control possible thermal history models.
Estimation of paleogeothermal gradients in this report
Paleogeothermal gradients for this report have been estimated from paleotemperature estimates over a range of elevations, using the methods (outlined in terms of sample depth) in Appendix C. These methods provide a best estimate of the gradient (“maximum likelihood value”) and upper and lower 95% confidence limits on this estimate (analogous to ±2σ limits). The “goodness of fit” is displayed in the form of a log-likelihood profile, which is expected to show good quadratic behaviour for a dataset which agrees with a linear profile. This analysis depends on the assumption

11
Geotrack Report #883: Thermal History reconstruction in five boreholes, Onshore West Greenland
that the paleogeothermal gradient through the preserved section is linear. Visual inspection is usually sufficient to confirm or reject this assumption.
2.5 Determination of removed section
Basic principles
Subject to a number of important assumptions, extrapolation of a linear paleotemperature profile to a paleo-surface temperature allows estimation of the amount of eroded section represented by an unconformity, as explained in more detail in Section C.9 (Appendix C).
Specifically, this analysis assumes:
• The paleotemperature profile through the preserved section is linear
• The paleogeothermal gradient through the preserved section can be extrapolated linearly through the missing section.
• The paleo-surface temperature is known.
• The heating rate used to estimate the paleotemperatures defining the paleogeothermal gradient is correct
It is important to realise that any method of determining the amount of eroded section based on thermal methods is subject to these and/or additional assumptions. For example methods based on heat-flow modelling must assume values of thermal conductivities in the eroded section, which can never be known with confidence. Such models also require some initial assumption of the amount of eroded section to allow for the effect of compaction on thermal conductivity. Methods based on geothermal gradients, as used in this study, are unaffected by this consideration, and can therefore provide independent estimates of the amount of eroded section. But these estimates are always subject to the assumptions set out above, and should be considered with this in mind.
The analysis used to estimate paleogeothermal gradients is easily extended to provide maximum likelihood values of eroded section for an assumed paleo-surface temperature, together with ±95% confidence limits. These parameters are quoted for each well in which the paleotemperature profile suggests that heating may have been due, at least in part, to deeper burial.

12
Geotrack Report #883: Thermal History reconstruction in five boreholes, Onshore West Greenland
Estimates of paleogeothermal gradient and eroded section derived from fitting linear profiles to paleotemperature data as a function of depth are highly correlated, since the profile is constrained to pass through the main body of the data. Thus, higher paleo-gradients within the allowed range correspond to lower amounts of section removed, while lower paleo-gradients correspond to higher amounts of removed section. In plots of paleogeothermal gradient against removed section, paired values of each parameter which are consistent with the paleotemperature data can be defined, thus allowing the range of allowed values at various levels of statistical significance to be contoured. In general, the greater the depth interval over which paleotemperature constraints are available, the tighter the resulting constraints on both the paleogeothermal gradient and the amount of removed section.
However, it is emphasised that reconstructed burial histories produced in this way do not produce unique solutions, and alternative interpretations are always possible. For instance, where the eroded section was dominated by units with high thermal conductivities the paleogeothermal gradient through the missing section may have been much higher than in the preserved section, and extrapolation of a linear gradient will lead to overestimation of the eroded section.
Specific to this report
For the boreholes analysed in this report, estimates of eroded section are conditional on:
• Heating rates of 1°C/Ma and cooling rates of 10°C/Ma in each episode, and
• The assumed value of paleo-surface temperature,
as well as the other assumptions outlined above.
Assumed paleo-surface temperatures are discussed in Section 5. The effects of higher paleo-surface temperatures can be simply allowed for by subtracting the depth increment corresponding to the increase in temperature, for the appropriate value of paleogeothermal gradient. For instance, if the paleogeothermal gradient was 30°C/km and the paleo-surface temperature was 10°C higher than the value assumed in this report, the estimated eroded section should be reduced by 333 metres. Different heating rates can be allowed for in similar fashion, with an order of magnitude change in heating rate equivalent to a 10°C change in paleotemperature (paleotemperatures increase for higher heating rates, and decrease for lower heating rates). For typical values, the assumed value of heating rate will not affect the shape or slope of the paleotemperature profile significantly.
13
Geotrack Report #883: Thermal History reconstruction in five boreholes, Onshore West Greenland
Multiple exhumation episodes
In the previous discussion, it is important to emphasise that estimates of removed section derived in this way represent the total amount of sediment removed since the onset of cooling (i.e. exhumation) from the maximum (or peak) paleotemperatures from which the estimates were derived. In this sense, these estimates can be thought of as representing “paleo-burial”, i.e. the amount by which the preserved section (in which the paleotemperatures were recorded) was more deeply buried, prior to the onset of the exhumation episode.
In the case of a single cooling episode, in which the additional section was fully removed prior to the onset of deposition of sediment which has been preserved to the present day, such estimates of paleo-burial are identical to the amount of removed section in that episode. In such cases, it is clear that the unconformity surface, on which the additional section was deposited, returned to the surface before the re-commencement of deposition. However, where multiple exhumation episodes occur within a relatively long interval for which no sediments are preserved, this is not necessarily true. In this case, there is no evidence to demonstrate whether the unconformity surface at the top of the now preserved section returned entirely to the surface following an initial exhumational episode (i.e. if the entire amount of additional sediment was eroded), or if only part of the additional section was eroded prior to the re-commencement of deposition (after which a later exhumation episode resulted in removal of all the additional section). This situation is summarised in Figure 2.2, in the context of an outcrop sample, although similar principles apply to well samples.
In the notional example shown in Figure 2.2, two cooling episodes are identified by AFTA (grey zones) within a time interval represented by a single unconformity. The sampled unit cooled from its maximum paleotemperature in the Early Tertiary, and subsequently cooled from a lower paleotemperature peak in the Late Tertiary. Since AFTA only records the maximum or peak paleotemperatures in each event, which provide the estimates of paleo-burial for those episodes, no information on the approach to those paleotemperatures is preserved. For this reason, although the amount of section removed in the Late Tertiary episode, E2, is well constrained, the amount of additional section deposited in that episode, D2, is not. Conversely, while the total amount of section removed since the onset of Early Tertiary cooling (i.e. the Early Tertiary paleo-burial), D1, is well constrained, the amount of section removed by erosion in the earlier exhumation episode (E1) is not well constrained. Only for the case where the unit returned to the surface (red path) before burial re-commenced, are D1 and E1 equal, and E1 is well constrained. But if sediments laid

14
Geotrack Report #883: Thermal History reconstruction in five boreholes, Onshore West Greenland
down in the mid-Tertiary are not preserved to the present-day, then no record of this return to the surface is available, and therefore the absolute magnitude of E1 is not clear. Similar considerations apply to well samples, except that the present-day depth should be substituted for the surface.
2.6 (U-Th)/He dating of apatite as a thermal history tool
Overview
Helium is produced within apatite grains as a result of alpha decay from uranium and thorium isotopes, present as impurities at ppm levels. As reviewed by Lippolt et al. (1994), this process formed the basis of the first attempts at geochronology (Rutherford, 1907a). However, it soon became clear (e.g. Rutherford, 1907b) that at least a fraction of radiogenic Helium was lost from the host crystal lattice, and with the advent of apparently more reliable methods of geochronology (e.g. K-Ar, Rb-Sr, U-Pb), interest in the Helium systematics of minerals waned.
More recently, however, the realisation that the partial loss of radiogenic products could provide quantitative information on the thermal history of mineral grains led to a resurgence of interest in this topic (e.g. Zeitler, 1987; Lippolt et al., 1994). In particular, efforts at Caltech through the 1990s led to the development of (U-Th)/He dating of apatite as a rigorous, quantitative technique (Wolf et al., 1996). Studies of the diffusion systematics of Helium in apatite (Wolf et al., 1998; Farley, 2000) also revealed the unique temperature sensitivity of the technique, with all Helium being lost over geological timescales at temperatures as low as 90°C or less, and a “closure temperature” as low as 75°C. A number of subsequent applications of the method (e.g. House et al., 1997; Warnock et al., 1997; Wolf et al., 1997) have illustrated the potential of the technique to provide useful thermochronometric information at temperatures less than 100°C. In principle, therefore, this technique provides a useful supplement to the information provided by AFTA.
Extraction of thermal history solutions
Software provided by Prof. Ken Farley of Caltech, based on the systematics presented in Farley (2000) and references therein, allows modelling of the (U-Th)/He age expected from any inputted thermal history, in grains of any specified radius. By modelling ages through a variety of different thermal history scenarios, it is possible to define the range of histories giving predictions which are consistent with measured ages.
15
Geotrack Report #883: Thermal History reconstruction in five boreholes, Onshore West Greenland
The thermal history framework provided by AFTA forms a solid basis for this procedure. By incorporating both AFTA and (U-Th)/He ages into the modelling, a more restricted range of thermal history solutions can be extracted.

16
Geotrack Report #883: Thermal History reconstruction in five boreholes, Onshore West Greenland
Temperature (°C)
DEEPER BURIAL
0.5
1.5
1.0
2.0
20 40 60 80 100 120 140 1600
Temperature (°C)
ELEVATED HEAT FLOW
20 40 60 80 100 120 140 1600
0.5
1.5
1.0
2.0
Temperature (°C)
FLUID FLOW
20 40 60 80 100 120 140 1600
0.5
1.5
1.0
2.0
Figure 2.1: The way in which paleotemperatures characterising a particular paleo-thermal episode vary with depth, or the “paleotemperature profile”, provides key information on the mechanisms of heating and cooling. See text (Section 2.4) for details.

17
Geotrack Report #883: Thermal History reconstruction in five boreholes, Onshore West Greenland
E1
E1
Time (Ma)
020406080100120
E1
EarlyTertiary:Event 1
LateTertiary:Event 2
E2
Time (Ma)020406080100120
De
pth
(m)
E2
E2
De
pth
(m)
D - D -E - E -
1 2
1 2
paleoburial related to Event 1 paleburial related to Event 2
erosion related to Event 1 erosion related to Event 2
cooling paths which satisfy AFTA/VR constraints
D1
D2
EarlyTertiary:Event 1
LateTertiary:Event 2
Figure 2.2: Where multiple exhumation episodes occur within an interval represented
by a single unconformity, it is not possible to determine the total amount of section removed during the earlier episode, only the total amount removed since the onset of cooling in that episode (see text for detailed explanation).

18
Geotrack Report #883: Thermal History reconstruction in five boreholes, Onshore West Greenland
3. Thermal history interpretation of AFTA data
3.1 Introduction
Fission track age and mean track length data in each sample are summarised in Table 3.1, where they are compared with values predicted from the respective Default Thermal Histories (Section 2.1). Mean track lengths and fission track ages in samples from each borehole are plotted against depth in Figure 3.1a (Umiivik-1), 3.1b (Gane-1), 3.1c (Gant-1), 3.1d (Ataa-1) and 3.1e (Gro-3). In each of these plots, the fission track age data are contrasted with the variation of stratigraphic age through the section. The variation of fission track age and length vs depth predicted from the Default Thermal History scenario (see Section 2.1) for each well are also shown in Figures 3.1a - 3.1e, for selected apatite chlorine contents.
3.2 Contamination in samples from the Gro-3 borehole
The fission track ages measured in samples from the Gro-3 borehole show little change in depth down to ~3000 metres (Figure 3.1e), whereas the trends predicted from the Default Thermal History scenario show that ages in the most sensitive (0.0 - 0.1 wt% Cl) compositional grouping should show increasing levels of age reduction at such depths. In addition, Figure 3.1e shows that the track lengths in these samples are longer than expected at the prevailing present-day temperatures. While both these aspects of the data could be taken as evidence that present-day temperatures have been overestimated (such that the Default Thermal History predicts a higher degree of annealing than is appropriate), other aspects of the data, discussed below, suggest that these features result from the presence of a significant component of apatites resulting from contamination of the sample material.
In most of the samples, the data are of excellent quality, and show coherent trends of fission track age vs Cl content (further details of these trends in selected samples are discussed in greater detail in Table 3.3). But in many of the samples analysed from the Gro-3 borehole, the relationships between fission track age and wt% Cl show some inconsistencies, as illustrated for samples GC883-10 and -14 in Figure 3.2. Similar effects are also seen in samples GC883-11, -12 and -13. Typically, the majority of fission track ages in individual grains from these samples are less than 50 Ma, but in each sample a group of grains give anomalously old ages around 100 Ma, while grains containing higher and lower wt% Cl give younger ages. Typically, these anomalous grains contain between 0.15 and 0.3 wt% Cl, although a smaller

19
Geotrack Report #883: Thermal History reconstruction in five boreholes, Onshore West Greenland
number have Cl contents between 0.0 and 0.6 wt% Cl (Figure 3.3). A smaller number of anomalously older ages in the range 200 to 350 Ma are also identified (Figure 3.3).
The coherent nature of the data from the grains clearly identified as anomalous on the basis of fission track age vs wt% Cl relationships, emphasised in Figure 3.3, suggests that these grains originate from some source of external contamination of the sample material. Contamination from Geotrack’s laboratory can be ruled out, because no other sample sharing the unusual Cl content distribution seen in the apatites in Figure 3.3 have been measured in the laboratory. Some sort of drilling additive seems the most likely source.
The distinctive pattern of wt% Cl distribution in the contaminant grains, combined with the coherent fission track ages and the much younger ages in the indigenous grains provides a simple and reliable basis for identifying and eliminating the contaminant grains from the analysis. Summary AFTA parameters for each sample from the Gro-3 borehole are listed in Table 3.1, and Figure 3.4 provides a comparison of the age vs depth trend for the raw fission track ages and the values are elimination of the contaminants. The corrected data show the expected increasing degree of age reduction towards TD. Unfortunately elimination of data from the contaminant grains has resulted in the elimination of most of the track length data, which are of limited usefulness in interpreting the AFTA data from the Gro-3 borehole.
The data in Figure 3.4, together with the AFTA data from the other boreholes, provides the basis for detailed thermal history interpretation of these data, as discussed in Sections 3.3 and 3.4.
3.3 General features of the AFTA data
Figure 3.5 shows the relationship between fission track age and depth below kb, for the 16 samples from five boreholes analysed for this report. The fission track age measured in outcrop sample GC861-13, analysed previously for Geotrack Report #861, is also shown. Figure 3.6 shows these same data plotted against depth below mean sea level. This does not affect the interrelationships between data from individual boreholes in most cases, as most boreholes were drilled from similar kb elevations, viz:

20
Geotrack Report #883: Thermal History reconstruction in five boreholes, Onshore West Greenland
Well or outcrop location
KB or outcrop elevation (m a msl)
Umiivik-1 7 Gane-1 116 Gant-1 385 Gro-3 22 Ataa-1 490 GC861-13 115
Only in the Gant-1 and Ataa-1 boreholes are the kb level much different to that for other boreholes, so it is only the data from this borehole that shift significantly with respect to other data between Figures 3.5 and 3.6.
In both Figures 3.5 and 3.6, results from four of the boreholes and sample GC861-13 define a consistent trend, with the fission track ages decreasing rapidly with increasing depth. Fission track ages in all samples are significantly less than the values predicted from the respective Default Thermal Histories (Table 3.1). Thus it is clear from the AFTA data that the sampled sedimentary units have been hotter in the past.
The exception to this is the Ataa-1 borehole, in which the fission track ages are much older than those in samples from the other boreholes, as emphasised in both Figures 3.5 and 3.6. Because of the large discrepancy between the initial fission track age measurements in samples GC883-6 and –7, from the Ataa-1 borehole, compared to results from the other four boreholes, additional samples (GC883-16 and –17) were taken from the Ataa-1 borehole, from the same depth intervals as the original samples. Results in samples GC883-16 and –17 are highly consistent with those from the original samples, confirming that while a common thermal history interpretation may be appropriate for the majority of samples, a different style of history may apply to the Ataa-1 borehole. These issues are discussed further in Sections 3.4 and 3.5, while detailed thermal history interpretation of the AFTA data in individual samples is summarised in Tables 3.2 and 3.3.
3.4 Evidence for elevated paleotemperatures from AFTA
Qualitative interpretation of the AFTA data, in terms of evidence that the samples may have been hotter in the past, is summarised in Table 3.2. As explained therein, the AFTA data in all samples show clear evidence of higher temperatures in the past. In all samples from the Umiivik-1, Gane-1 and Gant-1 boreholes, this evidence comes from both the fission track age and track length data, both of which show a

21
Geotrack Report #883: Thermal History reconstruction in five boreholes, Onshore West Greenland
greater degree of reduction than expected from the Default Thermal History. This is also true for the three shallower samples from the Gro-3 borehole (GC883-8, -9 and –10), while in the deeper samples from this borehole (GC883-11, 12, 13 and 14) insufficient lengths were available after elimination of contaminants and therefore evidence for higher paleotemperatures in the past comes only from the fission track age data.
In contrast, in the four samples analysed from the Ataa-1 borehole, evidence for elevated paleotemperatures comes only from the track length data. Fission track ages which are older than the depositional ages show that these samples contain a significant proportion of tracks formed in sediment source terrains. But the track length data show a greater degree of length reduction than can be explained by a combination of the respective Default Thermal History and shorter tracks inherited from the sediment source terrains, showing that the samples must have been hotter at some time after deposition.
3.5 Magnitude of paleotemperatures and timing of cooling from AFTA
Following the strategy outlined in Section 2.1, quantitative interpretation of the AFTA data is summarised in Table 3.3, which presents details of the maximum paleotemperature and the timing of cooling in a number of discrete episodes derived from the AFTA data in each sample. As explained in Section 2.1 and Appendix C, these estimates are obtained for each sample using proprietary software which compares the AFTA parameters (fission track age and track length distribution and their variation with Cl content) predicted for a range of likely thermal history scenarios with the measured values, defining the range of conditions for which predictions are consistent with the measured data within 95% confidence limits.
In most of the samples analysed for this report, the AFTA data clearly require a history involving at least two episodes of heating and cooling. Definition of two paleo-thermal episodes represents the typical level of resolution that can be achieved from AFTA (typically the earlier episode would be defined by the fission track age data and possibly the shorter track lengths while the more recent episode would be defined by the shortening of the main mode of the track length distribution).
As explained in detail in Section 5, AFTA data from sample GC883-10, when combined with VR data, clearly require a more complex history, involving three distinct episodes of heating and cooling, with the magnitude of the peak paleotemperature diminishing through time (Table 3.3). In this case, while the

22
Geotrack Report #883: Thermal History reconstruction in five boreholes, Onshore West Greenland
fission track age data clearly require cooling from a paleotemperature between 125 and 135°C, beginning some time between 22 and 7 Ma, and the track length data require subsequent cooling from between 65 and 120°C beginning between 7 and 0 Ma, the VR data from similar depths require a maximum paleotemperature in the range 160 to 180°C. Integration of this constraint with the AFTA data shows that cooling from a maximum paleotemperature of this magnitude must have begun prior to 25 Ma.
As discussed earlier, results in samples from the Ataa-1 borehole show marked differences from those in the four other boreholes. While the AFTA data from samples GC883-6, 16, -7 and –17 all clearly require higher temperatures at some time after deposition, resolution of discrete episodes is complicated by the minor degree of heating that these samples have undergone. In each of these samples, broad limits can be placed on the magnitude of paleotemperatures in two intervals after deposition, as explained in Table 3.3.
Thermal history solutions derived from the AFTA data in the sample are summarised in Table i. Figures i, ii, iii, iv and v show schematic illustrations of the thermal history interpretation of AFTA data from selected samples from this report, also incorporating constraints from VR data and apatite (U-Th)/He dating results presented in Sections 4 and 5.
3.6 Identification of paleo-thermal episodes
Estimates of the timing of discrete cooling episodes in individual samples from Table 3.3 are compared in Figure 3.7, in which timing constraints in individual samples are attributed to specific events by colour. Timing constraints representing an episode which is allowed by the AFTA data in a particular sample, while not being definitely required, are shown with lightened shading for the respective event. Figure 3.7 also includes results from sample GC861-13, originally presented in Geotrack Report #861.
Synthesis of the timing constraints for individual cooling episodes identified from AFTA in each sample, based on comparing the overlap of timing constraints from individual samples as illustrated in Figure 3.7, suggests three dominant episodes of cooling are required to explain all of the data, beginning in the following intervals:
Eocene: 40 to 30 Ma
Late Miocene: 11 to 10 Ma

23
Geotrack Report #883: Thermal History reconstruction in five boreholes, Onshore West Greenland
latest Miocene to Pliocene 7 to 2 Ma
These intervals are illustrated by the vertical coloured bands in Figure 3.7. Note that these intervals represent the times at which cooling began, and we do not suggest that cooling was restricted to these intervals.
Figure 3.7 illustrates the generally high level of consistency of the timing constraints derived from individual samples, particularly in terms of the Eocene episode, suggesting a similar overall style of thermal history across the entire region. The latest Miocene to Pliocene episode is well resolved only in the deeper samples from the Gro-3 borehole (GC883-11, -12, -13 and -14), in which the Late Miocene episode is also resolved. In all other samples, the more recent cooling episode defined by the AFTA data overlaps the timings of both the Late Miocene and latest Miocene to Pliocene episodes, and it seems most likely that the inferred single episode in these samples actually represents the unresolved effects of both these episodes.
On the basis of the consistency of the interpretations of results from the deeper samples from Gro-3, plus the geographical proximity of the boreholes, we regard an interpretation in terms of a similar overall style of history in all these boreholes as most likely. On this basis, in subsequent Sections of this report we proceed to develop a regional thermal history model involving the three discrete cooling episodes listed above.

24
Geotrack Report #883: Thermal History reconstruction in five boreholes, Onshore West Greenland
Table 3.1: Summary of apatite fission track data and default history predictions in sixteen samples from five boreholes, Onshore West Greenland (Geotrack Report #883)
Sample Depth Present Stratigraphic Mean Predicted Fission Predicted number (rkb) temperature*1 age*2 track mean track fission length track length*3 age track age*3 (m) (°C) (Ma) (µm) (µm) (Ma) (Ma) Umiivik-1 GC883-1 285 9 89-87 11.72 ± 0.30 14.9 55.9 ± 9.6 90 GC883-2 1029 31 112-90 8.80 ± 0.43 14.1 20.2 ± 8.5 100 Gane-1 GC883-3 513 15 63-62 12.15 ± 0.23 14.7 35.1 ± 3.5 62 Gant-1 GC883-4 150 4 76-65 11.56 ± 0.23 15.1 66.4 ± 10.0 67 GC883-5 754 23 81-76 11.77 ± 0.35 14.5 31.2 ± 2.9 79 Ataa-1 GC883-6 22 0 85-80 11.96 ± 0.20 15.1 182.1 ± 30.4 82 GC883-16 22 0 85-80 12.03 ± 0.18 15.1 232.2 ± 13.8 82 GC883-7 555 16 85-80 12.12 ± 0.18 14.7 306.2 ± 22.0 84 GC883-17 555 16 85-80 12.23 ± 0.13 14.7 224.1 ± 31.7 84 Gro-3 GC883-8 765 23 70-65 13.40 ± 0.25 14.5 33.7 ± 4.5 65 GC883-9 1010 30 74-70 12.10 ± 0.51 14.3 34.3 ± 7.2 68 GC883-10 1710 51 112-89 12.05 ± 0.50 13.5 29.0 ± 8.9 82 GC883-11 2110 63 112-89 12.65 ± 0.90 12.9 28.0 ± 10.4 82 GC883-12 2393 72 112-89 11.38 ± 0.46 11.7 27.2 ± 14.1 80 GC883-13 2770 83 112-89 13.39 ± 0.32 10.6 21.5 ± 6.0 69 GC883-14 2973 89 112-89 12.86 ± 0.41 9.9 28.6 ± 8.5 49 Gro-3 minus contaminant grains GC883-8 765 23 70-65 13.40 ± 0.25 14.5 30.2 ± 4.2 65 GC883-9 1010 30 74-70 12.56 ± 0.46 14.3 28.6 ± 2.8 68 GC883-10 1710 51 112-89 10.84 ± 0.74 13.4 10.2 ± 2.8 81 GC883-11 2110 63 112-89 12.63 ± 2.07 12.7 11.4 ± 3.7 82 GC883-12 2393 72 112-89 12.76 12.2 8.0 ± 2.8 81 GC883-13 2770 83 112-89 11.00 11.3 5.2 ± 2.0 67 GC883-14 2973 89 112-89 11.98 ± 0.75 10.0 1.8 ± 0.9 45 *1 See Appendix A for discussion of present temperature data. *2 Values predicted from the Default Thermal History (Section 2.1); i.e. assuming that each sample is now at its
maximum temperature during the period specified under “Stratigraphic age”. Calculations refer to apatites within the measured compositional range for each sample, as discussed in Appendix A.
Note: All depths quoted are TVD with respect to KB.
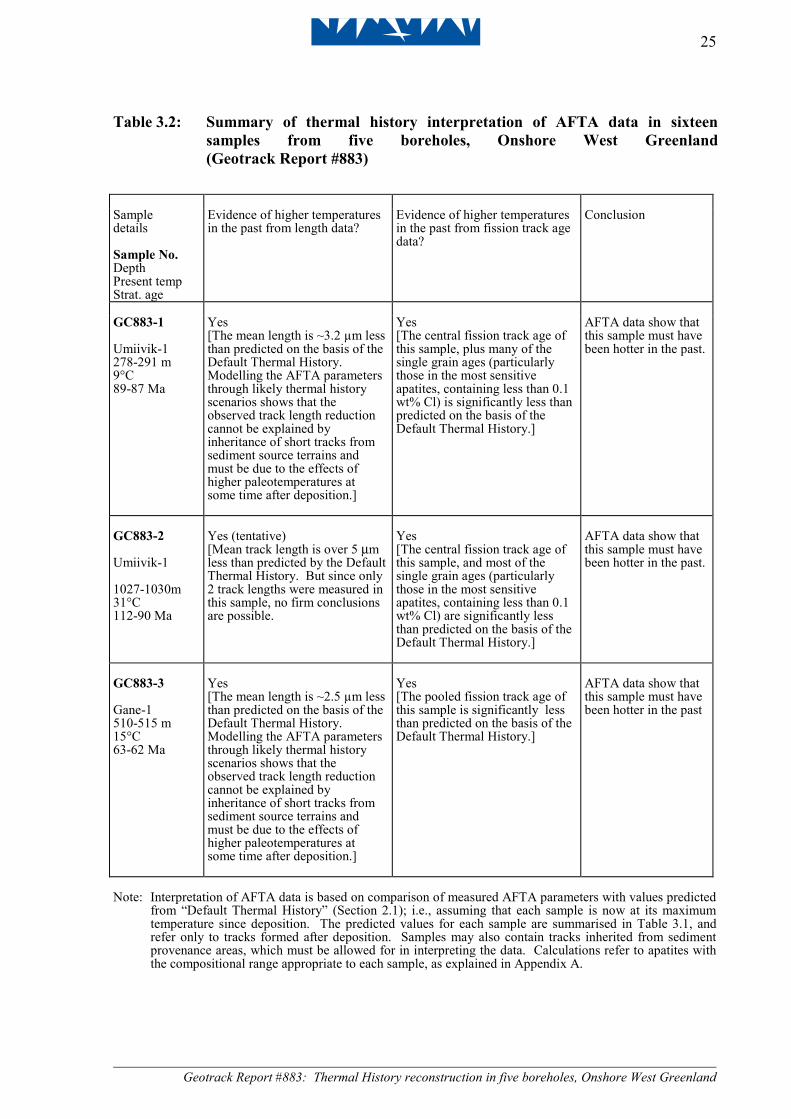
25
Geotrack Report #883: Thermal History reconstruction in five boreholes, Onshore West Greenland
Table 3.2: Summary of thermal history interpretation of AFTA data in sixteen samples from five boreholes, Onshore West Greenland (Geotrack Report #883)
Sample details Sample No. Depth Present temp Strat. age
Evidence of higher temperatures in the past from length data?
Evidence of higher temperatures in the past from fission track age data?
Conclusion
GC883-1 Umiivik-1 278-291 m 9°C 89-87 Ma
Yes [The mean length is ~3.2 µm less than predicted on the basis of the Default Thermal History. Modelling the AFTA parameters through likely thermal history scenarios shows that the observed track length reduction cannot be explained by inheritance of short tracks from sediment source terrains and must be due to the effects of higher paleotemperatures at some time after deposition.]
Yes [The central fission track age of this sample, plus many of the single grain ages (particularly those in the most sensitive apatites, containing less than 0.1 wt% Cl) is significantly less than predicted on the basis of the Default Thermal History.]
AFTA data show that this sample must have been hotter in the past.
GC883-2 Umiivik-1 1027-1030m 31°C 112-90 Ma
Yes (tentative) [Mean track length is over 5 µm less than predicted by the Default Thermal History. But since only 2 track lengths were measured in this sample, no firm conclusions are possible.
Yes [The central fission track age of this sample, and most of the single grain ages (particularly those in the most sensitive apatites, containing less than 0.1 wt% Cl) are significantly less than predicted on the basis of the Default Thermal History.]
AFTA data show that this sample must have been hotter in the past.
GC883-3 Gane-1 510-515 m 15°C 63-62 Ma
Yes [The mean length is ~2.5 µm less than predicted on the basis of the Default Thermal History. Modelling the AFTA parameters through likely thermal history scenarios shows that the observed track length reduction cannot be explained by inheritance of short tracks from sediment source terrains and must be due to the effects of higher paleotemperatures at some time after deposition.]
Yes [The pooled fission track age of this sample is significantly less than predicted on the basis of the Default Thermal History.]
AFTA data show that this sample must have been hotter in the past
Note: Interpretation of AFTA data is based on comparison of measured AFTA parameters with values predicted
from “Default Thermal History” (Section 2.1); i.e., assuming that each sample is now at its maximum temperature since deposition. The predicted values for each sample are summarised in Table 3.1, and refer only to tracks formed after deposition. Samples may also contain tracks inherited from sediment provenance areas, which must be allowed for in interpreting the data. Calculations refer to apatites with the compositional range appropriate to each sample, as explained in Appendix A.

26
Geotrack Report #883: Thermal History reconstruction in five boreholes, Onshore West Greenland
Table 3.2: Continued (Geotrack Report #883) Sample details Sample No. Depth Present temp Strat. age
Evidence of higher temperatures in the past from length data?
Evidence of higher temperatures in the past from fission track age data?
Conclusion
GC883-4 Gant-1 146-153 m 4°C 76-65 Ma
Yes [The mean length is ~3.5 µm less than predicted on the basis of the Default Thermal History. Modelling the AFTA parameters through likely thermal history scenarios shows that the observed track length reduction cannot be explained by inheritance of short tracks from sediment source terrains and must be due to the effects of higher paleotemperatures at some time after deposition.]
Yes [Although the central fission track age of this sample is very close to the value predicted on the basis of the Default Thermal History, the pooled age of those apatites containing less than 0.1 wt% Cl is significantly less than the value predicted on that basis.]
AFTA data show that this sample must have been hotter in the past
GC883-5 Gant-1 749-758 m 23°C 81-76 Ma
Yes [The mean length is ~2.7 µm less than predicted on the basis of the Default Thermal History. Modelling the AFTA parameters through likely thermal history scenarios shows that the observed track length reduction cannot be explained by inheritance of short tracks from sediment source terrains and must be due to the effects of higher paleotemperatures at some time after deposition.]
Yes [The pooled fission track age of this sample is significantly less than predicted on the basis of the Default Thermal History.]
AFTA data show that this sample must have been hotter in the past
GC883-6 Ataa-1 17-26 m 0°C 85-80 Ma
Yes [The mean length is ~3.1 µm less than predicted on the basis of the Default Thermal History. Modelling the AFTA parameters through likely thermal history scenarios shows that the observed track length reduction cannot be explained by inheritance of short tracks from sediment source terrains and must be due to the effects of higher paleotemperatures at some time after deposition.]
No [Central fission track age and almost all single grain ages are significantly older than the values predicted from the Default Thermal History. No single grain ages are younger than predicted on this basis.]
Track length data in this sample show tentative evidence that the sample has been hotter in the past.
Note: Interpretation of AFTA data is based on comparison of measured AFTA parameters with values predicted
from “Default Thermal History” (Section 2.1); i.e., assuming that each sample is now at its maximum temperature since deposition. The predicted values for each sample are summarised in Table 3.1, and refer only to tracks formed after deposition. Samples may also contain tracks inherited from sediment provenance areas, which must be allowed for in interpreting the data. Calculations refer to apatites with the compositional range appropriate to each sample, as explained in Appendix A.

27
Geotrack Report #883: Thermal History reconstruction in five boreholes, Onshore West Greenland
Table 3.2: Continued (Geotrack Report #883) Sample details Sample No. Depth Present temp Strat. age
Evidence of higher temperatures in the past from length data?
Evidence of higher temperatures in the past from fission track age data?
Conclusion
GC883-16 Ataa-1 17-26 m 0°C 85-80 Ma
Yes [The mean length is ~3.1 µm less than predicted on the basis of the Default Thermal History. Modelling the AFTA parameters through likely thermal history scenarios shows that the observed track length reduction cannot be explained by inheritance of short tracks from sediment source terrains and must be due to the effects of higher paleotemperatures at some time after deposition.]
No [Pooled fission track age is significantly older than predicted from the Default Thermal History.]
Track length data in this sample show tentative evidence that the sample has been hotter in the past.
GC883-7 Ataa-1 555 m 16°C 85-80 Ma
Yes [The mean length is ~2.6 µm less than predicted on the basis of the Default Thermal History. Modelling the AFTA parameters through likely thermal history scenarios shows that the observed track length reduction cannot be explained by inheritance of short tracks from sediment source terrains and must be due to the effects of higher paleotemperatures at some time after deposition.]
No [Pooled fission track age is significantly older than predicted from the Default Thermal History.]
Track length data in this sample show tentative evidence that the sample has been hotter in the past.
GC883-17 Ataa-1 555 m 16°C 85-80 Ma
Yes [The mean length is ~2.5 µm less than predicted on the basis of the Default Thermal History. Modelling the AFTA parameters through likely thermal history scenarios shows that the observed track length reduction cannot be explained by inheritance of short tracks from sediment source terrains and must be due to the effects of higher paleotemperatures at some time after deposition.]
No [Central fission track age and almost all single grain ages are significantly older than the values predicted from the Default Thermal History. No single grain ages are younger than predicted on this basis.]
Track length data in this sample show tentative evidence that the sample has been hotter in the past.
Note: Interpretation of AFTA data is based on comparison of measured AFTA parameters with values predicted
from “Default Thermal History” (Section 2.1); i.e., assuming that each sample is now at its maximum temperature since deposition. The predicted values for each sample are summarised in Table 3.1, and refer only to tracks formed after deposition. Samples may also contain tracks inherited from sediment provenance areas, which must be allowed for in interpreting the data. Calculations refer to apatites with the compositional range appropriate to each sample, as explained in Appendix A.

28
Geotrack Report #883: Thermal History reconstruction in five boreholes, Onshore West Greenland
Table 3.2: Continued (Geotrack Report #883) Sample details Sample No. Depth Present temp Strat. age
Evidence of higher temperatures in the past from length data?
Evidence of higher temperatures in the past from fission track age data?
Conclusion
GC883-8 Gro-3 750-780 m 23°C 70-65 Ma
Yes [The mean length is ~1.1 µm less than predicted on the basis of the Default Thermal History. Modelling the AFTA parameters through likely thermal history scenarios shows that the observed track length reduction cannot be explained by inheritance of short tracks from sediment source terrains and must be due to the effects of higher paleotemperatures at some time after deposition.]
Yes [The central fission track age of this sample, and most of the single grain ages, are significantly less than predicted on the basis of the Default Thermal History.]
AFTA data show that this sample must have been hotter in the past.
GC883-9 Gro-3 1000-1020 m 30°C 74-70 Ma
Yes [The mean length is ~2.2 µm less than predicted on the basis of the Default Thermal History. Modelling the AFTA parameters through likely thermal history scenarios shows that the observed track length reduction cannot be explained by inheritance of short tracks from sediment source terrains and must be due to the effects of higher paleotemperatures at some time after deposition.]
Yes [The central fission track age of this sample, and almost all of the single grain ages, are significantly less than predicted on the basis of the Default Thermal History.]
AFTA data show that this sample must have been hotter in the past.
GC883-10 Gro-3 1705-1715 51°C 112-89 Ma
Yes [After eliminating suspected contaminant grains (see age column, right), the mean track length is ~2.6 µm less than predicted by the Default Thermal History. Modelling the AFTA parameters through likely thermal history scenarios shows that the observed track length reduction cannot be explained by inheritance of short tracks from sediment source terrains and must be due to the effects of higher paleotemperatures at some time after deposition.]
Yes [The measured fission track ages from this sample show considerable scatter, with little or no apparent correlation with Cl content. In particular, ages in grains with Cl contents close to 0.0 wt%, and around 0.2 wt% Cl, appear to be anomalously old. Similarly anomalous grains have been identified in other samples from the Gro-3 borehole, and are regarded as contaminants. After eliminating these grains, the central age is significantly less than predicted on the basis of the Default Thermal History.]
After eliminating data from suspected contaminant grains, AFTA data show that this sample must have been hotter in the past
Note: Interpretation of AFTA data is based on comparison of measured AFTA parameters with values predicted
from “Default Thermal History” (Section 2.1); i.e., assuming that each sample is now at its maximum temperature since deposition. The predicted values for each sample are summarised in Table 3.1, and refer only to tracks formed after deposition. Samples may also contain tracks inherited from sediment provenance areas, which must be allowed for in interpreting the data. Calculations refer to apatites with the compositional range appropriate to each sample, as explained in Appendix A.

29
Geotrack Report #883: Thermal History reconstruction in five boreholes, Onshore West Greenland
Table 3.2: Continued (Geotrack Report #883) Sample details Sample No. Depth Present temp Strat. age
Evidence of higher temperatures in the past from length data?
Evidence of higher temperatures in the past from fission track age data?
Conclusion
GC883-11 Gro-3 2105-2115 m 63°C 112-89 Ma
No (limited data) [After eliminating suspected contaminant grains (see age column, right), the mean track length is very close to the value predicted by the Default Thermal History. But as only two track lengths are left after rejecting contaminants, these data provide no real constraint on the paleo-thermal history.]
Yes [The measured fission track ages from this sample show considerable scatter, with a very poor apparent correlation with Cl content. In particular, ages in two grains with Cl contents close to 0.0 wt%, and two more around 0.2 wt% Cl, appear to be anomalously old. Similarly anomalous grains have been identified in other samples from the Gro-3 borehole, and are regarded as contaminants. After eliminating these grains, the central age and most of the single grain ages are significantly less than predicted on the basis of the Default Thermal History.]
After eliminating data from suspected contaminant grains, the fission track age data show that this sample must have been hotter in the past
GC883-12 Gro-3 2370-2415 m 72°C 112-89 Ma
No (limited data) [After eliminating suspected contaminant grains (see age column, right), only one track length remains, and such limited data provide no real constraint on the paleo-thermal history.]
Yes [While most of the measured fission track ages from this sample show a coherent pattern of correlation with Cl content, ages in two grains with Cl contents less than 0.05 wt% are clearly anomalously old. Similarly anomalous grains have been identified in other samples from the Gro-3 borehole, and are regarded as contaminants. After eliminating these grains, the pooled age is significantly less than predicted on the basis of the Default Thermal History.]
After eliminating data from suspected contaminant grains, the fission track age data show that this sample must have been hotter in the past
Note: Interpretation of AFTA data is based on comparison of measured AFTA parameters with values predicted
from “Default Thermal History” (Section 2.1); i.e., assuming that each sample is now at its maximum temperature since deposition. The predicted values for each sample are summarised in Table 3.1, and refer only to tracks formed after deposition. Samples may also contain tracks inherited from sediment provenance areas, which must be allowed for in interpreting the data. Calculations refer to apatites with the compositional range appropriate to each sample, as explained in Appendix A.

30
Geotrack Report #883: Thermal History reconstruction in five boreholes, Onshore West Greenland
Table 3.2: Continued (Geotrack Report #883) Sample details Sample No. Depth Present temp Strat. age
Evidence of higher temperatures in the past from length data?
Evidence of higher temperatures in the past from fission track age data?
Conclusion
GC883-13 Gro-3 2760-2780 m 83°C 112-89 Ma
No (limited data) [After eliminating suspected contaminant grains (see age column, right), only one track length remains, and such limited data provide no real constraint on the paleo-thermal history.]
Yes [The radial plot of the fission track ages from this sample (see data summary Sheet, Appendix B) shows a distinct separation into two groups, with a significant spread of ages in grains within discrete compositional groups, particularly 0.0-0.1 wt% Cl and 0.2 to 0.3 wt% Cl. Anomalously old ages within these groups, similar to ages identified in other samples from the Gro-3 borehole, are regarded as contaminants. After eliminating these grains, the pooled age is significantly less than predicted on the basis of the Default Thermal History.]
After eliminating data from suspected contaminant grains, the fission track age data show that this sample must have been hotter in the past
GC883-14 Gro-3 2965-2980 m 89°C 112-89 Ma
No (limited data) [After eliminating suspected contaminant grains (see age column, right), only two track lengths remain, and such limited data provide no real constraint on the paleo-thermal history.]
Yes [The radial plot of the fission track ages from this sample (see data summary Sheet, Appendix B) shows a distinct separation into two groups, and the relationship between fission track age and Cl content reveals anomalously old ages in apatites containing between 0.1 and 0.3 wt% Cl, while ages in apatites with higher Cl contents are much younger. Similarly anomalous old ages have been identified in other samples from the Gro-3 well, and are regarded as contaminants. After eliminating these grains, the pooled age is significantly less than predicted on the basis of the Default Thermal History.]
After eliminating data from suspected contaminant grains, the fission track age data show that this sample must have been hotter in the past
Note: Interpretation of AFTA data is based on comparison of measured AFTA parameters with values predicted
from “Default Thermal History” (Section 2.1); i.e., assuming that each sample is now at its maximum temperature since deposition. The predicted values for each sample are summarised in Table 3.1, and refer only to tracks formed after deposition. Samples may also contain tracks inherited from sediment provenance areas, which must be allowed for in interpreting the data. Calculations refer to apatites with the compositional range appropriate to each sample, as explained in Appendix A.

31
Geotrack Report #883: Thermal History reconstruction in five boreholes, Onshore West Greenland
Table 3.3: Estimates of timing and magnitude of elevated paleotemperatures from AFTA data in sixteen samples from five boreholes, Onshore West Greenland (Geotrack Report #883)
Sample Details
Paleo-thermal constraints
Comments
Sample No. Depth Present temp Strat. age
Event Maximum paleo-
temperature (°C)
Onset Of
Cooling (Ma)
GC883-1 Umiivik-1 278-291 m 9°C 89-87 Ma
Earlier
Later
100-110
40-80
45-15
20-0
AFTA data from this sample can be explained by a scenario involving two paleo-thermal episodes, as shown (left). The earlier episode is required in order to explain the fission track age data in the most sensitive (<0.1 wt% Cl) apatites and the shorter lengths, in apatites with higher Cl contents. The more recent episode is required to explain the shortening of the main mode of the track length distribution. Fission track ages which are older than the depositional age in apatites containing between 0.1 and 0.5 wt% Cl clearly show that the earlier event represents the maximum paleotemperature event after deposition of the host sediment. High quality data (20 ages, 67 lengths) provide a very reliable interpretation. Equivalent Romax: 0.61 to 0.67%. Measured VR values between 0.60 and 0.63% from similar depths supplied by GEUS (Table D.2) are highly consistent with this range of equivalent VR values.
GC883-2 Umiivik-1 1027-1030m 31°C 112-90 Ma
Earlier
Later
>120 >110 >100
<105
100-30 100-20 100-15
20-0
Lesser quality AFTA data from this sample (10 ages, 2 lengths) provide only broad thermal history constraints, as shown (left). The lack of track length data precludes detailed resolution of discrete episodes. Equivalent Romax: No precise constraint. Measured VR values around 4% or more from similar depths, supplied by GEUS (Table D.2), suggest maximum paleotemperatures in excess of 250°C, attributed to contact heating from igneous intrusives, while the trend of VR vs depth for data from all wells (Section 3) suggests a “background” VR level around 1% at similar depths, suggesting a maximum paleotemp-erature around 140°C. The AFTA data clearly show that cooling from such paleotemperatures must have begun prior to 30 Ma.
GC883-3 Gane-1 510-515 m 15°C 63-62 Ma
Earlier
Later
100-115
70-85
48-22
13-2
AFTA data from this sample can be explained by a scenario involving two paleo-thermal episodes, as shown (left). The earlier episode is required in order to explain the fission track age reduction and the shorter lengths, while the more recent episode is required to explain the shortening of the main mode of the track length distribution. High quality data (26 ages, 67 lengths) provide a very reliable interpretation. Equivalent Romax: 0.61 to 0.69%. Measured VR values from similar depths supplied by GEUS are between 0.66 and 0.70% (Table D.2), which are consistent with the higher end of this range of equivalent VR values defined by the AFTA data.
All thermal history constraints are based on assumed heating and cooling rates of 1°C/Ma and 10°C/Ma, respectively.

32
Geotrack Report #883: Thermal History reconstruction in five boreholes, Onshore West Greenland
Table 3.3: Continued (Geotrack Report #883)
Sample Details
Paleo-thermal constraints
Comments
Sample No. Depth Present temp Strat. age
Event Maximum paleo-
temperature (°C)
Onset Of
Cooling (Ma)
GC883-4 Gant-1 146-153 m 4°C 76-65 Ma
Earlier
Later
95-105
45-70
40-16
11-0
AFTA data from this sample can be explained by a scenario involving two paleo-thermal episodes, as shown (left). The earlier episode is required in order to explain the fission track age data in the most sensitive (<0.1 wt% Cl) apatites and the shorter lengths in apatites with higher Cl contents. The more recent episode is required to explain the shortening of the main mode of the track length distribution, which is notably bimodal. Fission track ages which are older than the depositional age in apatites containing between 0.3 and 0.7 wt% Cl clearly show that the earlier event represents the maximum paleotemperature event after deposition of the host sediment. Very high quality data (21 ages, 107 lengths) provide a very reliable interpretation. Equivalent Romax: 0.57 to 0.63%. Measured VR values between 0.63 and 0.67% from similar depths supplied by GEUS (Table D.2) are just slightly higher than this range of equivalent VR values.
GC883-5 Gant-1 749-758 m 23°C 81-76 Ma
Earlier
Later
>115
85-95
49-28
17-4
AFTA data from this sample can be explained by a scenario involving two paleo-thermal episodes, as shown (left). The earlier episode is required in order to explain the fission track age data in all compositional groups, while the more recent episode is required to explain the shorter peak in the track length distribution. The distribution of track lengths is relatively broad, with the suggestion of bimodality and a very distinct longer peak. This further suggests that sufficient time has elapsed since cooling began to allow accumulation of these longer tracks, showing that cooling cannot have been very recent (as shown by the 17 to 4 Ma timing). High quality data (23 ages, 41 lengths) provide a very reliable interpretation. Equivalent Romax: >0.69%. Measured VR values between 0.74 and 0.79% from similar depths supplied by GEUS (Table D.2) are highly consistent with this range of equivalent VR values.
All thermal history constraints are based on assumed heating and cooling rates of 1°C/Ma and 10°C/Ma, respectively.

33
Geotrack Report #883: Thermal History reconstruction in five boreholes, Onshore West Greenland
Table 3.3: Continued (Geotrack Report #883) Sample Details
Paleo-thermal constraints
Comments
Sample No. Depth Present temp Strat. age
Event Maximum paleo-
temperature (°C)
Onset Of
Cooling (Ma)
GC883-6 Ataa-1 17-26 m 0°C 85-80 Ma
Earlier
Later
70-100
<75
>20
35-0
AFTA data from this sample clearly require elevated paleotemperatures at some time after deposition. However, resolution of discrete episodes of heating and cooling is complicated by the moderate degree of heating and dominance of tracks formed prior to deposition, despite very high quality data (100 track lengths and 20 single grain ages measured). The data could be explained by a scenario involving two paleo-thermal episodes, as shown (left), with a maximum paleotemperature between 70 and 100°C from which cooling began prior to 20 Ma and later cooling from a lower peak paleotemperature less than 75°C some time since 35 Ma. But the earlier episode is not definitely required by the data, which could, in principle, be explained by annealing of tracks in sediment source terrains prior to deposition of the host rock. Equivalent Romax: 0.42 to 0.61% (assuming the earlier episode did occur). Measured VR values between 0.49 and 0.53% from slightly greater depths supplied by GEUS (Table D.2) are highly consistent with this range of equivalent VR values, suggesting that the earlier event, allowed but not definitely required by the AFTA data, did indeed occur. Moreover, as these measured VR values suggest maximum paleotemperatures around 81 to 88°C, the AFTA data show that cooling from these paleotemperatures, must have begun prior to 35 Ma.
GC883-16 Ataa-1 17-26 m 0°C 85-80 Ma
Earlier
Later
65-100
<75
post-dep.
32-0
AFTA data from this sample clearly require elevated paleotemperatures at some time after deposition. However, resolution of discrete episodes of heating and cooling is complicated by the moderate degree of heating and dominance of tracks formed prior to deposition, despite very high quality data (100 track lengths and 20 single grain ages measured). The data could be explained by a scenario involving two paleo-thermal episodes, as shown (left), with a maximum paleotemperature between 65 and 100°C from which cooling began some time after deposition, followed by a later cooling episode from a peak paleotemperature less than 75°C some time since 35 Ma. But the earlier episode is not definitely required by the data, which could, in principle, be explained by annealing of tracks in sediment source terrains prior to deposition of the host rock. Equivalent Romax: 0.39 to 0.61% (assuming the earlier episode did occur). Measured VR values between 0.49 and 0.53% from slightly greater depths supplied by GEUS (Table D.2) are highly consistent with this range of equivalent VR values, suggesting that the earlier event, allowed but not definitely required by the AFTA data, did indeed occur. Moreover, as these measured VR values suggest maximum paleotemperatures around 81 to 88°C, the AFTA data show that cooling from these paleotemperatures must have begun prior to 32 Ma.
All thermal history constraints are based on assumed heating and cooling rates of 1°C/Ma and 10°C/Ma, respectively.

34
Geotrack Report #883: Thermal History reconstruction in five boreholes, Onshore West Greenland
Table 3.3: Continued (Geotrack Report #883)
Sample Details
Paleo-thermal constraints
Comments
Sample No. Depth Present temp Strat. age
Event Maximum paleo-
temperature (°C)
Onset Of
Cooling (Ma)
GC883-7 Ataa-1 555 m 16°C 85-80 Ma
Limits only
60-95 60-90 60-80
<80
>10
75-10 40-10
60-0
AFTA data from this sample are dominated by tracks formed prior to deposition, and despite very high quality data (21 single grain ages and 103 track lengths) provide only broad constraints on the post-depositional history, as shown (left). Equivalent Romax: 0.37 to 0.57% (assuming the earlier episode allowed by AFTA did occur). A measured VR value of 0.57% from the same depth supplied by GEUS (Table D.2), equivalent to a maximum paleotemperature of 94°C (Table 3.4) is consistent with the range of paleotemperatures allowed by the AFTA data only if cooling from this maximum paleotemperature began prior to 75 Ma. This is not compatible with other results from the region. Possible reasons for the mis-match between AFTA and VR data in this sample are discussed in the text.
GC883-17 Ataa-1 555 m 16°C 85-80 Ma
Limits only
65-90 65-85 65-80
<75
post-dep.
65-0 45-0
40-0
AFTA data from this sample are dominated by tracks formed prior to deposition, and despite very high quality data (20 single grain ages and 100 track lengths) provide only broad constraints on the post-depositional history, as shown (left). Equivalent Romax: 0.39 to 0.54% (assuming the earlier episode allowed by AFTA did occur). A measured VR value of 0.57% from the same depth supplied by GEUS (Table D.2), equivalent to a maximum paleotemperature of 94°C (Table 3.4) is higher than the range of paleotemperatures allowed by the AFTA data. Possible reasons for the mis-match between AFTA and VR data in this sample are discussed in the text.
GC883-8 Gro-3 750-780 m 23°C 70-65 Ma
Earlier
Later
>105
30-80
44-21
27-0
AFTA data from this sample can be explained by a scenario involving two paleo-thermal episodes, as shown (left). The earlier episode is required in order to explain the fission track age data in all compositional groups, while the more recent episode is required to explain the shortening of the main peak in the track length distribution. Because only seven track lengths were measured, this most recent episode is only broadly constrained. But high quality age data (22 ages) provide very reliable constraints on the magnitude and timing of the main cooling episode. Equivalent Romax: >0.63%. Measured VR values of 0.74 and 0.77% from slightly shallower depths supplied by GEUS (Table D.2) are highly consistent with this range of equivalent VR values.
All thermal history constraints are based on assumed heating and cooling rates of 1°C/Ma and 10°C/Ma, respectively.

35
Geotrack Report #883: Thermal History reconstruction in five boreholes, Onshore West Greenland
Table 3.3: Continued (Geotrack Report #883)
Sample Details
Paleo-thermal constraints
Comments
Sample No. Depth Present temp Strat. age
Event Maximum paleo-
temperature (°C)
Onset Of
Cooling (Ma)
GC883-9 Gro-3 1000-1020 m 30°C 74-70 Ma
Earlier
Later
115-140
50-105
51-24
27-0
AFTA data from this sample can be explained by a scenario involving two paleo-thermal episodes, as shown (left). The earlier episode is required in order to explain the fission track age data in apatites containing <0.7 wt% Cl. An older age in a single grain containing almost 1.9 wt% Cl provides an upper limit to the maximum paleotemperature. The more recent episode is required to explain the shortening of the main peak in the track length distribution. Because only sixteen track lengths were measured, this most recent episode is only broadly constrained. But high quality age data (21 ages) provide very reliable constraints on the magnitude and timing of the main cooling episode. Equivalent Romax: 0.69 to 0.96%. The trend defined by measured VR values of 0.74 and 0.77% from shallower depths and 0.98 and 1.01% from slightly greater depths supplied by GEUS (Table D.2) are consistent with this range of equivalent VR values.
GC883-10 Gro-3 1705-1715 51°C 112-89 Ma
AFTA only:
Earlier
Later
AFTA & VR:
Earlier
Mid-
Later
125-135
65-120
160 to 180
125-135
65-120
22-7
7-0
>25
22-7
7-0
After eliminating data from suspected contaminant grains, AFTA data from this sample appear to require two paleo-thermal episodes, as shown (left). The earlier episode is required in order to explain the fission track age data in apatites containing between 0.0 and 0.6 wt% Cl. Age data in two grains containing between 0.8 and 0.9 wt% Cl appear to set an upper limit to the maximum paleotemperature. The more recent episode is required to explain the shortening of the main peak in the track length distribution, although with only six track lengths measured in grains not regarded as contaminants, this episode is only broadly constrained. Equivalent Romax: 0.78 to 0.90%. Measured VR values of 1.42 and 1.61% from depths bracketing this sample supplied by GEUS (Table D.2) are much higher than this range of equivalent VR values. The AFTA data can only be reconciled with these VR data by introducing an earlier episode, in which the sample cooled from a maximum paleotemperature in the range 16 to 180°C, beginning some time prior to 25 Ma.
All thermal history constraints are based on assumed heating and cooling rates of 1°C/Ma and 10°C/Ma, respectively.

36
Geotrack Report #883: Thermal History reconstruction in five boreholes, Onshore West Greenland
Table 3.3: Continued (Geotrack Report #883)
Sample Details
Paleo-thermal constraints
Comments
Sample No. Depth Present temp Strat. age
Event Maximum paleo-
temperature (°C)
Onset Of
Cooling (Ma)
GC883-11 Gro-3 2105-2115 m 63°C 112-89 Ma
Earlier
Later
>120
<120
20-10
10-0
After eliminating data from suspected contaminant grains, AFTA data from this sample definitely require only a single paleo-thermal episode, involving cooling from a maximum paleotemperature in excess of 120°C some time between 20 and 10 Ma (left). This episode is particularly well defined by fission track age data in apatites containing between 0.0 and 0.15 wt% Cl. Due to the lack of track lengths, a more recent episode cannot be resolved. Equivalent Romax: >0.73%. Measured VR values of 1.61 and 2.24% from depths bracketing this sample supplied by GEUS (Table D.2) are consistent with this lower limit to the equivalent VR level. Age data in three grains containing between 0.6 and 1.2 wt% Cl suggest a similar feature to that noted in data from sample GC883-10, and suggest a possible earlier episode involving paleotemperatures of similar magnitude to those indicated by the VR data, but due to large errors, this evidence is not conclusive.
GC883-12 Gro-3 2370-2415 m 72°C 112-89 Ma
Earlier
Later
>120
<120
16-8
8-0
After eliminating data from suspected contaminant grains, AFTA data from this sample definitely require only a single paleo-thermal episode, involving cooling from a maximum paleotemperature in excess of 120°C some time between 16 and 8 Ma (left). This episode is very well defined by fission track age data in all apatites, containing between 0.0 and 0.5 wt% Cl. Due to the lack of track lengths, a more recent episode cannot be resolved. Equivalent Romax: >0.73%. Measured VR values of 2.24 and 2.29% from depths bracketing this sample supplied by GEUS (Table D.2) are consistent with this lower limit to the equivalent VR level, although based on data from other samples, these VR levels are interpreted as representing an earlier heating episode, evidence of which has been overprinted by the more recent episode recorded by the AFTA data from this sample.
All thermal history constraints are based on assumed heating and cooling rates of 1°C/Ma and 10°C/Ma, respectively.

37
Geotrack Report #883: Thermal History reconstruction in five boreholes, Onshore West Greenland
Table 3.3: Continued (Geotrack Report #883)
Sample Details
Paleo-thermal constraints
Comments
Sample No. Depth Present temp Strat. age
Event Maximum paleo-
temperature (°C)
Onset Of
Cooling (Ma)
GC883-13 Gro-3 2760-2780 m 83°C 112-89 Ma
Earlier
Later
>115
<125
15-8
8-0
After eliminating data from suspected contaminant grains, AFTA data from this sample definitely require only a single paleo-thermal episode, involving cooling from a maximum paleotemperature in excess of 115°C some time between 15 and 8 Ma (left). This episode is very well defined by fission track age data in all apatites, containing between 0.0 and 0.5 wt% Cl. Due to the lack of track lengths, a more recent episode cannot be resolved. Equivalent Romax: >0.69%. Measured VR values in excess of 2% from shallower depths supplied by GEUS (Table D.2) are consistent with this lower limit to the equivalent VR level, although based on data from other samples, these VR levels are interpreted as representing an earlier heating episode, evidence of which has been overprinted by the more recent episode recorded by the AFTA data from this sample.
GC883-14 Gro-3 2965-2980 m 89°C 112-89 Ma
Single
>115
10-2
After eliminating data from suspected contaminant grains, AFTA data from this sample definitely require only a single paleo-thermal episode, involving cooling from a maximum paleotemperature in excess of 115°C some time between 10 and 2 Ma (left). This episode is very well defined by fission track age data in all apatites, containing between 0.0 and 0.5 wt% Cl. Due to the lack of track lengths, a more recent episode cannot be resolved. Equivalent Romax: >0.69%. Measured VR values in excess of 2% from shallower depths supplied by GEUS (Table D.2) are consistent with this lower limit to the equivalent VR level, although based on data from other samples, these VR levels are interpreted as representing an earlier heating episode, evidence of which has been overprinted by the more recent episode recorded by the AFTA data from this sample.
All thermal history constraints are based on assumed heating and cooling rates of 1°C/Ma and 10°C/Ma, respectively.

38
Geotrack Report #883: Thermal History reconstruction in five boreholes, Onshore West Greenland
Umiivik-1
Dep
th (k
m)
Tem
pera
ture
(°C
)
Fission Track Age (Ma) Mean Length (µm)
00
11
20 100 200
10 10
20 20
30 30
E. Coniacian
L. Turonian
Albian? - Turonian
stratigraphic age
0 4 8 12 16
Figure 3.1a: AFTA parameters plotted against sample depth and present temperature for samples from Onshore West Greenland Borehole UMIIVIK-1. The variation of stratigraphic age with depth is also shown, as the solid black line in the central panel. Coloured lines show the pattern of fission track age and mean track length predicted (for apatites containing 0.0-0.1, 0.4-0.5, 0.9-1.0 and 1.5-1.6 wt% Cl) from the Default Thermal History, calculated as explained in the text.
Gane-1
Dep
th (k
m)
Tem
pera
ture
(°C
)
Fission Track Age (Ma) Mean Length (µm)
00
10 20 40 60 80 100
10 10
20 20
Basalt
hyalocl + sed
Danianstratigraphic age
0 4 8 12 16
Figure 3.1b: AFTA parameters plotted against sample depth and present temperature for samples from Onshore West Greenland Borehole GANE-1. The variation of stratigraphic age with depth is also shown, as the solid black line in the central panel. Coloured lines show the pattern of fission track age and mean track length predicted (for apatites containing 0.0-0.1, 0.4-0.5, 0.9-1.0 and 1.5-1.6 wt% Cl) from the Default Thermal History, calculated as explained in the text.
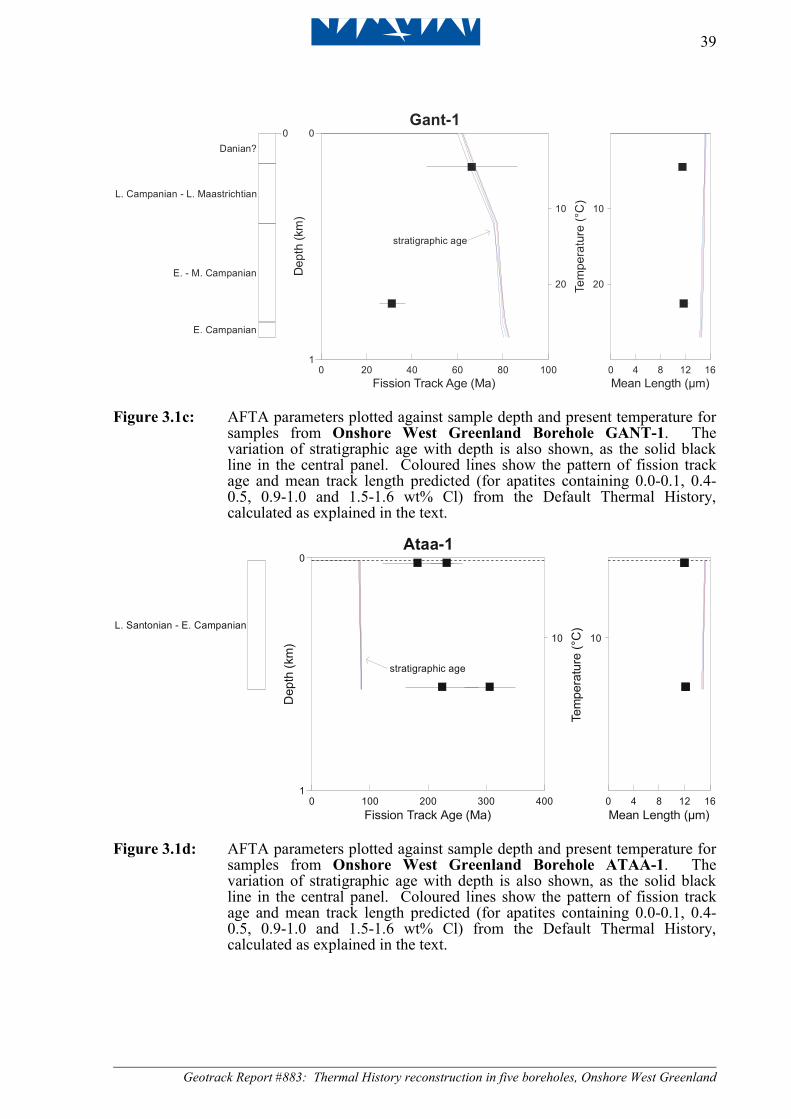
39
Geotrack Report #883: Thermal History reconstruction in five boreholes, Onshore West Greenland
Gant-1
Dep
th (k
m)
Fission Track Age (Ma) Mean Length (µm)
00
10 20 40 60 80 100
10 10
20 20
Danian?
L. Campanian - L. Maastrichtian
E. - M. Campanian
E. Campanian
stratigraphic age
0 4 8 12 16
Figure 3.1c: AFTA parameters plotted against sample depth and present temperature for samples from Onshore West Greenland Borehole GANT-1. The variation of stratigraphic age with depth is also shown, as the solid black line in the central panel. Coloured lines show the pattern of fission track age and mean track length predicted (for apatites containing 0.0-0.1, 0.4-0.5, 0.9-1.0 and 1.5-1.6 wt% Cl) from the Default Thermal History, calculated as explained in the text.
Ataa-1
Dep
th (k
m)
Tem
pera
ture
(°C
)
Fission Track Age (Ma) Mean Length (µm)
0
10 100 200 300 400
10 10L. Santonian - E. Campanian
stratigraphic age
0 4 8 12 16
Figure 3.1d: AFTA parameters plotted against sample depth and present temperature for samples from Onshore West Greenland Borehole ATAA-1. The variation of stratigraphic age with depth is also shown, as the solid black line in the central panel. Coloured lines show the pattern of fission track age and mean track length predicted (for apatites containing 0.0-0.1, 0.4-0.5, 0.9-1.0 and 1.5-1.6 wt% Cl) from the Default Thermal History, calculated as explained in the text.

40
Geotrack Report #883: Thermal History reconstruction in five boreholes, Onshore West Greenland
Gro-3
Dep
th (k
m)
Tem
pera
ture
(°C
)
Fission Track Age (Ma) Mean Length (µm)
00
11
22
30 100 200
10 10
20 20
30 30
40 40
50 50
60 60
70 70
80 80
Basalthyalocl + sed
Danian
L. Maastrichtian
E. MaastrichtianCampanian
Coniacian? - E. Campanian?
Albian? - Coniacian
stratigraphic age
0 4 8 12 16
Figure 3.1e: AFTA parameters plotted against sample depth and present temperature for samples from Onshore West Greenland Borehole GRO-3. The variation of stratigraphic age with depth is also shown, as the solid black line in the central panel. Coloured lines show the pattern of fission track age and mean track length predicted (for apatites containing 0.0-0.1, 0.4-0.5, 0.9-1.0 and 1.5-1.6 wt% Cl) from the Default Thermal History, calculated as explained in the text.

41
Geotrack Report #883: Thermal History reconstruction in five boreholes, Onshore West Greenland
a) GC883-10
b) GC883-14
Figure 3.2: Relationship between fission track ages in apatites from samples GC883-10 and GC883-14, from the GRO-3 borehole. Both samples show the presence of a population of grains giving ages around 100 Ma, which are significantly older than ages measured in apatites containing higher and lower chlorine contents. These grains are regarded as contaminants, and have been eliminated prior to extraction of detailed thermal history solutions from the AFTA data in these samples.

42
Geotrack Report #883: Thermal History reconstruction in five boreholes, Onshore West Greenland
Figure 3.3: Relationship between fission track age and chlorine content in apatite grains
identified as giving anomalously old fission track ages in samples GC883-8, -10, -11, -12, -13 and –14, from the GRO-3 borehole. These grains define a consistent population of ages around 100 Ma and most contain similar Cl contents in the range 0.15 to 0.3 wt% Cl, although isolated grains with higher and lower Cl contents also give similar ages. The consistency of data from these grains, identified in almost all samples from this borehole, suggests that they originate from external contamination of the samples at some stage. The pattern of Cl contents is very distinctive, and no samples showing a similar pattern have been recognised in recent Geotrack studies, suggesting that contamination within the laboratory can be ruled out. A drilling additive appears to be the most likely source of contamination. A smaller component of ages around 200 to 300 Ma in apatites containing less than 0.05 wt% Cl is also evident.

43
Geotrack Report #883: Thermal History reconstruction in five boreholes, Onshore West Greenland
West Greenland wells-3500
-3000
-2500
-2000
-1500
-1000
-500
00 10 20 30 40 50 60 70 80 90 100
Fission track age (Ma)
Dep
th (m
)
Original data
Editted data
Figure 3.4: Fission track ages in samples from the GRO-3 borehole, plotted against sample depth, showing both the original values as listed in Table B.1, based on all grains from each sample, and also the revised values after eliminating counts from grains identified as contaminants. Rejection of the “contaminants” results in a very different pattern of variation, and reveals the true nature of the underlying thermal history. Ages around 30 Ma in the two shallowest samples reflect the Eocene cooling episode identified from AFTA (Table 3.3 and Table i), while younger ages in samples from depths between 1500 and 2500 metres reflect the Miocene cooling episode. Note that the measured (or revised) ages are not actually equal to the time at which cooling began, because of the effect of annealing after the onset of cooling.

44
Geotrack Report #883: Thermal History reconstruction in five boreholes, Onshore West Greenland
West Greenland wells
-3500
-3000
-2500
-2000
-1500
-1000
-500
0
5000 50 100 150 200 250 300 350 400
Fission track age (Ma)
Dep
th fr
om k
b (m
)
Umivik-1
Gane-1
Gant-1
Gro-3
Ataa-1
GC861-13
West Greenland wells-3500
-3000
-2500
-2000
-1500
-1000
-500
0
5000 10 20 30 40 50 60 70 80 90 100
Fission track age (Ma)
Dep
th fr
om k
b (m
)
Umivik-1
Gane-1
Gant-1
Gro-3
Ataa-1
GC861-13
Figure 3.5: Fission track ages plotted against depth with respect to kb, in samples from
five boreholes and one outcrop location from the Nuussuaq Basin, Onshore West Greenland. (see Figure 1.1 for locations). The upper plot is shown with an expanded age scale, to show the results from the ATAA-1 borehole, which are much older than ages from the other wells. Results from the UMIIVIK-1, GANE-1, GANT-1, and GRO-3 boreholes define a very consistent pattern of variation with depth, the significance of which is discussed in the text.

45
Geotrack Report #883: Thermal History reconstruction in five boreholes, Onshore West Greenland
West Greenland wells-3500
-3000
-2500
-2000
-1500
-1000
-500
0
5000 50 100 150 200 250 300 350 400
Fission track age (Ma)
Dep
th (m
wrt
sea
leve
l)
Umivik-1
Gane-1
Gant-1
Gro-3
Ataa-1
GC861-13
West Greenland wells-3500
-3000
-2500
-2000
-1500
-1000
-500
0
5000 10 20 30 40 50 60 70 80 90 100
Fission track age (Ma)
Dep
th (m
wrt
sea
leve
l)
Umivik-1
Gane-1
Gant-1
Gro-3
Ataa-1
GC861-13
Figure 3.6: Fission track ages plotted against depth with respect to mean sea level in
samples from five boreholes and one outcrop location from the Nuussuaq Basin, Onshore West Greenland. (see Figure 1.1 for locations). The upper plot is shown with an expanded age scale, to show the results from the ATAA-1 borehole, which are much older than ages from the other wells. Results from the UMIIVIK-1, GANE-1, GANT-1, and GRO-3 boreholes define a very consistent pattern of variation with depth, the significance of which is discussed in the text.

46
Geotrack Report #883: Thermal History reconstruction in five boreholes, Onshore West Greenland
Time (Ma)
GC883-1GC883-2
GC883-3
GC883-4GC883-5
GC883-6
GC883-7
UMIIVIK-1
GANE-1
GANT-1
ATAA-1
0102030405060708090100110120130140150
GC883-8GC883-9GC883-10GC883-11GC883-12GC883-13GC883-14
GRO-3
GC883-16
GC883-17
GC861-13
7-2 MaLate Miocene
-Pliocene
11-10 MaLate Miocene
OUTCROP
40-30 MaEocene-
OligoceneStratigraphic age range
Figure 3.7: Timing constraints derived from AFTA data in individual samples analysed
for this report from the Nuussuaq Basin, Onshore West Greenland (see Table 3.3 for details). Results from outcrop sample GC861-13 from a nearby location, originally presented in Geotrack Report #861, are also included. Synthesis of results from all samples, assuming that the data represent the effects of synchronous cooling across the region, suggests at least three discrete cooling episodes, as shown by the vertical columns. Pale colours (samples GC883-6, -7, -16 and –17 from the Ataa-1 borehole and sample GC883-2 from the Umiivik-1 borehole) represent episodes that are allowed but not definitely required by the data. Results in individual samples are attributed to specific events by the corresponding colour, as illustrated.

47
Geotrack Report #883: Thermal History reconstruction in five boreholes, Onshore West Greenland
4. Apatite (U-Th)/He dating
4.1 Results
Five individual apatite grains from each of the samples analysed by AFTA (with the exception of sample GC883-9, from which only four suitable apatite grains could be identified) were analysed by the (U-Th)/He dating technique. Analytical details and background information on the technique are provided in Appendix E, with sample details summarised in Table E.1. Apparently reliable (purely in analytical terms) results were obtained from all the grains analysed from each sample. Basic analytical (U-Th)/He data are summarised in Tables E.2 and E.3.
4.2 (U-Th)/He ages vs depth and elevation
Measured (U-Th)/He ages in individual grains from each sample are plotted against depth with respect to kb and with respect to sea level in Figure 4.1, in which fission track ages from each sample are also plotted, for comparison. Figure 4.2 shows just the (U-Th)/He ages, plotted against depth with respect to sea level, with the lower plot focussing on those values less than 80 Ma. In Figure 4.3, these data are compared with fission track ages on the same age scale. Results from sample GC861-13 (originally presented in Geotrack Report #861) from outcropping sediments of similar age in the Itilli valley, adjacent to most of the boreholes (Figure 1.1) are also included in Figures 4.1, 4.2 and 4.3.
These plots show that despite the apparent reliability of the (U-Th)/He analyses, results from most samples show a greater degree of scatter than expected purely on the basis of analytical uncertainties. Three grains (one grain from each of samples GC883-3, -4 and -10) give (U-Th)/He ages in excess of 90 Ma, which are clearly anomalous. A larger number of grains give (U-Th)/He ages which are close to or even slightly older than the fission track ages, which also appear to be anomalously old, while the remaining data define a more consistent trend of age vs depth, as illustrated in the lower plot in Figure 4.3. (The He diffusion systematics used in extracting thermal history information from the (U-Th)/He ages predicts that He retention is more thermally sensitive than fission track retention, and therefore (U-Th)/He ages which are close to or greater than fission track ages in the same apatite cannot be accommodated within this interpretive scheme).

48
Geotrack Report #883: Thermal History reconstruction in five boreholes, Onshore West Greenland
Note that the ages labelled as anomalously old in Figure 4.3 (lower) include all five grains from sample GC883-8, despite an apparently high degree of consistency within the results from these grains. Thus, it seems that internal consistency provides no guide to the overall reliability of the data, in terms of the expected system response.
After excluding ages which are regarded as anomalous, the remaining grains define a more consistent trend of age vs depth (Figure 4.3, lower). In Section 4.3, these (U-Th)/He ages are investigated in detail, to assess their usefulness in refining the thermal history interpretation of the AFTA data from each sample, presented in Section 3. Quantitative modelling of age vs depth/elevation trends will be discussed in a later section.
4.3 Quantitative thermal history interpretation of the (U-Th)/He ages and integration with AFTA data
To assess (U-Th)/He age data quantitatively, it is necessary to model the evolution of the (U-Th)/He system through time (see Section 2.6), to evaluate the likely values of (U-Th)/He age that would be expected through various thermal history scenarios. These can then be compared with measured data to define the range of histories giving predictions that are consistent with measured ages.
The relationship between (U-Th)/He age and grain radius (see Appendix E, Section E.9) is used as the basis for comparison of measured and predicted ages. Results from each sample are discussed in turn, below. The thermal history solutions derived from AFTA data are used as a starting point for each sample, and the data are investigated to assess whether the (U-Th)/He ages can allow any refinement of the AFTA-derived solutions.
As discussed in Section 3.6, synthesis of all the AFTA data suggests that the region has been affected by three discrete episodes of heating and cooling. On this basis, we have adopted a three-event scenario as a starting point for investigating the (U-Th)/He age data from this sample, involving cooling beginning at 35 Ma, 10 Ma and 4 Ma (taking the approximate mid-points of each interval defined from AFTA, as summarised in Section 3.6).

49
Geotrack Report #883: Thermal History reconstruction in five boreholes, Onshore West Greenland
Sample GC883-1 (Umiivik-1)
Five apatite grains analysed from this sample gave (U-Th)/He ages between 9.7 and 21.1 Ma, showing more scatter than expected based on analytical uncertainties which are typically 0.2 to 0.4 Ma (at ±1σ). These ages are plotted against grain radius in Figure 4.4, where they are compared with age vs radius trends predicted by various thermal history scenarios, largely within the range of conditions allowed by the AFTA data from this sample. The measured ages show no coherent relationship with grain radius, and the evident scatter in the data is regarded as most likely reflecting differences in He retentivity between different apatite grains from this sample. Experience suggests that the youngest ages are most likely to represent apatites closest in behaviour to the published He diffusion systematics employed in modelling the He ages (Appendix E).
As discussed in Table 3.3, AFTA data from this sample can be explained by a scenario involving two paleo-thermal episodes, involving cooling from a maximum paleotemperature between 100 and 110°C beginning some time between 45 and 15 Ma, followed by cooling from a peak paleotemperature between 40 and 80°C which began between 20 and 0 Ma. The earlier event revealed by AFTA data in sample GC883-1 clearly represents the Eocene - Oligocene (40 to 30 Ma) cooling event but the later event overlaps both the Late Miocene and latest Miocene to Pliocene episode, and it is not immediately obvious which event is represented by the AFTA-based solution.
As the earliest event defined from AFTA in this sample involves paleotemperatures in excess of 100°C, the (U-Th)/He age system will only have begun to retain He subsequent to this cooling event. Therefore, the earlier history has not been considered in modelling the expected (U-Th)/He ages. We have used a paleotemperature of 105°C at 35 Ma as the starting point for the thermal history using in modelling the (U-Th)/He ages, and have varied the peak paleotemperature in each of the two subsequent episodes within the range of values allowed by AFTA in the later episode (in fact a slightly wider range has been used). In more detail, as AFTA data allow peak paleotemperatures between 40 and 80°C in the later episode, we have modelled scenarios including a peak paleotemperature at 10 Ma of 90, 80, 70 and 60°C, and for each of these scenarios we have modelled peak paleotemperatures at 4 Ma which are progressively lower than the value at 10 Ma.
Figure 4.4 shows that predicted ages within the range of measured ages are obtained only for situations involving a peak paleotemperature of ~70°C at 10 Ma. Higher

50
Geotrack Report #883: Thermal History reconstruction in five boreholes, Onshore West Greenland
paleotemperatures result in predicted ages which are too young and lower values result in predicted ages which are too old. Similarly, only paleotemperatures of 60°C or less at 4 Ma provide predictions that are close to the measured ages.
On the basis of Figure 4.4, we conclude that the (U-Th)/He ages allow the thermal history solution derived from AFTA data in sample GC883-1 to be refined significantly, to the following:
- cooling from 100-110°C beginning between 45 and 15 Ma (35 Ma assumed) - cooling from 65 to 75°C beginning at 10 Ma - cooling from ≤60°C beginning at 4 Ma
(where we have allowed a range of ±5°C uncertainty in the paleotemperature at 10 Ma, around the preferred value of 70°C where best agreement is found.)
Sample GC883-3 (Gane-1)
Five apatite grains analysed from this sample gave (U-Th)/He ages between 2.4 and 211.5 Ma, showing more scatter than expected based on analytical uncertainties which are between 0.1 and 5.9 Ma (at ±1σ). As discussed in Section 4.2, the oldest age in this sample of 211±6 Ma is clearly anomalously old, and has been excluded from further consideration. The remaining ages are plotted against grain radius in Figure 4.5, where they are compared with age vs radius trends predicted by various thermal history scenarios, within the range of conditions allowed by the AFTA data from this sample. The two older ages, in the range 40 to 70 Ma, are also regarded as anomalously old (Figure 4.3, lower), while consideration of the main trend of the data in Figure 4.3 suggests that the two youngest ages in sample GC883-3 may be anomalously young. So results from this sample should probably be treated with some caution, regarding definition of quantitative thermal history constraints.
As discussed in Table 3.3, AFTA data from this sample can be explained by a scenario involving two paleo-thermal episodes, involving cooling from a maximum paleotemperature between 100 and 115°C beginning some time between 48 and 22 Ma, followed by cooling from a peak paleotemperature between 70 and 85°C which began between 13 and 2 Ma. The earlier of these events clearly represents the Eocene - Oligocene (40 to 30 Ma) cooling event defined from regional synthesis (Section 3.6) but the later event overlaps both the Late Miocene and latest Miocene to Pliocene episodes, and it is not immediately obvious which event is represented by the AFTA-based solution.
As the earliest event defined from AFTA in this sample involves paleotemperatures in excess of 100°C, the (U-Th)/He age system will only have begun to retain He

51
Geotrack Report #883: Thermal History reconstruction in five boreholes, Onshore West Greenland
subsequent to this cooling event. Therefore, the earlier history has not been considered in modelling the expected (U-Th)/He ages. We have used a paleotemperature of 107.5°C at 35 Ma as the starting point for the thermal history using in modelling the (U-Th)/He ages, and have varied the peak Miocene paleotemperature within the range of values allowed by AFTA in the later episode. At each value for the peak Miocene paleotemperature, age vs radius trends have been modelled for a range of latest Miocene to Pliocene paleotemperatures. In more detail, as AFTA data allow peak paleotemperatures between 70 and 85°C in the later episode, we have modelled scenarios including a peak paleotemperature at 10 Ma of 85, 80, 75 and 70°C, and for each of these scenarios we have modelled for a range of peak paleotemperatures at 4 Ma which are progressively lower than the value at 10 Ma.
Figure 4.5 shows that predicted ages for all of the modelled scenarios are broadly consistent with the range of measured ages, particularly bearing in mind the above comments that the youngest measured ages may be anomalously young. Thus, we conclude that the (U-Th)/He ages in sample GC883-3 do not allow significant refinement of the thermal history solution derived from AFTA data.
Sample GC883-4 (Gant-1)
Five apatite grains analysed from this sample gave (U-Th)/He ages between 17.4 and 210.0 Ma, showing more scatter than expected based on analytical uncertainties which are between 0.4 and 5.1 Ma (at ±1σ). As discussed in Section 4.2, the oldest age in this sample of 210±5 Ma is clearly anomalously old, and has been excluded from further consideration. The remaining ages are plotted against grain radius in Figure 4.6, where they are compared with age vs radius trends predicted by various thermal history scenarios, within the range of conditions allowed by the AFTA data from this sample. The measured ages show no coherent relationship with grain radius, and the evident scatter in the data is regarded as most likely reflecting differences in He retentivity between different apatite grains from this sample. Experience suggests that the youngest ages are most likely to represent apatites closest in behaviour to the published He diffusion systematics employed in modelling the He ages (Appendix E).
As discussed in Table 3.3, AFTA data from this sample can be explained by a scenario involving two paleo-thermal episodes, involving cooling from a maximum paleotemperature between 95 and 105°C beginning some time between 40 and 16 Ma, followed by cooling from a peak paleotemperature between 45 and 70°C which began between 11 and 0 Ma. The earlier of these events clearly represents the

52
Geotrack Report #883: Thermal History reconstruction in five boreholes, Onshore West Greenland
Eocene - Oligocene (40 to 30 Ma) cooling event defined from regional synthesis (Section 3.6) but the later event overlaps both the Late Miocene and latest Miocene to Pliocene episodes, and it is not immediately obvious which event is represented by the AFTA-based solution.
As the earliest event defined from AFTA in this sample involves paleotemperatures in excess of 90°C, the (U-Th)/He age system will only have begun to retain He subsequent to this cooling event. Therefore, the earlier history has not been considered in modelling the expected (U-Th)/He ages. We have used a paleotemperature of 100°C at 35 Ma as the starting point for the thermal history used in modelling the (U-Th)/He ages, and have varied the peak Miocene paleotemperature within the range of values allowed by AFTA in the later episode. At each value for the peak Miocene paleotemperature, age vs radius trends have been modelled for a range of Late Miocene to Pliocene paleotemperatures. In more detail, as AFTA data allow peak paleotemperatures between 45 and 70°C in the later episode, we have modelled scenarios including a peak paleotemperature at 10 Ma of 70, 60, 50 and 40°C, and for each of these scenarios we have modelled for a range of peak paleotemperatures at 4 Ma which are progressively lower than the value at 10 Ma.
Figure 4.6 shows that predicted ages corresponding to cooling from either 60°C or 70°C at 10 Ma show the highest level of consistency with the range of measured ages, particularly if the two youngest measured ages are regarded as most likely to represent the He diffusion systematics assumed in the modelling. In detail, predicted ages are slightly lower than the two youngest measured ages for a peak paleotemp-erature of 60°C, and slightly higher for 70°C, and these limits appear to bracket the range of acceptable values. Lower paleotemperatures result in predicted ages which are too old (although the predictions are closer to the higher measured ages), while higher paleotemperatures would result in predicted ages which are too young. Because of the generally low paleotemperatures modelled at 4 Ma, changing the magnitude of this event produces little effect on the modelled ages, and the results do not provide any constraint on this aspect of the history (although Figure 4.5 suggests that values greater than 60°C can probably be ruled out).
On the basis of Figure 4.6, we conclude that the (U-Th)/He ages allow the thermal history solution derived from AFTA data in sample GC883-4 to be refined significantly, to the following:
- cooling from 95-105°C beginning between 40 and 16 Ma (35 Ma assumed) - cooling from 60 to 70°C beginning at 10 Ma - cooling from ≤60°C beginning at 4 Ma.

53
Geotrack Report #883: Thermal History reconstruction in five boreholes, Onshore West Greenland
Sample GC883-5 (Gant-1)
Five apatite grains analysed from this sample gave (U-Th)/He ages between 3.8 and 37.3 Ma, showing more scatter than expected based on analytical uncertainties which are between 0.1 and 0.8 Ma (at ±1σ). These ages are plotted against grain radius in Figure 4.7, where they are compared with age vs radius trends predicted by various thermal history scenarios, within the range of conditions allowed by the AFTA data from this sample. On the basis of age vs depth trends (Figure 4.3), the oldest age of 37.3±0.8 Ma is regarded as anomalously old. The remaining measured ages show no coherent relationship with grain radius, and the evident scatter in the data is regarded as most likely reflecting differences in He retentivity between different apatite grains from this sample. Experience suggests that the youngest ages are most likely to represent apatites closest in behaviour to the published He diffusion systematics employed in modelling the He ages (Appendix E). However, consideration of the main trend of the data in Figure 4.3 suggests that the two youngest ages in sample GC883-5 may be anomalously young (in similar fashion to those from sample GC883-3). So results from all four of the younger ages in this sample have been used for comparison with predicted ages, in attempting to refine the thermal history constraints from AFTA in this sample.
As discussed in Table 3.3, AFTA data from this sample can be explained by a scenario involving two paleo-thermal episodes, involving cooling from a maximum paleotemperature greater than 115°C beginning some time between 49 and 28 Ma, followed by cooling from a peak paleotemperature between 85 and 95°C which began between 17 and 4 Ma. The earlier of these events clearly represents the Eocene - Oligocene (40 to 30 Ma) cooling event defined from regional synthesis (Section 3.6) but the later event overlaps both the Late Miocene and latest Miocene to Pliocene episodes, and it is not immediately obvious which event is represented by the AFTA-based solution.
As the earliest event defined from AFTA in this sample involves paleotemperatures in excess of 115°C, the (U-Th)/He age system will only have begun to retain He subsequent to this cooling event. Therefore, the earlier history has not been considered in modelling the expected (U-Th)/He ages. We have used a paleotemperature of 124°C (based on VR data – see Section 5) at 35 Ma as the starting point for the thermal history used in modelling the (U-Th)/He ages, and have varied the peak Miocene paleotemperature within the range of values allowed by AFTA in the later episode. At each value for the peak Miocene paleotemperature, age vs radius trends have been modelled for a range of latest Miocene to Pliocene paleotemperatures. In more detail, as AFTA data allow peak paleotemperatures

54
Geotrack Report #883: Thermal History reconstruction in five boreholes, Onshore West Greenland
between 85 and 95°C in the later episode, we have modelled scenarios including a peak paleotemperature at 10 Ma of 85, 90 and 95°C, and for each of these scenarios we have modelled for a range of peak paleotemperatures at 4 Ma which are progressively lower than the value at 10 Ma.
Figure 4.7 shows that predicted ages for all of the modelled scenarios are broadly consistent with the range of measured ages, particularly if all four of the measured ages less than 20 Ma are regarded as possibly representing the He diffusion systematics assumed in the modelling. Thus, we conclude that the (U-Th)/He ages in sample GC883-5 do not allow significant refinement of the thermal history solution derived from AFTA data.
Sample GC883-8 (Gro-3)
Five apatite grains analysed from this sample gave (U-Th)/He ages between 23 and 39 Ma, and are quite tightly clustered (particularly the four youngest ages), although they still show more scatter than expected based on analytical uncertainties of typically 0.7 to 1.0 Ma (at ±1σ). These ages are plotted against grain radius in Figure 4.8, where they are compared with age vs radius trends predicted by various thermal history scenarios, within the range of conditions allowed by the AFTA data from this sample. The measured ages show no coherent relationship with grain radius, and the higher age may reflect differences in He retentivity between this grain and the other grains from this sample. Experience suggests that the youngest ages are most likely to represent apatites closest in behaviour to the published He diffusion systematics employed in modelling the He ages (Appendix E).
As discussed in Table 3.3, AFTA data from this sample can be explained by a scenario involving two paleo-thermal episodes, involving cooling from a maximum paleotemperature in excess of 105°C beginning some time between 44 and 21 Ma, followed by cooling from a peak paleotemperature between 30 and 80°C which began between 27 and 0 Ma. The earlier event revealed by AFTA data in sample GC883-1 clearly represents the Eocene - Oligocene (40 to 30 Ma) cooling event but the later event overlaps both the Late Miocene and latest Miocene to Pliocene episode, and it is not immediately obvious which event is represented by the AFTA-based solution.
As the earliest event defined from AFTA in this sample involves paleotemperatures in excess of 105°C, the (U-Th)/He age system will only have begun to retain He subsequent to this cooling event. Therefore, the earlier history has not been considered in modelling the expected (U-Th)/He ages. We have used a

55
Geotrack Report #883: Thermal History reconstruction in five boreholes, Onshore West Greenland
paleotemperature of 123°C (based on VR data – see Section 5) at 35 Ma as the starting point for the thermal history using in modelling the (U-Th)/He ages, and have varied the peak paleotemperature in each of the two subsequent episodes within the range of values allowed by AFTA in the later episode. In more detail, as AFTA data allow peak paleotemperatures between 30 and 80°C in the later episode, we have modelled scenarios including a peak paleotemperature at 10 Ma of 80, 70, 60, 50 and 40°C (because of the lack of he loss below 40°C, 30°C has not been included), and for each of these scenarios we have modelled peak paleotemperatures at 4 Ma which are progressively lower than the value at 10 Ma.
Figure 4.8 shows that predicted ages within the range of measured ages are obtained only for situations involving a peak paleotemperature of ~60°C at 10 Ma. The (U-Th)/He data therefore apparently provide a very tight constraint on the peak paleotemperature at 10 Ma, with higher paleotemperatures resulting in predicted ages which are too young and lower values resulting in predicted ages which are too old.
However, as emphasised in Figure 4.3 (lower), all five (U-Th)/He ages from this sample appear to be anomalously old, when compared to the depth trend of results from all samples from the region. In addition, a peak paleotemperature of ~60°C at 10 Ma is markedly lower than that in other samples at similar depths in adjacent wells (see Section 6 for a more detailed illustration of this point). Therefore, despite the apparently high level of consistency between the individual grain (U-Th)/He ages from this sample, we conclude that they are all anomalously old compared to the He diffusion systematics assumed in this study, and presumably represent a more retentive type of apatite.
On this basis, we conclude that the (U-Th)/He ages in sample GC883-8 are anomalously old, and cannot be used to significantly refine the thermal history solution derived from AFTA data.
Sample GC883-9 (Gro-3)
Four apatite grains analysed from this sample gave (U-Th)/He ages between 0.3 and 13.6 Ma, showing more scatter than expected based on analytical uncertainties of typically 0.1 to 1.2 Ma (at ±1σ). These ages are plotted against grain radius in Figure 4.9, where they are compared with age vs radius trends predicted by various thermal history scenarios, within the range of conditions allowed by the AFTA data from this sample. The measured ages show no coherent relationship with grain radius, rather showing a scatter of ages within a narrow range of radii that may reflect differences in He retentivity between different grains from this sample. The

56
Geotrack Report #883: Thermal History reconstruction in five boreholes, Onshore West Greenland
four ages span the depth trend in Figure 4.3 which is interpreted as representing the most reliable data, but because of the scatter in the ages it is not clear which ages represent He diffusion behaviour most similar to the published He diffusion systematics employed in modelling the He ages (Appendix E). For this reason, results from all four grains have been used for comparison with predicted ages, in attempting to refine the thermal history constraints from AFTA in this sample.
As discussed in Table 3.3, AFTA data from this sample can be explained by a scenario involving two paleo-thermal episodes, involving cooling from a maximum paleotemperature between 115 and 140°C beginning some time between 51 and 24 Ma, followed by cooling from a peak paleotemperature between 50 and 105°C which began between 27 and 0 Ma. The earlier event revealed by AFTA data in sample GC883-1 clearly represents the Eocene - Oligocene (40 to 30 Ma) cooling event but the later event overlaps both the Late Miocene and latest Miocene to Pliocene episode, and it is not immediately obvious which event is represented by the AFTA-based solution.
As the earliest event defined from AFTA in this sample involves paleotemperatures in excess of 100°C, the (U-Th)/He age system will only have begun to retain He subsequent to this cooling event. Therefore, the earlier history has not been considered in modelling the expected (U-Th)/He ages. We have used a paleotemperature of 135°C (based on VR data – see Section 5) at 35 Ma as the starting point for the thermal history used in modelling the (U-Th)/He ages, and have varied the peak paleotemperature in each of the two subsequent episodes within the range of values allowed by AFTA in the later episode. In more detail, as AFTA data allow peak paleotemperatures between 50 and 105°C in the later episode, we have modelled scenarios including a peak paleotemperature at 10 Ma of 105, 95, 85, 75, 65 and 55°C, and for each of these scenarios we have modelled peak paleotemperatures at 4 Ma which are progressively lower than the value at 10 Ma.
Figure 4.9 shows that predicted ages within the range of measured ages are obtained only for situations involving a peak paleotemperature between 75 and 105°C at 10 Ma. For peak values less than 75°C, the predicted ages are older than the entire range of (U-Th)/He ages, and on this basis can be ruled out. If we ignore the youngest of the measured (U-Th)/He ages, the results in Figure 4.9 further suggest that the peak paleotemperature at 4 Ma must have been less than 75°C. However, this may be attaching too much significance to the detail of the data, and this indication is regarded as extremely tentative.

57
Geotrack Report #883: Thermal History reconstruction in five boreholes, Onshore West Greenland
In summary, on the basis of Figure 4.9 we conclude that the (U-Th)/He ages allow the thermal history solution derived from AFTA data in sample GC883-9 to be refined significantly, to the following:
- cooling from 115-140°C beginning between 51 and 24 Ma (35 Ma assumed) - cooling from 75 to 105°C beginning at 10 Ma - cooling from ≤75°C beginning at 4 Ma (tentative).
Sample GC883-10 (Gro-3)
Five apatite grains analysed from this sample gave (U-Th)/He ages between 1.8 and 96 Ma, showing more scatter than expected based on analytical uncertainties of typically 0.05 to 2.0 Ma (at ±1σ). Based on Figures 4.1, 4.2 and 4.3, it is clear that the oldest age of 96±2 Ma is anomalously old, while Figure 4.3 (lower) suggests that the age of 16.97±0.51 Ma is probably also anomalously old. The ages less than 20 Ma are plotted against grain radius in Figure 4.10, where they are compared with age vs radius trends predicted by various thermal history scenarios, within the range of conditions allowed by the AFTA data from this sample. The measured ages show no coherent relationship with grain radius, rather showing a scatter of ages within a narrow range of radii that may reflect differences in He retentivity between different grains from this sample. The three youngest ages in this sample span the depth trend in Figure 4.3 which is interpreted as representing the most reliable data, but because of the scatter in the ages it is not clear which ages represent He diffusion behaviour most similar to the published He diffusion systematics employed in modelling the He ages (Appendix E). For this reason, results from all three grains have been used for comparison with predicted ages, in attempting to refine the thermal history constraints from AFTA in this sample.
As discussed in Table 3.3, the combination of AFTA and VR data from this sample can only be explained by a scenario involving three discrete paleo-thermal episodes. The AFTA data require cooling from a paleotemperature between 125 and 135°C beginning some time between 22 and 7 Ma, followed by cooling from a peak paleotemperature between 65 and 120°C which began between 7 and 0 Ma. In contrast, the VR data define a maximum paleotemperature between 160 and 180°C, which is interpreted as representing the Eocene - Oligocene (40 to 30 Ma) cooling event revealed by AFTA data in shallower samples from the Gro-3 borehole as well as in samples from other boreholes in this study. The two events required by AFTA correlate with the Late Miocene and latest Miocene to Pliocene episodes defined on regional grounds.

58
Geotrack Report #883: Thermal History reconstruction in five boreholes, Onshore West Greenland
As the earliest event defined from AFTA in this sample involves paleotemperatures in excess of 150°C, the (U-Th)/He age system will only have begun to retain He subsequent to this cooling event. Therefore, the earlier history has not been considered in modelling the expected (U-Th)/He ages. We have used a paleotemperature of 170°C at 35 Ma as the starting point for the thermal history using in modelling the (U-Th)/He ages, and have varied the peak paleotemperature in each of the two subsequent episodes within the range of values allowed by AFTA in the later episode. In more detail, as AFTA data allow peak paleotemperatures between 125 and 135°C in the later episode, we have modelled scenarios including a peak paleotemperature at 10 Ma of 135 and 125°C, and for each of these scenarios we have modelled peak paleotemperatures at 4 Ma which are progressively lower than the value at 10 Ma.
Figure 4.10 shows that for both values of peak paleotemperature at 10 Ma, predicted ages are broadly consistent with the three youngest measured ages. In detail, for the 135°C scenario the predicted ages only actually agree with the youngest of the measured (U-Th)/He ages, but given the scatter in the ages, as in other samples it is not clear which of these apatite grains represent the diffusion systematics assumed in making the predictions, so no significance can be attached or attributed to this observation.
In summary, while the (U-Th)/He ages in sample GC883-10 are broadly consistent with predictions based on the interpretation of the AFTA and VR data, the (U-Th)/He ages do not allow significant refinement of that interpretation.
Sample GC861-13 (Outcrop sample, originally presented in Geotrack Report #861)
Five apatite grains analysed from this sample gave (U-Th)/He ages between 21.6 and 31.7 Ma, showing more or less just the expected degree of scatter, based on analytical uncertainties which are between 2.0 and 4.1 Ma (at ±1σ). These ages are plotted against grain radius in Figure 4.11, where they are compared with age vs radius trends predicted by various thermal history scenarios, within the range of conditions allowed by the AFTA data from this sample. All five ages plot within the main depth-trend of the data in Figure 4.3 (lower), suggesting (at least at first sight) that they can be regarded as reliable indicators of the thermal history of this sample.
As discussed in Geotrack Report #861, AFTA data from this sample can be explained by a scenario involving two paleo-thermal episodes, involving cooling from a maximum paleotemperature between 85 and 95°C beginning some time between 50 and 25 Ma, followed by cooling from a peak paleotemperature between

59
Geotrack Report #883: Thermal History reconstruction in five boreholes, Onshore West Greenland
30 and 60°C which began between 20 and 0 Ma. The earlier of these events clearly represents the Eocene - Oligocene (40 to 30 Ma) cooling event defined from regional synthesis (Section 3.6) but the later event overlaps both the Late Miocene and latest Miocene to Pliocene episodes, and it is not immediately obvious which event is represented by the AFTA-based solution.
As the earliest event defined from AFTA in this sample involves paleotemperatures in excess of 80°C, the (U-Th)/He age system will only have begun to retain He subsequent to this cooling event. Therefore, the earlier history has not been considered in modelling the expected (U-Th)/He ages. We have used a paleotemperature of 90°C at 35 Ma as the starting point for the thermal history used in modelling the (U-Th)/He ages, and have varied the peak Miocene paleotemperature within the range of values allowed by AFTA in the later episode. At each value for the peak Miocene paleotemperature, age vs radius trends have been modelled for a range of latest Miocene to Pliocene paleotemperatures. In more detail, as AFTA data allow peak paleotemperatures between 30 and 60°C in the later episode, we have modelled scenarios including a peak paleotemperature at 10 Ma of 60, 50, 40 and 30°C, and for each of these scenarios we have modelled for a range of peak paleotemperatures at 4 Ma which are progressively lower than the value at 10 Ma.
Figure 4.11 shows that predicted ages for all of the modelled scenarios are highly consistent with the range of measured ages. Note in particular that varying the temperature in the more recent episode has little or no effect on the predicted ages due to the relatively low temperatures involved.
In summary, while the (U-Th)/He ages in sample GC861-13 are highly consistent with predictions based on the interpretation of the AFTA and VR data, the (U-Th)/He ages do not allow significant refinement of that interpretation. A similar conclusion was reached in Geotrack Report #861 regarding the (U-Th)/He data in this sample.

60
Geotrack Report #883: Thermal History reconstruction in five boreholes, Onshore West Greenland
West Greenland boreholes
-3500
-3000
-2500
-2000
-1500
-1000
-500
00 50 100 150 200 250 300 350
(U-Th)/He age (Ma)
Dep
th (m
rkb)
883-1883-3883-4883-5Fission track ages (Ma)861-13883-8883-9883-10
West Greenland boreholes
-3000
-2500
-2000
-1500
-1000
-500
0
500
10000 50 100 150 200 250 300 350
(U-Th)/He age (Ma)
Dep
th (m
wrt
msl
)
883-1883-3883-4883-5Fission track ages (Ma)861-13883-8883-9883-10
Figure 4.1: Measured (U-Th)/He ages (corrected for alpha particle ejection – see Table E.3) and fission track ages in all samples from this report plus one sample from a outcrop location adjacent to the five boreholes (GC861-13, originally presented in Geotrack Report GC861), plotted against depth with respect to kb (upper) and to mean sea level (lower). See text for discussion.

61
Geotrack Report #883: Thermal History reconstruction in five boreholes, Onshore West Greenland
West Greenland boreholes
-2000
-1500
-1000
-500
0
5000 50 100 150 200 250
(U-Th)/He age (Ma)
Dep
th (m
wrt
msl
)
883-1 883-3
883-4 883-5
861-13 883-8
883-9 883-10
West Greenland boreholes
-2000
-1500
-1000
-500
0
5000 20 40 60 80
(U-Th)/He age (Ma)
Dep
th (m
wrt
msl
)
883-1 883-3
883-4 883-5
861-13 883-8
883-9 883-10
Figure 4.2: Measured (U-Th)/He ages (corrected for alpha particle ejection – see Table E.3) in all samples from this report sample GC861-13, as in Figure 4.1, plotted against depth with respect to mean sea level. The lower plot is shown on an expanded scale to facilitate display of the variation within the main body of the data. See text for discussion.
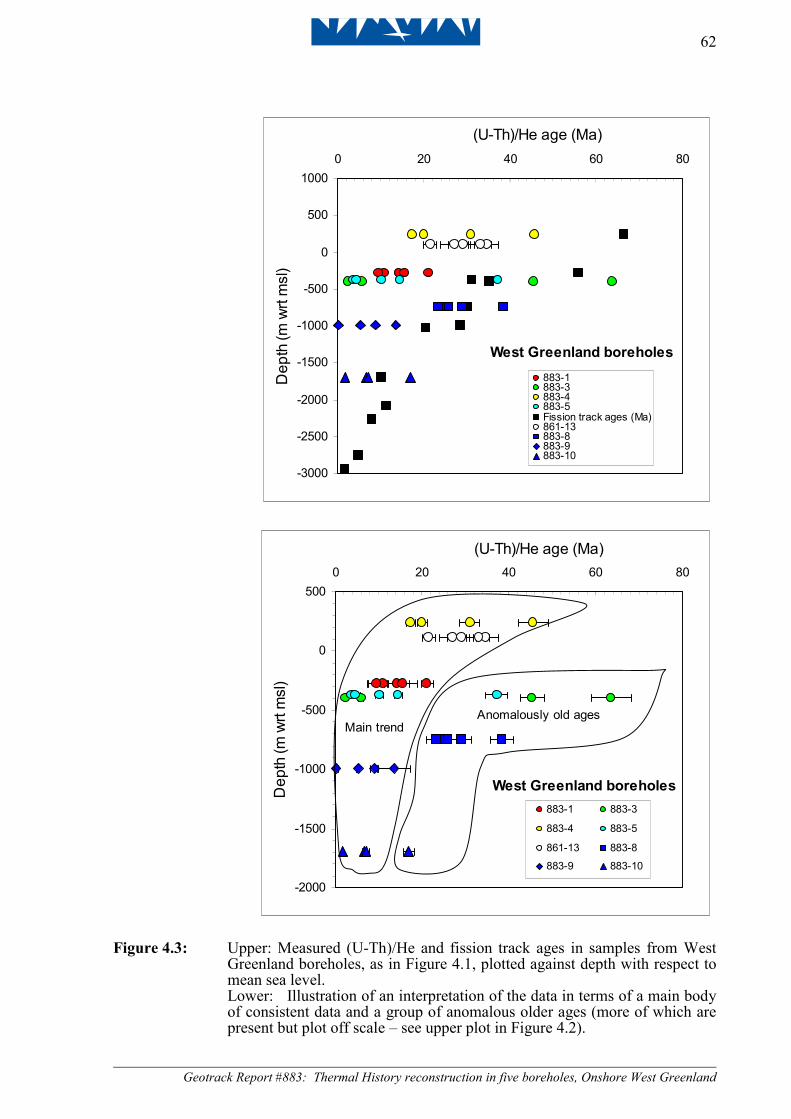
62
Geotrack Report #883: Thermal History reconstruction in five boreholes, Onshore West Greenland
West Greenland boreholes
-3000
-2500
-2000
-1500
-1000
-500
0
500
10000 20 40 60 80
(U-Th)/He age (Ma)
Dep
th (m
wrt
msl
)
883-1883-3883-4883-5Fission track ages (Ma)861-13883-8883-9883-10
West Greenland boreholes
-2000
-1500
-1000
-500
0
5000 20 40 60 80
(U-Th)/He age (Ma)
Dep
th (m
wrt
msl
)
883-1 883-3
883-4 883-5
861-13 883-8
883-9 883-10
Main trendAnomalously old ages
Figure 4.3: Upper: Measured (U-Th)/He and fission track ages in samples from West Greenland boreholes, as in Figure 4.1, plotted against depth with respect to mean sea level.
Lower: Illustration of an interpretation of the data in terms of a main body of consistent data and a group of anomalous older ages (more of which are present but plot off scale – see upper plot in Figure 4.2).

63
Geotrack Report #883: Thermal History reconstruction in five boreholes, Onshore West Greenland
883-1: 90°C at 10 Ma
0
5
10
15
20
25
25 50 75 100 125 150Radius (microns)
(U-T
h)/H
e ag
e (M
a)
883-1Best f it90,7090,6090,5090,40
883-1: 70°C at 10 Ma
0
5
10
15
20
25
30
25 50 75 100 125 150Radius (microns)
(U-T
h)/H
e ag
e (M
a)
883-1Best f it70,6070,5070,4070,30
883-1: 80°C at 10 Ma
0
5
10
15
20
25
25 50 75 100 125 150Radius (microns)
(U-T
h)/H
e ag
e (M
a)
883-1Best f it80,7080,6080,5080,40
883-1: 60°C at 10 Ma
0
5
10
15
20
25
30
35
25 50 75 100 125 150Radius (microns)
(U-T
h)/H
e ag
e (M
a)
883-1Best f it60,5060,4060,30
Figure 4.4: Apatite (U-Th)/He age vs grain radius for sample GC883-1 (Umiivik-1),
from Table E.3 (Appendix E), compared with predicted trends of age vs radius based on various thermal history scenarios allowed by the AFTA data. The trend predicted from the best-fit thermal history derived from AFTA is also shown in each plot (red dashed line). Each scenario is based on cooling from a maximum paleotemperature of 105°C beginning at 35 Ma, and subsequent cooling from paleotemperature peaks at 10 Ma and 4 Ma, as suggested by synthesis of AFTA data from all samples (Section 3.6). Curves are labelled in the legend of each plot corresponding to peak paleotemperatures at 10 Ma and 4 Ma. Thus, “70,60” for example indicates cooling from 70°C at 10 Ma and from 60°C at 4 Ma. Although the (U-Th)/He ages show more scatter than expected from purely analytical uncertainties (shown at ±2σ), these plots show that of the scenarios illustrated, only cooling from ~70°C at 10 Ma gives a satisfactory level of agreement between measured and predicted ages. Peak paleotemperatures less than 60°C at 4 Ma are also favoured by the measured (U-Th)/He ages. See text for further discussion.

64
Geotrack Report #883: Thermal History reconstruction in five boreholes, Onshore West Greenland
883-3: 85°C at 10 Ma
0
10
20
30
40
50
60
70
80
25 50 75 100 125 150Radius (microns)
(U-T
h)/H
e ag
e (M
a) 883-3Best fit85,8085,7085,6085,50
883-3: 75°C at 10 Ma
0
10
20
30
40
50
60
70
80
25 50 75 100 125 150Radius (microns)
(U-T
h)/H
e ag
e (M
a) 883-3Best f it75,6575,5575,4575,35
883-3: 80°C at 10 Ma
0
10
20
30
40
50
60
70
80
25 50 75 100 125 150Radius (microns)
(U-T
h)/H
e ag
e (M
a) 883-3Best f it80,7080,6080,5080,40
883-3: 70°C at 10 Ma
0
10
20
30
40
50
60
70
80
25 50 75 100 125 150Radius (microns)
(U-T
h)/H
e ag
e (M
a) 883-3Best f it70,6070,5070,4070,30
Figure 4.5: Apatite (U-Th)/He age vs grain radius for sample GC883-3 (Gane-1), from
Table E.3 (Appendix E), compared with predicted trends of age vs radius based on various thermal history scenarios allowed by the AFTA data. The trend predicted from the best-fit thermal history derived from AFTA is also shown in each plot (red dashed line). Each scenario is based on cooling from a maximum paleotemperature of 107.5°C beginning at 35 Ma, and subsequent cooling from paleotemperature peaks at 10 Ma and 4 Ma, as suggested by synthesis of AFTA data from all samples (Section 3.6). Curves are labelled in the legend of each plot corresponding to peak paleotemperatures at 10 Ma and 4 Ma. Thus, “70,60” for example indicates cooling from 70°C at 10 Ma and from 60°C at 4 Ma. The (U-Th)/He ages show considerably more scatter than expected from purely analytical uncertainties (shown at ±2σ), and one very high value is off scale in these plots. Based on the age vs depth trends in Figures 4.1 to 4.3, the two higher ages shown in these plots are probably anomalously old, while the two younger ages are probably anomalously young. With this in mind, the predictions for each of the scenarios illustrated here are all regarded as showing a satisfactory level of agreement with the measured ages. See text for further discussion.

65
Geotrack Report #883: Thermal History reconstruction in five boreholes, Onshore West Greenland
883-4: 70°C at 10 Ma
0
10
20
30
40
50
60
70
80
25 50 75 100 125 150Radius (microns)
(U-T
h)/H
e ag
e (M
a) 883-4Best f it70,6070,5070,4070,30
883-4: 50°C at 10 Ma
0
10
20
30
40
50
60
70
80
25 50 75 100 125 150Radius (microns)
(U-T
h)/H
e ag
e (M
a) 883-4Best f it50,4050,3050,20
883-4: 60°C at 10 Ma
0
10
20
30
40
50
60
70
80
25 50 75 100 125 150Radius (microns)
(U-T
h)/H
e ag
e (M
a) 883-4Best f it60,5060,4060,3060,20
883-4: 40°C at 10 Ma
0
10
20
30
40
50
60
70
80
25 50 75 100 125 150Radius (microns)
(U-T
h)/H
e ag
e (M
a) 883-4Best f it40,3040,2040,10
Figure 4.6: Apatite (U-Th)/He age vs grain radius for sample GC883-4 (Gant-1), from
Table E.3 (Appendix E), compared with predicted trends of age vs radius based on various thermal history scenarios allowed by the AFTA data. The trend predicted from the best-fit thermal history derived from AFTA is also shown in each plot (red dashed line). Each scenario is based on cooling from a maximum paleotemperature of 100°C beginning at 35 Ma, and subsequent cooling from paleotemperature peaks at 10 Ma and 4 Ma, as suggested by synthesis of AFTA data from all samples (Section 3.6). Curves are labelled in the legend of each plot corresponding to peak paleotemperatures at 10 Ma and 4 Ma. Thus, “70,60” for example indicates cooling from 70°C at 10 Ma and from 60°C at 4 Ma. The (U-Th)/He ages show considerably more scatter than expected from purely analytical uncertainties (shown at ±2σ), and one very high value is off scale in these plots. Of the remaining values, shown here, it is not clear which of the ages represent the most reliable ages, so all four are used for comparison with the predicted trends. Scenarios involving a peak paleotemperature of ~60°C or less at 10 Ma appear to give the best agreement between measured and predicted ages, while if the two youngest ages are regarded as the most reliable ages, a value around 60°C is suggested. See text for further discussion.

66
Geotrack Report #883: Thermal History reconstruction in five boreholes, Onshore West Greenland
883-5: 95°C at 10 Ma
0
10
20
30
40
25 50 75 100 125 150Radius (microns)
(U-T
h)/H
e ag
e (M
a) 883-5Best f it95,8595,7595,6595,5595,45
883-5: 85°C at 10 Ma
0
10
20
30
40
25 50 75 100 125 150Radius (microns)
(U-T
h)/H
e ag
e (M
a) 883-5Best f it85,7585,6585,5585,4585,35
883-5: 90°C at 10 Ma
0
10
20
30
40
25 50 75 100 125 150Radius (microns)
(U-T
h)/H
e ag
e (M
a) 883-5Best f it90,8090,7090,6090,5090,40
Figure 4.7: Apatite (U-Th)/He age vs grain radius for sample GC883-5 (Gant-1), from
Table E.3 (Appendix E), compared with predicted trends of age vs radius based on various thermal history scenarios allowed by the AFTA data. The trend predicted from the best-fit thermal history derived from AFTA is also shown in each plot (red dashed line). Each scenario is based on cooling from a maximum paleotemperature of 124°C beginning at 35 Ma, and subsequent cooling from paleotemperature peaks at 10 Ma and 4 Ma, as suggested by synthesis of AFTA data from all samples (Section 3.6). Curves are labelled in the legend of each plot corresponding to peak paleotemperatures at 10 Ma and 4 Ma. Thus, “80,60” for example indicates cooling from 80°C at 10 Ma and from 60°C at 4 Ma. The (U-Th)/He ages show more scatter than expected from purely analytical uncertainties (shown at ±2σ), and based on the age vs depth trends in Figures 4.1 to 4.3, the highest age around 40 Ma is regarded as anomalously old. Predictions for each of the scenarios illustrated here are all regarded as showing a satisfactory level of agreement with the remaining measured ages. See text for further discussion.

67
Geotrack Report #883: Thermal History reconstruction in five boreholes, Onshore West Greenland
883-8: 80°C at 10 Ma
0
10
20
30
40
50
25 50 75 100 125 150Radius (microns)
(U-T
h)/H
e ag
e (M
a)
883-8Best f it80,7080,6080,5080,4080,30
883-8: 60°C at 10 Ma
0
10
20
30
40
50
25 50 75 100 125 150Radius (microns)
(U-T
h)/H
e ag
e (M
a)
883-8Best f it60,5060,4060,3060,20
883-8: 70°C at 10 Ma
0
10
20
30
40
50
25 50 75 100 125 150Radius (microns)
(U-T
h)/H
e ag
e (M
a)
883-8Best f it70,6070,5070,4070,30
883-8: 50°C and 40°C at 10 Ma
0
10
20
30
40
50
25 50 75 100 125 150Radius (microns)
(U-T
h)/H
e ag
e (M
a)
883-8Best f it50,4050,3040,3040,20
Figure 4.8: Apatite (U-Th)/He age vs grain radius for sample GC883-8 (Gro-3), from
Table E.3 (Appendix E), compared with predicted trends of age vs radius based on various thermal history scenarios allowed by the AFTA data. The trend predicted from the best-fit thermal history derived from AFTA is also shown in each plot (red dashed line). Each scenario is based on cooling from a maximum paleotemperature of 123°C beginning at 35 Ma, and subsequent cooling from paleotemperature peaks at 10 Ma and 4 Ma, as suggested by synthesis of AFTA data from all samples (Section 3.6). Curves are labelled in the legend of each plot corresponding to peak paleotemperatures at 10 Ma and 4 Ma. Thus, “70,60” for example indicates cooling from 70°C at 10 Ma and from 60°C at 4 Ma. The (U-Th)/He ages are quite tightly grouped, but still show considerably more scatter than expected from purely analytical uncertainties (shown at ±2σ). Based on the age vs depth trends in Figures 4.1 to 4.3, all of the ages measured in this sample may be anomalously old. A satisfactory level of agreement between measured and predicted ages is obtained only for a peak paleotemperature of ~60°C at 10 Ma. Other data from the region suggest that this is not consistent with regional trends, supporting the suggestion that the measured He ages are anomalously old. See text for further discussion.

68
Geotrack Report #883: Thermal History reconstruction in five boreholes, Onshore West Greenland
883-9: 105°C at 10 Ma
0
5
10
15
20
25
25 50 75 100 125 150Radius (microns)
(U-T
h)/H
e ag
e (M
a)
883-9Best f it105,95105,85105,75105,65105,55105,45105,35
883-9: 75°C at 10 Ma
0
5
10
15
20
25
25 50 75 100 125 150Radius (microns)
(U-T
h)/H
e ag
e (M
a)
883-9Best f it75,6575,5575,4575,35
883-9: 95°C at 10 Ma
0
5
10
15
20
25
25 50 75 100 125 150Radius (microns)
(U-T
h)/H
e ag
e (M
a)
883-9Best fit95,8595,7595,6595,5595,4595,35
883-9: 65°C at 10 Ma
0
5
10
15
20
25
25 50 75 100 125 150Radius (microns)
(U-T
h)/H
e ag
e (M
a)
883-9
Best fit
65,55
65,45
65,35
883-9: 85°C at 10 Ma
0
5
10
15
20
25
25 50 75 100 125 150Radius (microns)
(U-T
h)/H
e ag
e (M
a)
883-9Best fit85,7585,6585,5585,4585,35
883-9: 55°C at 10 Ma
0
5
10
15
20
25
25 50 75 100 125 150Radius (microns)
(U-T
h)/H
e ag
e (M
a)
883-9
Best f it
55,45
55,35
Figure 4.9: Apatite (U-Th)/He age vs grain radius for sample GC883-9 (Gro-3), from
Table E.3 (Appendix E), compared with predicted trends of age vs radius based on various thermal history scenarios allowed by the AFTA data. The trend predicted from the best-fit thermal history derived from AFTA is also shown in each plot (red dashed line). Each scenario is based on cooling from a maximum paleotemperature of 135°C beginning at 35 Ma, and subsequent cooling from paleotemperature peaks at 10 Ma and 4 Ma, as suggested by synthesis of AFTA data from all samples (Section 3.6). Details are as in previous Figures. The (U-Th)/He ages show more scatter than expected from purely analytical uncertainties (shown at ±2σ), but in general, predictions for scenarios involving a peak paleotemperature between 75 and 105°C at 10 Ma give a satisfactory level of agreement between measured and predicted ages. See text for further discussion.

69
Geotrack Report #883: Thermal History reconstruction in five boreholes, Onshore West Greenland
883-10: 135°C at 10 Ma
0
5
10
15
20
25 50 75 100 125 150Radius (microns)
(U-T
h)/H
e ag
e (M
a)
883-10Best f it135,120135,110135,100135,90135,80135,65
883-10: 125°C at 10 Ma
0
5
10
15
20
25 50 75 100 125 150Radius (microns)
(U-T
h)/H
e ag
e (M
a)
883-10Best f it125,110125,100125,90125,80125,70125,65
Figure 4.10: Apatite (U-Th)/He age vs grain radius for sample GC883-10 (Gro-3), from
Table E.3 (Appendix E), compared with predicted trends of age vs radius based on various thermal history scenarios allowed by the AFTA data. The trend predicted from the best-fit thermal history derived from AFTA is also shown in each plot (red dashed line). Each scenario is based on cooling from a maximum paleotemperature of 170°C beginning at 35 Ma, and subsequent cooling from paleotemperature peaks at 10 Ma and 4 Ma, as suggested by synthesis of AFTA data from all samples (Section 3.6). Details are as explained in Figures 4.4 to 4.8. The (U-Th)/He ages show considerably more scatter than expected from purely analytical uncertainties (shown at ±2σ), and one very high value is off scale in these plots. Based on the age vs depth trends in Figures 4.1 to 4.3, the higher age shown in these plots is regarded as anomalously old. The predictions for both scenarios illustrated here are in broad agreement with the remaining three measured ages, but because the of the excessive scatter these results do not allow refinement of the thermal history solutions derived from the AFTA data. See text for further discussion.

70
Geotrack Report #883: Thermal History reconstruction in five boreholes, Onshore West Greenland
861-13: 60°C at 10 Ma
0
10
20
30
40
50
25 50 75 100 125 150Radius (microns)
(U-T
h)/H
e ag
e (M
a)
861-13Best fit60,5060,4060,3060,20
861-13: 40°C and 30°C at 10 Ma
0
10
20
30
40
50
25 50 75 100 125 150Radius (microns)
(U-T
h)/H
e ag
e (M
a)
861-13Best fit40,3040,2030,2030,10
861-13: 50°C at 10 Ma
0
10
20
30
40
50
25 50 75 100 125 150Radius (microns)
(U-T
h)/H
e ag
e (M
a)
861-13
Best f it
50,40
50,30
50,20
Figure 4.11: Apatite (U-Th)/He age vs grain radius for sample GC883-13 (Itilli Valley
outcrop), from Geotrack report #861, compared with predicted trends of age vs radius based on various thermal history scenarios allowed by the AFTA data. The trend predicted from the best-fit thermal history derived from AFTA is also shown in each plot (red dashed line). Each scenario is based on cooling from a maximum paleotemperature of 90°C beginning at 35 Ma, and subsequent cooling from paleotemperature peaks at 10 Ma and 4 Ma, as suggested by synthesis of AFTA data from all samples (Section 3.6). Curves are labelled in the legend of each plot corresponding to peak paleotemperatures at 10 Ma and 4 Ma. Thus, “60,50” for example indicates cooling from 60°C at 10 Ma and from 50°C at 4 Ma. The (U-Th)/He ages show a good level of consistency within the analytical uncertainties (shown at ±2σ). Predictions for each of the scenarios illustrated here are all regarded as showing a satisfactory level of agreement between measured and predicted ages, so while the (U-Th)/He ages support the interpretation of the AFTA data, they do not allow significant refinement of the thermal history solution for this sample. See text for further discussion.

71
Geotrack Report #883: Thermal History reconstruction in five boreholes, Onshore West Greenland
5. Thermal history interpretation of VR data, integration of AFTA, (U-Th)/He and VR data, paleotemperature profiles and mechanisms of heating and cooling
5.1 Thermal history interpretation of VR data
Introduction
Vitrinite reflectance data from the five boreholes from which AFTA samples have been analysed were provided by GEUS, and are summarised in Table D.2. Values from all five boreholes are plotted against depth with respect to kb (upper) and mean sea level (lower) in Figure 5.1, which emphasises the overall consistency between the data from the five boreholes. At depths greater than ~400 metres, the VR data from the Umiivik-1 borehole show erratic variation around two sizeable intrusives within the section. But at shallower depths values are close to the trend of values in other wells, except for data from the Gant-1 borehole, which are offset systematically to higher reflectances compared to data from the other boreholes when plotted against depth from sea level.
Evidence that samples have been hotter in the past
For each borehole, mean VR values are plotted against depth (with respect to kb) in Figures 5.2a - 5.2e. Also shown for each well in Figures 5.2a - 5.2.e is the VR profile predicted on the basis of the Default Thermal History - i.e. the thermal history predicted for samples from this well if they have never been hotter than their present temperatures at any time in the past, as defined in Section 2.1. This history is based on the burial history derived from the units intersected in the well (shown in Figures 5.3a - 5.3e), combined with an assumed present-day thermal gradient of 30°C/km.
In all five boreholes, the measured VR values plot well above the profile predicted by the respective Default Thermal History in Figures 5.2a - 5.2e, showing that the sampled units have been hotter in the past.
Magnitude of paleotemperatures from VR
Maximum paleotemperatures derived from the measured VR values in each borehole, using the strategy outlined in Section 2.2, are summarised in Table 5.1. Values vary from 83 to >250°C in the five boreholes.

72
Geotrack Report #883: Thermal History reconstruction in five boreholes, Onshore West Greenland
5.2 Integration of AFTA, (U-Th)/He and VR data, paleotemperature profiles and mechanisms of heating and cooling
Paleotemperature constraints from AFTA, (U-Th)/He dating and VR data are plotted with respect to depth (with respect to kb) in each of the five boreholes in Figures 5.4a through 5.4e. In the Umiivik-1, Gane-1, Gant-1 and Gro-3 boreholes, the Eocene - Oligocene paleotemperature constraints from AFTA are highly consistent with the maximum paleotemperatures derived from VR data.
Results from Ataa-1 are less consistent. While the range of maximum paleotemperatures allowed by AFTA data do show some degree of overlap with the maximum paleotemperatures derived from the VR data, in the case of the deeper samples (GC883-7 and –17) this is only true at the highest end of the allowed range, and the AFTA data only allow these paleotemperatures prior to 75 Ma. This timing range is thus inconsistent with regional results which show very clearly that cooling began some time between 40 and 30 Ma, and thus the AFTA data from these two samples are regarded as anomalous. While the AFTA and VR data in the shallower samples from Ataa-1, GC883-6 and –16, are more consistent, given the uncertainty regarding data from the deeper samples, data from Ataa-1 have not been included in the synthesis of data to be represented in subsequent Sections (although the paleotemperature constraints are included in some plots, for illustration).
In most of the wells, paleotemperature constraints are available over only a restricted range of depths, and the results shown in Figures 5.4a through 5.4e provide only limited insight into the nature of the underlying mechanisms responsible for heating and cooling.
Best definition of the nature of the paleotemperature profiles representing discrete paleo-thermal episodes is provided by results from the Gro-3 borehole (Figure 5.4e). Paleotemperature constraints for the Eocene-Oligocene episode in this borehole define a broadly linear profile with a distinctly higher slope compared to the present-day temperature profile based on an assumed thermal gradient of 30°C/km. Results from the Gant-1 borehole show a similar character, although the higher slope of the paleotemperature profile is less clear in this case. In the Umiivik-1 borehole, the VR data clearly delineate two zones of contact heating around intrusive bodies recognised in this borehole (Figure 5.4a), while shallower data show a similar character to results from the Gant-1 and Gro-3 boreholes.

73
Geotrack Report #883: Thermal History reconstruction in five boreholes, Onshore West Greenland
Synthesis of Eocene-Oligocene paleotemperatures
To gain more insight into the nature of the paleotemperature profiles characterising individual paleo-thermal episodes, we have combined paleotemperature constraints from the individual boreholes, together with those from Itilli Valley outcrop sample GC861-13 (presented in Geotrack Report #861) into a series of composite depth profiles.
Figure 5.5 shows paleotemperature constraints for the Eocene-Oligocene episode from all samples, plotted against depth with respect to sea level (omitting results from Umiivik-1 which are dominated by contact heating effects). Two distinct trends are evident in the paleotemperature constraints in Figure 5.5. Results from the Umiivik-1, Gane-1 and Gro-3 boreholes and outcrop sample GC861-13 define a linear profile, with a distinctly higher slope compared to the assumed present-day temperature profile, as noted above in the context of results from Gro-3 alone. Results from the Gant-1 borehole define a separate profile with a similar slope but clearly offset to higher paleotemperatures.
These observations suggest that the Eocene-Oligocene paleotemperatures in these samples are best explained in terms of heating due to a combination of deeper burial and elevated basal heat flow, with the section intersected in the Gant-1 borehole having undergone a slightly greater degree of heating (maybe deeper burial and/or higher heat flow) compared to other locations. These aspects of the results are considered quantitatively in Section 6.
Synthesis of Late Miocene paleotemperatures
Figure 5.6 shows paleotemperature constraints for the Late Miocene episode from all samples, plotted against depth with respect to sea level. Considering all results together, these constraints define a broadly linear profile, sub-parallel to the assumed present-day temperature profile, and offset to higher temperatures by around 60 to 70°C. Such a signature is diagnostic of heating due solely to deeper burial and cooling due to exhumation, under a heat flow regime similar to that of the present-day.
In detail, results from some wells suggest systematic offsets within the overall depth-trend, as indicated in Figure 5.6, with Umiivik-1 and GC861-13 possibly defining a lower profile (perhaps indicating a lesser degree of former burial compared to samples from Gro-3 and Gane-1, while results from Gant-1 are perhaps slightly higher still. Given the uncertainties involved, e.g. in resolving multiple episodes

74
Geotrack Report #883: Thermal History reconstruction in five boreholes, Onshore West Greenland
within the AFTA data and in determining precise kb elevations etc, this level of detail may be considered unjustified, in which case the combined data may be regarded as providing the most reliable indication of averaged regional thermal and tectonic histories.
Ongoing research by Johan Bonow (Department of Physical Geography and Quaternary Geology, Stockholm University) and Peter Japsen (GEUS, Copenhagen) has led to the recognition of a major Neogene erosion surface across the Nuussuaq Peninsula (P. Japsen, pers. comm.), and the age of this surface and it’s relationship to the Neogene cooling recognised from AFTA in this study, are key aspects of the interpretation of the data presented in this report. To investigate this, Figure 5.7 shows paleotemperature constraints for the Late Miocene episode, as in Figure 5.6, plotted against depth from the erosion surface at each locality. Information on the elevation of the erosion surface at each locality and kb elevations (provided by P. Japsen of GEUS) is summarised in Table 5.2.
The data plot in Figure 5.7 in much the same way as in Figure 5.8, except that the differences described above between results from Gant-1 and those from the other boreholes are reversed. The paleotemperature constraint from sample GC861-13, in particular, is possibly lower than the trend defined by data from the Umiivik-1, Gane-1 and Gro-3 boreholes, and more consistent with constraints from Gant-1, which appear to be distinctly lower than values form other wells. As before, whether detailed consideration of such relatively minor details is justified, given the nature of the data, is not clear. One possible complication with the data from GC861-13 is that the paleotemperature constraint on the later episode, viz cooling from a peak between 30 and 60°C beginning between 20 and 0 Ma, overlaps both the Late Miocene and latest Miocene to Pliocene episodes, and thus probably represent the unresolved effects of both of these events. In this case, the Late Miocene paleotemperature could have been somewhat higher than the stated range, while the latest Miocene to Pliocene value may have been lower. Similar comments are applicable to other samples too. Given these uncertainties, as above we feel that treating the combined dataset as a whole is likely to provide the most reliable indication of regional thermal and tectonic histories (while noting that relatively minor local differences may exist across the region).
Quantitative assessment of the paleotemperature constraints shown in Figures 5.6 and 5.7, in terms of the ranges of paleogeothermal gradient and missing section required to explain them, is provided in Section 6.

75
Geotrack Report #883: Thermal History reconstruction in five boreholes, Onshore West Greenland
Synthesis of Latest Miocene to Pliocene paleotemperatures
Figure 5.8 shows paleotemperature constraints for the Latest Miocene to Pliocene episode from all samples, plotted against depth with respect to sea level. The constraint on the more recent episode recognised from AFTA in sample GC861-13 is also shown. Again, the combined dataset form a well-defined linear profile, which coincides closely with the present-day temperature profile based on an assumed present-day thermal gradient of 30°C/km.
The significance of this observation, together with quantitative assessment of the latest Miocene to Pliocene paleotemperature constraints shown in Figure 5.8, in terms of the ranges of paleogeothermal gradient and missing section required to explain them, is provided in Section 6.

76
Geotrack Report #883: Thermal History reconstruction in five boreholes, Onshore West Greenland
Table 5.1: Maximum paleotemperatures from VR data in five boreholes, Onshore West Greenland (Geotrack Report #883)
Well name
Average Depth
(wrt kb) (m)
Present Temperature
(°C)
Measured VR*1
(%)
Maximum paleotemp-
erature*2 (°C)
Umiivik-1 50 1 0.55 91 Umiivik-1 105 3 0.55 91 Umiivik-1 151 5 0.55 91 Umiivik-1 200 6 0.61 100 Umiivik-1 251 8 0.6 99 Umiivik-1 308 9 0.62 102 Umiivik-1 358 11 0.63 104 Umiivik-1 404 12 1.15 151 Umiivik-1 451 14 2.17 196 Umiivik-1 645 19 2.47 206 Umiivik-1 711 21 1.67 177 Umiivik-1 753 23 1.69 178 Umiivik-1 794 24 1.98 189 Umiivik-1 910 27 4.25 >250 Umiivik-1 1066 32 4.31 >250 Umiivik-1 1114 33 2.51 207 Umiivik-1 1151 35 2.22 198 Umiivik-1 1172 35 1.93 188 Umiivik-1 1198 36 1.94 188 Gane-1 503 15 0.7 116 Gane-1 510 15 0.66 109 Gane-1 526 16 0.69 115 Gane-1 535 16 0.7 116 Gane-1 547 16 0.67 111 Gane-1 591 18 0.75 122 Gane-1 615 18 0.68 113 Gane-1 635 19 0.58 96 Gane-1 641 19 0.6 99 Gane-1 649 19 0.72 118
Continued .....\

77
Geotrack Report #883: Thermal History reconstruction in five boreholes, Onshore West Greenland
Table 5.1: Continued (Geotrack Report #883)
Well name
Average Depth
(wrt kb) (m)
Present Temperature
(°C)
Measured VR*1
(%)
Maximum paleotemp-
erature*2 (°C)
Gant-1 68 2 0.63 104 Gant-1 97 3 0.66 109 Gant-1 267 8 0.67 111 Gant-1 322 10 0.64 106 Gant-1 375 11 0.64 106 Gant-1 476 14 0.71 117 Gant-1 519 16 0.76 123 Gant-1 589 18 0.71 117 Gant-1 646 19 0.74 121 Gant-1 692 21 0.74 121 Gant-1 707 21 0.79 126 Gant-1 794 24 0.76 123 Gant-1 797 24 0.86 132 Gant-1 837 25 0.93 138 Gant-1 870 26 0.96 140 Gant-1 895 27 1.13 150 Ataa-1 50 1 0.5 83 Ataa-1 75 2 0.49 81 Ataa-1 105 3 0.53 88 Ataa-1 435 13 0.97 141 Ataa-1 500 15 0.54 90 Ataa-1 520 15 0.57 94 Ataa-1 555 16 0.57 94 Gro-3 370 11 0.77 124 Gro-3 510 15 0.74 121 Gro-3 1110 33 0.98 141 Gro-3 1150 35 1.01 143 Gro-3 1250 38 1.32 161 Gro-3 1300 39 1.23 156 Gro-3 1390 42 1.23 156 Gro-3 1545 46 1.42 166 Gro-3 1725 52 1.61 175 Gro-3 2365 71 2.24 198 Gro-3 2435 73 2.29 200
*1 Measured VR values supplied by GEUS, from Table D.2.
*2 All estimates of maximum paleotemperature were determined using assumed heating rates of 1°C/Ma and cooling rates of 10°C/Ma. See Section 2.2 for further details.

78
Geotrack Report #883: Thermal History reconstruction in five boreholes, Onshore West Greenland
Table 5.2: Erosion surface and Kelly Bushing/outcrop elevations for five West Greenland boreholes and one outcrop sample (Geotrack Report #883)
Well
or outcrop location
Present KB or outcrop elevation (m a msl)
KB depth below Neogene erosion surface (m)
Present elevation of erosion surface
(m)
Umiivik-1 7 993 1000 m Gane-1 116 984 1100 m Gant-1 385 615 1900 m Gro-3 22 1078 1100 m Ataa-1 490 1260 1750 m GC861-13 115 985 1100 m

79
Geotrack Report #883: Thermal History reconstruction in five boreholes, Onshore West Greenland
Onshore West Greenland wells-3000
-2500
-2000
-1500
-1000
-500
00.10 1.00 10.00
Ro (%)
Dep
th (m
etre
s w
rt kb
)
UMIIVIK-1
GANE#1/1A
GANT#1
ATAA-1
GRO#3
Onshore West Greenland wells-3000
-2500
-2000
-1500
-1000
-500
0
500
10000.10 1.00 10.00
Ro (%)
Dep
th (m
etre
s w
rt se
a le
vel)
UMIIVIK-1
GANE#1/1A
GANT#1
ATAA-1
GRO#3
Figure 5.1: Vitrinite reflectance values supplied by GEUS from five West Greenland
Boreholes, plotted against depth with respect to kb (upper) and mean sea level (lower). This plot emphasises the general level of consistency in data from different boreholes. Although data from the Umiivik-1 borehole show the effects of contact heating due to sills within the section, shallower data are very consistent with the overall trend of data from three of the four other boreholes, while data from the Gant-1 borehole are offset slightly to higher reflectance values. See text for further discussion.

80
Geotrack Report #883: Thermal History reconstruction in five boreholes, Onshore West Greenland
UMIVIK-1Default history
Coniacian
Turonian
Albian-Turonan
0
200
400
600
800
1000
1200
1400
Maturity (%Ro)1.00.50.30.2 0.7 2.0 3.0 5.0
Figure 5.2a: Mean vitrinite reflectance values supplied by GEUS from West Greenland Borehole UMIIVIK-1, plotted against depth (from sea level). Data are summarised in Table D.2. The solid line is the profile predicted on the basis of the “Default Thermal History”, i.e., the profile expected if all units throughout the well are currently at their maximum temperatures since deposition (see Section 2.1). The Default Thermal History was constructed using the burial history derived from the sedimentary section intersected in the well (shown in Figure 5.3a), combined with an assumed present-day thermal gradient of 30°C/km and a surface temperature of 0°C. The VR values plot consistently above the profile predicted by the Default Thermal History, showing that the sampled units have been much hotter than their present temperatures at some time after deposition.
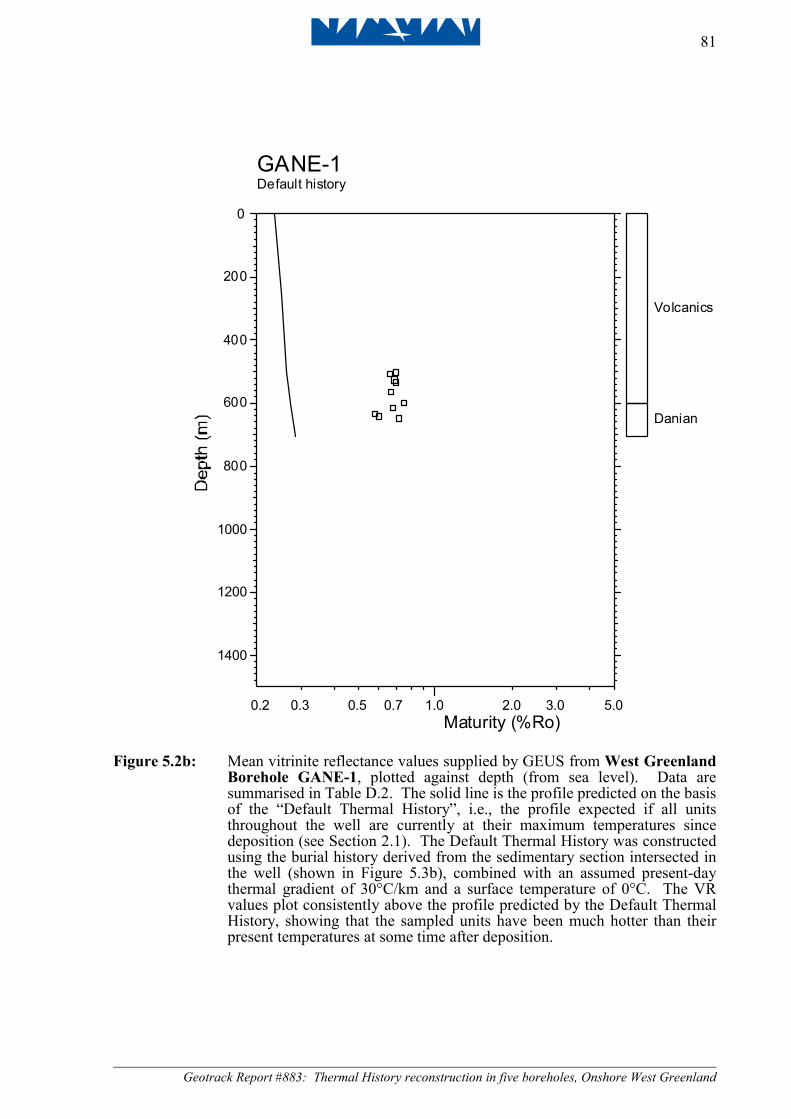
81
Geotrack Report #883: Thermal History reconstruction in five boreholes, Onshore West Greenland
GANE-1Default history
Volcanics
Danian
0
200
400
600
800
1000
1200
1400
Maturity (%Ro)1.00.50.30.2 0.7 2.0 3.0 5.0
Figure 5.2b: Mean vitrinite reflectance values supplied by GEUS from West Greenland Borehole GANE-1, plotted against depth (from sea level). Data are summarised in Table D.2. The solid line is the profile predicted on the basis of the “Default Thermal History”, i.e., the profile expected if all units throughout the well are currently at their maximum temperatures since deposition (see Section 2.1). The Default Thermal History was constructed using the burial history derived from the sedimentary section intersected in the well (shown in Figure 5.3b), combined with an assumed present-day thermal gradient of 30°C/km and a surface temperature of 0°C. The VR values plot consistently above the profile predicted by the Default Thermal History, showing that the sampled units have been much hotter than their present temperatures at some time after deposition.

82
Geotrack Report #883: Thermal History reconstruction in five boreholes, Onshore West Greenland
GANT-1Default history
Danian
Campanian-Maastr
Campanian
0
200
400
600
800
1000
1200
1400
Maturity (%Ro)1.00.50.30.2 0.7 2.0 3.0 5.0
Figure 5.2c: Mean vitrinite reflectance values supplied by GEUS from West Greenland Borehole GANT-1, plotted against depth (from sea level). Data are summarised in Table D.2. The solid line is the profile predicted on the basis of the “Default Thermal History”, i.e., the profile expected if all units throughout the well are currently at their maximum temperatures since deposition (see Section 2.1). The Default Thermal History was constructed using the burial history derived from the sedimentary section intersected in the well (shown in Figure 5.3c), combined with an assumed present-day thermal gradient of 30°C/km and a surface temperature of 0°C. The VR values plot consistently above the profile predicted by the Default Thermal History, showing that the sampled units have been much hotter than their present temperatures at some time after deposition.

83
Geotrack Report #883: Thermal History reconstruction in five boreholes, Onshore West Greenland
ATAA-1Default history
Santonian-Campan
0
200
400
600
800
1000
1200
1400
Maturity (%Ro)1.00.50.30.2 0.7 2.0 3.0 5.0
Figure 5.2d: Mean vitrinite reflectance values supplied by GEUS from West Greenland Borehole ATAA-1, plotted against depth (from sea level). Data are summarised in Table D.2. The solid line is the profile predicted on the basis of the “Default Thermal History”, i.e., the profile expected if all units throughout the well are currently at their maximum temperatures since deposition (see Section 2.1). The Default Thermal History was constructed using the burial history derived from the sedimentary section intersected in the well (shown in Figure 5.3d), combined with an assumed present-day thermal gradient of 30°C/km and a surface temperature of 0°C. The VR values plot consistently above the profile predicted by the Default Thermal History, showing that the sampled units have been much hotter than their present temperatures at some time after deposition.

84
Geotrack Report #883: Thermal History reconstruction in five boreholes, Onshore West Greenland
GRO-3Default history
Volcanic
Danian
Maastrichtian
Campanian
Albian-Coniacian
0
500
1000
1500
2000
2500
3000
3500
Maturity (%Ro)1.00.50.30.2 0.7 2.0 3.0 5.0
Figure 5.2e: Mean vitrinite reflectance values supplied by GEUS from West Greenland Borehole GRO-3, plotted against depth (from sea level). Data are summarised in Table D.2. The solid line is the profile predicted on the basis of the “Default Thermal History”, i.e., the profile expected if all units throughout the well are currently at their maximum temperatures since deposition (see Section 2.1). The Default Thermal History was constructed using the burial history derived from the sedimentary section intersected in the well (shown in Figure 5.3e), combined with an assumed present-day thermal gradient of 30°C/km and a surface temperature of 0°C. The VR values plot consistently above the profile predicted by the Default Thermal History, showing that the sampled units have been much hotter than their present temperatures at some time after deposition.

85
Geotrack Report #883: Thermal History reconstruction in five boreholes, Onshore West Greenland
PMOEPK
UMIVIK-1Default history
Coniacian
Turonian
Albian-Turonan
0
200
400
600
800
1000
1200
1400
020406080100120Time (Ma)
Figure 5.3a: Burial History derived from the preserved section in West Greenland Borehole UMIIVIK-1 used, together with a present-day thermal gradient of 30°C/km, to predict the Default Thermal Histories for AFTA samples from this well, and the maturity profile shown in Figure 5.2a.

86
Geotrack Report #883: Thermal History reconstruction in five boreholes, Onshore West Greenland
PPMOEPK
GANE-1Default history
Volcanics
Danian
0
200
400
600
800
1000
1200
1400
010203040506070Time (Ma)
Figure 5.3b: Burial History derived from the preserved section in West Greenland Borehole GANE-1 used, together with a present-day thermal gradient of 30°C/km, to predict the Default Thermal Histories for AFTA samples from this well, and the maturity profile shown in Figure 5.2b.

87
Geotrack Report #883: Thermal History reconstruction in five boreholes, Onshore West Greenland
PMOEPK
GANT-1Default history
Danian
Campanian-Maastr
Campanian
0102030405060708090
0
200
400
600
800
1000
1200
1400
Time (Ma)
Figure 5.3c: Burial History derived from the preserved section in West Greenland Borehole GANT-1 used, together with a present-day thermal gradient of 30°C/km, to predict the Default Thermal Histories for AFTA samples from this well, and the maturity profile shown in Figure 5.2c.

88
Geotrack Report #883: Thermal History reconstruction in five boreholes, Onshore West Greenland
PMOEPK
ATAA-1Default history
Santonian-Campan
0
200
400
600
800
1000
1200
1400
0102030405060708090Time (Ma)
Figure 5.3d: Burial History derived from the preserved section in West Greenland Borehole ATAA-1 used, together with a present-day thermal gradient of 30°C/km, to predict the Default Thermal Histories for AFTA samples from this well, and the maturity profile shown in Figure 5.2d.

89
Geotrack Report #883: Thermal History reconstruction in five boreholes, Onshore West Greenland
PMOEPK
GRO-3Default history
Volcanic
Danian
Maastrichtian
Campanian
Albian-Coniacian
0
500
1000
1500
2000
2500
3000
3500020406080100120
Time (Ma)
Figure 5.3e: Burial History derived from the preserved section in West Greenland Borehole GRO-3 used, together with a present-day thermal gradient of 30°C/km, to predict the Default Thermal Histories for AFTA samples from this well, and the maturity profile shown in Figure 5.2e.

90
Geotrack Report #883: Thermal History reconstruction in five boreholes, Onshore West Greenland
0.5
1.5
1.0
2.0
2.5
0.0
AFTA sample horizon (with sample number)
Estimates of maximum post-depositional paleotemperaturesfrom AFTA
Maximum paleotemperature from VR
3.0
Temperature (°C)
3.5
26024020 40 60 80 100 120 140 160 180 2000 220
GC883-1
Assumed present-daytemperature profile,based on a thermal
gradient of 30°C/km
UMIIVIK-1
Contact effectsaround intrusions in
Umivik-1
GC883-2
Eocene-Oligocene(40-30 Ma)
Late Miocene(~10 Ma)
Latest Miocene to Pliocene(7-2 Ma)
Paleothermal events colour coded, viz:
AFTA resolves only a singleevent, shown in pale blue. (U-Th)/He data sugges t two events,
as shown.
100-30 Ma
Figure 5.4a: Paleotemperature constraints from AFTA, (U-Th)/He and VR data, plotted against depth (with respect to kb) in West Greenland Borehole Umiivik-1. See text for details.

91
Geotrack Report #883: Thermal History reconstruction in five boreholes, Onshore West Greenland
0.5
1.5
1.0
2.0
2.5
0.0
AFTA sample horizon (with sample number)
Estimates of maximum post-depositional paleotemperaturesfrom AFTA
Maximum paleotemperature from VR
3.0
Temperature (°C)
3.5
26024020 40 60 80 100 120 140 160 180 2000 220
GC883-3
Assumed present-daytemperature profile,based on a thermal
gradient of 30°C/km
GANE-1
Paleothermal events colour coded, viz:Eocene-Oligocene(40-30 Ma)
Late Miocene(~10 Ma)
Latest Miocene to Pliocene(7-2 Ma)
Figure 5.4b: Paleotemperature constraints from AFTA, (U-Th)/He and VR data, plotted against depth (with respect to kb) in West Greenland Borehole Gane-1. See text for details.

92
Geotrack Report #883: Thermal History reconstruction in five boreholes, Onshore West Greenland
0.5
1.5
1.0
2.0
2.5
0.0
AFTA sample horizon (with sample number)
Estimates of maximum post-depositional paleotemperaturesfrom AFTA
Maximum paleotemperature from VR
3.0
Temperature (°C)
3.5
26024020 40 60 80 100 120 140 160 180 2000 220
GC883-4
GC883-5
Assumed present-daytemperature profile,based on a thermal
gradient of 30°C/km
GANT-1
Paleothermal events colour coded, viz:
AFTA resolves only a singleevent, shown in pale blue.
(U-Th)/He data suggest twoevents, as shown.
Eocene-Oligocene(40-30 Ma)
Late Miocene(~10 Ma)
Latest Miocene to Pliocene(7-2 Ma)
Figure 5.4c: Paleotemperature constraints from AFTA, (U-Th)/He and VR data, plotted against depth (with respect to kb) in West Greenland Borehole Gant-1. See text for details.
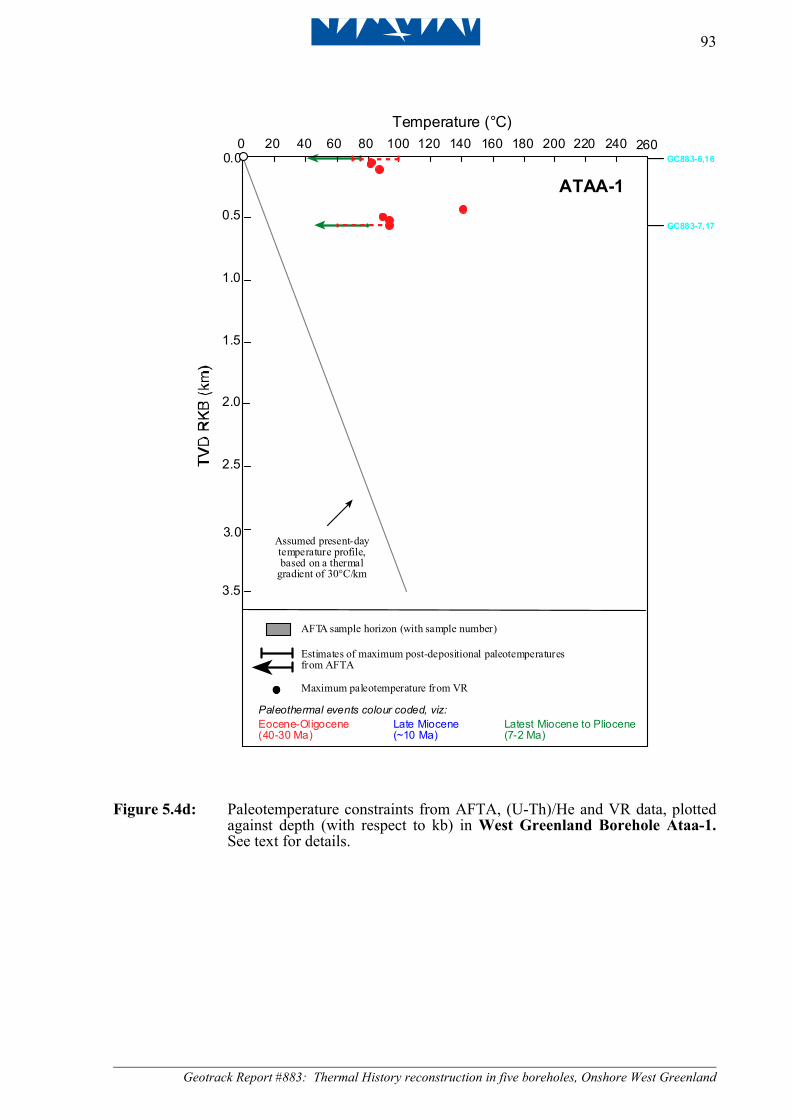
93
Geotrack Report #883: Thermal History reconstruction in five boreholes, Onshore West Greenland
0.5
1.5
1.0
2.0
2.5
0.0
AFTA sample horizon (with sample number)
Estimates of maximum post-depositional paleotemperaturesfrom AFTA
Maximum paleotemperature from VR
3.0
Temperature (°C)
3.5
26024020 40 60 80 100 120 140 160 180 2000 220
GC883-7,17
Assumed present-daytemperature profile,based on a thermal
gradient of 30°C/km
ATAA-1
Paleothermal events colour coded, viz:
GC883-6,16
Eocene-Oligocene(40-30 Ma)
Late Miocene(~10 Ma)
Latest Miocene to Pliocene(7-2 Ma)
Figure 5.4d: Paleotemperature constraints from AFTA, (U-Th)/He and VR data, plotted against depth (with respect to kb) in West Greenland Borehole Ataa-1. See text for details.

94
Geotrack Report #883: Thermal History reconstruction in five boreholes, Onshore West Greenland
0.5
1.5
1.0
2.0
2.5
0.0
AFTA sample horizon (with sample number)
Estimates of maximum post-depositional paleotemperaturesfrom AFTA
Maximum paleotemperature from VR
3.0
Temperature (°C)
3.5
26024020 40 60 80 100 120 140 160 180 2000 220
GC883-8
GC883-9
GC883-10
GC883-11
GC883-12
GC883-13
GC883-14Assumed present-daytemperature profile,based on a thermal
gradient of 30°C/km
GRO-3
Paleothermal events colour coded, viz:
AFTA resolves only a singleevent, shown in pale blue.(U-Th)/He data suggest two
events, as shown.
Eocene-Oligocene(40-30 Ma)
Late Miocene(~10 Ma)
Latest Miocene to Pliocene(7-2 Ma)
Figure 5.4e: Paleotemperature constraints from AFTA, (U-Th)/He and VR data, plotted against depth (with respect to kb) in West Greenland Borehole Gro-3. See text for details.

95
Geotrack Report #883: Thermal History reconstruction in five boreholes, Onshore West Greenland
3 5
4
0.5
1.5
1.0
2.0
2.5
0.0
AFTA sample horizon (with sample number)
Estimates of maximum post-depositional paleotemperaturesfrom AFTA
Maximum paleotemperature from VR
3.0
3.5
1
2
Suggested Eocenepaleotemperature
profile based on datafrom the Gant-1
borehole
Assumed present-daytemperature profile,based on a thermal
gradient of 30°C/km
13
14
Temperature (°C)26024020 40 60 80 100 120 140 160 180 2000 220
EOCENEUMIIVIK-1GANE-1GANT-1
GRO-3ATAA-1
6
7
10
11
12
8
9
Suggested Eocenepaleotemperature profilebased on data from the
Umiivik-1, Gane-1 and Gro-3 boreholes and outcrop
sample GC861-13
GC861-13
13
Figure 5.5: Eocene - Oligocene paleotemperature constraints from AFTA, (U-Th)/He and VR data in five West Greenland Boreholes and one outcrop sample from the Itilli Valley, plotted against depth or elevation with respect to mean sea level. See text for details.

96
Geotrack Report #883: Thermal History reconstruction in five boreholes, Onshore West Greenland
5
4
0.5
1.5
1.0
2.0
2.5
0.0
AFTA sample horizon (with sample number)
Estimates of maximum post-depositional paleotemperaturesfrom AFTA
Maximum paleotemperature from VR
3.0
3.5
2
Assumed present-daytemperature profile,based on a thermal
gradient of 30°C/km
13
14
Temperature (°C)26024020 40 60 80 100 120 140 160 180 2000 220
LATE MIOCENEUMIIVIK-1GANE-1GANT-1
GRO-3ATAA-1
6
7
10
11
12
8
9
Suggested Late Miocenepaleotemperature profiles
based on data from theGane-1 and Gro-3 boreholes,the Gant-1 borehole, and the
Umiivik-1 borehole andoutcrop sample GC861-13.
31
GC861-13
13
Figure 5.6: Late Miocene paleotemperature constraints from AFTA and (U-Th)/He data in five West Greenland Boreholes and one outcrop sample from the Itilli Valley, plotted against depth or elevation with respect to mean sea level. See text for details.

97
Geotrack Report #883: Thermal History reconstruction in five boreholes, Onshore West Greenland
0.5
1.5
1.0
2.0
2.5
0.0
3.0
Temperature (°C)
3.5
26024020 40 60 80 100 120 140 160 180 2000 220
Assumed present-daytemperature profile,based on a thermal
gradient of 30°C/km
AFTA sample horizon (with sample number)
Estimates of maximum post-depositional paleotemperatures from AFTA
5
4
3
10
11
12
13
14
9
8
LATE MIOCENE
GANE-1GANT-1GRO-3
1
2
Suggested Late Miocenepaleotemperature profilesbased on data from theUmiivik-1, Gane-1 and
Gro-3 and Gant-1 boreholes
4.0
GC861-13
UMIIVIK-1
13
Figure 5.7: Late Miocene paleotemperature constraints from AFTA and (U-Th)/He data in five West Greenland Boreholes and one outcrop sample from the Itilli Valley, plotted against depth with respect to the prominent erosion surface recognised across the Nuussuaq Peninsula at elevations around 1000 metres above sea level. See text for details.

98
Geotrack Report #883: Thermal History reconstruction in five boreholes, Onshore West Greenland
0.5
1.5
1.0
2.0
2.5
0.0
3.0
Temperature (°C)
3.5
26024020 40 60 80 100 120 140 160 180 2000 220
AFTA sample horizon (with sample number)
Estimates of maximum post-depositional paleotemperatures from AFTA
5
4
3
10
11
12
13
14
9
8
LATEST MIOCENETO PLIOCENE
1
2Present-day temperature
profile based on anassumed thermal
gradient of 30°C/km
4.0
GANE-1GANT-1GRO-3GC861-13
UMIIVIK-1
13
Figure 5.8: Latest Miocene to Pliocene paleotemperature constraints from AFTA and (U-Th)/He data in five West Greenland Boreholes and one outcrop sample from the Itilli Valley, plotted against depth with respect to the prominent erosion surface recognised across the Nuussuaq Peninsula at elevations around 1000 metres above sea level. See text for details

99
Geotrack Report #883: Thermal History reconstruction in five boreholes, Onshore West Greenland
6. Paleogeothermal gradients and removed section
6.1 Introduction
The availability of paleotemperature constraints from a range of depths and sample elevations for the various paleo-thermal episodes identified in this study allows the possibility of obtaining constraints on paleogeothermal gradients during those episodes, as explained in Section 2.4 and in Appendix C (this discussion is presented in terms of depth, but the same principles apply to data as a function of sample elevation). This, in turn, allows more accurate estimation of the amounts of removed section required to explain the paleotemperature constraints obtained from the AFTA, (U-Th)/He and VR data, as explained in Section 2.5 and Appendix C.
In this Section, we present the results of these analyses, in terms of the ranges of both paleogeothermal gradient and removed section indicated by the paleotemperature constraints illustrated in Figures 5.4 through 5.8. This is followed by a discussion of the implications of these results for the underlying geological processes responsible for producing the paleotemperatures in the three episodes. Section 7 then uses the constraints on paleogeothermal gradients and removed section to reconstruct thermal and burial/exhumation histories in the Gro-3 borehole (assumed to typify the region).
6.2 Quantitative estimation of paleogeothermal gradients
Using the approach outlined in Section 2.4 and methods explained in Appendix C (Section C.9), we have determined the range of paleogeothermal gradients consistent with paleotemperature constraints in each of the three paleo-thermal episodes identified from AFTA, (U-Th)/He dating and VR data, for a variety of combinations of data, as summarised in Table 6.1.
The corresponding likelihood profiles from which these constraints are taken are shown in Figures 6.1 through 6.10 for paleotemperatures characterising the Eocene - Oligocene (40 to 30 Ma) episode (Figures 6.1 through 6.4), Late Miocene (11-10 Ma) episode (Figures 6.5, 6.6, 6.7 and 6.8) and latest Miocene to Pliocene (7 to 2 Ma) episode (Figure 6.9 and 6.10). In most cases, the likelihood profiles for paleogeothermal gradients in these Figures show a good quadratic form, characteristic of a well-defined dataset, with a relatively narrow range of allowed paleo-gradients in each case. Noteable exceptions to this are the Late Miocene and latest Miocene to Pliocene paleotemperatures in the Gro-3 borehole (Figures 6.5 and

100
Geotrack Report #883: Thermal History reconstruction in five boreholes, Onshore West Greenland
6.9, respectively), which are “flat-topped’ due to relatively broad paleotemperature constraints, many of which are either minimum or maximum values. In these cases, while a unique estimate of the maximum likelihood value is not possible, the 95% confidence limits are still valid and provide useful limits on the range of allowed values.
Eocene-Oligocene episode
Constraints on paleogeothermal gradients during the Eocene-Oligocene episode based on data from the Gro-3 borehole, from these combined with results from Gane-1, and from the combination of both of these plus data from Umiivik-1 and outcrop sample GC861-13, as summarised in Table 6.1, are all consistently higher than the assumed present-day value of 30°C/km. Maximum likelihood values are in the range 40 to 50°C/km, while 95% confidence limits are relatively narrow in each case (between ±4 and ±10°C/km).
Given the relative proximity of Gro-3, Gane-1 and the outcrop location of sample from which GC861-13 was taken, combining these estimates into a single analysis seems readily justified. However the Umiivik-1 borehole is separated from these by a distance of ~100 km, so combination of these paleotemperature constraints may be more dubious. But given the consistency in all the paleotemperature constraints (Figure 5.5), and the close similarity between the estimated paleo-gradients with and without the Umiivik-1 data (inclusion of which merely improves the precision of the estimate), combining the data in this way seems reasonable, and we consider the result based on the combination of data from Gro-3, Gane-1, Umiivik-1 and GC861-13 provides the most reliable estimate of the paleogeothermal gradient during the Eocene - Oligocene episode.
Paleotemperature constraints from the Gant-1 borehole (which are offset to higher values compared to data form the other boreholes, as shown in Figure 5.5) provide a maximum likelihood estimate of 44.5°C/km which is very similar to those from the other boreholes, though with wider uncertainties (Table 6.1). Based on the regional consistency in data from the other boreholes, we conclude that paleogeothermal gradients in Gant-1 were likely to have been very similar to those in Gro-1, Gane-1 and Umiivik-1, with a common interpretation applicable to all.
Since the entire range of allowed paleogeothermal gradients in this episode is higher than the assumed present-day value of 30°C/km, an explanation of the observed paleotemperatures in terms of a combination of deeper burial and elevated basal heat flow is suggested. This is discussed further in Section 6.4.

101
Geotrack Report #883: Thermal History reconstruction in five boreholes, Onshore West Greenland
Late Miocene episode
Paleotemperature constraints during the Late Miocene episode from the Gro-3 borehole alone provide only a broad range of allowed paleogeothermal gradients (Table 6.1), and the maximum likelihood value based on data from Gro-3 has little meaning due to the “flat-topped” likelihood profile (Figure 6.5), and should be given little credence. In contrast, results based on the combination of data from all boreholes and sample GC861-13 provide much tighter constraints (Figures 6.6, 6.7 and 6.8), due largely to paleotemperature constraints being available over a wider range of depths. Analysing this combined dataset either in relation to depths from sea level or in relation to the regional Neogene erosion surface results in maximum likelihood values around 35 to 40°C/km, with uncertainties of around ±10°C/km in each case (Table 6.1). Due to the apparent systematic difference between results from Gant-1 and the other boreholes (Figure 5.7 and Section 5.2), we have analysed the combined dataset from all boreholes plus sample GC861-13 (Figure 6.7) and also this dataset after the Gant-1 data have been omitted (Figure 6.8), to assess the extent to which the Gant-1 data may bias the results of the analysis.
The validity of the estimated paleogeothermal gradients derived from these combined datasets depends critically on the assumption that the present-disposition of the sampled sedimentary units with respect to the specified reference level (i.e. sea level or the erosion surface) accurately reflects the situation at the time that the section began to cool from the paleo-thermal peak in each episode. Based on the relatively shallow dips across the region at the present-day, and the uniformity of the paleo-thermal effects identified in this section, this assumption seems reasonable.
When the combined Late Miocene paleotemperatures are analysed with respect to depth from sea level (Figure 6.6), the range of allowed paleogeothermal gradients encompasses the assumed present-day value of 30°C/km, and thus an explanation of heating in this episode being purely to deeper burial is possible. However, when analysed with respect to depth below the erosion surface (Figures 6.7, 6.8), the present-day value of 30°C/km lies below the lower 95% confidence limit, and a combination of some degree of elevated heat flow, combined with smaller amounts of deeper burial, is required. These aspects of the results are discussed further in Section 6.4.
Latest Miocene to Pliocene episode
As with the Late Miocene episode (above), paleotemperature constraints during the latest Miocene to Pliocene episode from the Gro-3 borehole alone also provide only a

102
Geotrack Report #883: Thermal History reconstruction in five boreholes, Onshore West Greenland
broad range of allowed paleogeothermal gradients (Table 6.1), and the maximum likelihood value based on data from Gro-3 has little meaning due to the “flat-topped” likelihood profile (Figure 6.9). In contrast, results based on the combination of data from all boreholes and sample GC861-13 provide much tighter constraints (Figure 6.10), due largely to paleotemperature constraints being available over a wider range of depths. Analysing either the Gro-3 data alone in terms of depth from kb, or the combined dataset in relation to depth below the regional Neogene erosion surface, results in maximum likelihood values slightly less than 30°C/km, with uncertainties between ±6 and ±20°C/km (Table 6.1).
Similar comments regarding the validity of estimates based on the combined dataset to those provided in relation to the Late Miocene episode (previous page) also apply to this episode. For reasons discussed in relation to the Late Miocene episode, we regard the combined dataset as providing a reliable representation of the paleo-thermal conditions at the latest Miocene to Pliocene paleo-thermal peak. On this basis, the range of allowed paleogeothermal gradients from 22.5 to 34.0°C/km, with a maximum likelihood value of 28°C/km, derived from the combined dataset, is taken as typifying this episode across the region. This range encompasses the assumed present-day thermal gradient of 30°C/km, and thus an explanation of heating in this episode being purely to deeper burial is possible. With an upper limit of 34°C.km, interpretations based on significantly elevated basal heat flow in this episode can be eliminated. Further discussion of the processes responsible for producing the Latest Miocene to Pliocene paleo-thermal effects are discussed in Section 6.4.
Paleogeothermal gradient synthesis
Figure 6.11 shows the constraints on paleogeothermal gradients in different episodes from Table 6.1 plotted as a function of the timing of cooling in each episode. A clear trend is evident in this plot suggesting a general decrease in gradient through time, particularly if we focus on the most reliable estimates for each episode, which are shown in red in each case. While the width of the allowed ranges of paleo-gradients in each episode would allow a variety of different interpretations, such a trend might be expected in a volcanic province such as West Greenland. Further discussion on related issues is provided in Section 3.4.

103
Geotrack Report #883: Thermal History reconstruction in five boreholes, Onshore West Greenland
6.3 Estimation of removed section
Introduction
The results presented in the previous sections provide good constraints on the timing and magnitude of paleo-thermal effects and the range of possible paleogeothermal gradients, in three paleo-thermal episodes recognised across West Greenland. But as emphasised in Section 2.5, estimation of amounts of removed section are more speculative, as this depends critically on several key assumptions. The principal difficulty lies with definition of the paleogeothermal gradient through the removed section, which cannot be constrained by direct measurement and must therefore always be assumed (this is true of all paleo-thermal methods of estimating former burial depths). In deriving estimates of removed section for each of the paleo-thermal episodes recognised in the well, the paleogeothermal gradient through the removed section is therefore assumed to have been linear and equal to the value through the preserved section. This assumption may be invalid if the elevated paleotemperatures are caused by processes involving lateral or local introduction of heat, such as by confined fluid flow or igneous intrusion. The only evidence of such effects in this study is in the contact heating effects revealed by VR data from the Umiivik-1 borehole. But as the Eocene-Oligocene maximum paleotemperatures recognised from AFTA and other data clearly post-date the main (Paleocene – Early Eocene) intrusive episode, such effects can be ignored in this study.
Paleo-surface temperatures of 20°C, 10°C and 0°C, respectively, have been assumed for the Eocene-Oligocene, Late Miocene and latest Miocene to Recent episodes, in order to estimate amounts of removed section. Changing the value of paleo-surface temperature is equivalent to a constant offset in the amount of missing section required in order to explain the observed paleotemperatures. The influence of this factor is discussed further below.
Despite the various assumptions involved, it should be stressed that because the estimated amounts of removed section are derived from fits to the paleotemperature data, thermal history reconstructions based on these values will reliably reproduce the main features of the thermal history interpretations of the AFTA and VR data on which they are based (although resulting burial history reconstructions may still be speculative).

104
Geotrack Report #883: Thermal History reconstruction in five boreholes, Onshore West Greenland
Choice of appropriate reference level for estimating removed section
On the basis of the above, if we assume that the paleogeothermal gradient was linear throughout the entire section at the time of maximum paleotemperatures, extrapolation of the fitted linear profile from the appropriate unconformity (i.e. that corresponding to the interval during which cooling began) to an assumed paleo-surface temperature provides an estimate of the amount by which that unconformity surface was more deeply buried, and hence the amount of section that has since been removed by erosion (Figure C.10, Appendix C).
By the same principles, this analysis can be extended to determine the amount by which any arbitrarily chosen reference level was buried at the time represented by the appropriate paleotemperature constraints. Therefore while data from individual wells has been analysed in terms of depth below the unconformity at the present-day ground surface, representing the time interval 61 Ma or older to 0 Ma, combined datasets from various wells have been analysed in terms of depths either from present-day sea level or from the regional Neogene erosion surface. In the case of analysis with respect to sea level, the resulting analysis provides an estimate of the amount of sediment that was present above modern-day sea level at the paleo-thermal peak or maximum, not all of which may have been removed (if rock is still present above sea level at that site today). Similarly, analysis in terms of depth below the Neogene erosion surface provides estimates of the amount by which rocks presently at the level of that surface were more deeply buried at the paleo-thermal peak or maximum.
Results
Given all the assumptions which underlie this analysis, application of the methods described in Section 2.5 gives estimates of the amounts of removed section required to explain the observed Eocene-Oligocene paleotemperatures, for various data combinations, as summarised in Table 6.2. Tables 6.3 and 6.4 summarise similar information for the Late Miocene and latest Miocene to Pliocene episodes. Maximum likelihood estimates of removed section are quoted corresponding to the maximum likelihood estimates of paleogeothermal gradient, together with related ±95% confidence limits derived from the likelihood profiles shown in the upper right position in Figures 6.1 through 6.10. In addition, ranges of removed section (again corresponding to ±95% confidence limits) are quoted for various specified values of paleogeothermal gradient within the allowed range of values. These are taken from the lower plots in Figures 6.1 through 6.10, which illustrates the correlation between

105
Geotrack Report #883: Thermal History reconstruction in five boreholes, Onshore West Greenland
values of paleogeothermal gradient and removed section allowed by the paleotemperature constraints characterising each episode within ±95% confidence limits. That is, for the appropriate episode, any set of paired values inside the contoured region of these plots are compatible with the corresponding paleotemperature data at 95% confidence limits, with higher paleogeothermal gradients requiring correspondingly less removed section, and vice versa.
Eocene-Oligocene episode
As discussed in relation to paleogeothermal gradients in Section 6.2, the combined Eocene-Oligocene dataset incorporating results from Gro-3, Gane-1, Umiivik-1 and GC861-13 is regarded as providing the most reliable representation of the Eocene-Oligocene episode. For paleogeothermal gradients between 45 and 50°C/km in this episode, burial to a level between 1350 and 1650 metres above present-day sea level is required to explain the observed paleotemperatures. Since all these sites are located where the present-day ground surface is at elevations of less than 120 metres, this approximates closely to the amount of missing section at these sites.
Estimates of the amount of removed section at the Gant-1 site, for similar paleo-gradients, are in the range 1400 to 1800 metres (Table 6.2 - note this is the total missing section from ground surface in Gant-1), which overlaps closely with the 1350 to 1650 metres required at the other locations. This suggests that the offset in the Eocene-Oligocene paleotemperatures in Gant-1 in Figure 5.5, compared to other boreholes, reflects uplift of the Gant-1 site with respect to other locations, with a similar amount of section removed at all locations. This could form a focus of future landscape studies in the region.
Late Miocene episode
We suggested in relation to paleogeothermal gradients in Section 6.2 that analysing the combined Late Miocene dataset incorporating results from Gro-3, Gane-1, (possibly Gant-1), Umiivik-1 and GC861-13 provides the most reliable representation of the Late Miocene episode. From the combination of all data, for a Late Miocene paleogeothermal gradient of 30°C/km, the results shown in Figure 6.6 and summarised in Table 6.3 show that sedimentary cover must have extended to a total of between 1650 and 2250 metres above sea level at ~10 Ma. Alternatively, analysing these data in terms of depth from the Neogene erosion surface (Figure 6.7) shows that assuming a Late Miocene paleogeothermal gradient of 30°C/km, the present-day level of this erosion surface must have been buried by between 350 and 950 metres of rock at 10 Ma.

106
Geotrack Report #883: Thermal History reconstruction in five boreholes, Onshore West Greenland
However, if the Gant-1 data are excluded, a paleogeothermal gradient of 30°C/km is not allowed (Figure 6.8), although higher paleogeothermal gradients are allowed. The results in Figure 6.8 and Table 6.3 show that for a Late Miocene paleo-gradient of 35°C/km, the more restricted dataset (i.e. excluding Gant-1) could be explained by between 350 and 550 metres of burial on top of the Neogene erosion surface. Clearly, a variety of scenarios can be invoked to explain the Late Miocene paleotemperatures, and integration with regional data will be required in order to define the origin of this episode in more detail.
Latest Miocene to Pliocene episode
Results from the Gro-3 borehole in isolation provide only very broad constraints in this episode (Figure 6.9). But as above, the combined latest Miocene to Pliocene dataset incorporating results from Gro-3, Gane-1, Gant-1, Umiivik-1 and GC861-13 is considered as providing the most reliable representation of this episode. Analysing these data in terms of depth from the Neogene erosion surface shows (Figure 6.10, Table 6.4) that the latest Miocene to Pliocene paleotemperatures can be explained by a paleogeothermal gradient of 30°C/km and zero burial on top of the present-day level of this erosion surface (although up to 350 metres of burial would be allowed). In other words, the latest Miocene to Pliocene paleotemperatures extrapolate back to a surface temperature of 0°C at the present-day level of the Neogene erosion surface and the amount of missing section required to explain these paleotemperatures corresponds exactly to the present-day erosional relief across the region. Thus, cooling in this most recent episode can be correlated directly with incision of the present-day relief into the Neogene erosion surface. This effectively dates the development of this relief to the period following the onset of cooling in the latest Miocene to Pliocene paleo-thermal episode, which began some time in the interval 7 to 2 Ma.
Effects of changing paleo-surface temperature
Note that use of the specified paleo-surface temperatures is a convenient simplification, and it is possible that higher or lower values may be more appropriate during any of the paleo-thermal episodes. Detailed discussion of this issue is beyond the scope of this study. But the magnitude of removed section required to explain the observed paleotemperatures can be easily adjusted to an alternative paleo-surface temperature by subtracting or adding the difference in depth equivalent to the change in paleo-surface temperature, for the appropriate paleo-gradient, as described in Section 2.5. For example, increasing the paleo-surface temperature by 10°C, for a
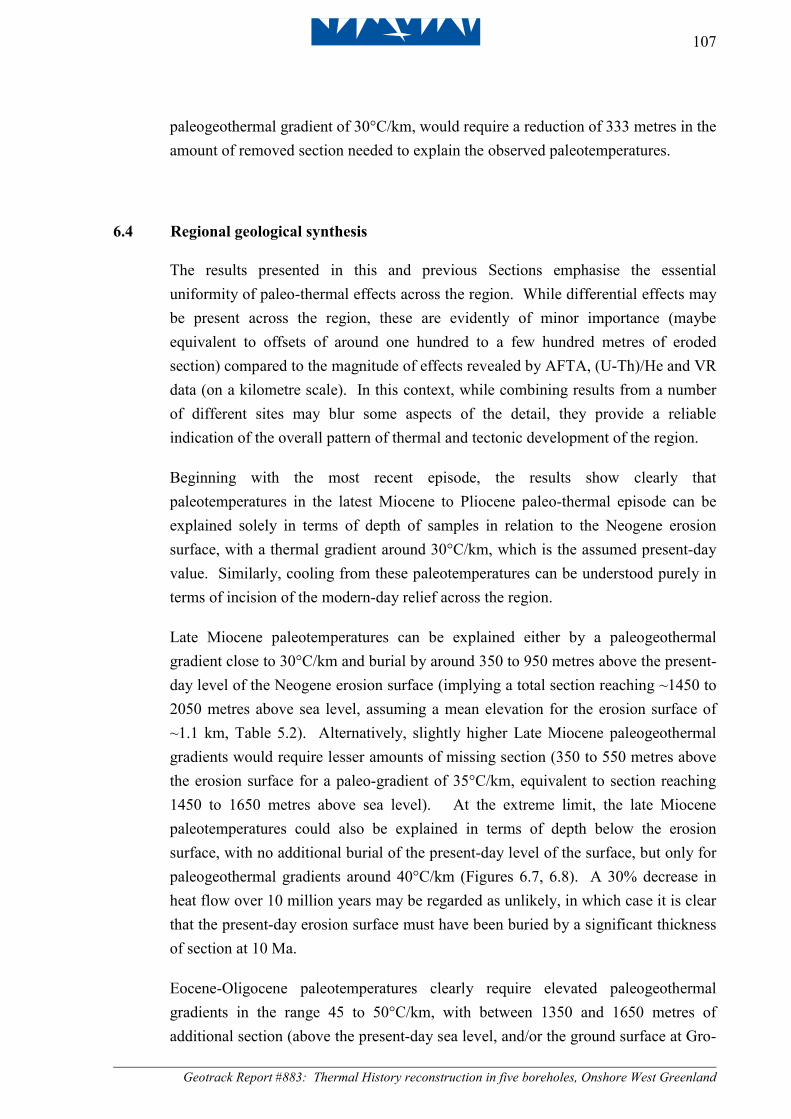
107
Geotrack Report #883: Thermal History reconstruction in five boreholes, Onshore West Greenland
paleogeothermal gradient of 30°C/km, would require a reduction of 333 metres in the amount of removed section needed to explain the observed paleotemperatures.
6.4 Regional geological synthesis
The results presented in this and previous Sections emphasise the essential uniformity of paleo-thermal effects across the region. While differential effects may be present across the region, these are evidently of minor importance (maybe equivalent to offsets of around one hundred to a few hundred metres of eroded section) compared to the magnitude of effects revealed by AFTA, (U-Th)/He and VR data (on a kilometre scale). In this context, while combining results from a number of different sites may blur some aspects of the detail, they provide a reliable indication of the overall pattern of thermal and tectonic development of the region.
Beginning with the most recent episode, the results show clearly that paleotemperatures in the latest Miocene to Pliocene paleo-thermal episode can be explained solely in terms of depth of samples in relation to the Neogene erosion surface, with a thermal gradient around 30°C/km, which is the assumed present-day value. Similarly, cooling from these paleotemperatures can be understood purely in terms of incision of the modern-day relief across the region.
Late Miocene paleotemperatures can be explained either by a paleogeothermal gradient close to 30°C/km and burial by around 350 to 950 metres above the present-day level of the Neogene erosion surface (implying a total section reaching ~1450 to 2050 metres above sea level, assuming a mean elevation for the erosion surface of ~1.1 km, Table 5.2). Alternatively, slightly higher Late Miocene paleogeothermal gradients would require lesser amounts of missing section (350 to 550 metres above the erosion surface for a paleo-gradient of 35°C/km, equivalent to section reaching 1450 to 1650 metres above sea level). At the extreme limit, the late Miocene paleotemperatures could also be explained in terms of depth below the erosion surface, with no additional burial of the present-day level of the surface, but only for paleogeothermal gradients around 40°C/km (Figures 6.7, 6.8). A 30% decrease in heat flow over 10 million years may be regarded as unlikely, in which case it is clear that the present-day erosion surface must have been buried by a significant thickness of section at 10 Ma.
Eocene-Oligocene paleotemperatures clearly require elevated paleogeothermal gradients in the range 45 to 50°C/km, with between 1350 and 1650 metres of additional section (above the present-day sea level, and/or the ground surface at Gro-

108
Geotrack Report #883: Thermal History reconstruction in five boreholes, Onshore West Greenland
3, Gane-1 and Umiivik-1). This amount of missing section is less than that required to explain the Late Miocene paleotemperatures (~1650 to 2250 metres of section above sea level for a paleo-gradient of 30°C/km, or 1250 to 1850 metres for 35°C/km). Thus, for likely values of Late Miocene paleogeothermal gradient, the amount of additional burial required in the Late Miocene is higher than (or perhaps close to) the amount required in the Eocene-Oligocene episode. This implies that cooling in this earliest episode may not represent a discrete episode of exhumation but may simply reflect the decreasing basal heat flow, possibly combined with a paleo-climate effect involving a decrease in paleo-surface temperature. These aspects of the history of the region are discussed in greater detail in Section 7.

109
Geotrack Report #883: Thermal History reconstruction in five boreholes, Onshore West Greenland
Table 6.1: Paleogeothermal gradient estimates, West Greenland boreholes (Geotrack Report #883)
Paleo-thermal episode
Constraints Maximum Likelihood Estimate (°C/km)
Lower 95% confidence
limit (°C/km)
Upper 95% confidence
limit (°C/km)
Eocene-Oligocene (40 to 30 Ma)
Gro-3 Gro-3 and Gane-1 Gro-3, Gane-1, Umiivik-1 and GC861-13 Gant-1
40.5
46.0
47.5
44.5
35.0
40.0
43.5
32.5
45.5
51.5
52.0
57.0
Late Miocene (11-10 Ma)
Gro-3 All boreholes and GC861-13 (wrt sea level) All boreholes and GC861-13 (wrt erosion surface) All except Gant-1 (wrt erosion surface)
52.0*1
35.5
40.0
40.5
25.5
25.5
27.0
34.5
87.0
47.5
56.0
48.0
Latest Miocene to Pliocene (7 to 2 Ma)
Gro-3 All boreholes and GC861-13 (wrt erosion surface)
28.5*1
28.0
17.5
22.5
50.0
34.0
*1 Paleogeothermal gradients estimated from paleotemperature constraints derived from AFTA, (U-Th)/He dating and selected VR data, using methods described in Section 2.4.
*2 These maximum likelihood values are not well defined, due to the width of the paleotemperatures constraints from AFTA, but upper and lower limits are still valid.

110
Geotrack Report #883: Thermal History reconstruction in five boreholes, Onshore West Greenland
Table 6.2 Removed section estimates, Eocene - Oligocene episode: West Greenland boreholes (Geotrack Report #883)
Gro-3*1 Gro-3 and
Gane-1*2 Gro-3,
Gane-1, Umiivik-1
and GC861-13*2
Gant-1*1
Maximum Likelihood estimate of removed section (metres)
2050
1600
1450
1700
Lower and upper 95% confidence limits (metres)
1650-2550
1300-1950
1300-1700
1250-2550
Removed section values corresponding to specified paleogeothermal gradients*3
10°C/km not allowed not allowed not allowed not allowed 20°C/km not allowed not allowed not allowed not allowed 30°C/km not allowed not allowed not allowed ~2750 35°C/km 2500-2700 not allowed not allowed 2300-2450 40°C/km 1950-2150 1900-2100 not allowed 1900-2100 45°C/km 1650-1750 1500-1700 1550-1650 1600-1800 50°C/km not allowed 1350-1450 1350-1450 1400-1600 60°C/km not allowed not allowed not allowed not allowed
*1 Removed section estimated with respect to the unconformity at the present-day ground surface in each well (i.e. total removed section), assuming a mean surface temperature of 20°C.
*2 “Removed section” estimated with respect to sea level – i.e. the amount of sediment above present-day sea level at the time that cooling from maximum paleotemperatures began, assuming a mean surface temperature of 20°C.
*3 From Figures 6.1, 6.2, 6.3, 6.4. Notes: Determination of the amount of removed section depends on the assumption that paleogeothermal gradients were linear through both the removed section and the preserved section, in each well. This assumption will not be valid if heating involved non-linear paleogeothermal gradients, which may result either because of vertical contrasts in thermal conductivity through the section, or if heating was not directly related to depth of burial but was due e.g. to hot fluid circulation. In such cases, the estimates quoted here are likely to over-estimate true amounts of removed section. The quoted values are based on an assumed paleo-surface temperature of 20°C. These can easily be converted to apply to other values, by subtracting or adding the difference in depth equivalent to the change in paleo-surface temperature, for the appropriate paleo-gradient. For example, for a paleogeothermal gradient of 50°C/km, an increase of 10°C in the paleo-surface temperature is equivalent to a reduction of 200 metres in the amount of removed section.

111
Geotrack Report #883: Thermal History reconstruction in five boreholes, Onshore West Greenland
Table 6.3 Removed section estimates, Late Miocene episode: West Greenland boreholes (Geotrack Report #883)
Gro-3*1 All boreholes
and GC861-13 (wrt sea
level)*2
All boreholes and GC861-
13 (wrt erosion
surface)*3
All boreholes except
GANT-1, and GC861-13
(wrt erosion surface)*3
Maximum Likelihood estimate of removed section (metres)
-*4
1550
0
-*4
Lower and upper 95% confidence limits (metres)
0-1900
1000-2450
0-950
0-500
Removed section values corresponding to specified paleogeothermal gradients*5
20°C/km not allowed not allowed not allowed not allowed 25°C/km not allowed 2250-2700 not allowed not allowed 30°C/km 1950-2350 1650-2250 350-950 not allowed 35°C/km 1450-1800 1250-1850 0-500 350-550 40°C/km 1050-1450 1050-1550 <250 50-350 45°C/km 750-1100 950-1250 not allowed <50 50°C/km 500-900 850-1050 not allowed not allowed 60°C/km 150-450 not allowed not allowed not allowed 70°C/km <150 not allowed not allowed not allowed
*1 Removed section estimated with respect to the unconformity at the present-day ground surface in each well (i.e. total removed section), assuming a mean surface temperature of 10°C.
*2 “Removed section” estimated with respect to sea level – i.e. the amount of sediment above present-day sea level at the time that cooling from maximum paleotemperatures began, assuming a mean surface temperature of 10°C.
*3 “Removed section” estimated with respect to erosion surface – i.e. the amount of sediment above the erosion surface at the time that cooling from maximum paleotemperatures began, assuming a mean surface temperature of 10°C.
*4 Maximum likelihood values are not well defined, but upper and lower limits are still valid. *5 From Figures 6.5, 6.6, 6.7, 6.8.
Notes: Determination of the amount of removed section depends on the assumption that paleogeothermal gradients were linear through both the removed section and the preserved section, in each well. This assumption will not be valid if heating involved non-linear paleogeothermal gradients, which may result either because of vertical contrasts in thermal conductivity through the section, or if heating was not directly related to depth of burial but was due e.g. to hot fluid circulation. In such cases, the estimates quoted here are likely to over-estimate true amounts of removed section. The quoted values are based on an assumed paleo-surface temperature of 10°C. These can easily be converted to apply to other values, by subtracting or adding the difference in depth equivalent to the change in paleo-surface temperature, for the appropriate paleo-gradient. For example, for a paleogeothermal gradient of 40°C/km, an increase of 10°C in the paleo-surface temperature is equivalent to a reduction of 250 metres in the amount of removed section.

112
Geotrack Report #883: Thermal History reconstruction in five boreholes, Onshore West Greenland
Table 6.4 Removed section estimates, Latest Miocene to Pliocene episode: West Greenland boreholes (Geotrack Report #883)
Gro-3*1 All boreholes
and GC861-13*2 Maximum Likelihood estimate of removed section (metres)
-*4
-*4
Lower and upper 95% confidence limits (metres)
0-3350
0-1100
Removed section values corresponding to specified paleogeothermal gradients*3
10°C/km not allowed not allowed 20°C/km 1500-3300 not allowed 25°C/km 650-2200 350-850 30°C/km 250-1550 <350 35°C/km <1050 not allowed 40°C/km <650 not allowed 50°C/km <50 not allowed 60°C/km not allowed not allowed
*1 Removed section estimated with respect to the unconformity at the present-day ground surface in each well (i.e. total removed section), assuming a mean surface temperature of 0°C.
*2 “Removed section” estimated with respect to erosion surface– i.e. the amount of sediment above the erosion surface at the time that cooling from maximum paleotemperatures began, assuming a mean surface temperature of 0°C.
*3 From Figures 6.9, 6.10. *4 Maximum likelihood values are not well defined, but upper and lower limits are still valid.
Notes: Determination of the amount of removed section depends on the assumption that paleogeothermal gradients were linear through both the removed section and the preserved section, in each well. This assumption will not be valid if heating involved non-linear paleogeothermal gradients, which may result either because of vertical contrasts in thermal conductivity through the section, or if heating was not directly related to depth of burial but was due e.g. to hot fluid circulation. In such cases, the estimates quoted here are likely to over-estimate true amounts of removed section. The quoted values are based on an assumed paleo-surface temperature of 0°C. These can easily be converted to apply to other values, by subtracting or adding the difference in depth equivalent to the change in paleo-surface temperature, for the appropriate paleo-gradient. For example, for a paleogeothermal gradient of 30°C/km, an increase of 10°C in the paleo-surface temperature is equivalent to a reduction of 333 metres in the amount of removed section.

113
Geotrack Report #883: Thermal History reconstruction in five boreholes, Onshore West Greenland
geothermal gradient (deg. C/km)
log
likel
ihoo
d
34 36 38 40 42 44 46
-26.
0-2
4.5
-23.
0
GRO-3, Eocene episode
40.5
35 45.5
38 43
depth (m)
tem
pera
ture
500 1000 1500 2000 2500
5010
015
020
0
removed section (m)
log
likel
ihoo
d
1600 1800 2000 2200 2400 2600
-25.
5-2
4.0
GRO-3, Eocene episodesurface temperature: 20
2050
1650 2550
1850 2250
depth (m)
tem
pera
ture
-2000 0 1000 2000
5010
020
0
GRO-3, Eocene episode
geothermal gradient (deg. C/km)
rem
oved
sec
tion
(m)
20 30 40 50 60
1000
2000
3000
surface temperature: 20
25002700
19502150
16501750
Figure 6.1: Eocene-Oligocene (40-30 Ma) paleogeothermal gradients & removed
section: West Greenland Borehole GRO-3. Upper: Maximum likelihood profiles of linear paleogeothermal gradient (left) and removed section (right) fitted to Eocene-Oligocene paleotemperature constraints from AFTA and VR data in this borehole. The methodology used to construct these profiles is outlined in Appendix C. In each plot, paleotemperature constraints from AFTA and VR are plotted against depth below the unconformity at the ground surface in this well, also showing the best-fit profile (solid line) and lines (dashed) representing upper and lower 95% confidence limits. In the right-hand plot, the fitted gradients are extrapolated to a paleo-surface temperature of 20°C to determine removed section. Higher paleo-surface temperatures can also be accomodated (see text). Lower: Crossplot of total section removed from the surface unconformity against paleogeothermal gradient, showing the ranges of paired values (within the contoured region) compatible with the Eocene-Oligocene paleotemperatures derived from AFTA and VR data, at the 95% confidence level. The values printed within the plot are amounts of removed section corresponding to ±2σ limits at various values of paleogeothermal gradient. For example, for a paleogeothermal gradient of 40°C/km, between 1950 and 2150 metres of removed section is required in order to honour the paleotemperature constraints.

114
Geotrack Report #883: Thermal History reconstruction in five boreholes, Onshore West Greenland
geothermal gradient (deg. C/km)
log
likel
ihoo
d
40 42 44 46 48 50 52
-57.
5-5
6.5
-55.
5
Gro3 & Gane-1; Eocene
46
40 51.5
43 48.5
depth (m)
tem
pera
ture
500 1000 1500 2000
5010
015
020
0
removed section (m)
log
likel
ihoo
d
1400 1600 1800 2000
-57.
5-5
6.5
-55.
5
Gro3 & Gane-1; Eocenesurface temperature: 20
1600
1300 1950
1450 1750
depth (m)
tem
pera
ture
-2000 -1000 0 1000 2000
5010
020
0
Gro3 & Gane-1; Eocene
geothermal gradient (deg. C/km)
rem
oved
sec
tion
(m)
30 40 50 60 70
1000
2000
surface temperature: 20
1900
2100
13501450
Figure 6.2: Eocene-Oligocene (40-30 Ma) paleogeothermal gradients & removed
section with respect to present-day sea level : West Greenland Boreholes GRO-3 and Gane-1.
Upper: Maximum likelihood profiles of linear paleogeothermal gradient (left) and removed section (right) fitted to Eocene-Oligocene paleotemperature constraints from AFTA and VR data in these boreholes. The methodology used to construct these profiles is outlined in Appendix C. In each plot, paleotemperature constraints from AFTA and VR are plotted against depth below sea level, also showing the best-fit profile (solid line) and lines (dashed) representing upper and lower 95% confidence limits. In the right-hand plot, the fitted gradients are extrapolated to a paleo-surface temperature of 20°C to determine removed section. Higher paleo-surface temperatures can also be accomodated (see text). Lower: Crossplot of total section removed from the surface unconformity against paleogeothermal gradient, showing the ranges of paired values (within the contoured region) compatible with the Eocene-Oligocene paleotemperatures derived from AFTA and VR data, at the 95% confidence level. The values printed within the plot are amounts of removed section corresponding to ±2σ limits at various values of paleogeothermal gradient. For example, for a paleogeothermal gradient of 40°C/km, between 1900 and 2100 metres of removed section is required in order to honour the paleotemperature constraints.

115
Geotrack Report #883: Thermal History reconstruction in five boreholes, Onshore West Greenland
geothermal gradient (deg. C/km)
log
likel
ihoo
d
44 46 48 50 52
-77.
0-7
6.0
-75.
0
, Gane-1, Umiivik-1 & GC861-13; Eo
47.5
43.5 52
45.5 50
depth (m)
tem
pera
ture
0 500 1000 1500 2000 2500
5010
015
020
0
removed section (m)
log
likel
ihoo
d
1300 1400 1500 1600 1700
-77.
5-7
6.0
-74.
5
, Gane-1, Umiivik-1 & GC861-13; Eosurface temperature: 20
1450
1300 1700
1400 1600
depth (m)
tem
pera
ture
-1000 0 1000 2000
5010
020
0
Gro3, Gane-1, Umiivik-1 & GC861-13; Eo
geothermal gradient (deg. C/km)
rem
oved
sec
tion
(m)
30 40 50 60 70
1000
1500
2000
surface temperature: 20
15501650
13501450
Figure 6.3: Eocene-Oligocene (40-30 Ma) paleogeothermal gradients & removed
section with respect to present-day sea level: West Greenland Boreholes GRO-3, Gane-1 and Umiivik-1 and outcrop sample GC861-13.
Upper: Maximum likelihood profiles of linear paleogeothermal gradient (left) and removed section (right) fitted to Eocene-Oligocene paleotemperature constraints from AFTA and VR data in these boreholes. The methodology used to construct these profiles is outlined in Appendix C. In each plot, paleotemperature constraints from AFTA and VR are plotted against depth below sea level, also showing the best-fit profile (solid line) and lines (dashed) representing upper and lower 95% confidence limits. In the right-hand plot, the fitted gradients are extrapolated to a paleo-surface temperature of 20°C to determine removed section. Higher paleo-surface temperatures can also be accomodated (see text). Lower: Crossplot of total section removed from the surface unconformity against paleogeothermal gradient, showing the ranges of paired values (within the contoured region) compatible with the Eocene-Oligocene paleotemperatures derived from AFTA and VR data, at the 95% confidence level. The values printed within the plot are amounts of removed section corresponding to ±2σ limits at various values of paleogeothermal gradient. For example, for a paleogeothermal gradient of 45°C/km, between 1550 and 1650 metres of removed section (above sea level) is required in order to honour the paleotemperature constraints.

116
Geotrack Report #883: Thermal History reconstruction in five boreholes, Onshore West Greenland
geothermal gradient (deg. C/km)
log
likel
ihoo
d
35 40 45 50 55
-40.
0-3
9.0
-38.
0
Gant-1; Eocene
44.5
32.5 57
39 50.5
depth (m)
tem
pera
ture
200 400 600 800
6010
014
0
removed section (m)
log
likel
ihoo
d
1200 1600 2000 2400
-40.
0-3
8.5
Gant-1; Eocenesurface temperature: 20
1700
1250 2550
1450 2050
depth (m)
tem
pera
ture
-2000 -1000 0 1000
5010
015
0
Gant-1; Eocene
geothermal gradient (deg. C/km)
rem
oved
sec
tion
(m)
20 30 40 50 60 70 80
1000
2000
3000
surface temperature: 20
19002100
14001600
Figure 6.4: Eocene-Oligocene (40-30 Ma) paleogeothermal gradients & removed
section: West Greenland Borehole Gant-1. Upper: Maximum likelihood profiles of linear paleogeothermal gradient (left) and removed section (right) fitted to Eocene-Oligocene paleotemperature constraints from AFTA and VR data in this borehole. The methodology used to construct these profiles is outlined in Appendix C. In each plot, paleotemperature constraints from AFTA and VR are plotted against depth below the base-Quaternary unconformity in this well, also showing the best-fit profile (solid line) and lines (dashed) representing upper and lower 95% confidence limits. In the right-hand plot, the fitted gradients are extrapolated to a paleo-surface temperature of 20°C to determine removed section. Higher paleo-surface temperatures can also be accomodated (see text). Lower: Crossplot of total section removed from the surface unconformity against paleogeothermal gradient, showing the ranges of paired values (within the contoured region) compatible with the Eocene-Oligocene paleotemperatures derived from AFTA and VR data, at the 95% confidence level. The values printed within the plot are amounts of removed section corresponding to ±2σ limits at various values of paleogeothermal gradient. For example, for a paleogeothermal gradient of 40°C/km, between 1900 and 2100 metres of removed section is required in order to honour the paleotemperature constraints.

117
Geotrack Report #883: Thermal History reconstruction in five boreholes, Onshore West Greenland
geothermal gradient (deg. C/km)
log
likel
ihoo
d
30 40 50 60 70 80 90
-2.5
-1.5
-0.5
Gro-3, late Miocene
52
25.5 87
34 80
depth (m)
tem
pera
ture
500 1000 1500 2000 2500
5010
020
0
removed section (m)
log
likel
ihoo
d
0 500 1000 1500 2000
-2.0
-1.0
Gro-3, Late Miocenesurface temperature: 10
300
1900
0
depth (m)
tem
pera
ture
-2000 0 1000 2000
5010
020
0
Gro-3, Late Miocene
geothermal gradient (deg. C/km)
rem
oved
sec
tion
(m)
20 30 40 50 60 70 80
050
015
0025
00
surface temperature: 10
1950
2350
1050
1450
500
900
150
450
150
Figure 6.5: Late Miocene (11-10 Ma) paleogeothermal gradients & removed section:
West Greenland Borehole GRO-3. Upper: Maximum likelihood profiles of linear paleogeothermal gradient (left) and removed section (right) fitted to Late Miocene paleotemperature constraints from AFTA and (U-Th)/He in this borehole. The methodology used to construct these profiles is outlined in Appendix C. In each plot, paleotemperature constraints from AFTA and VR are plotted against depth below the unconformity at ground surface in this well, also showing the best-fit profile (solid line) and lines (dashed) representing upper and lower 95% confidence limits. In the right-hand plot, the fitted gradients are extrapolated to a paleo-surface temperature of 10°C to determine removed section. Higher paleo-surface temperatures can also be accomodated (see text). Lower: Crossplot of total section removed from the surface unconformity against paleogeothermal gradient, showing the ranges of paired values (within the contoured region) compatible with the Late Miocene paleotemperatures derived from AFTA data, at the 95% confidence level. The values printed within the plot are amounts of removed section corresponding to ±2σ limits at various values of paleogeothermal gradient. For example, for a paleogeothermal gradient of 30°C/km, between 1950 and 2350 metres of removed section is required in order to honour the paleotemperature constraints.

118
Geotrack Report #883: Thermal History reconstruction in five boreholes, Onshore West Greenland
geothermal gradient (deg. C/km)
log
likel
ihoo
d
25 30 35 40 45
-9.5
-8.5
-7.5
-6.5
Late Miocene (rsl), four boreholes
35.5
25.5 47.5
30.5 40.5
depth (m)
tem
pera
ture
0 500 1000 2000
5010
015
0
removed section (m)
log
likel
ihoo
d
1000 1500 2000 2500
-9.5
-8.5
-7.5
-6.5
Late Miocene (rsl), four boreholessurface temperature: 10
1550
1000 2450
1300 1900
depth (m)
tem
pera
ture
-2000 0 1000 2000
5010
015
0
Late Miocene (rsl), four boreholes
geothermal gradient (deg. C/km)
rem
oved
sec
tion
(m)
20 30 40 50 60 70 80
050
015
0025
00
surface temperature: 10
1650
2250
1050
1550
8501050
Figure 6.6: Late Miocene (11-10 Ma) paleogeothermal gradients & removed section
with respect to sea level: West Greenland Boreholes Umiivik-1, Gane-1, Gant-1 and Gro-3 and outcrop sample GC861-13.
Upper: Maximum likelihood profiles of linear paleogeothermal gradient (left) and removed section (right) fitted to the specified Late Miocene paleotemperature constraints from AFTA and (U-Th)/He. The methodology used to construct these profiles is outlined in Appendix C. In each plot, paleotemperature constraints from AFTA and (U-Th)/He are plotted against depth below sea level, also showing the best-fit profile (solid line) and lines (dashed) representing upper and lower 95% confidence limits. In the right-hand plot, the fitted gradients are extrapolated to a paleo-surface temperature of 10°C to determine removed section. Higher paleo-surface temperatures can also be accomodated (see text). Lower: Crossplot of total section removed against paleogeothermal gradient, showing the ranges of paired values (within the contoured region) compatible with the Late Miocene paleotemperatures derived from AFTA data, at the 95% confidence level. The values printed within the plot are amounts of removed section corresponding to ±2σ limits at various values of paleogeothermal gradient. For example, for a paleogeothermal gradient of 30°C/km, between 1650 and 2250 metres of removed section is required in order to honour the paleotemperature constraints.

119
Geotrack Report #883: Thermal History reconstruction in five boreholes, Onshore West Greenland
geothermal gradient (deg. C/km)
log
likel
ihoo
d
25 30 35 40 45 50 55
-9.5
-8.5
-7.5
Late Miocen (res), four boreholes
40
27 56
33 47.5
depth (m)
tem
pera
ture
1000 2000 3000
5010
015
020
0
removed section (m)
log
likel
ihoo
d
0 200 400 600 800 1000
-9.5
-8.5
-7.5
Late Miocen (res), four boreholessurface temperature: 10
0
950
400
depth (m)
tem
pera
ture
-1000 0 1000 2000 3000 4000
5010
015
0
Late Miocen (res), four boreholes
geothermal gradient (deg. C/km)
rem
oved
sec
tion
(m)
20 30 40 50 60 70 80
050
015
0025
00
surface temperature: 10
350
950
250
Figure 6.7: Late Miocene (11-10 Ma) paleogeothermal gradients & removed section
with respect to the Neogene erosion surface: West Greenland Boreholes Umiivik-1, Gane-1, Gant-1 and Gro-3 and outcrop sample GC861-13.
Upper: Maximum likelihood profiles of linear paleogeothermal gradient (left) and removed section (right) fitted to specified Late Miocene paleotemperature constraints from AFTA and (U-Th)/He. The methodology used to construct these profiles is outlined in Appendix C. In each plot, paleotemperature constraints are plotted against depth below the Neogene erosion surface identified across the region, also showing the best-fit profile (solid line) and lines (dashed) representing upper and lower 95% confidence limits. In the right-hand plot, the fitted gradients are extrapolated to a paleo-surface temperature of 10°C to determine removed section. Higher paleo-surface temperatures can also be accomodated (see text). Lower: Crossplot of total section removed from the erosion surface against paleogeothermal gradient, showing the ranges of paired values (within the contoured region) compatible with the Late Miocene paleotemperatures derived from AFTA and (U-Th)/He data, at the 95% confidence level. The values printed within the plot are amounts of removed section corresponding to ±2σ limits at various values of paleogeothermal gradient. For example, for a paleogeothermal gradient of 30°C/km, between 350 and 950 metres of additonal section above the erosion surface is required in order to honour the paleotemperature constraints.

120
Geotrack Report #883: Thermal History reconstruction in five boreholes, Onshore West Greenland
geothermal gradient (deg. C/km)
log
likel
ihoo
d
34 36 38 40 42 44 46 48
-2.5
-1.5
-0.5
Late Miocene (res), three boreholes
40.5
34.5 48
37.5 44.5
depth (m)
tem
pera
ture
1000 2000 3000
5010
015
0
removed section (m)
log
likel
ihoo
d
0 100 200 300 400 500
-2.5
-1.5
-0.5
Late Miocene (res), three boreholessurface temperature: 10
150
500
0 250
depth (m)
tem
pera
ture
0 1000 2000 3000 4000
5010
015
0
Late Miocene (res), three boreholes
geothermal gradient (deg. C/km)
rem
oved
sec
tion
(m)
20 30 40 50 60 70 80
050
015
0025
00
surface temperature: 10
350550
50
350
50
Figure 6.8: Late Miocene (11-10 Ma) paleogeothermal gradients & removed section
with respect to the Neogene erosion surface: West Greenland Boreholes Umiivik-1, Gane-1 and Gro-3 and outcrop sample GC861-13.
Upper: Maximum likelihood profiles of linear paleogeothermal gradient (left) and removed section (right) fitted to specified Late Miocene paleotemperature constraints from AFTA and (U-Th)/He. The methodology used to construct these profiles is outlined in Appendix C. In each plot, paleotemperature constraints are plotted against depth below the Neogene erosion surface identified across the region, also showing the best-fit profile (solid line) and lines (dashed) representing upper and lower 95% confidence limits. In the right-hand plot, the fitted gradients are extrapolated to a paleo-surface temperature of 10°C to determine removed section. Higher paleo-surface temperatures can also be accomodated (see text). Lower: Crossplot of total section removed from the erosion surface against paleogeothermal gradient, showing the ranges of paired values (within the contoured region) compatible with the Late Miocene paleotemperatures derived from AFTA and (U-Th)/He data, at the 95% confidence level. The values printed within the plot are amounts of removed section corresponding to ±2σ limits at various values of paleogeothermal gradient. For example, for a paleogeothermal gradient of 35°C/km, between 350 and 550 metres of additonal section above the erosion surface is required in order to honour the paleotemperature constraints.

121
Geotrack Report #883: Thermal History reconstruction in five boreholes, Onshore West Greenland
geothermal gradient (deg. C/km)
log
likel
ihoo
d
20 30 40 50
-2.5
-1.5
-0.5
Late Miocene to Pliocene, Gro-3
28.5
17.5 50
20.5 47.5
depth (m)
tem
pera
ture
500 1000 1500 2000 2500 3000
050
100
200
removed section (m)
log
likel
ihoo
d
0 1000 2000 3000
-2.5
-1.5
-0.5
Late Miocene to Pliocene, Gro-3surface temperature: 0
50
3350
2650
depth (m)
tem
pera
ture
-3000 -1000 0 1000 3000
050
100
200
Late Miocene to Pliocene, Gro-3
geothermal gradient (deg. C/km)
rem
oved
sec
tion
(m)
10 20 30 40 50
050
015
0025
00
surface temperature: 0
1500
3300
250
1550
650
50
Figure 6.9: Late Miocene to Pliocene (7 to 2 Ma) paleogeothermal gradients &
removed section: West Greenland Borehole Gro-3. Upper: Maximum likelihood profiles of linear paleogeothermal gradient (left) and removed section (right) fitted to latest Miocene to Pliocene paleotemperature constraints from AFTA in the GRO-3 borehole. The methodology used to construct these profiles is outlined in Appendix C. In each plot, paleotemperature constraints from AFTA are plotted against depth below kb, also showing the best-fit profile (solid line) and lines (dashed) representing upper and lower 95% confidence limits. In the right-hand plot, the fitted gradients are extrapolated to a paleo-surface temperature of 0°C to determine removed section. Higher paleo-surface temperatures can also be accommodated (see text). Lower: Crossplot of total section removed against paleogeothermal gradient, showing the ranges of paired values (within the contoured region) compatible with the latest Miocene to Pliocene paleotemperatures derived from AFTA data, at the 95% confidence level. The values printed within the plot are amounts of removed section corresponding to ±2σ limits at various values of paleogeothermal gradient. For example, for a paleogeothermal gradient of 30°C/km, between 250 and 1550 metres of removed section is required in order to honour the paleotemperature constraints.

122
Geotrack Report #883: Thermal History reconstruction in five boreholes, Onshore West Greenland
geothermal gradient (deg. C/km)
log
likel
ihoo
d
22 24 26 28 30 32 34
-2.5
-1.5
-0.5
Late Miocene to Pliocene, ALL
28
22.5 34
24.5 31.5
depth (m)
tem
pera
ture
1000 2000 3000 4000
4080
120
removed section (m)
log
likel
ihoo
d
0 200 400 600 800 1000
-2.0
-1.0
0.0
Late Miocene to Pliocene, ALLsurface temperature: 0
300
1100
50 450
depth (m)
tem
pera
ture
-1000 0 1000 2000 3000 4000
040
8012
0
Late Miocene to Pliocene, ALL
geothermal gradient (deg. C/km)
rem
oved
sec
tion
(m)
20 30 40 50
050
010
0015
00
surface temperature: 0
350
850
350
Figure 6.10: Latest Miocene to Pliocene (7-2 Ma) paleogeothermal gradients & removed
section with respect to the erosion surface: West Greenland Boreholes Umiivik-1, Gane-1, Gant-1 & Gro-3 and outcrop sample GC861-13.
Upper: Maximum likelihood profiles of linear paleogeothermal gradient (left) and removed section (right) fitted to latest Miocene to Pliocene paleotemperature constraints from AFTA. The methodology used to construct these profiles is outlined in Appendix C. In each plot, paleotemperature constraints from AFTA are plotted against depth below the prominent erosion surface recognised across the region, also showing the best-fit profile (solid line) and lines (dashed) representing upper and lower 95% confidence limits. In the right-hand plot, the fitted gradients are extrapolated to a paleo-surface temperature of 0°C to determine removed section. Higher paleo-surface temperatures can also be accommodated (see text). Lower: Crossplot of total section removed from the erosion surface against paleogeothermal gradient, showing the ranges of paired values (within the contoured region) compatible with the latest Miocene to Pliocene paleotemperatures derived from AFTA data, at the 95% confidence level. The values printed within the plot are amounts of removed section corresponding to ±2σ limits at various values of paleogeothermal gradient. For example, for a paleogeothermal gradient of 30°C/km, between 0 and 350 metres of additional section above the erosion surface is required in order to honour the paleotemperature constraints.

123
Geotrack Report #883: Thermal History reconstruction in five boreholes, Onshore West Greenland
50 40 30 20 10 0
50
40
30
20
10
0
60
70
80
90
Time (Ma)
GRO-3, GANE-1 & UMIIVIK-1GRO-3 & GANE-1
GANT-1
GRO-3
EOCENE-OLIGOCENE(40-30 Ma)
Assumed present-day thermal gradient 30°C/km
ALL BOREHOLESPLUS GC861-13
wrt sea level
GRO-3
LATE MIOCENE(~10 Ma)
ALL BOREHOLESPLUS GC861-13
wrt erosion surface
ALL BOREHOLESPLUS GC861-13
wrt erosion surface
GRO-3
LATEST MIOCENE- PLIOCENE
(7-2 Ma)
Figure 6.11: Paleogeothermal gradient estimates for three paleo-thermal episodes from Table 6.1, as a function of the timing of cooling in each episode. Maximum likelihood values are shown as squares with thicker lines, while the range of allowed values (within 95% confidence limits) is shown by the boxes with thinner lines. These results suggest a general pattern of decreasing gradient with time towards the present-day. See text for further details.

124
Geotrack Report #883: Thermal History reconstruction in five boreholes, Onshore West Greenland
7. Thermal and Burial history reconstruction
Introduction
In reconstructing thermal and burial/exhumation histories in sedimentary basins, it is important to recognise what can and what cannot be constrained from paleo-thermal data. As emphasised numerous times throughout this report, AFTA, (U-Th)/He and VR data are sensitive to the maximum or peak paleotemperatures from which a sample cools in any particular cooling episode, but cannot constrain the lower temperature history prior to the onset of cooling. For this reason, when paleo-thermal techniques are used to determine estimates of “missing section”, what is actually being estimated is the amount of section below which a particular sample horizon was buried at the time that cooling commenced. For this reason, such estimates are probably best regarded in terms of “paleo-burial”.
In a section which has undergone multiple cooling episodes, involving cooling from a sequence of paleotemperature peaks of decreasing magnitude, as identified in this report, while the magnitude and timing of the paleo-thermal peaks are well defined, the data cannot constrain the history during the intervening period between the cooling events. This aspect of the techniques employed here is discussed in more detail in Section 2.6 and illustrated in Figure 2.2.
With this in mind, in the following we illustrate three possible thermal and burial/exhumation history reconstructions which satisfy the paleotemperature constraints derived from AFTA, (U-Th)/He and VR data in this report. Results from the Gro-3 borehole are used as a basis of this discussion, as they typify results from across the region. However, we note that while regional data are characterised by a high degree of uniformity (Section 6), results from the Gro-3 borehole alone accommodate a wider range of paleogeothermal gradients and removed section compared to the combined dataset from all boreholes, and some of the reconstructions illustrated here are based on conditions outside the more restricted range of parameters defined from the combined dataset.
In all three reconstructions, the maximum paleotemperature episode (Eocene-Oligocene) is represented by 1700 metres of additional burial deposited up to 35 Ma, with a paleogeothermal gradient at that time of 45°C/km. In selecting this value, we have adopted a preferred paleo-gradient from the higher end of the results from Gro-3 alone, on the basis of the combination of data from Gro-3, Gane-1, Umiivik-1 and sample GC861-13, while the amount of additional section is based on data from Gro-3 alone (Table 6.2).

125
Geotrack Report #883: Thermal History reconstruction in five boreholes, Onshore West Greenland
The latest Miocene to Pliocene episode is also the same in all three episodes, representing the incision of the modern day relief (~1000 metres, Table 5.2), assumed to have taken place since 4 Ma, although anything from 7 to 2 Ma for the inception of this erosion is allowed by the data.
Details of the Late Miocene paleo-thermal episode differ between the three reconstructions, to illustrate various possible interpretations of the data. All three reconstructions are based on paleogeothermal gradients and amounts of additional section that are consistent with the range of conditions for each event defined by results from the Gro-3 borehole. However, as noted above these parameters may be outside the range of parameters derived from the combined dataset, analysed with respect to depth below the regional Neogene erosion surface (which is considered to represent the most appropriate reference frame for analysing these data), so that the full range of possible solutions can be illustrated. All three styles of interpretation are equally viable in terms of the paleo-thermal data alone, and integration with geological constraints is required before further discrimination between these options is possible.
Table 7.1 summarises the values of paleogeothermal gradients and additional section deposited and eroded during the three paleo-thermal episodes, as used in the three reconstructions illustrated in Figures 7.1 through 7.6. These are based on information summarised in Tables 6.1 through 6.4, and the synthesis presented in Section 6.4.
Thermal history reconstructions for individual AFTA samples from Gro-3 corresponding to reconstruction 1 are illustrated in Figure ii and the reconstructed history for each sample is compared with the basic thermal history constrains derived from AFTA in Figure iii. Figures iv and v show a similar comparison for Reconstruction 2, and Figures vi and vii relate to Reconstruction 3.
Paleo-surface temperatures
In all three reconstructions, we have paleo-surface temperatures of 20°C for the Eocene-Oligocene episode, 10°C for the Late Miocene and 0°C for the Latest Miocene to Pliocene episode, as also used in Section 6 for estimating amounts of missing section. These values are based on Mollusc Shell isotope data for the North Sea reported by Burchardt (1982).

126
Geotrack Report #883: Thermal History reconstruction in five boreholes, Onshore West Greenland
Reconstruction 1
This reconstruction (Figures 7.1, 7.2) illustrates a scenario involving continuous burial through Eocene-Oligocene and into Miocene times, with no discrete episode of exhumation during the 40 to 30 Ma interval. In this case, the Eocene-Oligocene cooling episode is due to a combination of decreasing paleogeothermal gradient and a decrease in paleo-surface temperature. Late Miocene cooling represents the combined effects of further decrease in both of these parameters, together with removal of 1800 metres of section since 10 Ma, 1000 metres of which is removed since 4 Ma, representing the incision of the modern-day relief (i.e. at 10 Ma, the erosion surface was buried by 800 metres of section).
The resulting thermal histories for individual samples largely honour the paleotemperature constraints from AFTA in individual samples, as shown in Figure iii. The most obvious mis-match is in sample GC883-10, where the Late Miocene paleotemperature is slightly higher than the allowed range. This results from the intentional exaggeration of the magnitude of paleo-burial at 10 Ma, in order to construct a viable solution involving progressive burial through Eocene-Oligocene times. With the exception of this sample, the remaining reconstructed histories are in good agreement with the constraints, and this reconstruction can be considered consistent with the results of this study.
Reconstruction 2
This reconstruction (Figures 7.3, 7.4) involves a discrete episode of exhumation beginning during the 40 to 30 Ma interval, and a total paleo-burial at 10 Ma which is slightly less than at 35 Ma. Thus, the Eocene-Oligocene cooling episode in this case is due to a combination of exhumation, decreasing paleogeothermal gradient and a decrease in paleo-surface temperature. The Late Miocene episode is also due to a combination of all three factors, as in Reconstruction 1, with a slightly smaller amount of section removed between 10 and 4 Ma because of the lower degree of paleo-burial at 10 Ma (with the erosion surface buried by 650 m) in this reconstruction.
The resulting thermal histories for individual samples in this reconstruction are in good agreement with the paleotemperature constraints from AFTA in individual samples, as shown in Figure v, with no obvious mismatches. Of the three reconstructions illustrated here, this is regarded as probably the most realistic.

127
Geotrack Report #883: Thermal History reconstruction in five boreholes, Onshore West Greenland
Note, however, that because only the peak paleo-thermal conditions in each episode are constrained by the AFTA data, as discussed previously in this Section (and in more detail in Section 2.5) the exact amount of section removed between the onset of Eocene-Oligocene exhumation and the recommencement of deposition leading to the Late Miocene paleo-thermal maximum, is not controlled by the data.
Reconstruction 3
This reconstruction (Figures 7.5, 7.6) differs from Reconstruction 2 in the magnitude of the Late Miocene paleogeothermal gradient, which is equal to the (assumed) present-day value of 30°C/km. This requires a higher degree of burial in the Late Miocene to produce the observed paleotemperatures, with a total paleo-burial at 10 Ma of 2150 metres, 1150 metres of which is removed between 10 and 4 Ma, with the remaining 1000 metres removed during incision of the present-day relief between 4 Ma and the present day (i.e. the present day erosion surface is buried by 1150 metres at 10 Ma).
The resulting thermal histories for individual samples in this reconstruction are again in good agreement with the paleotemperature constraints from AFTA in individual samples, as shown in Figure v, with no obvious mismatches.
Closing remarks
The discussion presented in this Section highlights the fact that although thermal histories in individual samples may appear well constrained (Section 3), the timing of major paleo-thermal episodes is well-defined (Figure 3.7), and the general pattern of paleogeothermal gradients through time is well established (Figure 6.11), there is still a large amount of uncertainty regarding the interpretation of the underlying tectonic framework. The three scenarios illustrated here are by no means an exhaustive selection of the possible interpretations, although they do provide a representation of possible end-member options.
Integration with geological constraints, in the form of regional unconformities and depositional patterns, etc, is required in order to place further constraints on the most viable interpretation of the results of this study.

128
Geotrack Report #883: Thermal History reconstruction in five boreholes, Onshore West Greenland
Table 7.1 Paleogeothermal gradients and removed section (paleo-burial) values used in three thermal and burial/exhumation history reconstructions: West Greenland boreholes (Geotrack Report #883)
episode Reconstruction 1 Reconstruction 2 Reconstruction 3
Eocene-Oligocene (40-30 Ma)
45°C/km 1700 m
45°C/km 1700 m
45°C/km 1700 m
intervening history
Ongoing burial (additional 100
metres between 35 and 10 Ma)
900 metres section eroded by 25 Ma
and additional 850 metres deposited prior to 10 Ma
900 metres section eroded by 25 Ma
and additional 1350 metres
deposited prior to 10 Ma
Late Miocene (11-10 Ma)
35°C/km 1800 m
35°C/km 1650 m
30°C/km 2150 m
intervening history
700 metres of section eroded
650 metres of section eroded
1150 metres of section eroded
Latest Miocene – Pliocene (7-2 Ma)
30°C/km 1000 m
30°C/km 1000 m
30°C/km 1000 m

129
Geotrack Report #883: Thermal History reconstruction in five boreholes, Onshore West Greenland
PMOEPK
Gro-3
Volcanic
Danian
Maastrichtian
Campanian
Albian-Coniacian
0
500
1000
1500
2000
2500
3000
3500
4000
4500
5000020406080100120
Time (Ma)
Possible reconstruction - 1
Figure 7.1: Possible burial history reconstruction for West Greenland Borehole Gro-3, derived from the thermal history constraints derived from AFTA, (U-Th)/He and VR data. Parameters employed in this reconstruction are summarised in Table 7.1.

130
Geotrack Report #883: Thermal History reconstruction in five boreholes, Onshore West Greenland
PMOEPK
Gro-3
VolcanicDanianMaastrichtianCampanian
Albian-Coniacian
020406080100120
0
25
50
75
100
125
150
175
200
225
250
Possible reconstruction - 1
Time (Ma)
30
35
404550
25
Figure 7.2: Schematic illustration of a possible thermal history reconstruction for West Greenland Borehole Gro-3, corresponding to the burial history reconstruction shown in Figure 7.1. See text for details.

131
Geotrack Report #883: Thermal History reconstruction in five boreholes, Onshore West Greenland
PMOEPK
Gro-3
Volcanic
Danian
Maastrichtian
Campanian
Albian-Coniacian
0
500
1000
1500
2000
2500
3000
3500
4000
4500
5000020406080100120
Time (Ma)
Possible reconstruction - 2
Figure 7.3: Another possible burial history reconstruction for West Greenland Borehole Gro-3, derived from the thermal history constraints derived from AFTA, (U-Th)/He and VR data. Parameters employed in this reconstruction are summarised in Table 7.1.

132
Geotrack Report #883: Thermal History reconstruction in five boreholes, Onshore West Greenland
PMOEPK
Gro-3
VolcanicDanianMaastrichtianCampanian
Albian-Coniacian
020406080100120
0
25
50
75
100
125
150
175
200
225
250
Possible reconstruction - 2
Time (Ma)
30
35
404550
25
Figure 7.4: Schematic illustration of an alternative thermal history reconstruction for West Greenland Borehole Gro-3, corresponding to the burial history reconstruction shown in Figure 7.3. See text for details.

133
Geotrack Report #883: Thermal History reconstruction in five boreholes, Onshore West Greenland
PMOEPK
Gro-3
Volcanic
Danian
Maastrichtian
Campanian
Albian-Coniacian
0
1000
2000
3000
4000
5000
6000020406080100120
Time (Ma)
Possible reconstruction - 3
Figure 7.5: A third possible burial history reconstruction for West Greenland Borehole Gro-3, derived from the thermal history constraints derived from AFTA, (U-Th)/He and VR data. Parameters employed in this reconstruction are summarised in Table 7.1.

134
Geotrack Report #883: Thermal History reconstruction in five boreholes, Onshore West Greenland
PMOEPK
Gro-3
VolcanicDanianMaastrichtianCampanian
Albian-Coniacian
020406080100120
0
25
50
75
100
125
150
175
200
225
250
Possible reconstruction - 3
Time (Ma)
30
35
404550
25
Figure 7.6: Schematic illustration of a third possible thermal history reconstruction for West Greenland Borehole Gro-3, corresponding to the burial history reconstruction shown in Figure 7.5. See text for details.

135
Geotrack Report #883: Thermal History reconstruction in five boreholes, Onshore West Greenland
References
Bray, R.J., Green, P.F. and Duddy, I.R. 1992. Thermal history reconstruction using apatite fission track analysis and vitrinite reflectance: a case study from the UK East Midlands and the Southern North Sea. In: Hardman, R.F.P. (ed.), Exploration Britain: Into the next decade. Geological Society Special Publication, 67, 3-25.
Burchardt, B. 1978. Oxygen isotope paleotemperatures for the Tertiary period in the North Sea area. Nature, 275, 121-123.
Burnham, A.K. and Sweeney, J.J., 1989, A chemical kinetic model of vitrinite reflectance maturation. Geochimica et Cosmochimica Acta, 53, 2649-2657.
Farley, K.A. 2000. Helium diffusion from apatite: general behaviour as illustrated by Durango fluorapatite. Journal of Geophysical Research, 105 (B2), 2903-2914.
Farley, K.A., Wolf, R.A. and Silver, L.T. 1996. The effects of long alpha-stopping distances on (U-Th)/He ages. Geochimica et Cosmochimica Acta, 60, 4223-4229.
Green, P.F. 1986. On the thermo-tectonic evolution of Northern England: evidence from fission track analysis. Geological Magazine, 123, 493-506.
House, M.A., Farley, K.A. and Kohn, B.P. 1999. An empirical test of helium diffusion in apatite: borehole data from the Otway Basin, Australia. Earth and Planetary Science Letters, 170, 463-474.
Lippolt, H.J., Leitz, M., Wernicke, R.S. and Hagedorn, B. 1994. (Uranium + thorium)/helium dating of apatite: experience with samples from different geochemical environments. Chemical Geology (Isotope Geoscience Section), 112, 179-191.
Rutherford, E. 1907a. Die Radioaktivität. Springer, Berlin. 595pp.
Rutherford, E. 1907b. Radioaktive Umwandlungen (Silliman – Voresungen 1905). Vieweg, Braunschwieg, 285 pp.
Sweeney, J.J. and Burnham, A.K., 1990, Evaluation of a simple model of vitrinite reflectance based on chemical kinetics. AAPG Bulletin, 74, 1559-1570.
Waples, D.W., Kamata, H. and Suizu, M., 1992, The art of maturity modelling. Part 1: Finding a satisfactory geologic model. AAPG Bulletin, 76, 31-46.

136
Geotrack Report #883: Thermal History reconstruction in five boreholes, Onshore West Greenland
Warnock, A.C., Zeitler, P.K., Wolf, R.A. and Bergman, S.C. 1997. An evaluation of low-temperature apatite U-Th/He thermochronometry. Geochimica et Cosmochimica Acta, 61, 5371-5377.
Wolf, R.A., Farley, K.A. and Silver, L.T. 1996. Helium diffusion and low-temperature thermochronometry of apatite. Geochimica et Cosmochimica Acta, 60, 4231-4240.
Wolf, R.A., Farley, K.A. and Silver, L.T. 1997. Assessment of (U-Th)/He thermochronometry: the low temperature history of the San Jacinto mountains, California. Geology, 25, 65-68.
Wolf, R.A., Farley, K.A. and Kass, D.M. 1998. Modeling of the temperature sensitivity of the apatite (U-Th)/He thermochronometer. Chemical Geology, 148, 105-114.
Zeitler, P. K., Herczig, A. L., McDougall, I., and Honda, M., 1987, U-Th-He dating of apatite: A potential thermochronometer. Geochimica et Cosmochimica Acta, 51, 2865-2868.

A.1
Geotrack Report #883: Thermal History reconstruction in five boreholes, Onshore West Greenland
APPENDIX A
Sample Details, Geological Data and Apatite Compositions
A.1 Sample details
Sixteen samples of sedimentary rocks of Cretaceous to Early Tertiary age from five boreholes in the Nuussuaq basin of West Greenland were submitted for AFTA by Peter Japsen, GEUS, Copenhagen. Details of all AFTA samples, including sample depths, stratigraphic ages and estimates of present temperature for each sample, are summarised in Table A.1. Details of present temperature estimation are presented in Section A.3 (below). Yields of apatite obtained from the sample are also listed in Table A.1. These are discussed in Section 1.3 of the report, together with discussion of overall AFTA data quality.
A.2 Stratigraphic details
Details of the stratigraphic breakdown of the preserved section in each of the boreholes were provided by the client. The chronostratic (relative succession) assignment of each sample was converted to a chronometric (numerical) scale using the timescale of Harland et al. (1989), with results summarised in Table A.2. The stratigraphic age of each AFTA sample, derived from this information, is summarised in Table A.1. Similar information for VR samples is summarised in Table D.2.
Any slight errors in the estimated chronometric ages of each sample are not expected to affect the thermal history interpretation of either the AFTA or VR data to any significant degree.
A.3 Present temperatures
In application of any technique involving estimation of paleotemperatures, it is critical to control the present temperature profile, since estimation of maximum paleotemperatures proceeds from assessing how much of the observed effect could be explained by the magnitude of present temperatures.

A.2
Geotrack Report #883: Thermal History reconstruction in five boreholes, Onshore West Greenland
For this report, no independent estimates of present-day temperatures (e.g. BHT, DST) were available, so a present-day thermal gradient of 30°C/km has been assumed, together with a mean annual surface temperature of 0°C.
A.4 Grain morphologies
The apatite grains extracted from the samples analysed for this study were dominated by euhedral to sub-euhedral and sub-rounded forms. No clear trends linking particular aspects of the data to distinctive grain morphologies were evident which could be interpreted in terms of systematic variation in sedimentary provenance.
A.5 Apatite compositions
The annealing kinetics of fission tracks in apatite are affected by chemical composition, specifically the Cl content, as explained in more detail in Appendix C. In the sample analysed for this report, Cl contents were measured in all apatite grains analysed (i.e. for both fission track age determination and track length measurement), and the measured compositions in individual grains have been employed in interpreting the AFTA data, using methods outlined in Appendix C.
Chlorine contents were measured using a fully automated Jeol JXA-5A electron microprobe equipped with a computer controlled X-Y-Z stage and three computer controlled wavelength dispersive crystal spectrometers, with an accelerating voltage of 15kV and beam current of 25nA. The beam was defocussed to 20 µm diameter to avoid problems associated with apatite decomposition, which occur under a fully focussed 1 - 2 µm beam. The X-Y co-ordinates of dated grains within the grain mount were transferred from the Autoscan Fission Track Stage to a file suitable for direct input into the electron microprobe. The identification of each grain was verified optically prior to analysis. Cl count rates from the analysed grains were converted to wt% Cl by reference to those from a Durango apatite standard (Melbourne University Standard APT151), analysed at regular intervals. This approach implicitly takes into account atomic number absorption and fluorescence matrix effects, which are normally calculated explicitly when analysing for all elements. A value of 0.43 wt% Cl was used for the Durango standard, based on repeated measurements on the same single fragment using pure rock salt (NaCl) as a standard for chlorine. This approach gives essentially identical results to Cl contents determined from full compositional measurements, but has the advantage of reducing analytical time by a factor of ten or more.

A.3
Geotrack Report #883: Thermal History reconstruction in five boreholes, Onshore West Greenland
Chlorine contents in individual grains are listed in the fission track age summary data sheet for the sample in Appendix B. Table B.3 contains fission track age and length data grouped into 0.1 wt% Cl intervals on the basis of chlorine contents of the grains from which the data are derived. A plot of fission track age against Cl content is also shown in the data sheet, together with a histogram of Cl contents in all individual apatite grains analysed from each sample (i.e. grains analysed for both age and length measurements).
Lower limits of detection for chlorine content have been calculated for typical analytical conditions (beam current, counting time, etc.) and are listed in Table A.3. Errors in wt% composition are given as a percentage and quoted at 1σ for chlorine determinations. A generalised summary of errors for various wt% chlorine values is presented in Table A.4.
Apatite compositions in this study
In samples analysed for this study, the histograms of Cl content show a similar pattern, typical of the distribution of Cl contents found in detrital apatites from common sandstone samples around the world. The majority of grains have Cl contents between 0 and 0.1 wt%, while a smaller number of grains give values up to ~0.5 wt% (close to the value found in the Durango apatite on which our original kinetic model of fission track behaviour was based, see Appendix C). A minor component of grains with wt% Cl up to 1 wt% is present in some samples.
In all samples, the measured distribution of wt% Cl has been employed in interpreting the AFTA data, using methods outlined in Appendix C.

Sample number
Depth
(m)
Stratigraphic age(Ma)
Present temperature
(°C)
Rawweight
(g)
Washedweight
(g)*1
Details of fission track samples and apatite yields - samples from West Greenland (Geotrack Report #883)
StratigraphicSubdivision
Sampletype
Table A.1:
Apatite yield *2
A.4
Umiivik-1GC883-1 240E. Coniacian 520 excellentcore 9278-291 89-87
GC883-2 310Albian? - Turonian 630 faircore 311027-1030 112-90
Gane-1GC883-3 440hyalocl + sed
(Danian)700 excellentcore 15510-515 63-62
Gant-1GC883-4 360L. Campanian - L.
Maastrichtian630 excellentcore 4146-153 76-65
GC883-5 340E. - M. Campanian 660 excellentcore 23749-758 81-76
Ataa-1GC883-6 210L. Santonian - E.
Campanian540 excellentcore 017-26 85-80
GC883-16 380L. Santonian - E. Campanian
422 excellentcore 017-26 85-80
GC883-7 120L. Santonian - E. Campanian
350 excellentcore 16555 85-80
GC883-17 290L. Santonian - E. Campanian
355 excellentcore 16555 85-80
Gro-3GC883-8 240L. Maastrichtian 480 excellentcuttings 23750-780 70-65
GC883-9 370E. Maastrichtian 520 excellentcuttings 301000-1020 74-70
GC883-10 310Albian? - Coniacian 580 excellentcuttings 511705-1715 112-89
GC883-11 430Albian? - Coniacian 610 excellentcuttings 632105-2115 112-89
GC883-12 440Albian? - Coniacian 590 goodcuttings 722370-2415 112-89
GC883-13 440Albian? - Coniacian 640 excellentcuttings 832760-2780 112-89
GC883-14 180Albian? - Coniacian 320 excellentcuttings 892965-2980 112-89
*1See Appendix A for discussion of present temperature data.
*2Yield based on quantity of mineral suitable for age determination. Excellent: >20 grains; Good: 15-19 grains; Fair: 10-14 grains; Poor: 5-9 grains; Very Poor: <5 grains.

Age of Top
(Ma)
Depth of TopTVD rKB
(m)
StratigraphicInterval
Table A.2: Summary of stratigraphy - West Greenland (Geotrack Report #883)
KB elevation (mAMSL)
Groundlevel(m)
A.5
Umiivik-1Unconformity 0 077E. Coniacian 0 87L. Turonian 319 89Albian? - Turonian 650 90
1200 112TD
Gane-1Unconformity 0 0116116Basalt 0 61hyalocl + sed (Danian)
495 62
Danian 600 63705 65TD
Gant-1Unconformity 0 0385385Danian? 0 60Danian 58L. Campanian - L. Maastrichtian 135 65E. - M. Campanian 400 76E. Campanian 835 81E. Campanian? 894
901 83TD
Ataa-1Unconformity 11 0479490L. Santonian - E. Campanian 11 80
566 85TD
Gro-3Unconformity 0 02222Basalt 0 61hyalocl + sed (Danian)
320 62
Danian 410 63L. Maastrichtian 730 65E. Maastrichtian 980 70Campanian 1200 74Coniacian? - E. Campanian? 1400 81Albian? - Coniacian 1600 89
2996 112TD
All depths quoted are with respect to KB, except where otherwise stated.

A.6
Table A.3: Lower Limits of Detection for Apatite Analyses (Geotrack Report #883)
Element LLD (95% c.l.) LLD (99% c.l.) (wt%) (ppm) (wt%) (ppm) Cl 0.01 126 0.02 182
Table A.4: Per cent errors in chlorine content (Geotrack Report #883)
Chlorine Error content (wt%) (%) 0.01 9.3 0.02 8.7 0.05 7.3 0.10 6.1 0.20 4.7 0.50 3.2 1.00 2.3 1.50 1.9 2.00 1.7 2.50 1.5 3.00 1.4 Errors quoted are at 1σ. See Appendix A for more details.

B.1
APPENDIX B Sample Preparation, Analytical Details and Data Presentation B.1 Sample Preparation
Core and outcrop samples are crushed in a jaw crusher and then ground to sand grade in a rotary disc mill. Cuttings samples are washed and dried before grinding to sand grade. The ground material is then washed to remove dust, dried and processed by conventional heavy liquid and magnetic separation techniques to recover heavy minerals. Apatite grains are mounted in epoxy resin on glass slides, polished and etched for 20 sec in 5M HNO3 at 20°C to reveal the fossil fission tracks.
After etching, all mounts are cut down to 1.5 X 1 cm, and cleaned in detergent, alcohol and distilled water. The mounts are then sealed in intimate contact with low-uranium muscovite detectors within heat-shrink plastic film. Each batch of mounts is stacked between two pieces of uranium standard glass, which has been prepared in similar fashion. The stack is then inserted into an aluminium can for irradiation.
After irradiation, the mica detectors are removed from the grain mounts and standard glasses and etched in hydrofluoric acid to reveal the fission tracks produced by induced fission of 235U in the apatite and standard glass.
B.2 Analytical Details
Fission track ages
Fission track ages are calculated using the standard fission track age equation using the zeta calibration method (equation five of Hurford and Green, 1983), viz:
F.T. AGE = Dλ
1 ln [ 1 + ( ζ λD ρs g ρD ρi
) ] B.1
where: λD = Total decay constant of 238U ( = 1.55125 x 10⁻¹⁰) ζ = Zeta calibration factor ρs = Spontaneous track density ρi = Induced track density ρD = Track density from uranium standard glass g = A geometry factor (= 0.5)

B.2
Fission track ages are determined by the external detector method or EDM (Gleadow, 1981). The EDM has the advantage of allowing fission track ages to be determined on single grains. In apatite, tracks are counted in 20 grains from each mount wherever possible. In those samples where the desired number is not present, all available grains are counted, the actual number depending on the availability of suitably etched and oriented grains. Only grains oriented with surfaces parallel to the crystallographic c-axis are analysed. Such grains can be identified on the basis of the etching characteristics, as well as from morphological evidence in euhedral grains. The grain mount is scanned sequentially, and the first 20 suitably oriented grains identified are analysed.
Tracks are counted within an eyepiece graticule divided into 100 grid squares. In each grain, the number of spontaneous tracks (Ns) within a certain number of grid squares (Na) is recorded. The number of induced tracks (Ni) in the corresponding location within the mica external detector is then counted. Spontaneous and induced track densities (ρs and ρi, respectively) are calculated by dividing the track counts by the total area counted, given by the product of Na and the area or each grid square (determined by calibration against a ruled stage graticule or diffraction grating). Fission track ages may be calculated by substituting track counts (Ns and Ni) for track densities (ρs and ρi) in equation B.1, since the areas cancel in the ratio.
Translation between apatite grains in the grain mount and external detector locations corresponding to each grain is carried out using Autoscan™ microcomputer-controlled automatic stages (Smith and Leigh Jones, 1985). This system allows repeated movement between grain and detector, and all grain locations are stored for later reference if required.
Neutron irradiations are carried out in a well-thermalised flux (X-7 facility; Cd ratio for Au ~98) in the Australian Atomic Energy Commission's HIFAR research reactor. Total neutron fluence is monitored by counting tracks in mica external detectors attached to two pieces of Corning Glass Works standard glass CN5 (containing ~11 ppm Uranium) included in the irradiation canister at each end of the sample stack. In determining track densities in external detectors irradiated adjacent to uranium standard glasses, 25 fields are normally counted in each detector. The total track count (ND) is divided by the total area counted to obtain the track density (ρD). The positions of the counted fields are arranged in a 5 X 5 grid covering the whole area of the detector. For typical track densities of between ~5 X 10⁵ and 5 X 10⁶, this is a convenient arrangement to sample across the detector while gathering sufficient counts to achieve a precision of ~±2% in a reasonable time.

B.3
A small flux gradient is often present in the irradiation facility over the length of the sample package. If a detectable gradient is present, the track count in the external detector adjacent to each standard glass is converted to a track density (ρD) and a value for each mount in the stack is calculated by linear interpolation. When no detectable gradient is present, the track counts in the two external detectors are pooled to give a single value of ρD, which is used to calculate fission track ages for each sample.
A Zeta calibration factor (ζ) has been determined empirically for each observer by analysing a set of carefully chosen age standards with independently known K-Ar ages, following the methods outlined by Hurford and Green (1983) and Green (1985).
All track counting is carried out using Zeiss(R) Axioplan microscopes, with an overall linear magnification of 1068 x using dry objectives.
For further details and background information on practical aspects of fission track age determination, see e.g. Fleischer, Price and Walker (1975), Naeser (1979) and Hurford (1986).
Track length measurements
For track length studies in apatite, the full lengths of "confined" fission tracks are measured. Confined tracks are those which do not intersect the polished surface but have been etched from other tracks or fractures, so that the whole length of the track is etched. Confined track lengths are measured using a digitising tablet connected to a microcomputer, superimposed on the microscope field of view via a projection tube. With this system, calibrated against a stage graticule ruled in 2 µm divisions, individual tracks can be measured to a precision of ± 0.2 µm. Tracks are measured only in prismatic grains, characterised by sharp polishing scratches with well-etched tracks of narrow cone angle in all orientations, because of the anisotropy of annealing of fission tracks in apatite (as discussed by Green et al. 1986). Tracks are also measured following the recommendations of Laslett et al. (1982), the most important of which is that only horizontal tracks should be measured. One hundred tracks are measured whenever possible. In apatite samples with low track density, or in those samples in which only a small number of apatite grains are obtained, fewer confined tracks may be available. In such cases, the whole mount is scanned to measure as many confined tracks as possible.
Integrated fission track age and length measurement
Fission track age determination and length measurement are now made in a single pass of the grain mount, in an integrated approach. The location of each grain in which

B.4
tracks are either counted or measured is recorded for future reference. Thus, track length measurements can be tied to age determination in individual grains. As a routine procedure we do not measure the age of every grain in which lengths are determined, as this would be much too time-consuming. Likewise we do not only measure ages in grain in which lengths are measured, as this would bias the age data against low track density grains. Nevertheless, the ability to determine the fission track age of certain grains from which length data originate can be a particularly useful aid to interpretation in some cases. Grain location data are not provided in this report, but are available on request.
B.3 Data Presentation
Fission track age data
Data sheets summarising the apatite fission track age data, including full details of fission track age data for individual apatite grains in each sample, together with the primary counting results and statistical data, are given in the following pages. Individual grain fission track ages are calculated from the ratio of spontaneous to induced fission track counts for each grain using equation B.1, and errors in the single grain ages are calculated using Poissonian statistics, as explained in more detail by Galbraith (1981) and Green (1981). All errors are quoted as ±1σ throughout this report, unless otherwise stated.
The variability of fission track ages between individual apatite grains within each sample can be assessed using a chi-squared (χ2) statistic (Galbraith, 1981), the results of which are summarised for each sample in the data sheets. If all the grains counted belong to a single age population, the probability of obtaining the observed χ2 value, for ν degrees of freedom (where ν = number of crystals -1), is listed in the data sheets as P(χ2) or P(chi squared).
A P(χ2) value greater than 5% can be taken as evidence that all grains are consistent with a single population of fission track age. In this case, the best estimate of the fission track age of the sample is given by the "pooled age", calculated from the ratio of the total spontaneous and induced track counts in all grains analysed. Errors for the pooled age are calculated using the "conventional" technique outlined by Green (1981), based on the total number of tracks counted for each track density measurement (see also Galbraith, 1981).
A P(χ2) value of less than 5% denotes a significant spread of single grain ages, suggesting real differences exist between the fission track ages of individual apatite

B.5
grains. A significant spread in grain ages can result either from inheritance of detrital grains from mixed source areas (in sedimentary rocks), or from differential annealing in apatite grains of different composition, within a narrow range of temperature.
Calculation of the pooled age inherently assumes that only a single population of ages is present, and is thus not appropriate to samples containing a significant spread of fission track ages. In such cases Galbraith, has recently devised a means of estimating the modal age of a distribution of single grain fission track ages which is referred to as the "central age". Calculation of the central age assumes that all single grain ages belong to a Normal distribution of ages, with a standard deviation (σ) known as the "age dispersion". An iterative algorithm (Galbraith and Laslett, 1993) is used to provide estimates of the central age with its associated error, and the age dispersion, which are all quoted in the data sheets. Note that this treatment replaces use of the "mean age", which has used been in the past for those samples in which P(χ2)<5%. For samples in which P(χ2)>5%, the central age and the pooled age should be equal, and the age dispersion should be less than ~10%.
Table B.1 summarises the fission track age data in apatite from each sample analysed.
Construction of radial plots of single grain age data
Single grain age data are best represented in the form of radial plot diagrams (Galbraith, 1988, 1990). As illustrated in Figure B.1, these plots display the variation of individual grain ages in a plot of y against x, where:
y = (zj - zo) /σi x = 1/σj B.2 and; zj = Fission track age of grain j zo = A reference age σj = Error in age for grain j
In this plot, all points on a straight line from the origin define a single value of fission track age, and, at any point, the value of x is a measure of the precision of each individual grain age. Therefore, precise individual grain ages fall to the right of the plot (small error, high x), which is useful, for example, in enabling precise, young grains to be identified. The age scale is shown radially around the perimeter of the plot (in Ma). If all grains belong to a single age population, all data should scatter between y = +2 and y = -2, equivalent to scatter within ±2σ. Scatter outside these boundaries shows a significant spread of individual grain ages, as also reflected in the values of P(χ2) and age dispersion.

B.6
In detail, rather than using the fission track age for each grain as in equation B.2, we use:
zj = NsjNij
σj ={1/Nsj+ 1/Nij} B.3
as we are interested in displaying the scatter within the data from each sample in comparison with that allowed by the Poissonian uncertainty in track counts, without the additional terms which are involved in determination of the fission track age (ρD, ζ, etc).
Zero ages cannot be displayed in such a plot. This can be achieved using a modified plot, (Galbraith, 1990) with:
zj = arc sin { Nsj+3/8Nsj + Nij + 3/4} σj =
12 { 1
Nsj + Nij } B.4
Note that the numerical terms in the equation for zj are standard terms, introduced for statistical reasons. Using this arc-sin transformation, zero ages plot on a diagonal line which slopes from upper left to lower right. Note that this line does not go through the origin. Figure B.2 illustrates this difference between conventional and arc-sin radial plots, and also provides a simple guide to the structure of radial plots.
Use of arc-sin radial plots is particularly useful in assessing the relative importance of zero ages. For instance, grains with Ns = 0, Ni = 1 are compatible with ages up to ~900 Ma (at the 95% confidence level), whereas grains with Ns = 0, Ni = 50 are only compatible with ages up to ~14 Ma. The two data would readily be distinguishable on the radial plot as the 0,50 datum would plot well to the right (high x) compared to the 0,1 datum.
In this report the value of z corresponding to the stratigraphic age of each sample (or the midpoint of the range where appropriate) is adopted as the reference value, zo. This allows rapid assessment of the fission track age of individual grains in relation to the stratigraphic age, which is a key component in the interpretation of AFTA data, as explained in more detail in Appendix C.
Note that the x axis of the radial plot is normally not labelled, as this would obscure the age scale around the plot. In general labelling is not considered necessary, as we are concerned only with relative variation within the data, rather than absolute values of precision.

B.7
Radial plots of the single grain age data in apatite from each sample analysed in this report are shown on the fission track age data summary sheets at the end of this Appendix. Use of radial plots to provide thermal history information is explained in Appendix C and Figure C.7.
Track length data
Distributions of confined track lengths in apatite from each sample are shown as simple histograms on the fission track age data summary sheets at the end of this Appendix. For every track length measurement, the length is recorded to the nearest 0.1 µm, but the measurements have been grouped into 1 µm intervals for construction of these histograms. Each distribution has been normalised to 100 tracks for each sample to facilitate comparison. A summary of the length distribution in each sample is presented in Table B.2, which also shows the mean track length in each sample and its associated error, the standard deviation of each distribution and the number of tracks (N) measured in each sample. The angle which each confined track makes with the crystallographic c-axis is also routinely recorded, as is the width of each fracture within which tracks are revealed. These data are not provided in this report, but can be supplied on request.
Breakdown of data into compositional groups
In Table B.3, AFTA data are grouped into compositional intervals of 0.1 wt% Cl width. Parameters for each interval represent the data from all grains with Cl contents within each interval. Also shown are the parameters for each compositional interval predicted from the Default Thermal History (see Section 2.1). These data form the basis of interpretation of the AFTA data, which takes full account of the influence of Cl content on annealing kinetics, as described in Appendix C. Distributions of Cl contents in all apatites analysed from each sample (i.e. for both age and length determinations) are shown on the fission track age data summary sheets at the end of this Appendix.
Plots of fission track age against Cl content for individual apatite grains
Fission track ages of single apatite grains within individual samples are plotted against the Cl content of each grain on the fission track age data summary sheets at the end of this Appendix. These plots are useful in assessing the degree of annealing, as expressed by the fission track age data. For example, if grains with a range of Cl contents from zero to some upper limit all give similar fission track ages which are significantly less than the stratigraphic age, then grains with these compositions must have been totally annealed. Alternatively, if fission track age falls rapidly with decreasing Cl content, the sample displays a high degree of partial annealing.
B.8
B.4 A note on terminology
Note that throughout this report, the term "fission track age" is understood to denote the parameter calculated from the fission track age equation, using the observed spontaneous and induced track counts (either pooled for all grains or for individual grains). The resulting number (with units of Ma) should not be taken as possessing any significance in terms of events taking place at the time indicated by the measured fission track age, but should rather be regarded as a measure of the integrated thermal history of the sample, and should be interpreted in that light using the principles outlined in Appendix C. Use of the term "apparent age" is not considered to be useful in this regard, as almost every fission track age should be regarded as an apparent age, in the classic sense, and repeated use becomes cumbersome.

B.9
References Fleischer, R. L., Price, P. B., and Walker, R. M. (1975) Nuclear tracks in solids, University
of California Press, Berkeley. Galbraith, R. F. (1981) On statistical models for fission-track counts. Mathematical
Geology, 13, 471-488. Galbraith, R. F. (1988) Graphical display of estimates having differing standard errors.
Technometrics, 30, 271-281. Galbraith, R. F. (1990) The radial plot: graphical assessment of spread in ages. Nuclear
Tracks, 17, 207-214. Galbraith R.F. & Laslett G.M. (1993) Statistical methods for mixed fission track ages.
Nuclear Tracks 21, 459-470. Gleadow, A. J. W. (1981) Fission track dating methods; what are the real alternatives?
Nuclear Tracks, 5, 3-14. Green, P. F. (1981) A new look at statistics in fission track dating. Nuclear Tracks 5, 77-86. Green, P. F. (1985) A comparison of zeta calibration baselines in zircon, sphene and apatite.
Chem. Geol. (Isot. Geol. Sect.), 58, 1-22. Green, P. F., Duddy, I. R., Gleadow, A. J. W., Tingate, P. R. and Laslett, G. M. (1986)
Thermal annealing of fission tracks in apatite 1. A qualitative description. Chem. Geol. (Isot. Geosci. Sect.), 59, 237-253.
Hurford, A. J. (1986) Application of the fission track dating method to young sediments:
Principles, methodology and Examples. In: Hurford, A. J., Jäger, E. and Ten Cate, J. A. M. (eds), Dating young sediments, CCOP Technical Publication 16, CCOP Technical Secretariat, Bangkok, Thailand.
Hurford, A. J. and Green, P. F. (1982) A user's guide to fission track dating calibration.
Earth. Planet. Sci Lett. 59, 343-354. Hurford, A. J. and Green, P. F. (1983) The zeta age calibration of fission track dating.
Isotope Geoscience 1, 285-317. Laslett, G. M., Kendall, W. S., Gleadow, A. J. W. and Duddy, I. R. (1982) Bias in
measurement of fission track length distributions. Nuclear Tracks, 6, 79-85. Naeser, C. W. (1979) Fission track dating and geologic annealing of fission tracks. In:
Jäger, E. and Hunziker, J. C. (eds), Lectures in Isotope Geology, Springer Verlag, Berlin.
Smith, M. J. and Leigh-Jones, P. (1985) An automated microscope scanning stage for fission-
track dating. Nuclear Tracks, 10, 395-400.

Sample number
Numberof
grains
Uraniumcontent
(ppm)
(N )
P( )
(%)
Age dispersion
(%)
Fission track age
(Ma)
Apatite fission track analytical results - samples from West Greenland (Geotrack Report #883)
s(Ns)
i(Ni)
Table B.1:
ρ ρ χ2
x10 /cm²6 x10 /cm²6 x10 /cm²6
ρDD
B.10
Umiivik-1GC883-1 56.5 ± 5.50.988 2120 580.531 1.816
55.9 ± 9.6*<1
(1679) (150) (513)GC883-2 20.5 ± 5.40.998 1710 850.154 1.473
20.2 ± 8.5*3
(1679) (16) (153)
Gane-1GC883-3 35.1 ± 3.51.008 926 10.143 0.805
93
(1679) (127) (715)
Gant-1GC883-4 65.7 ± 5.91.018 1921 510.564 1.707
66.4 ± 10.0*<1
(1679) (186) (563)GC883-5 31.2 ± 2.91.027 2723 350.374 2.415
5
(1679) (154) (994)
Ataa-1GC883-6 210.7 ± 13.01.037 1420 661.348 1.283
182.1 ± 30.4*<1
(1679) (722) (687)GC883-7 306.2 ± 22.01.047 1021 11.451 0.952
50
(1679) (599) (393)GC883-16 232.2 ± 13.81.083 1920 162.061 1.796
8
(1722) (786) (685)GC883-17 259.8 ± 15.41.079 920 541.109 0.859
224.1 ± 31.7*<1
(1722) (851) (659)

Sample number
Numberof
grains
Uraniumcontent
(ppm)
(N )
P( )
(%)
Age dispersion
(%)
Fission track age
(Ma)
Continued
s(Ns)
i(Ni)
Table B.1:
ρ ρ χ2
x10 /cm²6 x10 /cm²6 x10 /cm²6
ρDD
B.11
Gro-3GC883-8 33.5 ± 2.91.106 1622 410.248 1.555
33.7 ± 4.5*<1
(1740) (177) (1108)GC883-9 38.5 ± 3.41.106 1321 810.240 1.309
34.3 ± 7.2*<1
(1740) (165) (899)GC883-10 41.2 ± 3.31.106 1522 1330.294 1.494
29.0 ± 8.9*<1
(1740) (219) (1114)GC883-11 33.7 ± 3.21.106 1721 1560.268 1.666
28.0 ± 10.4*<1
(1740) (143) (890)GC883-12 111.9 ± 7.11.106 1815 1900.946 1.764
27.2 ± 14.1*<1
(1740) (482) (899)GC883-13 21.1 ± 3.21.107 920 1000.086 0.853
21.5 ± 6.0*<1
(1740) (49) (487)GC883-14 24.9 ± 3.01.107 1021 1170.115 0.970
28.6 ± 8.5*<1
(1740) (80) (676)
s = spontaneous track density; i = induced track density; D = track density in glass standard external detector. Brackets show number of tracks counted. D and i measured in mica external detectors; s measured in internal surfaces.*Central age, used where sample contains a significant spread of single grain ages (P( ²)<5%). Errors quoted at 1 .
ρ ρ ρρ ρ ρ
χ σAges calculated using dosimeter glass CN5, with a zeta of 380.4 ± 5.7 (Analyst: C. O'Brien) for samples; 8 - 17
CN5, with a zeta of 392.9 ± 7.4 (Analyst: M. Moore) for samples; 1 - 7

Sample number
Meantrack length
(µm)
Standarddeviation
(µm)
Numberof tracks
(N)
Number of tracks in Length Intervals (µm)1
Length distribution summary data - samples from West Greenland (Geotrack Report #883)
2 3 4 5 6 7 8 9 10 11 12 13 14 15 16 17 18 19 20
Table B.2:
B.12
Umiivik-1GC883-1 2.42 67 - - - - 1 - - 6 1 5 11 9 13 9 5 6 1 - - -11.72 ± 0.30GC883-2 0.62 2 - - - - - - - - 1 1 - - - - - - - - - -8.80 ± 0.43
Gane-1GC883-3 1.91 67 - - - - - - 1 1 1 5 9 15 13 12 7 2 1 - - -12.15 ± 0.23
Gant-1GC883-4 2.38 107 - - - - 1 - 3 1 7 17 19 11 17 15 11 3 - 1 1 -11.56 ± 0.23GC883-5 2.25 41 - - - - 1 - - 1 2 4 5 8 5 8 7 - - - - -11.77 ± 0.35
Ataa-1GC883-6 2.00 101 - - - 1 - - 1 1 3 11 10 20 24 17 8 5 - - - -11.96 ± 0.20GC883-7 1.80 103 - - - - - - 1 2 2 5 15 24 21 25 2 5 - 1 - -12.12 ± 0.18GC883-16 1.53 71 - - - - - - - - 2 7 7 14 23 13 3 2 - - - -12.03 ± 0.18GC883-17 1.29 100 - - - - - - - - 1 3 12 26 31 21 3 2 1 - - -12.23 ± 0.13
Gro-3GC883-8 0.66 7 - - - - - - - - - - - - 2 3 2 - - - - -13.40 ± 0.25GC883-9 2.03 16 - - - - - - - - 1 2 3 - 4 2 4 - - - - -12.10 ± 0.51GC883-10 1.81 13 - - - - - - - - - 3 1 1 4 3 1 - - - - -12.05 ± 0.50GC883-11 2.01 5 - - - - - - - - - - 2 - - 2 1 - - - - -12.65 ± 0.90GC883-12 1.51 11 - - - - - - - - - 3 1 3 3 1 - - - - - -11.38 ± 0.46GC883-13 0.65 4 - - - - - - - - - - - - 1 2 1 - - - - -13.39 ± 0.32GC883-14 1.00 6 - - - - - - - - - - - 1 3 2 - - - - - -12.86 ± 0.41
Track length measurements by: C. O'Brien for samples; 8 - 17M. Moore for samples; 1 - 7

Num
ber
ofle
ngth
s1
23
45
67
89
1011
1213
1415
1617
1819
20
Num
ber
ofgr
ains
Std
devi
atio
n
(µm
)
Err
orin
leng
th
(µm
)
Mea
nT
rack
leng
th
(µm
)
Def
ault
fissi
ontr
ack
leng
th*
(µm
)
P (χ²)
Num
ber
ofgr
ains
Err
orin ag
e
(Ma)
Mea
sure
dfis
sion
trac
kag
e(M
a)
Def
ault
fissi
ontr
ack
age*
(Ma)
Cl
Wt %
(µm
)
Num
ber
of tr
acks
in le
ngth
inte
rval
Tab
le B
.3: A
FTA
Dat
a in
Com
posi
tiona
l Gro
ups -
(Geo
trac
k R
epor
t #88
3)
Um
iivik
-1
883-
1†90
55.9
9.6
0.0
2014
.911
.70.
32.
467
300
00
01
00
61
511
913
95
61
00
00.
0 - 0
.190
34.2
5.0
53.6
1214
.912
.30.
42.
021
140
00
00
00
20
12
16
53
10
00
00.
1 - 0
.290
71.1
31.5
88.3
214
.912
.60.
81.
43
30
00
00
00
00
00
10
20
00
00
00.
2 - 0
.390
96.3
41.8
100.
01
14.9
13.8
1.9
3.2
32
00
00
00
00
00
10
00
02
00
00
0.3
- 0.4
9074
.214
.096
.22
15.0
11.5
0.4
2.1
235
00
00
00
01
14
35
41
22
00
00
0.4
- 0.5
9013
6.4
34.6
40.3
215
.09.
11.
23.
27
20
00
01
00
20
03
00
10
00
00
00.
5 - 0
.690
0.0
0.0
0.0
015
.011
.72.
23.
73
20
00
00
00
10
00
01
00
10
00
00.
6 - 0
.7-
--
--
--
--
--
--
--
--
--
--
--
--
--
--
-0.
7 - 0
.8-
--
--
--
--
--
--
--
--
--
--
--
--
--
--
-0.
8 - 0
.9-
--
--
--
--
--
--
--
--
--
--
--
--
--
--
-0.
9 - 1
.091
0.0
0.0
0.0
015
.110
.10.
00.
01
10
00
00
00
00
01
00
00
00
00
01.
0 - 1
.1-
--
--
--
--
--
--
--
--
--
--
--
--
--
--
-1.
1 - 1
.2-
--
--
--
--
--
--
--
--
--
--
--
--
--
--
-1.
2 - 1
.3-
--
--
--
--
--
--
--
--
--
--
--
--
--
--
-1.
3 - 1
.4-
--
--
--
--
--
--
--
--
--
--
--
--
--
--
-1.
4 - 1
.591
238.
111
3.2
100.
01
15.1
12.3
0.8
2.0
61
00
00
00
00
00
12
20
00
10
00
883-
2†10
020
.28.
52.
710
14.1
8.8
0.4
0.6
21
00
00
00
00
11
00
00
00
00
00
0.0
- 0.1
100
17.3
5.0
5.8
814
.18.
80.
40.
62
10
00
00
00
01
10
00
00
00
00
00.
1 - 0
.210
197
.368
.863
.52
14.1
0.0
0.0
0.0
00
00
00
00
00
00
00
00
00
00
00
Gan
e-1
883-
3†62
35.1
3.5
93.4
2614
.712
.20.
21.
967
300
00
00
01
11
59
1513
127
21
00
00.
0 - 0
.162
35.5
3.7
92.0
2514
.712
.10.
31.
957
240
00
00
01
11
48
1211
126
01
00
00.
1 - 0
.262
30.9
10.5
100.
01
14.8
11.2
0.5
1.0
53
00
00
00
00
01
12
10
00
00
00
0.2
- 0.3
620.
00.
00.
00
14.8
13.4
1.1
1.5
21
00
00
00
00
00
00
10
10
00
00
0.3
- 0.4
630.
00.
00.
00
14.8
15.8
0.0
0.0
11
00
00
00
00
00
00
00
01
00
00
0.4
- 0.5
--
--
--
--
--
--
--
--
--
--
--
--
--
--
--
0.5
- 0.6
630.
00.
00.
00
14.9
13.3
1.8
2.5
21
00
00
00
00
00
01
00
01
00
00
*Fis
sion
Tra
ck A
ge a
nd M
ean
Trac
k Le
ngth
pre
dict
ed fr
om th
e D
efau
lt Th
erm
al H
isto
ry (i
.e. i
f the
sam
ple
has n
ot b
een
hotte
r in
the
past
)†C
ombi
ned
data
for a
ll co
mpo
sitio
nal g
roup
s
B.13

Num
ber
ofle
ngth
s1
23
45
67
89
1011
1213
1415
1617
1819
20
Num
ber
ofgr
ains
Std
devi
atio
n
(µm
)
Err
orin
leng
th
(µm
)
Mea
nT
rack
leng
th
(µm
)
Def
ault
fissi
ontr
ack
leng
th*
(µm
)
P (χ²)
Num
ber
ofgr
ains
Err
orin ag
e
(Ma)
Mea
sure
dfis
sion
trac
kag
e(M
a)
Def
ault
fissi
ontr
ack
age*
(Ma)
Cl
Wt %
(µm
)
Num
ber
of tr
acks
in le
ngth
inte
rval
Tab
le B
.3: C
ontin
ued
- (G
eotr
ack
Rep
ort #
883)
Gan
t-1
883-
4†67
66.4
10.0
0.0
2115
.111
.60.
22.
410
743
00
00
10
31
717
1911
1715
113
01
10
0.0
- 0.1
6737
.26.
416
.89
15.0
12.2
0.3
2.3
4519
00
00
00
11
22
95
98
60
01
10
0.1
- 0.2
6751
.410
.589
.55
15.1
11.3
0.5
2.2
207
00
00
00
00
35
21
44
01
00
00
0.2
- 0.3
6761
.912
.519
.02
15.1
12.1
0.6
2.0
137
00
00
00
00
11
31
21
31
00
00
0.3
- 0.4
6716
0.9
33.0
31.9
215
.19.
70.
82.
611
30
00
01
01
00
33
11
10
00
00
00.
4 - 0
.567
56.9
32.3
100.
01
15.1
12.6
1.6
2.7
32
00
00
00
00
01
00
01
10
00
00
0.5
- 0.6
670.
00.
00.
00
15.2
6.7
0.0
0.0
11
00
00
00
10
00
00
00
00
00
00
0.6
- 0.7
6714
3.8
33.7
53.9
215
.210
.41.
01.
83
20
00
00
00
01
01
10
00
00
00
00.
7 - 0
.868
0.0
0.0
0.0
015
.210
.30.
41.
39
10
00
00
00
00
51
21
00
00
00
00.
8 - 0
.9-
--
--
--
--
--
--
--
--
--
--
--
--
--
--
-0.
9 - 1
.0-
--
--
--
--
--
--
--
--
--
--
--
--
--
--
-1.
0 - 1
.1-
--
--
--
--
--
--
--
--
--
--
--
--
--
--
-1.
1 - 1
.2-
--
--
--
--
--
--
--
--
--
--
--
--
--
--
-1.
2 - 1
.3-
--
--
--
--
--
--
--
--
--
--
--
--
--
--
-1.
3 - 1
.4-
--
--
--
--
--
--
--
--
--
--
--
--
--
--
-1.
4 - 1
.5-
--
--
--
--
--
--
--
--
--
--
--
--
--
--
-1.
5 - 1
.6-
--
--
--
--
--
--
--
--
--
--
--
--
--
--
-1.
6 - 1
.7-
--
--
--
--
--
--
--
--
--
--
--
--
--
--
-1.
7 - 1
.868
0.0
0.0
0.0
015
.315
.00.
60.
82
10
00
00
00
00
00
00
01
10
00
0
883-
5†79
31.2
2.9
5.3
2314
.511
.80.
42.
241
140
00
01
00
12
45
85
87
00
00
00.
0 - 0
.178
24.6
3.7
14.7
1514
.511
.70.
42.
030
90
00
00
00
12
34
64
64
00
00
00.
1 - 0
.279
29.9
5.5
25.5
414
.513
.40.
91.
84
20
00
00
00
00
01
00
12
00
00
00.
2 - 0
.379
47.3
11.9
6.2
214
.511
.60.
91.
84
20
00
00
00
00
10
20
01
00
00
00.
3 - 0
.4-
--
--
--
--
--
--
--
--
--
--
--
--
--
--
-0.
4 - 0
.5-
--
--
--
--
--
--
--
--
--
--
--
--
--
--
-0.
5 - 0
.680
39.4
6.4
100.
01
14.7
10.0
2.9
5.0
31
00
00
10
00
00
00
11
00
00
00
0.6
- 0.7
--
--
--
--
--
--
--
--
--
--
--
--
--
--
--
0.7
- 0.8
--
--
--
--
--
--
--
--
--
--
--
--
--
--
--
0.8
- 0.9
800.
053
.50.
01
14.8
0.0
0.0
0.0
00
00
00
00
00
00
00
00
00
00
00
*Fis
sion
Tra
ck A
ge a
nd M
ean
Trac
k Le
ngth
pre
dict
ed fr
om th
e D
efau
lt Th
erm
al H
isto
ry (i
.e. i
f the
sam
ple
has n
ot b
een
hotte
r in
the
past
)†C
ombi
ned
data
for a
ll co
mpo
sitio
nal g
roup
s
B.14
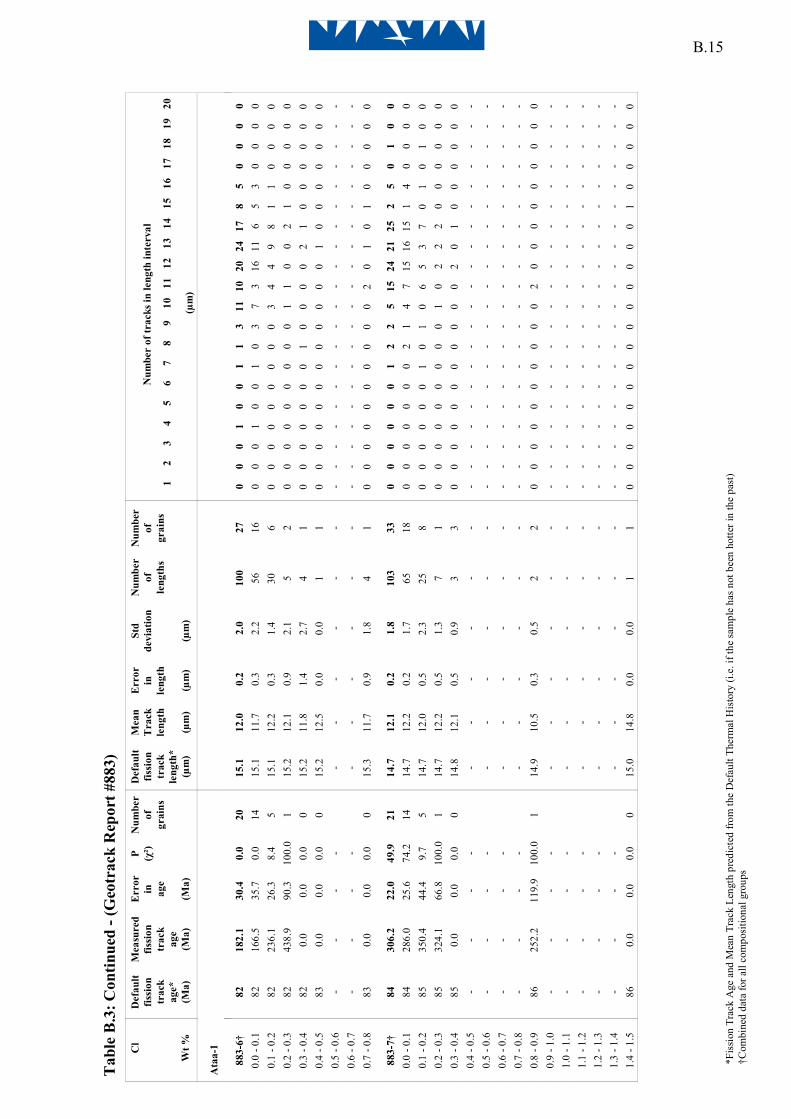
Num
ber
ofle
ngth
s1
23
45
67
89
1011
1213
1415
1617
1819
20
Num
ber
ofgr
ains
Std
devi
atio
n
(µm
)
Err
orin
leng
th
(µm
)
Mea
nT
rack
leng
th
(µm
)
Def
ault
fissi
ontr
ack
leng
th*
(µm
)
P (χ²)
Num
ber
ofgr
ains
Err
orin ag
e
(Ma)
Mea
sure
dfis
sion
trac
kag
e(M
a)
Def
ault
fissi
ontr
ack
age*
(Ma)
Cl
Wt %
(µm
)
Num
ber
of tr
acks
in le
ngth
inte
rval
Tab
le B
.3: C
ontin
ued
- (G
eotr
ack
Rep
ort #
883)
Ata
a-1
883-
6†82
182.
130
.40.
020
15.1
12.0
0.2
2.0
100
270
00
10
01
13
1110
2024
178
50
00
00.
0 - 0
.182
166.
535
.70.
014
15.1
11.7
0.3
2.2
5616
00
01
00
10
37
316
116
53
00
00
0.1
- 0.2
8223
6.1
26.3
8.4
515
.112
.20.
31.
430
60
00
00
00
00
34
49
81
10
00
00.
2 - 0
.382
438.
990
.310
0.0
115
.212
.10.
92.
15
20
00
00
00
00
11
00
21
00
00
00.
3 - 0
.482
0.0
0.0
0.0
015
.211
.81.
42.
74
10
00
00
00
10
00
02
10
00
00
00.
4 - 0
.583
0.0
0.0
0.0
015
.212
.50.
00.
01
10
00
00
00
00
00
01
00
00
00
00.
5 - 0
.6-
--
--
--
--
--
--
--
--
--
--
--
--
--
--
-0.
6 - 0
.7-
--
--
--
--
--
--
--
--
--
--
--
--
--
--
-0.
7 - 0
.883
0.0
0.0
0.0
015
.311
.70.
91.
84
10
00
00
00
00
02
01
01
00
00
0
883-
7†84
306.
222
.049
.921
14.7
12.1
0.2
1.8
103
330
00
00
01
22
515
2421
252
50
10
00.
0 - 0
.184
286.
025
.674
.214
14.7
12.2
0.2
1.7
6518
00
00
00
02
14
715
1615
14
00
00
0.1
- 0.2
8535
0.4
44.4
9.7
514
.712
.00.
52.
325
80
00
00
01
01
06
53
70
10
10
00.
2 - 0
.385
324.
166
.810
0.0
114
.712
.20.
51.
37
10
00
00
00
00
10
22
20
00
00
00.
3 - 0
.485
0.0
0.0
0.0
014
.812
.10.
50.
93
30
00
00
00
00
00
20
10
00
00
00.
4 - 0
.5-
--
--
--
--
--
--
--
--
--
--
--
--
--
--
-0.
5 - 0
.6-
--
--
--
--
--
--
--
--
--
--
--
--
--
--
-0.
6 - 0
.7-
--
--
--
--
--
--
--
--
--
--
--
--
--
--
-0.
7 - 0
.8-
--
--
--
--
--
--
--
--
--
--
--
--
--
--
-0.
8 - 0
.986
252.
211
9.9
100.
01
14.9
10.5
0.3
0.5
22
00
00
00
00
00
20
00
00
00
00
0.9
- 1.0
--
--
--
--
--
--
--
--
--
--
--
--
--
--
--
1.0
- 1.1
--
--
--
--
--
--
--
--
--
--
--
--
--
--
--
1.1
- 1.2
--
--
--
--
--
--
--
--
--
--
--
--
--
--
--
1.2
- 1.3
--
--
--
--
--
--
--
--
--
--
--
--
--
--
--
1.3
- 1.4
--
--
--
--
--
--
--
--
--
--
--
--
--
--
--
1.4
- 1.5
860.
00.
00.
00
15.0
14.8
0.0
0.0
11
00
00
00
00
00
00
00
10
00
00
*Fis
sion
Tra
ck A
ge a
nd M
ean
Trac
k Le
ngth
pre
dict
ed fr
om th
e D
efau
lt Th
erm
al H
isto
ry (i
.e. i
f the
sam
ple
has n
ot b
een
hotte
r in
the
past
)†C
ombi
ned
data
for a
ll co
mpo
sitio
nal g
roup
s
B.15

Num
ber
ofle
ngth
s1
23
45
67
89
1011
1213
1415
1617
1819
20
Num
ber
ofgr
ains
Std
devi
atio
n
(µm
)
Err
orin
leng
th
(µm
)
Mea
nT
rack
leng
th
(µm
)
Def
ault
fissi
ontr
ack
leng
th*
(µm
)
P (χ²)
Num
ber
ofgr
ains
Err
orin ag
e
(Ma)
Mea
sure
dfis
sion
trac
kag
e(M
a)
Def
ault
fissi
ontr
ack
age*
(Ma)
Cl
Wt %
(µm
)
Num
ber
of tr
acks
in le
ngth
inte
rval
Tab
le B
.3: C
ontin
ued
- (G
eotr
ack
Rep
ort #
883)
883-
16†
8223
2.2
13.8
8.3
2015
.112
.00.
21.
571
260
00
00
00
02
77
1423
133
20
00
00.
0 - 0
.182
224.
314
.111
.015
15.1
12.0
0.2
1.6
4617
00
00
00
00
24
49
177
21
00
00
0.1
- 0.2
8226
0.7
41.6
42.1
315
.112
.10.
41.
516
50
00
00
00
00
23
14
51
00
00
00.
2 - 0
.382
495.
518
5.9
74.8
215
.212
.40.
51.
36
30
00
00
00
00
00
32
00
10
00
00.
3 - 0
.482
0.0
0.0
0.0
015
.211
.61.
22.
13
10
00
00
00
00
10
10
10
00
00
0
883-
17†
8422
4.1
31.7
0.0
2014
.712
.20.
11.
399
330
00
00
00
01
312
2631
213
21
00
00.
0 - 0
.184
251.
032
.30.
111
14.7
12.2
0.2
1.4
6721
00
00
00
00
12
821
1812
22
10
00
0.1
- 0.2
8518
3.2
58.4
0.0
714
.712
.50.
31.
117
90
00
00
00
00
02
34
80
00
00
00.
2 - 0
.385
421.
079
.710
0.0
114
.712
.90.
41.
07
10
00
00
00
00
00
14
11
00
00
00.
3 - 0
.485
0.0
0.0
0.0
014
.811
.70.
91.
84
10
00
00
00
00
10
03
00
00
00
00.
4 - 0
.585
152.
282
.310
0.0
114
.811
.40.
40.
84
10
00
00
00
00
02
11
00
00
00
0
Gro
-3
883-
8†65
33.7
4.5
0.1
2214
.513
.40.
30.
77
60
00
00
00
00
00
02
32
00
00
00.
0 - 0
.164
26.8
5.1
1.4
1014
.513
.00.
30.
63
30
00
00
00
00
00
02
10
00
00
00.
1 - 0
.265
32.7
4.9
5.5
614
.513
.70.
50.
72
20
00
00
00
00
00
00
11
00
00
00.
2 - 0
.365
53.9
11.7
17.6
214
.613
.70.
60.
92
10
00
00
00
00
00
00
11
00
00
00.
3 - 0
.465
33.0
25.6
1.0
214
.60.
00.
00.
00
00
00
00
00
00
00
00
00
00
00
00.
4 - 0
.5-
--
--
--
--
--
--
--
--
--
--
--
--
--
--
-0.
5 - 0
.665
69.7
32.9
47.8
214
.70.
00.
00.
00
00
00
00
00
00
00
00
00
00
00
0
*Fis
sion
Tra
ck A
ge a
nd M
ean
Trac
k Le
ngth
pre
dict
ed fr
om th
e D
efau
lt Th
erm
al H
isto
ry (i
.e. i
f the
sam
ple
has n
ot b
een
hotte
r in
the
past
)†C
ombi
ned
data
for a
ll co
mpo
sitio
nal g
roup
s
B.16

Num
ber
ofle
ngth
s1
23
45
67
89
1011
1213
1415
1617
1819
20
Num
ber
ofgr
ains
Std
devi
atio
n
(µm
)
Err
orin
leng
th
(µm
)
Mea
nT
rack
leng
th
(µm
)
Def
ault
fissi
ontr
ack
leng
th*
(µm
)
P (χ²)
Num
ber
ofgr
ains
Err
orin ag
e
(Ma)
Mea
sure
dfis
sion
trac
kag
e(M
a)
Def
ault
fissi
ontr
ack
age*
(Ma)
Cl
Wt %
(µm
)
Num
ber
of tr
acks
in le
ngth
inte
rval
Tab
le B
.3: C
ontin
ued
- (G
eotr
ack
Rep
ort #
883)
883-
9†68
34.3
7.2
0.0
2114
.312
.10.
52.
016
80
00
00
00
01
23
04
24
00
00
00.
0 - 0
.168
25.8
4.6
80.7
814
.212
.90.
61.
57
40
00
00
00
00
01
03
12
00
00
00.
1 - 0
.268
34.0
10.6
33.0
414
.214
.00.
10.
12
10
00
00
00
00
00
00
11
00
00
00.
2 - 0
.368
27.2
5.0
27.2
214
.310
.80.
51.
14
10
00
00
00
00
12
01
00
00
00
00.
3 - 0
.469
18.6
7.4
62.2
214
.314
.60.
00.
01
10
00
00
00
00
00
00
01
00
00
00.
4 - 0
.569
24.6
17.0
3.5
214
.40.
00.
00.
00
00
00
00
00
00
00
00
00
00
00
00.
5 - 0
.669
69.7
40.3
100.
01
14.4
0.0
0.0
0.0
00
00
00
00
00
00
00
00
00
00
00
0.6
- 0.7
6944
.513
.110
0.0
114
.50.
00.
00.
00
00
00
00
00
00
00
00
00
00
00
00.
7 - 0
.8-
--
--
--
--
--
--
--
--
--
--
--
--
--
--
-0.
8 - 0
.9-
--
--
--
--
--
--
--
--
--
--
--
--
--
--
-0.
9 - 1
.0-
--
--
--
--
--
--
--
--
--
--
--
--
--
--
-1.
0 - 1
.1-
--
--
--
--
--
--
--
--
--
--
--
--
--
--
-1.
1 - 1
.2-
--
--
--
--
--
--
--
--
--
--
--
--
--
--
-1.
2 - 1
.3-
--
--
--
--
--
--
--
--
--
--
--
--
--
--
-1.
3 - 1
.4-
--
--
--
--
--
--
--
--
--
--
--
--
--
--
-1.
4 - 1
.5-
--
--
--
--
--
--
--
--
--
--
--
--
--
--
-1.
5 - 1
.6-
--
--
--
--
--
--
--
--
--
--
--
--
--
--
-1.
6 - 1
.7-
--
--
--
--
--
--
--
--
--
--
--
--
--
--
-1.
7 - 1
.8-
--
--
--
--
--
--
--
--
--
--
--
--
--
--
-1.
8 - 1
.970
207.
042
.210
0.0
114
.68.
90.
50.
72
10
00
00
00
01
10
00
00
00
00
0
883-
10†
8129
.08.
90.
022
13.4
12.1
0.5
1.8
137
00
00
00
00
03
11
43
10
00
00
0.0
- 0.1
8116
.610
.80.
013
13.1
12.0
0.7
1.9
83
00
00
00
00
02
10
31
10
00
00
0.1
- 0.2
8180
.421
.354
.32
13.2
0.0
0.0
0.0
00
00
00
00
00
00
00
00
00
00
00
0.2
- 0.3
8268
.413
.724
.23
13.3
12.7
0.5
0.9
32
00
00
00
00
00
01
11
00
00
00
0.3
- 0.4
--
--
--
--
--
--
--
--
--
--
--
--
--
--
--
0.4
- 0.5
838.
44.
310
0.0
113
.50.
00.
00.
00
00
00
00
00
00
00
00
00
00
00
00.
5 - 0
.684
0.0
175.
50.
01
13.6
0.0
0.0
0.0
00
00
00
00
00
00
00
00
00
00
00
0.6
- 0.7
--
--
--
--
--
--
--
--
--
--
--
--
--
--
--
0.7
- 0.8
--
--
--
--
--
--
--
--
--
--
--
--
--
--
--
0.8
- 0.9
8528
.56.
521
.42
13.8
11.4
2.4
3.3
22
00
00
00
00
01
00
01
00
00
00
*Fis
sion
Tra
ck A
ge a
nd M
ean
Trac
k Le
ngth
pre
dict
ed fr
om th
e D
efau
lt Th
erm
al H
isto
ry (i
.e. i
f the
sam
ple
has n
ot b
een
hotte
r in
the
past
)†C
ombi
ned
data
for a
ll co
mpo
sitio
nal g
roup
s
B.17

Num
ber
ofle
ngth
s1
23
45
67
89
1011
1213
1415
1617
1819
20
Num
ber
ofgr
ains
Std
devi
atio
n
(µm
)
Err
orin
leng
th
(µm
)
Mea
nT
rack
leng
th
(µm
)
Def
ault
fissi
ontr
ack
leng
th*
(µm
)
P (χ²)
Num
ber
ofgr
ains
Err
orin ag
e
(Ma)
Mea
sure
dfis
sion
trac
kag
e(M
a)
Def
ault
fissi
ontr
ack
age*
(Ma)
Cl
Wt %
(µm
)
Num
ber
of tr
acks
in le
ngth
inte
rval
Tab
le B
.3: C
ontin
ued
- (G
eotr
ack
Rep
ort #
883)
883-
11†
8228
.010
.40.
021
12.7
12.6
0.9
2.0
53
00
00
00
00
00
20
02
10
00
00
0.0
- 0.1
8124
.014
.70.
013
12.2
12.7
1.1
1.9
31
00
00
00
00
00
10
02
00
00
00
0.1
- 0.2
8214
.32.
79.
64
12.4
10.6
0.0
0.0
11
00
00
00
00
00
10
00
00
00
00
0.2
- 0.3
8381
.336
.310
0.0
112
.50.
00.
00.
00
00
00
00
00
00
00
00
00
00
00
00.
3 - 0
.4-
--
--
--
--
--
--
--
--
--
--
--
--
--
--
-0.
4 - 0
.5-
--
--
--
--
--
--
--
--
--
--
--
--
--
--
-0.
5 - 0
.6-
--
--
--
--
--
--
--
--
--
--
--
--
--
--
-0.
6 - 0
.786
11.4
8.3
100.
01
13.0
0.0
0.0
0.0
00
00
00
00
00
00
00
00
00
00
00
0.7
- 0.8
--
--
--
--
--
--
--
--
--
--
--
--
--
--
--
0.8
- 0.9
8823
.314
.210
0.0
113
.30.
00.
00.
00
00
00
00
00
00
00
00
00
00
00
00.
9 - 1
.0-
--
--
--
--
--
--
--
--
--
--
--
--
--
--
-1.
0 - 1
.1-
--
--
--
--
--
--
--
--
--
--
--
--
--
--
-1.
1 - 1
.288
61.1
26.3
100.
01
13.3
14.7
0.0
0.0
11
00
00
00
00
00
00
00
10
00
00
883-
12†
8027
.214
.10.
015
11.7
11.4
0.5
1.5
113
00
00
00
00
03
13
31
00
00
00
0.0
- 0.1
7950
.729
.90.
08
11.4
11.2
0.5
1.5
102
00
00
00
00
03
13
21
00
00
00
0.1
- 0.2
800.
08.
90.
01
11.6
0.0
0.0
0.0
00
00
00
00
00
00
00
00
00
00
00
0.2
- 0.3
8210
.05.
84.
84
11.9
0.0
0.0
0.0
00
00
00
00
00
00
00
00
00
00
00
0.3
- 0.4
830.
012
.80.
01
12.1
0.0
0.0
0.0
00
00
00
00
00
00
00
00
00
00
00
0.4
- 0.5
8513
.14.
310
0.0
112
.312
.80.
00.
01
10
00
00
00
00
00
01
00
00
00
0
883-
13†
6921
.56.
00.
020
10.6
13.4
0.3
0.6
43
00
00
00
00
00
00
12
10
00
00
0.0
- 0.1
6013
.86.
30.
28
9.9
0.0
0.0
0.0
00
00
00
00
00
00
00
00
00
00
00
0.1
- 0.2
695.
55.
644
.03
10.3
0.0
0.0
0.0
00
00
00
00
00
00
00
00
00
00
00
0.2
- 0.3
7641
.812
.20.
77
10.6
13.4
0.3
0.6
43
00
00
00
00
00
00
12
10
00
00
0.3
- 0.4
810.
08.
90.
01
11.0
0.0
0.0
0.0
00
00
00
00
00
00
00
00
00
00
00
0.4
- 0.5
830.
011
5.2
0.0
111
.30.
00.
00.
00
00
00
00
00
00
00
00
00
00
00
0
*Fis
sion
Tra
ck A
ge a
nd M
ean
Trac
k Le
ngth
pre
dict
ed fr
om th
e D
efau
lt Th
erm
al H
isto
ry (i
.e. i
f the
sam
ple
has n
ot b
een
hotte
r in
the
past
)†C
ombi
ned
data
for a
ll co
mpo
sitio
nal g
roup
s
B.18

Num
ber
ofle
ngth
s1
23
45
67
89
1011
1213
1415
1617
1819
20
Num
ber
ofgr
ains
Std
devi
atio
n
(µm
)
Err
orin
leng
th
(µm
)
Mea
nT
rack
leng
th
(µm
)
Def
ault
fissi
ontr
ack
leng
th*
(µm
)
P (χ²)
Num
ber
ofgr
ains
Err
orin ag
e
(Ma)
Mea
sure
dfis
sion
trac
kag
e(M
a)
Def
ault
fissi
ontr
ack
age*
(Ma)
Cl
Wt %
(µm
)
Num
ber
of tr
acks
in le
ngth
inte
rval
Tab
le B
.3: C
ontin
ued
- (G
eotr
ack
Rep
ort #
883)
883-
14†
4928
.68.
50.
021
9.9
12.9
0.4
1.0
64
00
00
00
00
00
01
32
00
00
00
0.0
- 0.1
312.
41.
215
.89
9.3
11.2
0.0
0.0
11
00
00
00
00
00
01
00
00
00
00
0.1
- 0.2
4642
.032
.510
0.0
19.
50.
00.
00.
00
00
00
00
00
00
00
00
00
00
00
00.
2 - 0
.360
75.5
10.5
47.4
79.
813
.30.
40.
74
20
00
00
00
00
00
02
20
00
00
00.
3 - 0
.471
0.0
3.6
0.0
310
.312
.70.
00.
01
10
00
00
00
00
00
01
00
00
00
00.
4 - 0
.5-
--
--
--
--
--
--
--
--
--
--
--
--
--
--
-0.
5 - 0
.682
0.0
23.2
0.0
110
.90.
00.
00.
00
00
00
00
00
00
00
00
00
00
00
0
*Fis
sion
Tra
ck A
ge a
nd M
ean
Trac
k Le
ngth
pre
dict
ed fr
om th
e D
efau
lt Th
erm
al H
isto
ry (i
.e. i
f the
sam
ple
has n
ot b
een
hotte
r in
the
past
)†C
ombi
ned
data
for a
ll co
mpo
sitio
nal g
roup
s
B.19

B.20
Estimates zi
Standard errors σi
Reference value zo
Standardised estimates yi = ( zi- zo) / σi
Precision xi = 1 / σi PLOT yi against xi
-2-10+1+2
xi
yi
z = zi o
iz
iz
+ 2 σ i
iz -
2 σ i
Slope of line from origin through data point = yi / xi
= {(zi- zo)/σi} / {1/σi}
= zi- zo
Key Points:
Radial lines emanating from the origin correspond to fixed values of z
Data points with higher values of xi have greater precision.
Error bars on all points are the same size in this plot.
Figure B.1 Basic construction of a radial plot. In AFTA, the estimates zi correspond to the
fission track age values for individual apatite grains. Any convenient value of age can be chosen as the reference value corresponding to the horizontal in the radial plot. Radial lines emanating from the origin with positive slopes correspond to fission track ages greater than the reference value. Lines with negative slopes correspond to fission track ages less than the reference value.

B.21
Normal radial plot (equations B.2 and B.3)
- 2101
+2
OLDER
YOUNGER
Allowed range for a single population
zero ages
Reference age
Ages > reference age
Ages < referenceage
LESS PRECISE
MORE PRECISE
Arc-sin radial plot (equations B.2 and B.4)
-2-10
+1+2
OLDER
YOUNGER
Allowed range for a single population
zero ages
Reference age
Ages > reference age
Ages < referenceage
LESS PRECISE
MORE PRECISE
Figure B.2 Simplified structure of Normal and Arc-sin radial plots.

B.22
Fission Track Age Data Sheets - Glossary Ns = Number of spontaneous tracks in Na grid squares Ni = Number of induced tracks in Na grid squares Na = Number of grid squares counted in each grain RATIO = NS/Ni U (ppm) = Uranium content of each grain (= U content of standard
glass * ρi/ρD) Cl (wt%) = Weight percent chlorine content of each grain ρs = Spontaneous track density (ρs) = Ns/ (Na*area of basic unit) ρi = Induced track density (ρi) = Ni/(Na*area of basic unit) F.T. AGE = Fission track age, calculated using equation B.1 Area of basic unit = Area of one grid square Chi squared = χ2 parameter, used to assess variation of single grain ages
within the sample P(chi squared) = Probability of obtaining observed χ2 value for the relevant
number of degrees of freedom, if all grains belong to a single population
Age Dispersion = % variation in single grain ages - see discussion in text re “Central age”
Ns/Ni = Pooled ratio, total spontaneous tracks divided by total induced tracks for all grains
Mean ratio = Mean of (Ns/Ni) for individual grains Zeta = Calibration constant, determined empirically for each
observer ρD = Track density (ρD) from uranium standard glass
(interpolated from values at each end of stack) ND = Total number of tracks counted for determining ρD POOLED AGE = Fission track age calculated from pooled ratio Ns/Ni. Valid
only when P(χ2) > 5% CENTRAL AGE = Alternative to pooled age when P(χ2)< 5%
Key to Figures:
A: Radial plot of single grain ages
(See Figures B.1 and B.2 for details of radial plot construction)
B: Distribution of Cl contents in apatite grains
C: Single grain age vs weight % Cl for individual apatite grains.
D: Distribution of confined track lengths

ρ
GC883-1 Apatite Umiivik-1 278-291m Counted by: MEM
150 513 5.309E+05 1.816E+06 21.0
Current grain no
N N N s i RATIO U(ppm)
Cl(wt%)
F.T. AGE(Ma)
² = 49.440 with 19 degrees of freedom²) =0.0%
Age Dispersion =57.946% Ns / Ni = 0.292 ± 0.027Mean Ratio = 0.341 ± 0.067
Ages calculated using a zeta of 392.9 ± 7.4 for CN5 glassD = 9.878E+05cm-² ND =1679
POOLED AGE = 56.5 ± 5.5 MaCENTRAL AGE = 55.9 ± 9.6 Ma
χχP(
Area of basic unit = 6.293E-07 cm-²
ρ
ρρD interpolated between top of can; D = 9.878E+05cm-² ND =777ρ
bottom of can; D = 1.147E+06cm-² ND =902ρ
Slideref
is a
A: B:
C: D:
Mean track length 11.72 ± 0.30 µm Std. Dev. 2.42 µm 67 tracks
B.23
G938-1 3 7 46 40 0.152 21.12.781E+05 1.827E+06 29.5 12.00.00 ± G938-1 4 5 13 50 0.385 4.81.589E+05 4.132E+05 74.2 39.10.17 ± G938-1 5 2 6 12 0.333 9.22.648E+05 7.945E+05 64.4 52.60.14 ± G938-1 6 21 69 10 0.304 126.53.337E+06 1.096E+07 58.8 14.80.00 ± G938-1 7 8 16 15 0.500 19.68.475E+05 1.695E+06 96.3 41.80.24 ± G938-1 11 2 5 30 0.400 3.11.059E+05 2.648E+05 77.2 64.60.32 ± G938-1 12 2 14 21 0.143 12.21.513E+05 1.059E+06 27.7 20.90.06 ± G938-1 16 3 33 32 0.091 18.91.490E+05 1.639E+06 17.6 10.60.00 ± G938-1 18 2 19 25 0.105 13.91.271E+05 1.208E+06 20.4 15.20.00 ± G938-1 19 1 11 49 0.091 4.13.243E+04 3.567E+05 17.6 18.40.08 ± G938-1 20 12 13 18 0.923 13.21.059E+06 1.148E+06 176.7 70.90.49 ± G938-1 21 3 8 24 0.375 6.11.986E+05 5.297E+05 72.4 49.00.00 ± G938-1 22 3 31 18 0.097 31.62.648E+05 2.737E+06 18.8 11.40.07 ± G938-1 23 38 99 9 0.384 201.76.709E+06 1.748E+07 74.1 14.30.32 ± G938-1 24 3 23 32 0.130 13.21.490E+05 1.142E+06 25.3 15.50.03 ± G938-1 25 3 17 9 0.176 34.65.297E+05 3.002E+06 34.2 21.40.00 ± G938-1 26 2 9 15 0.222 11.02.119E+05 9.534E+05 43.0 33.60.07 ± G938-1 27 15 25 12 0.600 38.21.986E+06 3.311E+06 115.4 37.90.42 ± G938-1 28 8 48 16 0.167 55.07.945E+05 4.767E+06 32.3 12.40.00 ± G938-1 29 10 8 12 1.250 12.21.324E+06 1.059E+06 238.1 113.21.41 ±

ρ
GC883-2 Apatite Umiivik-1 1027-1030m Counted by: MEM
16 153 1.541E+05 1.473E+06 16.8
Current grain no
N N N s i RATIO U(ppm)
Cl(wt%)
F.T. AGE(Ma)
² = 18.774 with 9 degrees of freedom²) =2.7%
Age Dispersion =84.740% Ns / Ni = 0.105 ± 0.027Mean Ratio = 0.141 ± 0.071
Ages calculated using a zeta of 392.9 ± 7.4 for CN5 glassD = 9.977E+05cm-² ND =1679
POOLED AGE = 20.5 ± 5.4 MaCENTRAL AGE = 20.2 ± 8.5 Ma
χχP(
Area of basic unit = 6.293E-07 cm-²
ρ
ρρD interpolated between top of can; D = 9.878E+05cm-² ND =777ρ
bottom of can; D = 1.147E+06cm-² ND =902ρ
Slideref
is a
A: B:
C: D:
Mean track length 8.80 ± 0.43 µm Std. Dev. 0.62 µm 2 tracks
B.24
G938-2 3 0 8 21 0.000 6.90.000E+00 6.054E+05 0.0 44.20.08 ± G938-2 4 0 4 15 0.000 4.80.000E+00 4.238E+05 0.0 107.40.04 ± G938-2 5 0 8 9 0.000 16.10.000E+00 1.413E+06 0.0 44.20.06 ± G938-2 6 8 54 18 0.148 54.57.063E+05 4.767E+06 29.0 11.00.01 ± G938-2 10 1 3 12 0.333 4.51.324E+05 3.973E+05 65.0 75.10.17 ± G938-2 11 0 8 6 0.000 24.20.000E+00 2.119E+06 0.0 44.20.04 ± G938-2 12 0 41 20 0.000 37.20.000E+00 3.258E+06 0.0 7.40.08 ± G938-2 13 5 19 24 0.263 14.43.311E+05 1.258E+06 51.4 25.90.01 ± G938-2 15 0 5 20 0.000 4.50.000E+00 3.973E+05 0.0 79.40.06 ± G938-2 16 2 3 20 0.667 2.71.589E+05 2.384E+05 129.4 118.20.11 ±

ρ
GC883-3 Apatite Gane-1 510-515m Counted by: MEM
127 715 1.430E+05 8.052E+05 9.1
Current grain no
N N N s i RATIO U(ppm)
Cl(wt%)
F.T. AGE(Ma)
² = 15.295 with 25 degrees of freedom²) =93.4%
Age Dispersion =1.259% (did not converge)Ns / Ni = 0.178 ± 0.017Mean Ratio = 0.115 ± 0.022
Ages calculated using a zeta of 392.9 ± 7.4 for CN5 glassD = 1.008E+06cm-² ND =1679
POOLED AGE = 35.1 ± 3.5 MaCENTRAL AGE = 35.1 ± 3.5 Ma
χχP(
Area of basic unit = 6.293E-07 cm-²
ρ
ρρD interpolated between top of can; D = 9.878E+05cm-² ND =777ρ
bottom of can; D = 1.147E+06cm-² ND =902ρ
Slideref
is a
A: B:
C: D:
Mean track length 12.15 ± 0.23 µm Std. Dev. 1.91 µm 67 tracks
B.25
G938-3 3 5 19 100 0.263 3.47.945E+04 3.019E+05 51.9 26.10.00 ± G938-3 5 2 10 40 0.200 4.57.945E+04 3.973E+05 39.5 30.60.02 ± G938-3 6 9 67 32 0.134 37.64.469E+05 3.327E+06 26.5 9.50.04 ± G938-3 7 0 1 40 0.000 0.40.000E+00 3.973E+04 0.0 1481.40.00 ± G938-3 8 0 1 40 0.000 0.40.000E+00 3.973E+04 0.0 1481.40.00 ± G938-3 10 0 3 60 0.000 0.90.000E+00 7.945E+04 0.0 165.40.00 ± G938-3 11 0 5 40 0.000 2.20.000E+00 1.986E+05 0.0 80.20.00 ± G938-3 12 10 64 50 0.156 23.03.178E+05 2.034E+06 30.9 10.50.12 ± G938-3 13 0 6 60 0.000 1.80.000E+00 1.589E+05 0.0 63.50.00 ± G938-3 14 3 12 100 0.250 2.24.767E+04 1.907E+05 49.3 31.90.00 ± G938-3 16 15 86 100 0.174 15.52.384E+05 1.367E+06 34.4 9.70.01 ± G938-3 17 11 84 48 0.131 31.53.642E+05 2.781E+06 25.9 8.30.01 ± G938-3 18 15 56 36 0.268 28.06.621E+05 2.472E+06 52.8 15.40.00 ± G938-3 19 1 8 24 0.125 6.06.621E+04 5.297E+05 24.7 26.20.00 ± G938-3 20 0 2 100 0.000 0.40.000E+00 3.178E+04 0.0 326.50.00 ± G938-3 21 0 1 40 0.000 0.40.000E+00 3.973E+04 0.0 1481.40.00 ± G938-3 22 0 2 25 0.000 1.40.000E+00 1.271E+05 0.0 326.50.00 ± G938-3 23 5 20 42 0.250 8.61.892E+05 7.567E+05 49.3 24.70.07 ± G938-3 28 0 4 50 0.000 1.40.000E+00 1.271E+05 0.0 108.50.00 ± G938-3 29 0 3 40 0.000 1.30.000E+00 1.192E+05 0.0 165.40.01 ± G938-3 30 0 4 80 0.000 0.90.000E+00 7.945E+04 0.0 108.50.00 ± G938-3 31 3 11 100 0.273 2.04.767E+04 1.748E+05 53.8 35.10.00 ± G938-3 32 17 86 64 0.198 24.24.221E+05 2.135E+06 39.0 10.40.01 ± G938-3 33 16 57 20 0.281 51.21.271E+06 4.529E+06 55.3 15.70.05 ± G938-3 34 4 39 40 0.103 17.51.589E+05 1.549E+06 20.3 10.70.02 ± G938-3 37 11 64 40 0.172 28.84.370E+05 2.543E+06 33.9 11.10.03 ±

ρ
GC883-4 Apatite Gant-1 146-153m Counted by: MEM
186 563 5.641E+05 1.707E+06 19.1
Current grain no
N N N s i RATIO U(ppm)
Cl(wt%)
F.T. AGE(Ma)
² = 59.482 with 20 degrees of freedom²) =0.0%
Age Dispersion =50.974% Ns / Ni = 0.330 ± 0.028Mean Ratio = 0.392 ± 0.059
Ages calculated using a zeta of 392.9 ± 7.4 for CN5 glassD = 1.018E+06cm-² ND =1679
POOLED AGE = 65.7 ± 5.9 MaCENTRAL AGE = 66.4 ± 10.0 Ma
χχP(
Area of basic unit = 6.293E-07 cm-²
ρ
ρρD interpolated between top of can; D = 9.878E+05cm-² ND =777ρ
bottom of can; D = 1.147E+06cm-² ND =902ρ
Slideref
is a
A: B:
C: D:
Mean track length 11.56 ± 0.23 µm Std. Dev. 2.38 µm 107 tracks
B.26
G938-4 5 7 13 30 0.538 7.73.708E+05 6.886E+05 106.7 50.20.33 ± G938-4 7 3 33 20 0.091 29.42.384E+05 2.622E+06 18.1 11.00.08 ± G938-4 8 2 2 12 1.000 3.02.648E+05 2.648E+05 196.9 197.00.07 ± G938-4 10 4 14 21 0.286 11.93.027E+05 1.059E+06 56.9 32.30.42 ± G938-4 11 12 75 20 0.160 66.89.534E+05 5.959E+06 31.9 10.00.00 ± G938-4 13 37 41 20 0.902 36.52.940E+06 3.258E+06 177.9 40.70.39 ± G938-4 14 4 14 20 0.286 12.53.178E+05 1.112E+06 56.9 32.30.13 ± G938-4 15 3 16 10 0.188 28.54.767E+05 2.543E+06 37.4 23.50.03 ± G938-4 16 10 41 35 0.244 20.94.540E+05 1.861E+06 48.6 17.20.19 ± G938-4 17 4 16 32 0.250 8.91.986E+05 7.945E+05 49.8 27.90.12 ± G938-4 18 4 25 24 0.160 18.52.648E+05 1.655E+06 31.9 17.20.00 ± G938-4 19 8 37 48 0.216 13.72.648E+05 1.225E+06 43.1 16.80.10 ± G938-4 20 6 36 40 0.167 16.02.384E+05 1.430E+06 33.2 14.70.01 ± G938-4 23 6 10 20 0.600 8.94.767E+05 7.945E+05 118.8 61.50.01 ± G938-4 26 5 20 12 0.250 29.76.621E+05 2.648E+06 49.8 24.90.00 ± G938-4 27 5 8 20 0.625 7.13.973E+05 6.356E+05 123.7 70.60.29 ± G938-4 28 1 8 18 0.125 7.98.828E+04 7.063E+05 24.9 26.50.00 ± G938-4 30 28 98 36 0.286 48.51.236E+06 4.326E+06 56.9 12.30.21 ± G938-4 32 5 12 30 0.417 7.12.648E+05 6.356E+05 82.8 44.10.19 ± G938-4 33 13 21 24 0.619 15.68.607E+05 1.390E+06 122.6 43.40.65 ± G938-4 34 19 23 32 0.826 12.89.435E+05 1.142E+06 163.1 50.80.60 ±

ρ
GC883-5 Apatite Gant-1 749-758m Counted by: MEM
154 994 3.742E+05 2.415E+06 26.8
Current grain no
N N N s i RATIO U(ppm)
Cl(wt%)
F.T. AGE(Ma)
² = 33.662 with 22 degrees of freedom²) =5.3%
Age Dispersion =35.136% Ns / Ni = 0.155 ± 0.013Mean Ratio = 0.153 ± 0.031
Ages calculated using a zeta of 392.9 ± 7.4 for CN5 glassD = 1.027E+06cm-² ND =1679
POOLED AGE = 31.2 ± 2.9 MaCENTRAL AGE = 30.2 ± 4.2 Ma
χχP(
Area of basic unit = 6.293E-07 cm-²
ρ
ρρD interpolated between top of can; D = 9.878E+05cm-² ND =777ρ
bottom of can; D = 1.147E+06cm-² ND =902ρ
Slideref
is a
A: B:
C: D:
Mean track length 11.77 ± 0.35 µm Std. Dev. 2.25 µm 41 tracks
B.27
G938-5 3 47 240 24 0.196 176.33.112E+06 1.589E+07 39.4 6.40.52 ± G938-5 4 1 6 20 0.167 5.37.945E+04 4.767E+05 33.6 36.30.07 ± G938-5 5 1 2 24 0.500 1.56.621E+04 1.324E+05 100.1 122.70.06 ± G938-5 6 0 7 42 0.000 2.90.000E+00 2.648E+05 0.0 53.50.86 ± G938-5 9 0 1 40 0.000 0.40.000E+00 3.973E+04 0.0 1504.70.05 ± G938-5 10 0 9 15 0.000 10.60.000E+00 9.534E+05 0.0 39.60.01 ± G938-5 11 1 13 14 0.077 16.41.135E+05 1.476E+06 15.5 16.10.00 ± G938-5 12 2 106 24 0.019 77.91.324E+05 7.018E+06 3.8 2.70.04 ± G938-5 14 1 14 30 0.071 8.25.297E+04 7.416E+05 14.4 14.90.11 ± G938-5 15 5 43 32 0.116 23.72.483E+05 2.135E+06 23.4 11.10.04 ± G938-5 16 0 3 30 0.000 1.80.000E+00 1.589E+05 0.0 168.50.11 ± G938-5 17 5 37 20 0.135 32.63.973E+05 2.940E+06 27.2 13.00.10 ± G938-5 18 4 23 21 0.174 19.33.027E+05 1.740E+06 35.0 19.00.02 ± G938-5 19 0 1 16 0.000 1.10.000E+00 9.932E+04 0.0 1504.70.00 ± G938-5 20 1 2 18 0.500 2.08.828E+04 1.766E+05 100.1 122.70.09 ± G938-5 21 8 53 45 0.151 20.82.825E+05 1.872E+06 30.4 11.60.03 ± G938-5 23 10 60 35 0.167 30.24.540E+05 2.724E+06 33.6 11.50.00 ± G938-5 25 5 17 16 0.294 18.74.966E+05 1.688E+06 59.1 30.10.00 ± G938-5 26 0 13 21 0.000 10.90.000E+00 9.837E+05 0.0 26.00.22 ± G938-5 32 9 53 40 0.170 23.43.575E+05 2.106E+06 34.2 12.40.09 ± G938-5 33 5 14 20 0.357 12.33.973E+05 1.112E+06 71.7 37.40.12 ± G938-5 34 20 72 27 0.278 47.01.177E+06 4.238E+06 55.8 14.20.24 ± G938-5 37 29 205 80 0.141 45.25.760E+05 4.072E+06 28.5 5.70.11 ±

ρ
GC883-6 Apatite Ataa-1 17-26m Counted by: MEM
722 687 1.348E+06 1.283E+06 14.1
Current grain no
N N N s i RATIO U(ppm)
Cl(wt%)
F.T. AGE(Ma)
² = 168.949 with 19 degrees of freedom²) =0.0%
Age Dispersion =66.072% Ns / Ni = 1.051 ± 0.056Mean Ratio = 1.039 ± 0.149
Ages calculated using a zeta of 392.9 ± 7.4 for CN5 glassD = 1.037E+06cm-² ND =1679
POOLED AGE = 210.7 ± 13.0 MaCENTRAL AGE = 182.1 ± 30.4 Ma
χχP(
Area of basic unit = 6.293E-07 cm-²
ρ
ρρD interpolated between top of can; D = 9.878E+05cm-² ND =777ρ
bottom of can; D = 1.147E+06cm-² ND =902ρ
Slideref
is a
A: B:
C: D:
Mean track length 11.96 ± 0.20 µm Std. Dev. 2.00 µm 101 tracks
B.28
G938-6 4 9 47 60 0.191 13.72.384E+05 1.245E+06 38.9 14.20.06 ± G938-6 6 10 12 16 0.833 13.19.932E+05 1.192E+06 167.6 72.00.04 ± G938-6 8 13 11 12 1.182 16.01.721E+06 1.457E+06 236.5 97.10.05 ± G938-6 9 62 43 16 1.442 46.96.158E+06 4.271E+06 287.4 57.70.02 ± G938-6 10 78 35 24 2.229 25.55.164E+06 2.317E+06 438.9 90.30.25 ± G938-6 11 20 13 25 1.538 9.11.271E+06 8.263E+05 306.2 109.50.00 ± G938-6 12 2 10 60 0.200 2.95.297E+04 2.648E+05 40.6 31.50.13 ± G938-6 13 27 56 64 0.482 15.36.704E+05 1.390E+06 97.5 23.00.00 ± G938-6 14 80 59 36 1.356 28.63.531E+06 2.604E+06 270.6 47.20.14 ± G938-6 16 36 17 16 2.118 18.63.575E+06 1.688E+06 417.7 123.60.03 ± G938-6 17 3 6 90 0.500 1.25.297E+04 1.059E+05 101.1 71.60.00 ± G938-6 18 0 2 70 0.000 0.50.000E+00 4.540E+04 0.0 335.70.00 ± G938-6 19 21 25 80 0.840 5.54.171E+05 4.966E+05 169.0 50.30.00 ± G938-6 21 50 30 24 1.667 21.83.311E+06 1.986E+06 331.0 77.10.02 ± G938-6 22 67 77 50 0.870 26.92.129E+06 2.447E+06 174.9 29.70.08 ± G938-6 23 22 23 60 0.957 6.75.827E+05 6.091E+05 192.1 57.60.14 ± G938-6 25 14 13 28 1.077 8.17.945E+05 7.378E+05 215.8 83.40.18 ± G938-6 26 129 67 40 1.925 29.25.125E+06 2.662E+06 380.9 58.60.09 ± G938-6 27 7 85 60 0.082 24.71.854E+05 2.251E+06 16.8 6.60.00 ± G938-6 28 72 56 20 1.286 48.95.721E+06 4.449E+06 256.8 46.40.12 ±

ρ
GC883-7 Apatite Ataa-1 555-m Counted by: MEM
599 393 1.451E+06 9.520E+05 10.4
Current grain no
N N N s i RATIO U(ppm)
Cl(wt%)
F.T. AGE(Ma)
² = 19.346 with 20 degrees of freedom²) =49.9%
Age Dispersion =0.703% (did not converge)Ns / Ni = 1.524 ± 0.099Mean Ratio = 1.339 ± 0.125
Ages calculated using a zeta of 392.9 ± 7.4 for CN5 glassD = 1.047E+06cm-² ND =1679
POOLED AGE = 306.2 ± 22.0 MaCENTRAL AGE = 306.2 ± 22.0 Ma
χχP(
Area of basic unit = 6.293E-07 cm-²
ρ
ρρD interpolated between top of can; D = 9.878E+05cm-² ND =777ρ
bottom of can; D = 1.147E+06cm-² ND =902ρ
Slideref
is a
A: B:
C: D:
Mean track length 12.12 ± 0.18 µm Std. Dev. 1.80 µm 103 tracks
B.29
G938-7 7 0 1 30 0.000 0.60.000E+00 5.297E+04 0.0 1527.80.00 ± G938-7 10 11 10 16 1.100 10.81.092E+06 9.932E+05 222.4 97.40.04 ± G938-7 11 6 6 56 1.000 1.91.703E+05 1.703E+05 202.5 117.10.09 ± G938-7 12 27 14 10 1.929 24.24.290E+06 2.225E+06 385.1 127.40.05 ± G938-7 15 23 18 9 1.278 34.64.061E+06 3.178E+06 257.7 81.50.00 ± G938-7 16 10 11 40 0.909 4.83.973E+05 4.370E+05 184.4 80.80.01 ± G938-7 18 67 36 35 1.861 17.83.042E+06 1.634E+06 372.0 77.70.11 ± G938-7 19 0 4 25 0.000 2.80.000E+00 2.543E+05 0.0 112.70.18 ± G938-7 20 29 21 21 1.381 17.32.194E+06 1.589E+06 278.1 80.10.01 ± G938-7 21 91 48 50 1.896 16.62.892E+06 1.526E+06 378.7 68.60.03 ± G938-7 22 10 8 60 1.250 2.32.648E+05 2.119E+05 252.2 119.90.87 ± G938-7 23 14 12 15 1.167 13.81.483E+06 1.271E+06 235.7 93.00.03 ± G938-7 24 7 4 64 1.750 1.11.738E+05 9.932E+04 350.4 219.90.10 ± G938-7 25 28 12 40 2.333 5.21.112E+06 4.767E+05 463.1 160.40.13 ± G938-7 26 58 35 12 1.657 50.47.680E+06 4.635E+06 332.3 71.80.17 ± G938-7 27 35 21 16 1.667 22.73.476E+06 2.086E+06 334.1 92.80.03 ± G938-7 28 27 27 18 1.000 25.92.384E+06 2.384E+06 202.5 55.50.03 ± G938-7 29 29 17 9 1.706 32.75.120E+06 3.002E+06 341.8 104.90.11 ± G938-7 30 63 39 20 1.615 33.75.006E+06 3.099E+06 324.1 66.80.28 ± G938-7 31 34 26 60 1.308 7.59.005E+05 6.886E+05 263.6 69.20.02 ± G938-7 32 30 23 50 1.304 8.09.534E+05 7.310E+05 262.9 73.30.00 ±

ρ
GC883-8 Apatite Gro-3 750-780m Counted by: COB
177 1108 2.485E+05 1.555E+06 16.0
Current grain no
N N N s i RATIO U(ppm)
Cl(wt%)
F.T. AGE(Ma)
² = 46.988 with 21 degrees of freedom²) =0.1%
Age Dispersion =40.945% Ns / Ni = 0.160 ± 0.013Mean Ratio = 0.210 ± 0.032
Ages calculated using a zeta of 380.4 ± 5.7 for CN5 glassD = 1.106E+06cm-² ND =1740
POOLED AGE = 33.5 ± 2.9 MaCENTRAL AGE = 33.7 ± 4.5 Ma
χχP(
Area of basic unit = 6.293E-07 cm-²
ρ
ρρD interpolated between top of can; D = 1.105E+06cm-² ND =869ρ
bottom of can; D = 1.107E+06cm-² ND =871ρ
Slideref
is a
A: B:
C: D:
Mean track length 13.40 ± 0.25 µm Std. Dev. 0.66 µm 7 tracks
B.30
G938-8 3 1 8 40 0.125 3.33.973E+04 3.178E+05 26.2 27.80.01 ± G938-8 4 7 90 100 0.078 14.71.112E+05 1.430E+06 16.3 6.40.00 ± G938-8 5 5 91 50 0.055 29.81.589E+05 2.892E+06 11.5 5.30.19 ± G938-8 6 8 37 30 0.216 20.24.238E+05 1.960E+06 45.3 17.70.00 ± G938-8 7 1 29 64 0.034 7.42.483E+04 7.200E+05 7.2 7.40.00 ± G938-8 8 8 74 60 0.108 20.22.119E+05 1.960E+06 22.7 8.50.02 ± G938-8 9 3 7 40 0.429 2.91.192E+05 2.781E+05 89.5 61.80.34 ± G938-8 10 2 9 30 0.222 4.91.059E+05 4.767E+05 46.6 36.40.52 ± G938-8 11 2 4 18 0.500 3.61.766E+05 3.531E+05 104.3 90.40.03 ± G938-8 12 2 11 15 0.182 12.02.119E+05 1.165E+06 38.1 29.30.14 ± G938-8 13 3 41 56 0.073 12.08.513E+04 1.163E+06 15.4 9.20.06 ± G938-8 14 9 22 16 0.409 22.58.939E+05 2.185E+06 85.5 33.90.23 ± G938-8 15 3 6 15 0.500 6.63.178E+05 6.356E+05 104.3 73.80.17 ± G938-8 16 1 32 48 0.031 10.93.311E+04 1.059E+06 6.6 6.70.31 ± G938-8 17 13 55 100 0.236 9.02.066E+05 8.740E+05 49.5 15.30.18 ± G938-8 18 6 40 80 0.150 8.21.192E+05 7.945E+05 31.5 13.80.17 ± G938-8 20 4 9 32 0.444 4.61.986E+05 4.469E+05 92.8 55.80.56 ± G938-8 21 8 58 100 0.138 9.51.271E+05 9.217E+05 28.9 10.90.08 ± G938-8 22 44 194 49 0.227 64.91.427E+06 6.291E+06 47.5 8.00.04 ± G938-8 23 4 65 49 0.062 21.71.297E+05 2.108E+06 12.9 6.70.00 ± G938-8 27 18 83 40 0.217 34.07.151E+05 3.297E+06 45.5 11.90.22 ± G938-8 29 25 143 100 0.175 23.43.973E+05 2.272E+06 36.7 8.00.15 ±

ρ
GC883-8 Apatite - minus contaminant grains Gro-3 750-780m Counted by: COB
165 1082 2.553E+05 1.674E+06 17.3
Current grain no
N N N s i RATIO U(ppm)
Cl(wt%)
F.T. AGE(Ma)
² = 37.728 with 17 degrees of freedom²) =0.3%
Age Dispersion =40.971% Ns / Ni = 0.152 ± 0.013Mean Ratio = 0.152 ± 0.022
Ages calculated using a zeta of 380.4 ± 5.7 for CN5 glassD = 1.106E+06cm-² ND =1740
POOLED AGE = 32.0 ± 2.8 MaCENTRAL AGE = 30.2 ± 4.3 Ma
χχP(
Area of basic unit = 6.293E-07 cm-²
ρ
ρρD interpolated between top of can; D = 1.105E+06cm-² ND =869ρ
bottom of can; D = 1.107E+06cm-² ND =871ρ
Slideref
is a
A: B:
C: D:
Mean track length 13.40 ± 0.25 µm Std. Dev. 0.66 µm 7 tracks
B.31
G938-8 3 1 8 40 0.125 3.33.973E+04 3.178E+05 26.2 27.80.01 ± G938-8 4 7 90 100 0.078 14.71.112E+05 1.430E+06 16.3 6.40.00 ± G938-8 5 5 91 50 0.055 29.81.589E+05 2.892E+06 11.5 5.30.19 ± G938-8 6 8 37 30 0.216 20.24.238E+05 1.960E+06 45.3 17.70.00 ± G938-8 7 1 29 64 0.034 7.42.483E+04 7.200E+05 7.2 7.40.00 ± G938-8 8 8 74 60 0.108 20.22.119E+05 1.960E+06 22.7 8.50.02 ± G938-8 10 2 9 30 0.222 4.91.059E+05 4.767E+05 46.6 36.40.52 ± G938-8 12 2 11 15 0.182 12.02.119E+05 1.165E+06 38.1 29.30.14 ± G938-8 13 3 41 56 0.073 12.08.513E+04 1.163E+06 15.4 9.20.06 ± G938-8 14 9 22 16 0.409 22.58.939E+05 2.185E+06 85.5 33.90.23 ± G938-8 16 1 32 48 0.031 10.93.311E+04 1.059E+06 6.6 6.70.31 ± G938-8 17 13 55 100 0.236 9.02.066E+05 8.740E+05 49.5 15.30.18 ± G938-8 18 6 40 80 0.150 8.21.192E+05 7.945E+05 31.5 13.80.17 ± G938-8 21 8 58 100 0.138 9.51.271E+05 9.217E+05 28.9 10.90.08 ± G938-8 22 44 194 49 0.227 64.91.427E+06 6.291E+06 47.5 8.00.04 ± G938-8 23 4 65 49 0.062 21.71.297E+05 2.108E+06 12.9 6.70.00 ± G938-8 27 18 83 40 0.217 34.07.151E+05 3.297E+06 45.5 11.90.22 ± G938-8 29 25 143 100 0.175 23.43.973E+05 2.272E+06 36.7 8.00.15 ±

ρ
GC883-9 Apatite Gro-3 1000-1020m Counted by: COB
165 899 2.403E+05 1.309E+06 13.5
Current grain no
N N N s i RATIO U(ppm)
Cl(wt%)
F.T. AGE(Ma)
² = 114.250 with 20 degrees of freedom²) =0.0%
Age Dispersion =80.913% Ns / Ni = 0.184 ± 0.016Mean Ratio = 0.180 ± 0.046
Ages calculated using a zeta of 380.4 ± 5.7 for CN5 glassD = 1.106E+06cm-² ND =1740
POOLED AGE = 38.5 ± 3.4 MaCENTRAL AGE = 34.3 ± 7.2 Ma
χχP(
Area of basic unit = 6.293E-07 cm-²
ρ
ρρD interpolated between top of can; D = 1.105E+06cm-² ND =869ρ
bottom of can; D = 1.107E+06cm-² ND =871ρ
Slideref
is a
A: B:
C: D:
Mean track length 12.10 ± 0.51 µm Std. Dev. 2.03 µm 16 tracks
B.32
G938-9 3 4 12 30 0.333 6.62.119E+05 6.356E+05 69.7 40.30.56 ± G938-9 6 4 50 70 0.080 11.79.080E+04 1.135E+06 16.8 8.70.04 ± G938-9 7 0 9 56 0.000 2.60.000E+00 2.554E+05 0.0 41.30.24 ± G938-9 9 0 21 50 0.000 6.90.000E+00 6.674E+05 0.0 16.10.48 ± G938-9 10 5 49 36 0.102 22.32.207E+05 2.163E+06 21.4 10.10.32 ± G938-9 11 6 33 28 0.182 19.33.405E+05 1.873E+06 38.1 17.00.19 ± G938-9 12 4 14 80 0.286 2.97.945E+04 2.781E+05 59.8 34.00.01 ± G938-9 13 4 13 100 0.308 2.16.356E+04 2.066E+05 64.4 36.90.15 ± G938-9 14 5 40 50 0.125 13.11.589E+05 1.271E+06 26.2 12.50.09 ± G938-9 15 2 25 100 0.080 4.13.178E+04 3.973E+05 16.8 12.40.07 ± G938-9 16 5 42 30 0.119 22.92.648E+05 2.225E+06 25.0 11.80.00 ± G938-9 17 8 35 30 0.229 19.14.238E+05 1.854E+06 47.9 18.80.48 ± G938-9 18 49 49 25 1.000 32.13.115E+06 3.115E+06 207.0 42.21.89 ± G938-9 19 2 16 40 0.125 6.67.945E+04 6.356E+05 26.2 19.70.10 ± G938-9 20 14 66 100 0.212 10.82.225E+05 1.049E+06 44.5 13.10.60 ± G938-9 21 0 12 32 0.000 6.10.000E+00 5.959E+05 0.0 29.70.16 ± G938-9 22 2 16 32 0.125 8.29.932E+04 7.945E+05 26.2 19.70.10 ± G938-9 23 34 253 100 0.134 41.45.403E+05 4.020E+06 28.2 5.20.29 ± G938-9 24 2 30 36 0.067 13.68.828E+04 1.324E+06 14.0 10.20.37 ± G938-9 25 7 45 36 0.156 20.53.090E+05 1.986E+06 32.6 13.30.09 ± G938-9 26 8 69 30 0.116 37.74.238E+05 3.655E+06 24.3 9.10.04 ±

ρ
GC883-10 Apatite Gro-3 1705-1715m Counted by: COB
219 1114 2.937E+05 1.494E+06 15.4
Current grain no
N N N s i RATIO U(ppm)
Cl(wt%)
F.T. AGE(Ma)
² = 384.099 with 21 degrees of freedom²) =0.0%
Age Dispersion =133.084% Ns / Ni = 0.197 ± 0.015Mean Ratio = 0.173 ± 0.065
Ages calculated using a zeta of 380.4 ± 5.7 for CN5 glassD = 1.106E+06cm-² ND =1740
POOLED AGE = 41.2 ± 3.3 MaCENTRAL AGE = 29.0 ± 8.9 Ma
χχP(
Area of basic unit = 6.293E-07 cm-²
ρ
ρρD interpolated between top of can; D = 1.105E+06cm-² ND =869ρ
bottom of can; D = 1.107E+06cm-² ND =871ρ
Slideref
is a
A: B:
C: D:
Mean track length 12.05 ± 0.50 µm Std. Dev. 1.81 µm 13 tracks
B.33
G938-10 3 0 24 50 0.000 7.90.000E+00 7.628E+05 0.0 14.00.00 ± G938-10 5 2 100 30 0.020 54.61.059E+05 5.297E+06 4.2 3.00.04 ± G938-10 6 0 4 32 0.000 2.00.000E+00 1.986E+05 0.0 115.20.01 ± G938-10 7 2 22 20 0.091 18.01.589E+05 1.748E+06 19.1 14.10.04 ± G938-10 9 12 40 80 0.300 8.22.384E+05 7.945E+05 62.8 20.70.23 ± G938-10 10 3 113 100 0.027 18.54.767E+04 1.796E+06 5.6 3.30.07 ± G938-10 11 1 80 50 0.013 26.23.178E+04 2.543E+06 2.6 2.60.06 ± G938-10 12 1 51 70 0.020 11.92.270E+04 1.158E+06 4.1 4.20.05 ± G938-10 13 16 38 50 0.421 12.45.085E+05 1.208E+06 88.0 26.30.18 ± G938-10 14 4 14 50 0.286 4.61.271E+05 4.449E+05 59.8 34.00.20 ± G938-10 15 10 52 48 0.192 17.73.311E+05 1.721E+06 40.3 14.00.80 ± G938-10 17 3 93 100 0.032 15.24.767E+04 1.478E+06 6.8 4.00.04 ± G938-10 18 0 13 25 0.000 8.50.000E+00 8.263E+05 0.0 27.10.05 ± G938-10 19 2 21 31 0.095 11.11.025E+05 1.076E+06 20.0 14.80.01 ± G938-10 20 0 6 80 0.000 1.20.000E+00 1.192E+05 0.0 67.40.07 ± G938-10 21 4 100 64 0.040 25.69.932E+04 2.483E+06 8.4 4.30.46 ± G938-10 22 0 3 24 0.000 2.00.000E+00 1.986E+05 0.0 175.50.52 ± G938-10 23 12 110 56 0.109 32.23.405E+05 3.121E+06 22.9 7.00.89 ± G938-10 24 13 25 30 0.520 13.66.886E+05 1.324E+06 108.5 37.20.24 ± G938-10 25 9 39 100 0.231 6.41.430E+05 6.197E+05 48.4 17.90.21 ± G938-10 27 3 77 35 0.039 36.01.362E+05 3.496E+06 8.2 4.80.07 ± G938-10 28 122 89 60 1.371 24.33.231E+06 2.357E+06 282.1 40.10.00 ±

ρ
GC883-10 Apatite - minus contaminant grains Gro-3 1705-1715m Counted by: COB
43 869 8.384E+04 1.694E+06 17.5
Current grain no
N N N s i RATIO U(ppm)
Cl(wt%)
F.T. AGE(Ma)
² = 35.945 with 15 degrees of freedom²) =0.2%
Age Dispersion =77.404% Ns / Ni = 0.049 ± 0.008Mean Ratio = 0.042 ± 0.013
Ages calculated using a zeta of 380.4 ± 5.7 for CN5 glassD = 1.106E+06cm-² ND =1740
POOLED AGE = 10.4 ± 1.7 MaCENTRAL AGE = 10.2 ± 2.8 Ma
χχP(
Area of basic unit = 6.293E-07 cm-²
ρ
ρρD interpolated between top of can; D = 1.105E+06cm-² ND =869ρ
bottom of can; D = 1.107E+06cm-² ND =871ρ
Slideref
is a
A: B:
C: D:
Mean track length 11.95 ± 0.58 µm Std. Dev. 1.92 µm 11 tracks
B.34
G938-10 3 0 24 50 0.000 7.90.000E+00 7.628E+05 0.0 14.00.00 ± G938-10 5 2 100 30 0.020 54.61.059E+05 5.297E+06 4.2 3.00.04 ± G938-10 6 0 4 32 0.000 2.00.000E+00 1.986E+05 0.0 115.20.01 ± G938-10 7 2 22 20 0.091 18.01.589E+05 1.748E+06 19.1 14.10.04 ± G938-10 10 3 113 100 0.027 18.54.767E+04 1.796E+06 5.6 3.30.07 ± G938-10 11 1 80 50 0.013 26.23.178E+04 2.543E+06 2.6 2.60.06 ± G938-10 12 1 51 70 0.020 11.92.270E+04 1.158E+06 4.1 4.20.05 ± G938-10 15 10 52 48 0.192 17.73.311E+05 1.721E+06 40.3 14.00.80 ± G938-10 17 3 93 100 0.032 15.24.767E+04 1.478E+06 6.8 4.00.04 ± G938-10 18 0 13 25 0.000 8.50.000E+00 8.263E+05 0.0 27.10.05 ± G938-10 19 2 21 31 0.095 11.11.025E+05 1.076E+06 20.0 14.80.01 ± G938-10 20 0 6 80 0.000 1.20.000E+00 1.192E+05 0.0 67.40.07 ± G938-10 21 4 100 64 0.040 25.69.932E+04 2.483E+06 8.4 4.30.46 ± G938-10 22 0 3 24 0.000 2.00.000E+00 1.986E+05 0.0 175.50.52 ± G938-10 23 12 110 56 0.109 32.23.405E+05 3.121E+06 22.9 7.00.89 ± G938-10 27 3 77 35 0.039 36.01.362E+05 3.496E+06 8.2 4.80.07 ±

ρ
GC883-11 Apatite Gro-3 2105-2115m Counted by: COB
143 890 2.677E+05 1.666E+06 17.2
Current grain no
N N N s i RATIO U(ppm)
Cl(wt%)
F.T. AGE(Ma)
² = 265.859 with 20 degrees of freedom²) =0.0%
Age Dispersion =155.757% Ns / Ni = 0.161 ± 0.014Mean Ratio = 0.182 ± 0.075
Ages calculated using a zeta of 380.4 ± 5.7 for CN5 glassD = 1.106E+06cm-² ND =1740
POOLED AGE = 33.7 ± 3.2 MaCENTRAL AGE = 28.0 ± 10.4 Ma
χχP(
Area of basic unit = 6.293E-07 cm-²
ρ
ρρD interpolated between top of can; D = 1.105E+06cm-² ND =869ρ
bottom of can; D = 1.107E+06cm-² ND =871ρ
Slideref
is a
A: B:
C: D:
Mean track length 12.65 ± 0.90 µm Std. Dev. 2.01 µm 5 tracks
B.35
G938-11 4 0 33 50 0.000 10.80.000E+00 1.049E+06 0.0 10.00.00 ± G938-11 5 0 11 21 0.000 8.60.000E+00 8.324E+05 0.0 32.80.00 ± G938-11 6 2 30 40 0.067 12.37.945E+04 1.192E+06 14.0 10.20.14 ± G938-11 8 0 8 36 0.000 3.60.000E+00 3.531E+05 0.0 47.40.05 ± G938-11 10 0 2 16 0.000 2.00.000E+00 1.986E+05 0.0 346.00.04 ± G938-11 11 9 72 36 0.125 32.73.973E+05 3.178E+06 26.2 9.30.04 ± G938-11 12 2 51 25 0.039 33.41.271E+05 3.242E+06 8.2 5.90.05 ± G938-11 13 0 49 18 0.000 44.60.000E+00 4.326E+06 0.0 6.60.00 ± G938-11 14 0 8 54 0.000 2.40.000E+00 2.354E+05 0.0 47.40.08 ± G938-11 15 3 27 25 0.111 17.71.907E+05 1.716E+06 23.3 14.20.89 ± G938-11 17 0 13 28 0.000 7.60.000E+00 7.378E+05 0.0 27.20.08 ± G938-11 18 0 7 35 0.000 3.30.000E+00 3.178E+05 0.0 55.70.00 ± G938-11 19 26 397 80 0.065 81.35.164E+05 7.886E+06 13.8 2.80.12 ± G938-11 20 0 17 50 0.000 5.60.000E+00 5.403E+05 0.0 20.20.03 ± G938-11 22 0 8 35 0.000 3.70.000E+00 3.632E+05 0.0 47.40.11 ± G938-11 23 7 18 54 0.389 5.52.060E+05 5.297E+05 81.3 36.30.23 ± G938-11 24 2 5 20 0.400 4.11.589E+05 3.973E+05 83.6 70.00.18 ± G938-11 25 2 37 80 0.054 7.63.973E+04 7.349E+05 11.4 8.30.62 ± G938-11 26 42 39 56 1.077 11.41.192E+06 1.107E+06 222.7 49.90.00 ± G938-11 27 7 24 50 0.292 7.92.225E+05 7.628E+05 61.1 26.31.15 ± G938-11 28 41 34 40 1.206 13.91.629E+06 1.351E+06 248.9 58.20.02 ±
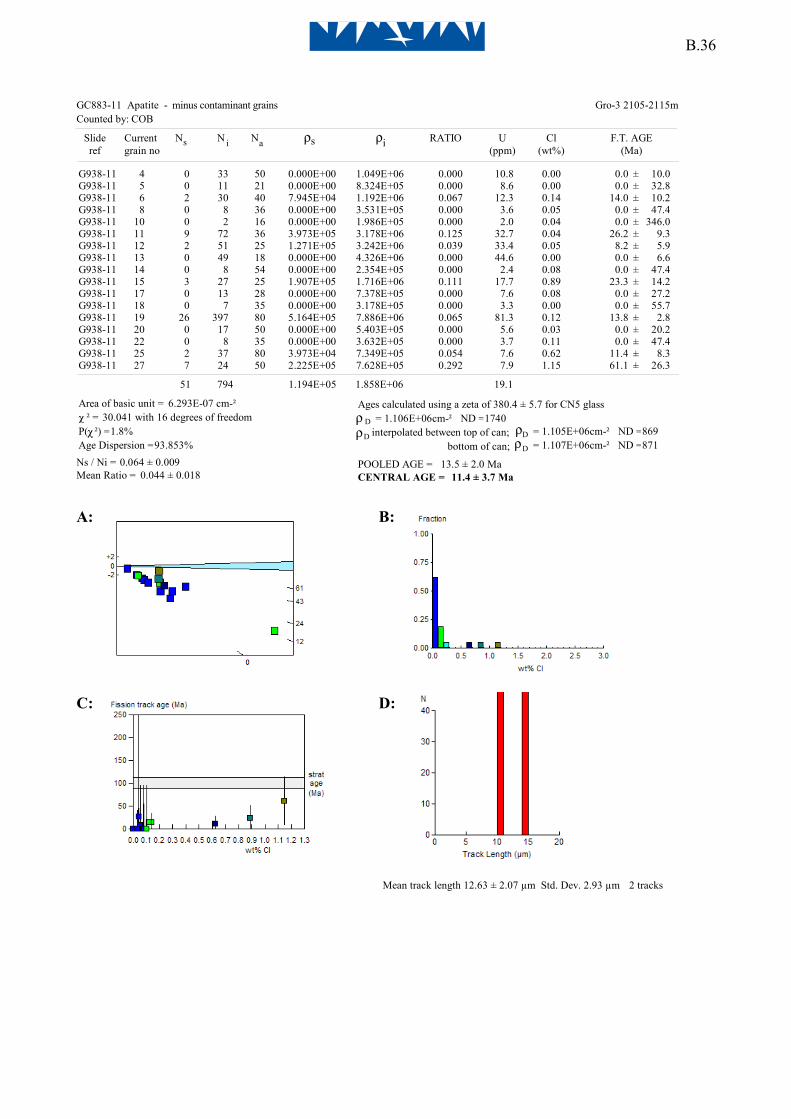
ρ
GC883-11 Apatite - minus contaminant grains Gro-3 2105-2115m Counted by: COB
51 794 1.194E+05 1.858E+06 19.1
Current grain no
N N N s i RATIO U(ppm)
Cl(wt%)
F.T. AGE(Ma)
² = 30.041 with 16 degrees of freedom²) =1.8%
Age Dispersion =93.853% Ns / Ni = 0.064 ± 0.009Mean Ratio = 0.044 ± 0.018
Ages calculated using a zeta of 380.4 ± 5.7 for CN5 glassD = 1.106E+06cm-² ND =1740
POOLED AGE = 13.5 ± 2.0 MaCENTRAL AGE = 11.4 ± 3.7 Ma
χχP(
Area of basic unit = 6.293E-07 cm-²
ρ
ρρD interpolated between top of can; D = 1.105E+06cm-² ND =869ρ
bottom of can; D = 1.107E+06cm-² ND =871ρ
Slideref
is a
A: B:
C: D:
Mean track length 12.63 ± 2.07 µm Std. Dev. 2.93 µm 2 tracks
B.36
G938-11 4 0 33 50 0.000 10.80.000E+00 1.049E+06 0.0 10.00.00 ± G938-11 5 0 11 21 0.000 8.60.000E+00 8.324E+05 0.0 32.80.00 ± G938-11 6 2 30 40 0.067 12.37.945E+04 1.192E+06 14.0 10.20.14 ± G938-11 8 0 8 36 0.000 3.60.000E+00 3.531E+05 0.0 47.40.05 ± G938-11 10 0 2 16 0.000 2.00.000E+00 1.986E+05 0.0 346.00.04 ± G938-11 11 9 72 36 0.125 32.73.973E+05 3.178E+06 26.2 9.30.04 ± G938-11 12 2 51 25 0.039 33.41.271E+05 3.242E+06 8.2 5.90.05 ± G938-11 13 0 49 18 0.000 44.60.000E+00 4.326E+06 0.0 6.60.00 ± G938-11 14 0 8 54 0.000 2.40.000E+00 2.354E+05 0.0 47.40.08 ± G938-11 15 3 27 25 0.111 17.71.907E+05 1.716E+06 23.3 14.20.89 ± G938-11 17 0 13 28 0.000 7.60.000E+00 7.378E+05 0.0 27.20.08 ± G938-11 18 0 7 35 0.000 3.30.000E+00 3.178E+05 0.0 55.70.00 ± G938-11 19 26 397 80 0.065 81.35.164E+05 7.886E+06 13.8 2.80.12 ± G938-11 20 0 17 50 0.000 5.60.000E+00 5.403E+05 0.0 20.20.03 ± G938-11 22 0 8 35 0.000 3.70.000E+00 3.632E+05 0.0 47.40.11 ± G938-11 25 2 37 80 0.054 7.63.973E+04 7.349E+05 11.4 8.30.62 ± G938-11 27 7 24 50 0.292 7.92.225E+05 7.628E+05 61.1 26.31.15 ±

ρ
GC883-12 Apatite Gro-3 2370-2415m Counted by: COB
482 899 9.456E+05 1.764E+06 18.2
Current grain no
N N N s i RATIO U(ppm)
Cl(wt%)
F.T. AGE(Ma)
² = 399.283 with 14 degrees of freedom²) =0.0%
Age Dispersion =189.619% (did not converge)Ns / Ni = 0.536 ± 0.030Mean Ratio = 0.210 ± 0.122
Ages calculated using a zeta of 380.4 ± 5.7 for CN5 glassD = 1.106E+06cm-² ND =1740
POOLED AGE = 111.9 ± 7.1 MaCENTRAL AGE = 27.2 ± 14.1 Ma
χχP(
Area of basic unit = 6.293E-07 cm-²
ρ
ρρD interpolated between top of can; D = 1.105E+06cm-² ND =869ρ
bottom of can; D = 1.107E+06cm-² ND =871ρ
Slideref
is a
A: B:
C: D:
Mean track length 11.38 ± 0.46 µm Std. Dev. 1.51 µm 11 tracks
B.37
G938-12 3 0 26 15 0.000 28.40.000E+00 2.754E+06 0.0 12.80.37 ± G938-12 5 4 26 100 0.154 4.36.356E+04 4.132E+05 32.3 17.40.27 ± G938-12 6 0 4 30 0.000 2.20.000E+00 2.119E+05 0.0 115.20.02 ± G938-12 8 269 255 100 1.055 41.74.275E+06 4.052E+06 218.3 20.10.03 ± G938-12 9 1 59 35 0.017 27.64.540E+04 2.679E+06 3.6 3.60.22 ± G938-12 10 0 37 28 0.000 21.60.000E+00 2.100E+06 0.0 8.90.15 ± G938-12 12 0 9 50 0.000 2.90.000E+00 2.860E+05 0.0 41.30.09 ± G938-12 13 10 160 90 0.063 29.11.766E+05 2.825E+06 13.1 4.30.49 ± G938-12 14 2 16 40 0.125 6.57.945E+04 6.356E+05 26.3 19.70.02 ± G938-12 16 1 36 25 0.028 23.66.356E+04 2.288E+06 5.8 5.90.28 ± G938-12 17 0 1 25 0.000 0.70.000E+00 6.356E+04 0.0 1555.50.08 ± G938-12 18 1 124 100 0.008 20.31.589E+04 1.970E+06 1.7 1.70.02 ± G938-12 19 1 13 40 0.077 5.33.973E+04 5.164E+05 16.2 16.80.02 ± G938-12 21 0 14 42 0.000 5.50.000E+00 5.297E+05 0.0 25.00.28 ± G938-12 23 193 119 90 1.622 21.63.408E+06 2.101E+06 332.6 39.90.00 ±

ρ
GC883-12 Apatite - minus contaminant grains Gro-3 2370-2415m Counted by: COB
20 525 5.126E+04 1.346E+06 13.9
Current grain no
N N N s i RATIO U(ppm)
Cl(wt%)
F.T. AGE(Ma)
² = 20.734 with 12 degrees of freedom²) =5.4%
Age Dispersion =73.446% Ns / Ni = 0.038 ± 0.009Mean Ratio = 0.036 ± 0.015
Ages calculated using a zeta of 380.4 ± 5.7 for CN5 glassD = 1.106E+06cm-² ND =1740
POOLED AGE = 8.0 ± 1.8 MaCENTRAL AGE = 8.0 ± 2.8 Ma
χχP(
Area of basic unit = 6.293E-07 cm-²
ρ
ρρD interpolated between top of can; D = 1.105E+06cm-² ND =869ρ
bottom of can; D = 1.107E+06cm-² ND =871ρ
Slideref
is a
A: B:
C: D:
Mean track length 12.76 ± 0.00 µm Std. Dev. 1.51 µm 1 tracks
B.38
G938-12 3 0 26 15 0.000 28.40.000E+00 2.754E+06 0.0 12.80.37 ± G938-12 5 4 26 100 0.154 4.36.356E+04 4.132E+05 32.3 17.40.27 ± G938-12 6 0 4 30 0.000 2.20.000E+00 2.119E+05 0.0 115.20.02 ± G938-12 9 1 59 35 0.017 27.64.540E+04 2.679E+06 3.6 3.60.22 ± G938-12 10 0 37 28 0.000 21.60.000E+00 2.100E+06 0.0 8.90.15 ± G938-12 12 0 9 50 0.000 2.90.000E+00 2.860E+05 0.0 41.30.09 ± G938-12 13 10 160 90 0.063 29.11.766E+05 2.825E+06 13.1 4.30.49 ± G938-12 14 2 16 40 0.125 6.57.945E+04 6.356E+05 26.3 19.70.02 ± G938-12 16 1 36 25 0.028 23.66.356E+04 2.288E+06 5.8 5.90.28 ± G938-12 17 0 1 25 0.000 0.70.000E+00 6.356E+04 0.0 1555.50.08 ± G938-12 18 1 124 100 0.008 20.31.589E+04 1.970E+06 1.7 1.70.02 ± G938-12 19 1 13 40 0.077 5.33.973E+04 5.164E+05 16.2 16.80.02 ± G938-12 21 0 14 42 0.000 5.50.000E+00 5.297E+05 0.0 25.00.28 ±

ρ
GC883-13 Apatite Gro-3 2760-2780m Counted by: COB
49 487 8.585E+04 8.532E+05 8.8
Current grain no
N N N s i RATIO U(ppm)
Cl(wt%)
F.T. AGE(Ma)
² = 65.936 with 19 degrees of freedom²) =0.0%
Age Dispersion =100.223% Ns / Ni = 0.101 ± 0.015Mean Ratio = 0.111 ± 0.030
Ages calculated using a zeta of 380.4 ± 5.7 for CN5 glassD = 1.107E+06cm-² ND =1740
POOLED AGE = 21.1 ± 3.2 MaCENTRAL AGE = 21.5 ± 6.0 Ma
χχP(
Area of basic unit = 6.293E-07 cm-²
ρ
ρρD interpolated between top of can; D = 1.105E+06cm-² ND =869ρ
bottom of can; D = 1.107E+06cm-² ND =871ρ
Slideref
is a
A: B:
C: D:
Mean track length 13.39 ± 0.32 µm Std. Dev. 0.65 µm 4 tracks
B.39
G938-13 3 2 14 40 0.143 5.77.945E+04 5.562E+05 30.0 22.70.01 ± G938-13 4 0 4 9 0.000 7.30.000E+00 7.063E+05 0.0 115.20.44 ± G938-13 5 0 7 24 0.000 4.80.000E+00 4.635E+05 0.0 55.70.09 ± G938-13 6 0 37 24 0.000 25.20.000E+00 2.450E+06 0.0 8.90.35 ± G938-13 7 2 14 54 0.143 4.25.885E+04 4.120E+05 30.0 22.70.01 ± G938-13 8 1 51 80 0.020 10.41.986E+04 1.013E+06 4.1 4.20.29 ± G938-13 10 0 19 30 0.000 10.40.000E+00 1.006E+06 0.0 17.90.27 ± G938-13 11 0 23 30 0.000 12.60.000E+00 1.218E+06 0.0 14.60.04 ± G938-13 12 1 14 24 0.071 9.56.621E+04 9.270E+05 15.0 15.50.15 ± G938-13 13 0 18 24 0.000 12.30.000E+00 1.192E+06 0.0 19.00.19 ± G938-13 15 0 52 100 0.000 8.50.000E+00 8.263E+05 0.0 6.20.06 ± G938-13 16 1 31 63 0.032 8.12.522E+04 7.819E+05 6.8 6.90.01 ± G938-13 17 3 9 30 0.333 4.91.589E+05 4.767E+05 69.8 46.60.22 ± G938-13 19 1 54 63 0.019 14.02.522E+04 1.362E+06 3.9 3.90.04 ± G938-13 20 5 22 50 0.227 7.21.589E+05 6.992E+05 47.7 23.70.21 ± G938-13 21 0 6 30 0.000 3.30.000E+00 3.178E+05 0.0 67.40.17 ± G938-13 22 7 29 60 0.241 7.91.854E+05 7.680E+05 50.6 21.40.02 ± G938-13 23 10 38 32 0.263 19.44.966E+05 1.887E+06 55.2 19.70.26 ± G938-13 24 10 29 100 0.345 4.71.589E+05 4.608E+05 72.2 26.50.22 ± G938-13 25 6 16 40 0.375 6.52.384E+05 6.356E+05 78.5 37.60.28 ±

ρ
GC883-13 Apatite - minus contaminant grains Gro-3 2760-2780m Counted by: COB
8 344 2.137E+04 9.187E+05 9.5
Current grain no
N N N s i RATIO U(ppm)
Cl(wt%)
F.T. AGE(Ma)
² = 20.419 with 13 degrees of freedom²) =8.5%
Age Dispersion =58.140% (did not converge)Ns / Ni = 0.023 ± 0.008Mean Ratio = 0.031 ± 0.014
Ages calculated using a zeta of 380.4 ± 5.7 for CN5 glassD = 1.107E+06cm-² ND =1740
POOLED AGE = 4.9 ± 1.8 MaCENTRAL AGE = 5.2 ± 2.0 Ma
χχP(
Area of basic unit = 6.293E-07 cm-²
ρ
ρρD interpolated between top of can; D = 1.105E+06cm-² ND =869ρ
bottom of can; D = 1.107E+06cm-² ND =871ρ
Slideref
is a
No confined tracks
A: B:
C: D:
B.40
G938-13 3 2 14 40 0.143 5.77.945E+04 5.562E+05 30.0 22.70.01 ± G938-13 4 0 4 9 0.000 7.30.000E+00 7.063E+05 0.0 115.20.44 ± G938-13 5 0 7 24 0.000 4.80.000E+00 4.635E+05 0.0 55.70.09 ± G938-13 6 0 37 24 0.000 25.20.000E+00 2.450E+06 0.0 8.90.35 ± G938-13 7 2 14 54 0.143 4.25.885E+04 4.120E+05 30.0 22.70.01 ± G938-13 8 1 51 80 0.020 10.41.986E+04 1.013E+06 4.1 4.20.29 ± G938-13 10 0 19 30 0.000 10.40.000E+00 1.006E+06 0.0 17.90.27 ± G938-13 11 0 23 30 0.000 12.60.000E+00 1.218E+06 0.0 14.60.04 ± G938-13 12 1 14 24 0.071 9.56.621E+04 9.270E+05 15.0 15.50.15 ± G938-13 13 0 18 24 0.000 12.30.000E+00 1.192E+06 0.0 19.00.19 ± G938-13 15 0 52 100 0.000 8.50.000E+00 8.263E+05 0.0 6.20.06 ± G938-13 16 1 31 63 0.032 8.12.522E+04 7.819E+05 6.8 6.90.01 ± G938-13 19 1 54 63 0.019 14.02.522E+04 1.362E+06 3.9 3.90.04 ± G938-13 21 0 6 30 0.000 3.30.000E+00 3.178E+05 0.0 67.40.17 ±

ρ
GC883-14 Apatite Gro-3 2965-2980m Counted by: COB
80 676 1.148E+05 9.704E+05 10.0
Current grain no
N N N s i RATIO U(ppm)
Cl(wt%)
F.T. AGE(Ma)
² = 134.786 with 20 degrees of freedom²) =0.0%
Age Dispersion =117.447% Ns / Ni = 0.118 ± 0.014Mean Ratio = 0.164 ± 0.048
Ages calculated using a zeta of 380.4 ± 5.7 for CN5 glassD = 1.107E+06cm-² ND =1740
POOLED AGE = 24.9 ± 3.0 MaCENTRAL AGE = 28.6 ± 8.5 Ma
χχP(
Area of basic unit = 6.293E-07 cm-²
ρ
ρρD interpolated between top of can; D = 1.105E+06cm-² ND =869ρ
bottom of can; D = 1.107E+06cm-² ND =871ρ
Slideref
is a
A: B:
C: D:
Mean track length 12.86 ± 0.41 µm Std. Dev. 1.00 µm 6 tracks
B.41
G938-14 3 0 7 24 0.000 4.80.000E+00 4.635E+05 0.0 55.70.32 ± G938-14 4 0 3 20 0.000 2.50.000E+00 2.384E+05 0.0 175.60.07 ± G938-14 5 0 21 24 0.000 14.30.000E+00 1.390E+06 0.0 16.10.00 ± G938-14 7 8 15 35 0.533 7.03.632E+05 6.810E+05 111.3 48.80.22 ± G938-14 8 0 28 100 0.000 4.60.000E+00 4.449E+05 0.0 11.90.00 ± G938-14 9 1 17 48 0.059 5.83.311E+04 5.628E+05 12.4 12.70.00 ± G938-14 10 0 4 36 0.000 1.80.000E+00 1.766E+05 0.0 115.20.00 ± G938-14 11 0 59 80 0.000 12.10.000E+00 1.172E+06 0.0 5.50.39 ± G938-14 12 0 24 30 0.000 13.10.000E+00 1.271E+06 0.0 14.00.31 ± G938-14 13 6 10 56 0.600 2.91.703E+05 2.838E+05 125.1 64.70.24 ± G938-14 14 2 10 50 0.200 3.36.356E+04 3.178E+05 42.0 32.50.16 ± G938-14 17 28 75 80 0.373 15.35.562E+05 1.490E+06 78.1 17.40.24 ± G938-14 19 1 12 36 0.083 5.54.414E+04 5.297E+05 17.5 18.20.07 ± G938-14 20 0 15 100 0.000 2.50.000E+00 2.384E+05 0.0 23.20.50 ± G938-14 21 16 65 90 0.246 11.82.825E+05 1.148E+06 51.6 14.50.26 ± G938-14 22 1 28 25 0.036 18.36.356E+04 1.780E+06 7.5 7.60.04 ± G938-14 23 1 129 100 0.008 21.11.589E+04 2.050E+06 1.6 1.60.00 ± G938-14 24 4 17 60 0.235 4.61.059E+05 4.502E+05 49.3 27.50.25 ± G938-14 25 6 10 25 0.600 6.53.814E+05 6.356E+05 125.1 64.70.26 ± G938-14 26 6 13 48 0.462 4.41.986E+05 4.304E+05 96.4 47.70.23 ± G938-14 27 0 114 40 0.000 46.60.000E+00 4.529E+06 0.0 2.80.02 ±
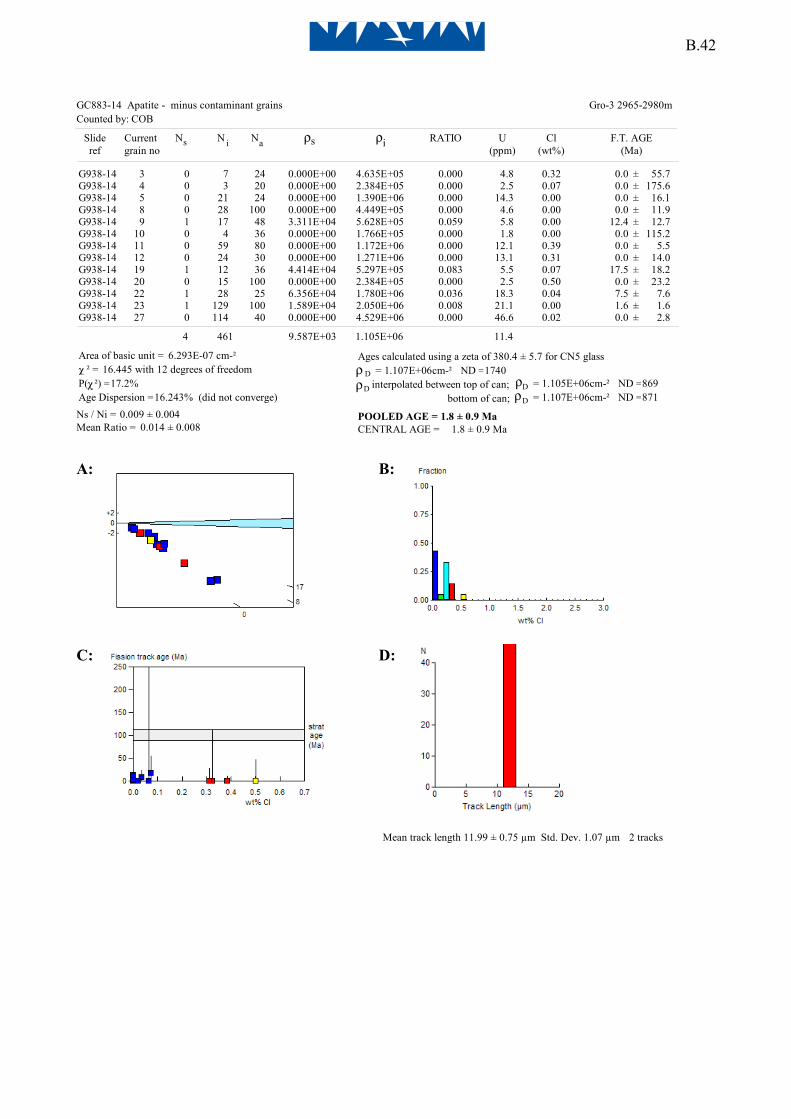
ρ
GC883-14 Apatite - minus contaminant grains Gro-3 2965-2980m Counted by: COB
4 461 9.587E+03 1.105E+06 11.4
Current grain no
N N N s i RATIO U(ppm)
Cl(wt%)
F.T. AGE(Ma)
² = 16.445 with 12 degrees of freedom²) =17.2%
Age Dispersion =16.243% (did not converge)Ns / Ni = 0.009 ± 0.004Mean Ratio = 0.014 ± 0.008
Ages calculated using a zeta of 380.4 ± 5.7 for CN5 glassD = 1.107E+06cm-² ND =1740
POOLED AGE = 1.8 ± 0.9 MaCENTRAL AGE = 1.8 ± 0.9 Ma
χχP(
Area of basic unit = 6.293E-07 cm-²
ρ
ρρD interpolated between top of can; D = 1.105E+06cm-² ND =869ρ
bottom of can; D = 1.107E+06cm-² ND =871ρ
Slideref
is a
A: B:
C: D:
Mean track length 11.99 ± 0.75 µm Std. Dev. 1.07 µm 2 tracks
B.42
G938-14 3 0 7 24 0.000 4.80.000E+00 4.635E+05 0.0 55.70.32 ± G938-14 4 0 3 20 0.000 2.50.000E+00 2.384E+05 0.0 175.60.07 ± G938-14 5 0 21 24 0.000 14.30.000E+00 1.390E+06 0.0 16.10.00 ± G938-14 8 0 28 100 0.000 4.60.000E+00 4.449E+05 0.0 11.90.00 ± G938-14 9 1 17 48 0.059 5.83.311E+04 5.628E+05 12.4 12.70.00 ± G938-14 10 0 4 36 0.000 1.80.000E+00 1.766E+05 0.0 115.20.00 ± G938-14 11 0 59 80 0.000 12.10.000E+00 1.172E+06 0.0 5.50.39 ± G938-14 12 0 24 30 0.000 13.10.000E+00 1.271E+06 0.0 14.00.31 ± G938-14 19 1 12 36 0.083 5.54.414E+04 5.297E+05 17.5 18.20.07 ± G938-14 20 0 15 100 0.000 2.50.000E+00 2.384E+05 0.0 23.20.50 ± G938-14 22 1 28 25 0.036 18.36.356E+04 1.780E+06 7.5 7.60.04 ± G938-14 23 1 129 100 0.008 21.11.589E+04 2.050E+06 1.6 1.60.00 ± G938-14 27 0 114 40 0.000 46.60.000E+00 4.529E+06 0.0 2.80.02 ±

ρ
GC883-16 Apatite Ataa-1 17-26m 6uCounted by: COB
786 685 2.061E+06 1.796E+06 18.9
Current grain no
N N N s i RATIO U(ppm)
Cl(wt%)
F.T. AGE(Ma)
² = 28.046 with 19 degrees of freedom²) =8.3%
Age Dispersion =15.651% Ns / Ni = 1.147 ± 0.060Mean Ratio = 1.270 ± 0.123
Ages calculated using a zeta of 380.4 ± 5.7 for CN5 glassD = 1.083E+06cm-² ND =1722
POOLED AGE = 232.2 ± 13.8 MaCENTRAL AGE = 235.4 ± 17.0 Ma
χχP(
Area of basic unit = 6.293E-07 cm-²
ρ
ρρD interpolated between top of can; D = 1.114E+06cm-² ND =876ρ
bottom of can; D = 1.075E+06cm-² ND =846ρ
Slideref
is a
A: B:
C: D:
Mean track length 12.03 ± 0.18 µm Std. Dev. 1.53 µm 71 tracks
B.43
G943-9 4 6 6 27 1.000 3.73.531E+05 3.531E+05 202.8 117.20.01 ± G943-9 5 14 5 40 2.800 2.15.562E+05 1.986E+05 552.5 288.20.27 ± G943-9 6 17 16 20 1.063 13.41.351E+06 1.271E+06 215.2 75.20.00 ± G943-9 7 8 9 15 0.889 10.08.475E+05 9.534E+05 180.6 87.90.12 ± G943-9 8 92 83 40 1.108 34.73.655E+06 3.297E+06 224.4 34.60.00 ± G943-9 9 9 11 21 0.818 8.86.810E+05 8.324E+05 166.4 74.90.00 ± G943-9 10 47 58 35 0.810 27.72.134E+06 2.633E+06 164.8 32.70.00 ± G943-9 11 2 4 12 0.500 5.62.648E+05 5.297E+05 102.2 88.50.01 ± G943-9 12 11 5 35 2.200 2.44.994E+05 2.270E+05 438.0 236.60.22 ± G943-9 13 43 29 25 1.483 19.42.733E+06 1.843E+06 298.4 72.20.00 ± G943-9 14 46 50 35 0.920 23.92.088E+06 2.270E+06 186.8 38.50.00 ± G943-9 15 35 31 14 1.129 37.03.973E+06 3.519E+06 228.5 56.70.04 ± G943-9 16 44 38 21 1.158 30.33.329E+06 2.875E+06 234.2 52.30.19 ± G943-9 17 37 20 32 1.850 10.51.837E+06 9.932E+05 370.3 103.30.06 ± G943-9 18 45 33 24 1.364 23.02.980E+06 2.185E+06 275.0 63.50.07 ± G943-9 19 41 25 40 1.640 10.51.629E+06 9.932E+05 329.3 84.10.17 ± G943-9 20 78 69 40 1.130 28.93.099E+06 2.741E+06 228.8 38.40.06 ± G943-9 21 69 77 35 0.896 36.83.133E+06 3.496E+06 182.0 30.60.00 ± G943-9 22 80 45 45 1.778 16.72.825E+06 1.589E+06 356.2 67.10.01 ± G943-9 28 62 71 50 0.873 23.81.970E+06 2.256E+06 177.4 31.20.00 ±

ρ
GC883-17 Apatite Ataa-1 555-m 7uCounted by: COB
851 659 1.109E+06 8.591E+05 9.1
Current grain no
N N N s i RATIO U(ppm)
Cl(wt%)
F.T. AGE(Ma)
² = 120.064 with 19 degrees of freedom²) =0.0%
Age Dispersion =53.881% Ns / Ni = 1.291 ± 0.067Mean Ratio = 1.238 ± 0.159
Ages calculated using a zeta of 380.4 ± 5.7 for CN5 glassD = 1.079E+06cm-² ND =1722
POOLED AGE = 259.8 ± 15.4 MaCENTRAL AGE = 224.1 ± 31.7 Ma
χχP(
Area of basic unit = 6.293E-07 cm-²
ρ
ρρD interpolated between top of can; D = 1.114E+06cm-² ND =876ρ
bottom of can; D = 1.075E+06cm-² ND =846ρ
Slideref
is a
A: B:
C: D:
Mean track length 12.23 ± 0.13 µm Std. Dev. 1.29 µm 100 tracks
B.44
G943-10 3 20 19 56 1.053 5.75.675E+05 5.391E+05 212.5 68.40.02 ± G943-10 4 6 8 15 0.750 9.06.356E+05 8.475E+05 152.2 82.30.42 ± G943-10 5 13 17 40 0.765 7.15.164E+05 6.754E+05 155.1 57.30.00 ± G943-10 7 25 81 100 0.309 13.63.973E+05 1.287E+06 63.0 14.50.17 ± G943-10 8 2 14 32 0.143 7.39.932E+04 6.952E+05 29.3 22.10.15 ± G943-10 9 32 19 60 1.684 5.38.475E+05 5.032E+05 336.8 98.00.13 ± G943-10 10 16 29 50 0.552 9.75.085E+05 9.217E+05 112.3 35.10.14 ± G943-10 11 79 45 30 1.756 25.24.185E+06 2.384E+06 350.7 66.20.01 ± G943-10 12 24 33 28 0.727 19.81.362E+06 1.873E+06 147.6 39.80.09 ± G943-10 13 8 7 64 1.143 1.81.986E+05 1.738E+05 230.4 119.40.08 ± G943-10 14 17 15 100 1.133 2.52.701E+05 2.384E+05 228.6 81.20.10 ± G943-10 15 50 62 40 0.806 26.01.986E+06 2.463E+06 163.5 31.40.01 ± G943-10 16 17 14 24 1.214 9.81.126E+06 9.270E+05 244.6 88.50.00 ± G943-10 17 107 44 30 2.432 24.65.668E+06 2.331E+06 480.8 87.20.10 ± G943-10 18 94 60 100 1.567 10.11.494E+06 9.534E+05 313.8 52.60.08 ± G943-10 19 33 17 100 1.941 2.95.244E+05 2.701E+05 386.7 116.00.11 ± G943-10 20 89 42 100 2.119 7.01.414E+06 6.674E+05 421.0 79.70.22 ± G943-10 21 1 2 50 0.500 0.73.178E+04 6.356E+04 101.8 124.80.07 ± G943-10 22 152 107 100 1.421 18.02.415E+06 1.700E+06 285.2 36.90.09 ± G943-10 23 66 24 100 2.750 4.01.049E+06 3.814E+05 541.2 129.90.16 ±
C.1
APPENDIX C Principles of Interpretation of AFTA Data in Sedimentary Basins C.1 Introduction
Detrital apatite grains are incorporated into sedimentary rocks from three dominant sources - crystalline basement rocks, older sediments and contemporaneous volcanism. Apatites derived from the first two sources will, in general, contain fission tracks when they are deposited, with AFTA parameters characteristic of the source regions. However, apatites derived from contemporaneous volcanism, or from rapidly uplifted basement, will contain no tracks when they are deposited. For now, we will restrict discussion to this situation, and generalise at a later point to cover the case of apatites which contain tracks that have been inherited from source regions.
C.2 Basic principles of Apatite Fission Track Analysis
Fission tracks are trails of radiation damage, which are produced within apatite grains at a more or less constant rate through geological time, as a result of the spontaneous fission of 238U impurity atoms. Therefore, the number of fission events which occur within an apatite grain during a fixed time interval depends on the magnitude of the time interval and the uranium content of the grain. Each fission event leads to the formation of a single fission track, and the proportion of tracks which can intersect a polished surface of an apatite grain depends on the length of the tracks. Therefore, the number of tracks which are etched in unit area of the surface of an apatite grain (the "spontaneous track density") depends on three factors - (i) The time over which tracks have been accumulating; (ii) The uranium content of the apatite grain; and, (iii) The distribution of track lengths in the grain. In sedimentary rocks which have not been subjected to temperatures greater than ~50°C since deposition, spontaneous fission tracks have a characteristic distribution of confined track lengths, with a mean length in the range 14-15 µm and a standard deviation of ~1 µm. In such samples, by measuring the spontaneous track density and the uranium content of a collection of apatite grains, a "fission track age" can be calculated which will be equal to the time over which tracks have been accumulating. The technique is calibrated against other isotopic systems using age standards which also have this type of length distribution (see Appendix B).
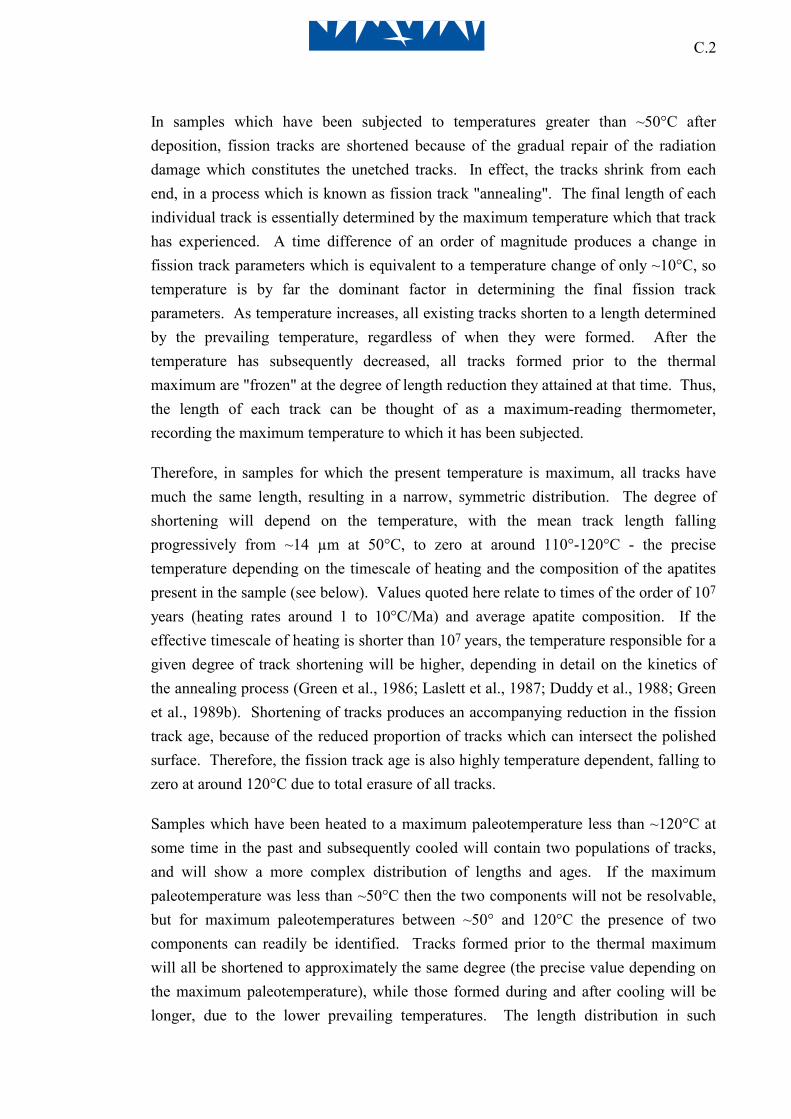
C.2
In samples which have been subjected to temperatures greater than ~50°C after deposition, fission tracks are shortened because of the gradual repair of the radiation damage which constitutes the unetched tracks. In effect, the tracks shrink from each end, in a process which is known as fission track "annealing". The final length of each individual track is essentially determined by the maximum temperature which that track has experienced. A time difference of an order of magnitude produces a change in fission track parameters which is equivalent to a temperature change of only ~10°C, so temperature is by far the dominant factor in determining the final fission track parameters. As temperature increases, all existing tracks shorten to a length determined by the prevailing temperature, regardless of when they were formed. After the temperature has subsequently decreased, all tracks formed prior to the thermal maximum are "frozen" at the degree of length reduction they attained at that time. Thus, the length of each track can be thought of as a maximum-reading thermometer, recording the maximum temperature to which it has been subjected.
Therefore, in samples for which the present temperature is maximum, all tracks have much the same length, resulting in a narrow, symmetric distribution. The degree of shortening will depend on the temperature, with the mean track length falling progressively from ~14 µm at 50°C, to zero at around 110°-120°C - the precise temperature depending on the timescale of heating and the composition of the apatites present in the sample (see below). Values quoted here relate to times of the order of 107
years (heating rates around 1 to 10°C/Ma) and average apatite composition. If the effective timescale of heating is shorter than 107 years, the temperature responsible for a given degree of track shortening will be higher, depending in detail on the kinetics of the annealing process (Green et al., 1986; Laslett et al., 1987; Duddy et al., 1988; Green et al., 1989b). Shortening of tracks produces an accompanying reduction in the fission track age, because of the reduced proportion of tracks which can intersect the polished surface. Therefore, the fission track age is also highly temperature dependent, falling to zero at around 120°C due to total erasure of all tracks.
Samples which have been heated to a maximum paleotemperature less than ~120°C at some time in the past and subsequently cooled will contain two populations of tracks, and will show a more complex distribution of lengths and ages. If the maximum paleotemperature was less than ~50°C then the two components will not be resolvable, but for maximum paleotemperatures between ~50° and 120°C the presence of two components can readily be identified. Tracks formed prior to the thermal maximum will all be shortened to approximately the same degree (the precise value depending on the maximum paleotemperature), while those formed during and after cooling will be longer, due to the lower prevailing temperatures. The length distribution in such
C.3
samples will be broader than in the simple case, consisting of a shorter and a longer component, and the fission track age will reflect the amount of length reduction shown by the shorter component (determined by the maximum paleotemperature).
If the maximum paleotemperature was sufficient to shorten tracks to between 9 and 11 µm, and cooling to temperatures of ~50°C or less was sufficiently rapid, tracks formed after cooling will have lengths of 14-15 µm and the resulting track length distribution will show a characteristic bimodal form. If the maximum paleotemperature was greater than ~110 to 120°C, all pre-existing tracks will be erased, and all tracks now present will have formed after the onset of cooling. The fission track age in such samples relates directly to the time of cooling.
In thermal history scenarios in which a heating episode is followed by cooling and then temperature increases again, the tracks formed during the second heating phase will undergo progressive shortening. The tracks formed prior to the initial cooling, which were shortened in the first heating episode, will not undergo further shortening until the temperature exceeds the maximum temperature reached in the earlier heating episode. (In practice, differences in timescale of heating can complicate this simple description. In detail, it is the integrated time-temperature effect of the two heating episodes which should be considered.) If the maximum and peak paleotemperatures in the two episodes are sufficiently different (>~10°C), and the later peak paleotemperature is less than the earlier maximum value, then the AFTA parameters allow determination of both episodes. As the peak paleotemperature in the later episode approaches the earlier maximum, the two generations of tracks become increasingly more difficult to resolve, and when the two paleotemperatures are the same, both components are shortened to an identical degree and all information on the earlier heating phase will be lost.
No information is preserved on the approach to maximum paleotemperature because the great majority of tracks formed up to that time have the same mean track length. Only those tracks formed in the last few per cent of the history prior to the onset of cooling are not shortened to the same degree (because temperature dominates over time in the annealing kinetics). These form a very small proportion of the total number of tracks and therefore cannot be resolved within the length distribution because of the inherent spread of several µm in the length distribution.
To summarise, AFTA allows determination of the magnitude of the maximum temperature and the time at which cooling from that maximum began. In some circumstances, determination of a subsequent peak paleotemperature and the time of cooling is also possible.

C.4
C.3 Quantitative understanding of fission track annealing in apatite
Annealing kinetics and modelling the development of AFTA parameters
Our understanding of the behaviour of fission tracks in apatite during geological thermal histories is based on study of the response of fission tracks to elevated temperatures in the laboratory (Green et al., 1986; Laslett et al., 1987; Duddy et al., 1988; Green et al., 1989b), in geological situations (Green et al., 1989a), observations of the lengths of spontaneous tracks in apatites from a wide variety of geological environments (Gleadow et al., 1986), and the relationship between track length reduction and reduction in fission track age observed in controlled laboratory experiments (Green, 1988).
These studies resulted in the capability to simulate the development of AFTA parameters resulting from geological thermal histories for an apatite of average composition (Durango apatite, ~0.43 wt% Cl). Full details of this modelling procedure have been explained in Green et al. (1989b). The following discussion presents a brief explanation of the approach.
Geological thermal histories involving temperatures varying through time are broken down into a series of isothermal steps. The progressive shortening of track length through sequential intervals is calculated using the extrapolated predictions of an empirical kinetic model fitted to laboratory annealing data. Contributions from tracks generated throughout the history (remembering that new tracks are continuously generated through time as new fissions occur) are summed to produce the final distribution of track lengths expected to result from the input history. In summing these components, care is taken to allow for various biases which affect revelation of confined tracks (Laslett et al., 1982). The final length reduction of each component of tracks is converted to a contribution of fission track age, using the relationship between track length and density reduction determined by Green (1988). These age contributions are summed to generate the final predicted fission track age.
This approach depends critically on the assumption that extrapolation of the laboratory-based kinetic model to geological timescales, over many orders of magnitude in time, is valid. This was assessed critically by Green et al. (1989b), who showed that predictions from this approach agree well with observed AFTA parameters in apatites of the appropriate composition in samples from a series of reference wells in the Otway Basin of south-east Australia (Gleadow and Duddy, 1981; Gleadow et al., 1983; Green et al., 1989a). This point is illustrated in Figure C.1. Green et al. (1989b) also quantitatively assessed the errors associated with extrapolation of the Laslett et al. (1987) model from

C.5
laboratory to geological timescales (i.e. precision, as opposed to accuracy). Typical levels of precision are ~0.5 µm for mean lengths <~10 µm, and ~0.3 µm for lengths >~10 µm. These figures are equivalent to an uncertainty in estimates of maximum paleotemperature derived using this approach of ~10°C. Precision is largely independent of thermal history for any reasonable geological history. Accuracy of prediction from this model is limited principally by the effect of apatite composition on annealing kinetics, as explained in the next section.
Compositional effects
Natural apatites essentially have the composition Ca5(PO4)3(F,OH,Cl). Most common detrital and accessory apatites are predominantly Fluor-apatites, but may contain appreciable amounts of chlorine. The amount of chlorine in the apatite lattice exerts a subtle compositional control on the degree of annealing, with apatites richer in fluorine being more easily annealed than those richer in chlorine. The result of this effect is that in a single sample, individual apatite grains may show a spread in the degree of annealing (i.e. length reduction and fission track age reduction). This effect becomes most pronounced in the temperature range 90 - 120°C (assuming a heating timescale of ~10 Ma), and can be useful in identifying samples exposed to paleotemperatures in this range. At temperatures below ~80°C, the difference in annealing sensitivity is less marked, and compositional effects can largely be ignored.
Our original quantitative understanding of the kinetics of fission track annealing, as described above, relates to a single apatite (Durango apatite) with ~0.43 wt% Cl, on which most of our original experimental studies were carried out. Recently, we have extended this quantitative understanding to apatites with Cl contents up to ~3 wt%. This new, multi-compositional kinetic model is based both on new laboratory annealing studies on a range of apatites with different F-Cl compositions (Figure C.2), and on observations of geological annealing in apatites from a series of samples from exploration wells in which the section is currently at maximum temperature since deposition. A composite model for Durango apatite composition was first created by fitting a common model to the old laboratory data (from Green et al., 1986) and the new geological data for a similar composition. This was then extended to other compositions on the basis of the multi-compositional laboratory and geological data sets. Details of the multi-compositional model are contained in a Technical Note, available from Geotrack in Melbourne.

C.6
The multi-compositional model allows prediction of AFTA parameters for any Cl content between 0 and 3 wt%, using a similar approach to that used in our original single composition modelling, as outlined above. Then, for an assumed or measured distribution of Cl contents within a sample, the composite parameters for the sample can be predicted. The range of Cl contents from 0 to 3 wt% spans the range of compositions commonly encountered, as discussed in the next section.
Predictions of the new multi-compositional model are in good agreement with the geological constraints on annealing rates provided by the Otway Basin reference wells, as shown in Figure C.3. However, note that the AFTA data from these Otway Basin wells were among those used in construction of the new model, so this should not be viewed as independent verification, but rather as a demonstration of the overall consistency of the model.
Distributions of Cl content in common AFTA samples
Figure C.4a shows a histogram of Cl contents, measured by electron microprobe, in apatite grains from more than 100 samples of various types. Most grains have Cl contents less than ~0.5 wt%. The majority of grains with Cl contents greater than this come from volcanic sources and basic intrusives, and contain up to ~2 wt% Cl. Figure C.4b shows the distribution of Cl contents measured in randomly selected apatite grains from 61 samples of "typical" quartzo-feldspathic sandstone. This distribution is similar to that in Figure C.4a, except for a more rapid fall-off as Cl content increases. Apatites from most common sandstones give distributions of Cl content which are very similar to that in Figure C.4b. Volcanogenic sandstones typically contain apatites with higher Cl contents, with a much flatter distribution for Cl contents up to ~1.5%, falling to zero at ~2.5 to 3 wt%, as shown in Figure C.4c. Cl contents in granitic basement samples and high-level intrusives are typically much more dominated by compositions close to end-member Fluorapatite, although many exceptions occur to this general rule.
Information about the spread of Cl contents in samples analysed in this report can be found in Appendix A.
Alternative kinetic models
Recently, both Carlson (1990) and Crowley et al. (1991) have published alternative kinetic models for fission track annealing in apatite. Carlson's model is based on our laboratory annealing data for Durango apatite (Green et al., 1986) and other (unpublished) data. In his abstract, Carlson claims that because his model is "based on explicit physical mechanisms, extrapolations of annealing rates to the lower temperatures and longer timescales required for the interpretation of natural fission track
C.7
length distributions can be made with greater confidence than is the case for purely empirical relationships fitted to the experimental annealing data". As explained in detail by Green et al. (1993), all aspects of Carlson's model are in fact purely empirical, and his model is inherently no "better" for the interpretation of data than any other. In fact, detailed inspection shows that Carlson's model does not fit the laboratory data set at all well. Therefore, we recommend against use of this model to interpret AFTA data.
The approach taken by Crowley et al. (1991) is very similar to that taken by Laslett et al., (1987). They have fitted models to new annealing data in two apatites of different composition - one close to end-member Fluorapatite (B-5) and one having a relatively high Sr content (113855). The model developed by Crowley et al. (1991) from their own annealing data for the B-5 apatite gives predictions in geological conditions which are consistently higher than measured values, as shown in Figure C.5. Corrigan (1992) reported a similar observation in volcanogenic apatites in samples from a series of West Texas wells. Since the B-5 apatite is close to end-member Fluor-apatite, while the Otway Group apatites contain apatites with Cl contents from zero up to ~3 wt% (and the West Texas apatites have up to 1 wt%), the fluorapatites should have mean lengths rather less than the measured values, which should represent a mean over the range of Cl contents present. Therefore, the predictions of the Crowley et al. (1991) B-5 model appear to be consistently high.
We attribute this to the rather restricted temperature-time conditions covered by the experiments of Crowley et al. (1991), with annealing times between one and 1000 hours, in contrast to times between 20 minutes and 500 days in the experiments of Green et al. (1986). In addition, few of the measured length values in Crowley et al.'s study fall below 11 µm (in only five out of 60 runs in which lengths were measured in apatite B-5) and their model is particularly poorly defined in this region.
Crowley et al. (1991) also fitted a new model to the annealing data for Durango apatite published by Green et al. (1986). Predictions of their fit to our data are not very much different to those from the Laslett et al. (1987) model (Figure C.6). We have not pursued the differences between their model and ours in detail because the advent of our multi-compositional model has rendered the single compositional approach obsolete.
C.4 Evidence for elevated paleotemperatures from AFTA
The basic principle involved in the interpretation of AFTA data in sedimentary basins is to determine whether the degree of annealing shown by tracks in apatite from a particular sample could have been produced if the sample has never been hotter than its present temperature at any time since deposition. To do this, the burial history derived

C.8
from the stratigraphy of the preserved sedimentary section is used to calculate a thermal history for each sample using the present geothermal gradient and surface temperature (i.e. assuming these have not changed through time). This is termed the "Default Thermal History". For each sample, the AFTA parameters predicted as a result of the Default Thermal History are then compared to the measured data. If the data show a greater degree of annealing than calculated on the basis of this history, the sample must have been hotter at some time in the past. In this case, the AFTA data are analysed to provide estimates of the magnitude of the maximum paleotemperature in that sample, and the time at which cooling commenced from the thermal maximum.
The degree of annealing is assessed in two ways - from fission track age and track length data. The stratigraphic age provides a basic reference point for the interpretation of fission track age, because reduction of the fission track age below the stratigraphic age unequivocally reveals that appreciable annealing has taken place after deposition of the host sediment. Large degrees of fission track age reduction, with the pooled or central fission track age very much less than the stratigraphic age, indicate severe annealing, which requires paleotemperatures of at least ~100°C for any reasonable geological time-scale of heating (>~1 Ma). Note that this applies even when apatites contain tracks inherited from source areas. More moderate degrees of annealing can be detected by inspection of the single grain age data, as the most sensitive (fluorine-rich) grains will begin to give fission track ages significantly less than the stratigraphic age before the central or pooled age has been reduced sufficiently to give a noticeable signal. Note that this aspect of the single grain age data can also be used for apatites which have tracks inherited from source areas. If signs of moderate annealing (from single grain age reduction) or severe annealing (from the reduction in pooled or central age) are seen in samples in which the Default Thermal History predicts little or no effect, the sample must have been subjected to elevated paleotemperatures at some time in the past. Figure C.7 shows how increasing degrees of annealing are observable in radial plots of the single grain fission track age data.
Similarly, the present temperature from which a sample is taken, and the way in which this has been approached (as inferred from the preserved sedimentary section), forms a basic point of reference for track length data. The observed mean track length is compared with the mean length predicted from the Default Thermal History. If the observed degree of track shortening in a sample is greater than that expected from the Default Thermal History (i.e. the mean length is significantly less than the predicted value), either the sample must have been subjected to higher paleotemperatures at some time after deposition, or the sample contains shorter tracks which were inherited from sediment source areas at the time the sediment was deposited. If shorter tracks were

C.9
inherited from source areas, the sample should still contain a component of longer tracks corresponding to the tracks formed after deposition. In general, the fission track age should be greater than the stratigraphic age. This can be assessed quantitatively using the computer models for the development of AFTA parameters described in an earlier section. If the presence of shorter tracks cannot be explained by their inheritance from source areas, the sample must have been hotter in the past.
C.5 Quantitative determination of the magnitude of maximum paleotemperature and the timing of cooling using AFTA
Values of maximum paleotemperature and timing of cooling in each sample are determined using a forward modelling approach based on the quantitative description of fission track annealing described in earlier sections. The Default Thermal History described above is used as the basis for this forward modelling, but with the addition of episodes of elevated paleotemperatures as required to explain the data. AFTA parameters are modelled iteratively through successive thermal history scenarios in order to identify thermal histories that can account for observed parameters. The range of values of maximum paleotemperature and timing of cooling which can account for the measured AFTA parameters (fission track age and track length distribution) are defined using a maximum likelihood-based approach. In this way, best estimates ("maximum likelihood values") can be defined together with ±95% confidence limits.
In samples in which all tracks have been totally annealed at some time in the past, only a minimum estimate of maximum paleotemperature is possible. In such cases, AFTA data provide most control on the time at which the sample cooled to temperatures at which tracks could be retained. The time at which cooling began could be earlier than this time, and therefore the timing also constitutes a minimum estimate.
Comparison of the AFTA parameters predicted by the multi-compositional model with measured values in samples which are currently at their maximum temperatures since deposition shows a good degree of consistency, suggesting the uncertainty in application of the model should be less than ±10°C. This constitutes a significant improvement over earlier approaches, since the kinetic models used are constrained in both laboratory and geological conditions. It should be appreciated that relative differences in maximum paleotemperature can be identified with greater precision than absolute paleotemperatures, and it is only the estimation of absolute paleotemperature values to which the ±10°C uncertainty relates.

C.10
Cooling history
If the data are of high quality and provided that cooling from maximum paleotemperatures began sufficiently long ago (so that the history after this time is represented by a significant proportion of the total tracks in the sample), determination of the magnitude of a subsequent peak paleotemperature and the timing of cooling from that peak may also be possible (as explained in Section C.2). A similar approach to that outlined above provides best estimates and corresponding ±95% confidence limits for this episode. Such estimates may simply represent part of a protracted cooling history, and evidence for a later discrete cooling episode can only be accepted if this scenario provides a significantly improved fit to the data. Geological evidence and consistency of estimates between a series of samples can also be used to verify evidence for a second episode.
In practise, most typical AFTA datasets are only sufficient to resolve two discrete episodes of heating and cooling. One notable exception to this is when a sample has been totally annealed in an early episode, and has then undergone two (or more) subsequent episodes with progressively lower peak paleotemperatures in each. But in general, complex cooling histories involving a series of episodes of heating and cooling will allow resolution of only two episodes, and the results will depend on which episodes dominate the data. Typically this will be the earliest and latest episodes, but if multiple cooling episodes occur within a narrow time interval the result will represent an approximation to the actual history.
C.6 Qualitative assessment of AFTA parameters
Various aspects of thermal history can often be assessed by qualitative assessment of AFTA parameters. For example, samples which have reached maximum paleotemperatures sufficient to produce total annealing, and which only contain tracks formed after the onset of cooling, can be identified from a number of lines of evidence. In a vertical sequence of samples showing increasing degrees of annealing, the transition from rapidly decreasing fission track age with increasing depth to more or less the same age over a range of depth denotes the transition from partial to total annealing of all tracks formed prior to the thermal maximum. In samples in which all tracks have been totally annealed, the single grain age data should show that none of the individual grain fission track ages are significantly older than the time of cooling, and grains in all compositional groups should give the same fission track age unless the sample has been further disturbed by a later episode. If the sample cooled rapidly to sufficiently low temperatures, little annealing will have taken place since cooling, and all grains will

C.11
give ages which are compatible with a single population around the time of cooling, as shown in Figure C.7.
Inspection of the distribution of single grain ages in partially annealed samples can often yield useful information on the time of cooling, as the most easily annealed grains (those richest in fluorine) may have been totally annealed prior to cooling, while more retentive (Cl-rich) compositions were only partially annealed (as in Figure C.7, centre). The form of the track length distribution can also provide information, from the relative proportions of tracks with different lengths. All of these aspects of the data can be used to reach a preliminary thermal history interpretation.
C.7 Allowing for tracks inherited from source areas
The effect of tracks inherited from source areas, and present at the time the apatite is deposited in the host sediment, is often posed as a potential problem for AFTA. However, this can readily be allowed for in analysing both the fission track age and length data.
In assessing fission track age data to determine the degree of annealing, the only criterion used is the comparison of fission track age with the value expected on the basis of the Default Thermal History. From this point of view, inherited tracks do not affect the conclusion: if a grain or a sample gives a fission track age which is significantly less than expected, the grain or sample has clearly undergone a higher degree of annealing than can be accounted for by the Default Thermal History, and therefore must have been hotter in the past, whether the sample contained tracks when it was deposited or not.
The presence of inherited tracks does impose a limit on our ability to detect post-depositional annealing from age data alone, as in samples which contain a fair proportion of inherited tracks, moderate degrees of annealing may reduce the fission track age from the original value, but not to a value which is significantly less than the stratigraphic age. This is particularly noticeable in the case of Tertiary samples containing apatites derived from Paleozoic basement. In such cases, although fission track age data may show no evidence of post-depositional annealing, track length data may well show such evidence quite clearly.
The influence of track lengths inherited from source areas can be allowed for by comparison of the fission track age with the value predicted by the Default Thermal History combined with inspection of the track length distribution. If the mean length is much less than the length predicted by the Default Thermal History, either the sample has been subjected to elevated paleotemperatures, sufficient to produce the observed degree of length reduction, or else the sample contains a large proportion of shorter

C.12
tracks inherited from source areas. However, in the latter case, the sample should give a pooled or central fission track age correspondingly older than the stratigraphic age, while the length distribution should contain a component of longer track lengths corresponding to the value predicted by the Default Thermal History. It is important in this regard that the length of a track depends primarily on the maximum temperature to which it has been subjected, whether in the source regions or after deposition in the sedimentary basin. Thus, any tracks retaining a provenance signature will have lengths towards the shorter end of the distribution where track lengths will not have "equilibrated" with the temperatures attained since deposition.
In general, it is only in extreme cases that inherited tracks render track length data insensitive to post-depositional annealing. For example, if practically all the tracks in a particular sample were formed prior to deposition, perhaps in a Pliocene sediment in which apatites were derived from a stable Paleozoic shield with fission track ages of ~300 Ma or more, the track length distribution will, in general, be dominated by inheritance, as only ~2% of tracks would have formed after deposition. Post-depositional heating will not be detectable as long as the maximum paleotemperature is insufficient to cause greater shortening than that which occurred in the source terrain. Even in such extreme cases, once a sample is exposed to temperatures sufficient to produce greater shortening than that inherited from source areas, the inherited tracks and those formed after deposition will all undergo the same degree of shortening, and the effects of post-depositional annealing can be recognised. In such cases, the presence of tracks inherited from source areas is actually very useful, because the number of tracks formed after deposition is so small that little or no information would be available without the inherited tracks.
C.8 Plots of fission track age and mean track length vs depth and temperature
AFTA data from well sequences are usually plotted as shown in Figure C.8. This figure shows AFTA data for two scenarios: one in which deposition has been essentially continuous from the Carboniferous to the present and all samples are presently at their maximum paleotemperature since deposition (Figure C.8a); and, one in which the section was exposed to elevated paleotemperatures prior to cooling in the Early Tertiary (Figure C.8b).
In both figures, fission track age and mean track length are plotted against depth and present temperature. Presentation of AFTA data in this way often provides insight into the thermal history interpretation, following principles outlined earlier in this Appendix.
C.13
In Figure C.8a, for samples at temperatures below ~70°C, the fission track age is either greater than or close to the stratigraphic age, and little fission track age reduction has affected these samples. Track lengths in these samples are all greater than ~13 µm. In progressively deeper samples, both the fission track age and mean track length are progressively reduced to zero at a present temperature of around 110°C, with the precise value depending on the spread of apatite compositions present in the sample. Track length distributions in the shallowest samples would be a mixture of tracks retaining information on the thermal history of source regions, while in deeper samples, all tracks would be shortened to a length determined by the prevailing temperature. This pattern of AFTA parameters is characteristic of a sequence which is currently at maximum temperatures.
The data in Figure C.8b show a very different pattern. The fission track age data show a rapid decrease in age, with values significantly less than the stratigraphic age at temperatures of ~40 to 50°C, at which such a degree of age reduction could not be produced in any geological timescale. Below this rapid fall, the fission track ages do not change much over ~1 km (30°C). This transition from rapid fall to consistent ages is diagnostic of the transition from partial to total annealing. Samples above the "break-in slope" contain two generations of tracks: those formed prior to the thermal maximum, which have been partially annealed (shortened) to a degree which depends on the maximum paleotemperature; and, those formed after cooling, which will be longer. Samples below the break-in slope contain only one generation of tracks, formed after cooling to lower temperatures at which tracks can be retained. At greater depths, where temperatures increase to ~90°C and above, the effect of present temperatures begins to reduce the fission track ages towards zero, as in the "maximum temperatures now" case.
The track length data also reflect the changes seen in the fission track age data. At shallow depths, the presence of the partially annealed tracks shortened prior to cooling causes the mean track length to decrease progressively as the fission track age decreases. However, at depths below the break in slope in the age profile, the track length increases again as the shorter component is totally annealed and so does not contribute to the measured distribution of track lengths. At greater depths, the mean track lengths decrease progressively to zero once more due to the effects of the present temperature regime.
Examples of such data have been presented, e.g. by Green (1989) and Kamp and Green (1990).

C.14
C.9 Determining paleogeothermal gradients and amount of section removed on unconformities
Estimates of maximum paleotemperatures in samples over a range of depths in a vertical sequence provides the capability of determining the paleogeothermal gradient immediately prior to the onset of cooling from those maximum paleotemperatures. The degree to which the paleogeothermal gradient can be constrained depends on a number of factors, particularly the depth range over which samples are analysed. If samples are only analysed over ~1 km, then the paleotemperature difference over that range may be only ~20 to 30°C. Since maximum paleotemperatures can often only be determined within a ~10°C range, this introduces considerable uncertainty into the final estimate of paleogeothermal gradient (see Figure C.9).
Another important factor is the difference between maximum paleotemperatures and present temperatures (“net cooling”). If this is only ~10°C, which is similar to the uncertainty in absolute paleotemperature determination, only broad limits can be established on the paleogeothermal gradient. In general, the control on the paleogeothermal gradient improves as the amount of net cooling increases. However, if the net cooling becomes so great that many samples were totally annealed prior to the onset of cooling - so that only minimum estimates of maximum paleotemperatures are possible - constraints on the paleogeothermal gradient from AFTA come only from that part of the section in which samples were not totally annealed. In this case, integration of AFTA data with VR measurements can be particularly useful in constraining the paleo-gradient.
Having constrained the paleogeothermal gradient at the time cooling from maximum paleotemperatures began, if we assume a value for surface temperature at that time, the amount of section subsequently removed by uplift and erosion can be calculated as shown in Figure C.10. The net amount of section removed is obtained by dividing the difference between the paleo-surface temperature (Ts) and the intercept of the paleotemperature profile at the present ground surface (Ti) by the estimated paleogeothermal gradient. The total amount of section removed is obtained by adding the thickness of section subsequently redeposited above the unconformity to the net amount estimated as in Figure C.10. If the analysis is performed using depths from the appropriate unconformity, then the analysis will directly yield the total amount of section removed.
Geotrack have developed a method of deriving estimates of both the paleogeothermal gradient and the net amount of section removed using estimated paleotemperatures

C.15
derived from AFTA and VR. Perhaps more importantly, this method also provides rigorous values for upper and lower 95% confidence limits on each parameter. The method is based on maximum likelihood estimation of the paleogeothermal gradient and the surface intercept, from a table of paleotemperature and depth values. The method is able to accept ranges for paleotemperature estimates (e.g. where the maximum paleotemperature can only be constrained to between, for example, 60 and 90°C), as well as upper and lower limits (e.g. <60°C for samples which show no detectable annealing; >110°C in samples which were totally annealed). Estimates of paleotemperature from AFTA and VR may be combined or analysed separately. Some results from this method have been reported by Bray et al. (1992). Full details of the methods employed are presented in a confidential, in-house, Geotrack research report, copies of which are available on request from the Melbourne office.
Results are presented in two forms. Likelihood profiles, plotting the log-likelihood as a function of either gradient or section removed, portray the probability of a given value of gradient or section removed. The best estimate is given by the value of gradient or section removed for which the log-likelihood is maximised. Ideally, the likelihood profiles should show a quadratic form, and values of gradient or section removed at which the log-likelihood has fallen by two from the maximum value define the upper and lower 95% confidence limits on the estimates. An alternative method of portraying this information is a crossplot of gradient against section removed, in which values which fall within 95% confidence limits (in two dimensions) are contoured. Note that the confidence limits defined by this method are rather tighter than those from the likelihood profiles, as the latter only reflect variation in one parameter, whereas the contoured crossplot takes variation of both parameters into account.
It must be emphasised that this method relies on the assumption that the paleotemperature profile was linear both throughout the section analysed and through the overlying section which has been removed. While the second part of this assumption can never be confirmed independently, visual inspection of the paleotemperature estimates as a function of depth should be sufficient to verify or deny the linearity of the paleotemperature profile through the preserved section.
Results of this procedure are shown in this report if the data allow sufficiently well-defined paleotemperature estimates to justify use of the method. Where the AFTA data suggest that the section is currently at maximum temperature since deposition, or that the paleotemperature profile was non-linear, or where data are of insufficient quality to allow rigorous paleotemperature estimation, the method is not used.

C.16
References Carlson, W.D. (1990) Mechanisms and kinetics of apatite fission-track annealing. American
Mineralogist, 75, 1120 - 1139. Corrigan, J. (1992) Annealing models under the microscope, On Track, 2, 9-11. Crowley, K.D., Cameron, M. and Schaefer, R.L. (1991) Experimental studies of annealing of
etched fission tracks in apatite. Geochimica et Cosmochimica Acta, 55, 1449-1465. Duddy, I.R., Green, P.F. and Laslett G.M. (1988) Thermal annealing of fission tracks in
apatite 3. Variable temperature behaviour. Chem. Geol. (Isot. Geosci. Sect.) , 73, 25-38. Gleadow, A.J.W. and Duddy, I.R. (1981) A natural long-term track annealing experiment for
apatite. Nuclear Tracks, 5, 169-174. Gleadow, A.J.W., Duddy, I.R. and Lovering, J.F. (1983) Fission track analysis; a new tool for
the evaluation of thermal histories and hydrocarbon potential. APEA J, 23, 93-102. Gleadow, A.J.W., Duddy, I.R., Green, P.F. and Lovering, J.F. (1986) Confined fission track
lengths in apatite - a diagnostic tool for thermal history analysis. Contr. Min. Petr., 94, 405-415.
Green, P.F. (1988) The relationship between track shortening and fission track age reduction
in apatite: Combined influences of inherent instability, annealing anisotropy, length bias and system calibration. Earth Planet. Sci. Lett., 89, 335-352.
Green, P.F., Duddy, I.R., Gleadow, A.J.W., Tingate, P.R. and Laslett, G.M. (1986) Thermal
annealing of fission tracks in apatite 1. A qualitative description. Chem. Geol. (Isot. Geosci. Sect.) , 59, 237-253.
Green, P.F., Duddy, I.R., Gleadow, A.J.W. and Lovering, J.F. (1989a) Apatite Fission Track
Analysis as a paleotemperature indicator for hydrocarbon exploration. In: Naeser, N.D. and McCulloh, T. (eds.) Thermal history of sedimentary basins - methods and case histories, Springer-Verlag, New York, 181-195.
Green, P.F., Duddy, I.R., Laslett, G.M., Hegarty, K.A., Gleadow, A.J.W. and Lovering, J.F.
(1989b) Thermal annealing of fission tracks in apatite 4. Quantitative modelling techniques and extension to geological timescales. Chem. Geol. (Isot. Geosci. Sect.), 79, 155-182
Green, P.F., Laslett, G.M. and Duddy, I.R. (1993) Mechanisms and kinetics of apatite fission
track annealing: Discussion. American Mineralogist, 78, 441-445. Laslett, G.M., Kendall, W.S., Gleadow, A.J.W. and Duddy, I.R. (1982) Bias in measurement
of fission track length distributions. Nuclear Tracks, 6, 79-85. Laslett, G.M., Green, P.F., Duddy, I.R. and Gleadow, A.J.W. (1987) Thermal annealing of
fission tracks in apatite 2. A quantitative analysis. Chem. Geol. (Isot. Geosci. Sect.), 65, 1-13.

C.17
5
6
7
8
9
mea
n tr
ack
leng
th (µ
m)
10
11
12
13
14
15
16
25 50Temperature (°C)
Otway data and Laslett et al.(1987) predictions
75 100 125
Figure C.1a Comparison of mean track length (solid circles) measured in samples from four
Otway Basin reference wells (from Green et al, 1989a) and predicted mean track lengths (open diamonds) from the kinetic model of fission track annealing from Laslett et al. (1987). The predictions underestimate the measured values, but they refer to an apatite composition that is more easily annealed than the majority of apatites in these samples, so this is expected.
201000
10
20
Otway Basin data (Durango composition) vs predictions of Laslett et al. (1987) model
Predicted length (µm)
"Mea
sure
d" le
ngth
(µm
)
Figure C.1b Comparison of the mean track length in apatites of the same Cl content as
Durango apatite from the Otway Group samples illustrated in figure C.1a, with values predicted for apatite of the same composition by the model of Laslett et al. (1987). The agreement is clearly very good except possibly at lengths below ~10 µm.

C.18
4
6
8
10
12
14M
ean
trac
k le
ngth
(µm
)
16
18
20
15000 20000(ln(t)-ln(to))/(1/T-1/To)
0.4% Cl
0.8% Cl
0 % Cl
6% Cl
25000 30000 35000
Figure C.2 Mean track length in apatites with four different chlorine contents, as a
combined function of temperature and time, to reduce the data to a single scale. Fluorapatites are more easily annealed than chlorapatites, and the annealing kinetics show a progressive change with increasing Cl content.
5
6
7
8
9
10
11
12
mul
ti m
ean
leng
th 13
14
15
16
25 50 75 100 125Temperature (°C)
Otway data and multi-compositionalmodel predictions
Figure C.3 Comparison of measured mean track length (solid circles) in samples from four
Otway Basin reference wells (from Green et al, 1989a) and predicted mean track lengths (open diamonds) from the new multi-compositional kinetic model of fission track annealing described in Section C.3. This model takes into account the spread of Cl contents in apatites from the Otway Group samples and the influence of Cl content on annealing rate. The agreement is clearly very good over the range of the data.

C.19
All samples
200
400
600
800
1000
1200
0.5 1.0 1.5 2.0 2.5 3.0W t % Chlorine
DURA NG OA PA TITE
"Normal sandstones"
200
400
600
800
1000
1200
0.5 1.0 1.5 2.0 2.5 3.0W t % Chlorine
DURA NG OA PA TITE
Volcanogenic sandstones
5
10
15
20
0.5 1.0 1.5 2.0 2.5 3.0W t % Chlorine
DURA N GOA PA T ITE
Figure C.4 a: Histogram of Cl contents (wt%) in over 1750 apatite grains from over 100
samples of various sedimentary and igneous rocks. Most samples give Cl contents below ~0.5 wt %, while those apatites giving higher Cl contents are characteristic of volcanogenic sandstones and basic igneous sources.
b: Histogram of Cl contents (wt%) in 1168 apatite grains from 61 samples
which can loosely be characterised as "normal sandstone". The distribution is similar to that in the upper figure, except for a lower number of grains with Cl contents greater than ~1%.
c: Histogram of Cl contents (wt%) in 188 apatite grains from 15 samples of
volcanogenic sandstone. The distribution is much flatter than the other two, with much higher proportion of Cl-rich grains.

C.20
56789
Mea
n tr
ack
leng
th (µ
m)
10111213141516
25 50Temperature (°C)
Otway data and predictions
Multi-compositional modelMean track length (µm)Laslett et al. (1987)Crowley et al. (1991)
75 100 125
Figure C.5 Comparison of mean track length in samples from four Otway Basin
reference wells (from Green et al, 1989a) and predicted mean track lengths from three kinetic models for fission track annealing. The Crowley et al. (1991) model relates to almost pure Fluorapatite (B-5), yet overpredicts mean lengths in the Otway Group samples which are dominated by Cl-rich apatites. The predictions of that model are therefore not reliable.
56789
Mea
n tr
ack
leng
th (µ
m)
10111213141516
25 50Temperature (°C)
Otway data and predictions from Laslettet al. (1987) and Crowley et al. (1991)
fits to data of Green et al. (1986)
Mean track length (µm)Laslett et al. (1987)Crowley et al. (1991)
75 100 125
Figure C.6 Comparison of mean track length in samples from four Otway Basin
reference wells with values predicted from Laslett et al. (1987) and the model fitted to the annealing data of Green et al. (1986) by Crowley et al. (1991). The predictions of the two models are not very different.

C.21
- 2- 1
0+1+2
60 100
150
200
400
- 2- 1
0+1+2
60 100
150
200
400
- 2- 1
0+1+2
60 100
150
200
400
Little or no post-depositional annealing (T<60°C)
Moderate post-depositional annealing (T~90°C)
Total post-depositional annealing (T>110°C)
Stratigraphic age range (mid Jurassic 157-178 Ma)
Time of cooling Figure C.7 Radial plots of single grain age data in three samples of mid-Jurassic sandstone that have been
subjected to varying degrees of post-depositional annealing prior to cooling at ~60 Ma. The mid-point of the stratigraphic age range has been taken as the reference value (corresponding to the horizontal).
The upper diagram represents a sample which has remained at paleotemperatures less than
~60°C, and has therefore undergone little or no post-depositional annealing. All single grain ages are either compatible with the stratigraphic age (within y = ±2 in the radial plot) or older than the stratigraphic age (yi > 2).
The centre diagram represents a sample which has undergone a moderate degree of post-
depositional annealing, having reached a maximum paleotemperature of around ~90°C prior to cooling. While some of the individual grain ages are compatible with the stratigraphic age (-2 < yi < +2) and some may be significantly greater than the stratigraphic age (yi > 2), a number of grains give ages which are significantly less than the stratigraphic age (y < 2).
The lower diagram represents a sample in which all apatite grains were totally annealed, at
paleotemperatures greater than ~110°C, prior to rapid cooling at ~60 Ma. All grains give fission track ages compatible with a fission track age of ~60 Ma (i.e., all data plot within ±2 of the radial line corresponding to an age of ~60 Ma), and most are significantly younger than the stratigraphic age.
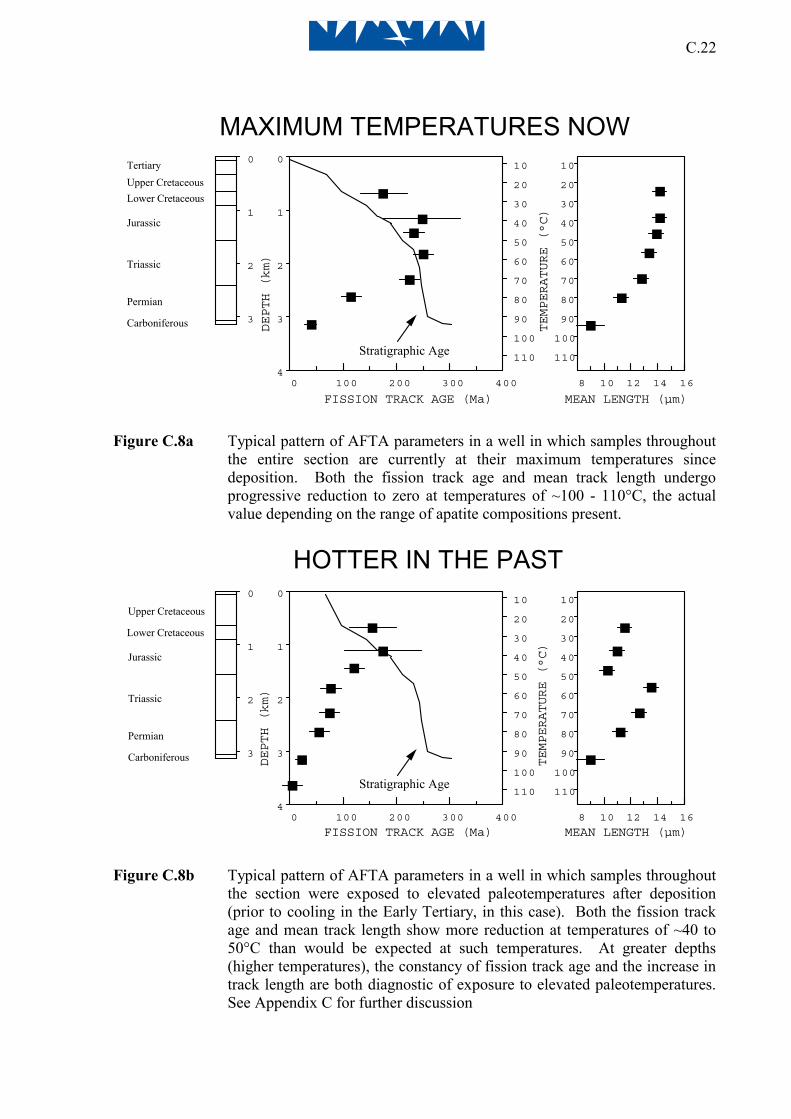
C.22
0 0
1 1
2 2
3 3
4
10 10
20 20
30 30
40 40
50 50
60 60
70 70
80 80
90 90
100 100
110 110
0 100 200 300 400 8 10 12 14 16
TEMPERATURE (°C)
DEPTH (km)
FISSION TRACK AGE (Ma) MEAN LENGTH (µm)
Stratigraphic Age
Upper CretaceousLower Cretaceous
Jurassic
Triassic
Permian
Carboniferous
MAXIMUM TEMPERATURES NOWTertiary
Figure C.8a Typical pattern of AFTA parameters in a well in which samples throughout
the entire section are currently at their maximum temperatures since deposition. Both the fission track age and mean track length undergo progressive reduction to zero at temperatures of ~100 - 110°C, the actual value depending on the range of apatite compositions present.
0 0
1 1
2 2
3 3
4
10 10
20 20
30 30
40 40
50 50
60 60
70 70
80 80
90 90
100 100
110 110
0 100 200 300 400 8 10 12 14 16
TEMPERATURE (°C)
DEPTH (km)
FISSION TRACK AGE (Ma) MEAN LENGTH (µm)
Stratigraphic Age
Upper Cretaceous
Lower Cretaceous
Jurassic
Triassic
Permian
Carboniferous
HOTTER IN THE PAST
Figure C.8b Typical pattern of AFTA parameters in a well in which samples throughout
the section were exposed to elevated paleotemperatures after deposition (prior to cooling in the Early Tertiary, in this case). Both the fission track age and mean track length show more reduction at temperatures of ~40 to 50°C than would be expected at such temperatures. At greater depths (higher temperatures), the constancy of fission track age and the increase in track length are both diagnostic of exposure to elevated paleotemperatures. See Appendix C for further discussion

C.23
0
20 60 100 140 180
1.0
2.0
3.0
4.0
TEMPERATURE (°C)
DEP
TH (K
M)
Range of geothermal gradients
compatible with paleotemperatures
estimated over a narrow interval
Range of geothermal gradients compatible with paleotemperature
estimates obtained over a greater vertical range
Figure C.9 It is important to obtain paleotemperature constraints over as great a range of
depths as possible in order to provide a reliable estimate of paleogeothermal gradient. If paleotemperatures are only available over a narrow depth range, then the paleogeothermal gradient can only be very loosely constrained.

C.24
Ts - Ti (dT/dZ)
Temperature (T)D
epth
(Z)
Ts Ti
removed section (U) = pal
Maximum paleotemperature profile
Present-day temperature profile
0
Figure C.10 If the paleogeothermal gradient can be constrained by AFTA and VR, as
explained in the text, then for an assumed value of surface temperature, Ts, the amount of section removed can be estimated, as shown.

D.1
APPENDIX D Integration of Vitrinite Reflectance Data with AFTA
Vitrinite reflectance is a time-temperature indicator governed by a kinetic response in a similar manner to the annealing of fission tracks in apatite as described in Appendix C. In this study, vitrinite reflectance data are interpreted on the basis of the distributed activation energy model describing the evolution of VR with temperature and time described by Burnham and Sweeney (1989), as implemented in the BasinModTM software package of Platte River Associates. In a considerable number of wells from around the world, in which AFTA has been used to constrain the thermal history, we have found that the Burnham and Sweeney (1989) model gives good agreement between predicted and observed VR data, in a variety of settings.
As in the case of fission track annealing, it is clear from the chemical kinetic description embodied in equation 2 of Burham and Sweeney (1989) that temperature is more important than time in controlling the increase of vitrinite reflectance. If the Burham and Sweeney (1989) distributed activation energy model is expressed in the form of an Arrhenius plot (a plot of the logarithm of time versus inverse absolute temperature), then the slopes of lines defining contours of equal vitrinite reflectance in such a plot are very similar to those describing the kinetic description of annealing of fission tracks in Durango apatite developed by Laslett et al. (1987), which is used to interpret the AFTA data in this report. This feature of the two quite independent approaches to thermal history analysis means that for a particular sample, a given degree of fission track annealing in apatite of Durango composition will be associated with the same value of vitrinite reflectance regardless of the heating rate experienced by a sample. Thus paleotemperature estimates based on either AFTA or VR data sets should be equivalent, regardless of the duration of heating. As a guide, Table D.1 gives paleotemperature estimates for various values of VR for two different heating times.
One practical consequence of this relationship between AFTA and VR is, for example, that a VR value of 0.7% is associated with total annealing of all fission tracks in apatite of Durango composition, and that total annealing of all fission tracks in apatites of more Chlorine-rich composition is accomplished between VR values of 0.7 and ~0.9%.
Furthermore, because vitrinite reflectance continues to increase progressively with increasing temperature, VR data allow direct estimation of maximum paleotemperatures

D.2
in the range where fission tracks in apatite are totally annealed (generally above ~110°C) and where therefore AFTA only provides minimum estimates. Maximum paleotemperature estimates based on vitrinite reflectance data from a well in which most AFTA samples were totally annealed will allow constraints on the paleogeothermal gradient that would not be possible from AFTA alone. In such cases the AFTA data should allow tight constraints to be placed on the time of cooling and also the cooling history, since AFTA parameters will be dominated by the effects of tracks formed after cooling from maximum paleotemperatures. Even in situations where AFTA samples were not totally annealed, integration of AFTA and VR can allow paleotemperature control over a greater range of depth, e.g. by combining AFTA from sand-dominated units with VR from other parts of the section, thereby providing tighter constraint on the paleogeothermal gradient.
References
Burnham, A.K. and Sweeney, J.J. (1989) A chemical kinetic model of vitrinite
reflectance maturation. Geochim. et Cosmochim. Acta, 53, 2649-2657.
Laslett, G.M., Green, P.F., Duddy, I.R. and Gleadow, A.J.W. (1987) Thermal annealing of fission tracks in apatite 2. A quantitative analysis. Chem. Geol. (Isot. Geosci. Sect.), 65, 1-13.

D.3
Table D.1: Paleotemperature - vitrinite reflectance nomogram based on
Equation 2 of Burnham and Sweeney (1989) Paleotemperature Vitrinite Reflectance (%) (°C / °F) 1 Ma 10 Ma Duration of heating Duration of heating 40 / 104 0.29 0.32 50 / 122 0.31 0.35 60 / 140 0.35 0.40 70 / 158 0.39 0.45 80 / 176 0.43 0.52 90 / 194 0.49 0.58 100 / 212 0.55 0.64 110 / 230 0.61 0.70 120 / 248 0.66 0.78 130 / 266 0.72 0.89 140 / 284 0.81 1.04 150 / 302 0.92 1.20 160 / 320 1.07 1.35 170 / 338 1.23 1.55 180 / 356 1.42 1.80 190 / 374 1.63 2.05 200 / 392 1.86 2.33 210 / 410 2.13 2.65 220 / 428 2.40 2.94 230 / 446 2.70 3.23

Source number
Depth
(m)
Stratigraphic age
(Ma)
Present temperature
(°C)
VR(Range)
%
N*1
Vitrinite reflectance sample details and results supplied by client - West Greenland (Geotrack Report #883)
StratigraphicSubdivision
Sampletype
Table D.2:
D.4
Umiivik-1
(0.40-0.70)781251c E. Coniaciancore 189-87 0.5550
(0.46-0.65)721252c E. Coniaciancore 389-87 0.55105
(0.42-0.72)571253c E. Coniaciancore 589-87 0.55151
(0.50-0.75)481134c E. Coniaciancore 689-87 0.61200
(0.48-0.72)551135c E. Coniaciancore 889-87 0.60251
(0.49-0.76)531136c E. Coniaciancore 989-87 0.62308
(0.51-0.74)411137c L. Turoniancore 1190-89 0.63358
(0.97-1.24)421138c L. Turoniancore 1290-89 1.15404
(1.79-2.48)1011139c L. Turoniancore 1490-89 2.17451
(2.07-2.79)1001279c* L. Turoniancore 1990-89 2.47645
(1.42-1.92)641280c Albian? - Turoniancore 21112-90 1.67711
(1.52-1.89)891254c Albian? - Turoniancore 23112-90 1.69753
(1.79-2.19)701255c Albian? - Turoniancore 24112-90 1.98794
(3.80-4.90)1001256c Albian? - Turoniancore 27112-90 4.25910
(4.01-4.59)921257c Albian? - Turoniancore 32112-90 4.311066
(2.13-2.91)831281c Albian? - Turoniancore 33112-90 2.511114
(1.98-2.50)721258c Albian? - Turoniancore 35112-90 2.221151
(1.81-2.04)441282c Albian? - Turoniancore 35112-90 1.931172
(1.71-2.14)551283c Albian? - Turoniancore 36112-90 1.941198

Source number
Depth
(m)
Stratigraphic age
(Ma)
Present temperature
(°C)
VR(Range)
%
N*1
Continued
StratigraphicSubdivision
Sampletype
Table D.2:
D.5
Gane-1
(0.55-0.82)681110c hyalocl + sed Daniancore 1563-62 0.70503-503
(0.54-0.83)681116c hyalocl + sed Daniancore 1563-62 0.66510-510
(0.57-0.81)751117c hyalocl + sed Daniancore 1663-62 0.69526-526
(0.56-0.84)621118c hyalocl + sed Daniancore 1663-62 0.70534-535
(0.53-0.82)561119c hyalocl + sed Daniancore 1663-62 0.67547-547
(0.61-0.89)701111c hyalocl + sed Daniancore 1863-62 0.75591-591
(0.53-0.80)571120c Daniancore 1865-63 0.68615-615
(0.49-0.68)401181c Daniancore 1965-63 0.58635
(0.47-0.71)331182c Daniancore 1965-63 0.60641
(0.63-0.81)371183c Daniancore 1965-63 0.72649

Source number
Depth
(m)
Stratigraphic age
(Ma)
Present temperature
(°C)
VR(Range)
%
N*1
Continued
StratigraphicSubdivision
Sampletype
Table D.2:
D.6
Gant-1
(0.50-0.74)161121c Daniancore 265-60 0.6368
(0.54-0.80)291122c Daniancore 365-60 0.6697
(0.51-0.75)301112c L. Campanian - L. Maastrichtiancore 876-65 0.67267
(0.51-0.74)421113c L. Campanian - L. Maastrichtiancore 1076-65 0.64322
(0.52-0.78)531114c L. Campanian - L. Maastrichtiancore 1176-65 0.64375
(0.57-0.83)421184c E. - M. Campaniancore 1481-76 0.71476
(0.63-0.86)361115c E. - M. Campaniancore 1681-76 0.76519
(0.51-0.83)351123c E. - M. Campaniancore 1881-76 0.71589
(0.60-0.86)411185c E. - M. Campaniancore 1981-76 0.74646
(0.60-0.86)211186c E. - M. Campaniancore 2181-76 0.74692
(0.70-0.86)351187c E. - M. Campaniancore 2181-76 0.79707
(0.68-0.85)91124c E. - M. Campaniancore 2481-76 0.76794
(0.70-1.02)661128c E. - M. Campaniancore 2481-76 0.86797
(0.76-1.09)681125c E. Campaniancore 2583-81 0.93837
(0.80-1.09)471126c E. Campaniancore 2683-81 0.96870
(0.99-1.27)411127c E. Campanian?core 2783-81 1.13895

Source number
Depth
(m)
Stratigraphic age
(Ma)
Present temperature
(°C)
VR(Range)
%
N*1
Continued
StratigraphicSubdivision
Sampletype
Table D.2:
D.7
Ataa-1
247803 L. Santonian - E. Campanian 185-80 0.5050
247806 L. Santonian - E. Campanian 285-80 0.4975
247818 L. Santonian - E. Campanian 385-80 0.53105
247822 L. Santonian - E. Campanian 1385-80 0.97435
247825 L. Santonian - E. Campanian 1585-80 0.54500
247826 L. Santonian - E. Campanian 1585-80 0.57520
247829 L. Santonian - E. Campanian 1685-80 0.57555

Source number
Depth
(m)
Stratigraphic age
(Ma)
Present temperature
(°C)
VR(Range)
%
N*1
Continued
StratigraphicSubdivision
Sampletype
Table D.2:
D.8
Gro-3
(0.61-0.95)851284c hyalocl + sed Daniancuttings 1163-62 0.77370
(0.59-0.83)391285c Daniancuttings 1565-63 0.74510
(0.87-1.08)451268c E. Maastrichtiancuttings 3374-70 0.981110
(0.88-1.15)471269c E. Maastrichtiancuttings 3574-70 1.011150
(1.10-1.55)861286c Campaniancuttings 3881-74 1.321250
(1.06-1.39)591270c Campaniancuttings 3981-74 1.231300
(1.10-1.38)471271c Campaniancuttings 4281-74 1.231390
(1.28-1.59)661287c Coniacian? - E. Campanian?cuttings 4689-81 1.421545
(1.44-1.82)911288c Albian? - Coniaciancuttings 52112-89 1.611725
(2.02-2.39)591276c Albian? - Coniaciancuttings 71112-89 2.242365
(2.01-2.50)801277c Albian? - Coniaciancuttings 73112-89 2.292435
*1See Appendix A for discussion of present temperature data.
Note: Some samples may contain both vitrinite and inertinite. Only vitrinite data is shown.

E.1
Geotrack Report #883: Thermal History of fifteen samples from five boreholes, Onshore West Greenland
APPENDIX E
(U-Th)/He dating of apatite: Technical and analytical details
E.1 Sample details
Apatites from seven samples of Late Cretaceous sedimentary rocks, including samples from four of five the boreholes from which AFTA data were obtained, were submitted for (U-Th)/He dating (apatites from other samples were judged to be unsuitable for analysis due to either a lack of additional apatites or to the presence of inclusions, cracks or other imperfections). In detail, for six of these seven samples, material was recollected from the same depth intervals as the original AFTA samples, due to lack of suitable apatites from the original AFTA samples after preparation of the grain mounts for AFTA. These second sample collections are denoted in the data Tables with a “u” suffix (e.g. GC883-1u). The exception is sample GC883, from which sufficient apatite was available remaining from the AFTA analysis.
Sample details of all samples submitted for analysis are summarised in Table E.1. Five individual grains of apatite from each sample were analysed in all samples (except GC883-9 in which only four suitable grains were available), based on careful inspection of the grains to ensure the absence of inclusions etc (see Section E.3). Full results of all (U-Th)/He age determinations are provided in Tables E.2 and E.3. The (U-Th)/He age determinations were carried out under the auspices of Dr. Peter Crowhurst, CSIRO Division of Petroleum Geosciences, Sydney, where all analyses were carried out.
E.2 Instrumentation
The CSIRO He extraction and analysis facility comprises an all-metal He extraction and gas-handling line connected to a dedicated on-line Balzers Prisma 200 quadrupole mass spectrometer. Gas extraction is performed using a Nd-YAG laser system at ~1 to 2 watts of power applied to the sample for ~10 minutes, heating the sample to a temperature of ~1000°C. With the lower blanks afforded by the laser-

E.2
Geotrack Report #883: Thermal History of fifteen samples from five boreholes, Onshore West Greenland
based system (compared to the more traditional furnace-based system), single grains can be analysed, although in some cases multiple grains are combined in a single run.
The system is essentially the same as that described by House et al. (2000). Individual grains, selected on the basis of clarity and absence of inclusions (see Section E.3), were packaged into 1mm x 1mm platinum tubing which was crimped at each end sufficient to hold the grain(s) but still allow gas to escape. Up to 25 platinum tubing packages are placed in individual pits drilled into a copper base plate inside a 10-8 Torr vacuum chamber, enabling each sample package to be heated sequentially. Blanks are analysed between each unknown sample.
The line and laser (or furnace) are evacuated via ion, turbo and backing pumps. Active gases, particularly hydrogen, are removed using SAES getters. The analysis procedure is operated by LabVIEW automation software supplied by Prof. Ken Farley, Caltech.
E.3 Sample selection and measurement of grain radii
Apatite grains are carefully handpicked in order to avoid U- and Th-rich mineral inclusions (e.g. zircon, monazite), that may produce excess He. Images of selected grains are captured by a CCD video camera mounted on the microscope and measured using image analysis techniques for the purposes of alpha ejection correction calculation. This correction is mathematically calculated using the estimated dimensions of each grain and is applied directly to the final age (discussed in more detail below).
E.4 Helium measurement
Abundances of 4He are determined by isotope dilution using a pure 3He spike, which is calibrated on a regular basis against an independent 4He standard tank. Line and laser blank analyses are performed before lasing each of the samples. Each sample is lased twice in order to ascertain if there is any significant “re-extract” (“4He hot blanks”). Acceptable 4He standard and blank levels are <0.05ncc 4He. After the heating and purification procedures, the extracted gas is handled and measured via the fully automated computer controlled system.

E.3
Geotrack Report #883: Thermal History of fifteen samples from five boreholes, Onshore West Greenland
E.5 Uranium and thorium Concentration
The U and Th content of degassed apatite samples are determined on a Perkin Elmer Sciex 5000a ICP-MS using the Isotope Ratio application. A quantity of 100µl of each 235U and 230Th spike solution (about 5ng and 6ng U and Th respectively) and 200µl of concentrated nitric acid are added to a vial containing the capsule and degassed apatite. Similarly, 100µl of 0.25 ppm U and Th standard solutions (Johnson Matthey) are spiked and acidified. Our determination of the 235U/238U ratio of the Johnson Matthey U-standard solution is 135, close to the natural value of 138.
Blanks are prepared by adding an equivalent amount of nitric acid to washed, empty capsules. The blanks, standards and samples are all diluted to 5% nitric solution with Alpha Q water prior to analysis. Based on replicate analysis of spiked standard solutions, precision for 235U/238U and 230Th/232Th determination is 0.77% and 0.41%, respectively.
E.6 Age determination
The basic equation governing the production of Helium in apatite is as follows:
4He = 8 [238U] (eλ238 t – 1) + 7 [235U] (eλ235 t – 1) + 6 [232Th] (eλ232 t – 1)
where 4He, [238U], [235U] and [232Th] are the measured concentration of the respective isotopes, the numeral before each term refers to the number of alpha particles produced in the appropriate decay chain, each λ represents the alpha-decay constants for the respective isotopes and t is the time over which He has accumulated. The three isotopes represented in the equation represent the only significant contributors of helium in natural samples. By measurement of the amounts of each isotope, the time t can be evaluated by solving this equation iteratively. The resulting number is known as a (U-Th)/He age.
As with the case of fission track ages, in the absence of other factors, this would provide a measure of the time over which helium has accumulated in the apatite lattice. However, due to a number of factors, outlined in the following Sections, a (U-Th)/He age must be interpreted carefully before the true meaning of the measured age can be evaluated.

E.4
Geotrack Report #883: Thermal History of fifteen samples from five boreholes, Onshore West Greenland
E.7 Grain size correction
The ranges of alpha particles produced by decay of uranium and thorium isotopes are typically between 12 and 34 µm (Farley et al., 1996). Since these “stopping distances” are a significant fraction of the radius of typical accessory or detrital apatite grains (between 30 and 100 µm), a significant proportion of alpha particles produced with an apatite grain may be emitted from the grain, resulting in loss of radiogenic helium. Farley et al. (1996) showed how this effect can be corrected for, by calculation of a correction factor (known as FT) for a particular grain size.
E.8 Thermal sensitivity
Calculations of Helium retention over geological timescales, based on laboratory diffusion measurements, suggest that Helium is progressively lost at temperatures between 40 and 90°C (for timescales of tens of millions of years), with this temperature range constituting a Helium “Partial Retention Zone” or He PRZ.
More recently, measurements of (U-Th)/He ages in samples from hydrocarbon exploration boreholes in the Otway Basin of S.E. Australia (House et al., 1999) have confirmed this general pattern of behaviour. Their results also suggest that, in general, helium diffusion systematics derived from laboratory measurements can be extrapolated to geological conditions with confidence, although the exact details remain to be quantitatively assessed.
Again analogous to the case of fission track ages in apatite, the progressive reduction of (U-Th)/He ages with increasing temperature means that a measured (U-Th)/He age from a sample of detrital apatite from a sediment cannot be interpreted as representing the timing of a specific cooling episode (with the exception of the situation where a sample cools very rapidly from above 90°C to less than 40°C). Instead, the measured age must be interpreted in terms of the interplay between production of Helium by alpha decay and loss due to thermally controlled diffusion (as described below).

E.5
Geotrack Report #883: Thermal History of fifteen samples from five boreholes, Onshore West Greenland
E.9 Effect of grain size on sensitivity
Detailed experimental measurements at Caltech have led to further refinements in understanding the diffusion systematics of Helium in apatite (Farley, 2000). This work, focussed on the much-studied Durango apatite, has suggested that the diffusion systematics are controlled by the physical grain size. This key observation implies that for any specified thermal history, modelled (U-Th)/He ages can be produced for a particular sample using the measured mean grain size together with single values of the key diffusion parameters Ea and log (Do), using best estimates of Ea = 33 ± 0.5 kcal/mol and log (Do) = 1.5 ± 0.6 cm2/s. These values have been used in modelling (U-Th)/He ages for this report.
Because of the greater diffusive loss expected from smaller grains compared to larger grains, the helium closure temperatures in apatite will also vary with grain radius. The overall variation in closure temperature for samples with grain radii of 50-150 microns is predicted to be only 5°C (Farley, 2000). However, effects related to grain size may be significant in the interpretation of apatites from sediments which have been heated to paleotemperatures within the He PRZ, as grains of different radii will give different ages for a particular thermal history. While this has yet to be demonstrated in natural samples, this holds considerable promise for obtaining more precise thermal history control in sedimentary basins.
E.10 Compositional effects
Several studies suggest that the composition of the apatite does not appear to affect the sensitivity of the He closure temperature (Wolf et al., 1996; House et al., 1999), in contrast to the effect of Cl contents on AFTA annealing kinetics. Further studies of possible variation in diffusion rates between different apatite species are currently being carried out at Caltech.

E.6
Geotrack Report #883: Thermal History of fifteen samples from five boreholes, Onshore West Greenland
References
Farley, K.A. 2000. Helium diffusion from apatite: general behaviour as illustrated by Durango fluorapatite. Journal of Geophysical Research, 105 (B2), 2903-2914.
Farley, K.A., Wolf, R.A. and Silver, L.T. 1996. The effects of long alpha-stopping distances on (U-Th)/He ages. Geochimica et Cosmochimica Acta, 60, 4223-4229.
House, M.A., Wernicke, B.P., Farley, K.A. and Dumitru, T.A. 1997. Cenozoic thermal evolution of the central Sierra Nevada, California, from (U-Th)/He thermochronometry. Earth and Planetary Science Letters, 151, 167-179.
House, M.A., Farley, K.A. and Kohn, B.P. 1999. An empirical test of helium diffusion in apatite: borehole data from the Otway Basin, Australia. Earth and Planetary Science Letters, 170, 463-474.
House, M.A. Farley, K.A. and D. Stockli, D. 2000. Helium chronometry of apatite and titanite using Nd-YAG laser heating. Earth and Planetary Science Letters, 183, pp. 365-368.
Lippolt, H.J., Leitz, M., Wernicke, R.S. and Hagedorn, B. 1994. (Uranium + thorium)/helium dating of apatite: experience with samples from different geochemical environments. Chemical Geology (Isotope Geoscience Section), 112, 179-191.
Warnock, A.C., Zeitler, P.K., Wolf, R.A. and Bergman, S.C. 1997. An evaluation of low-temperature apatite U-Th/He thermochronometry. Geochimica et Cosmochimica Acta, 61, 5371-5377.
Wolf, R.A., Farley, K.A. and Kass, D.M. 1998. Modeling of the temperature sensitivity of the apatite (U-Th)/He thermochronometer. Chemical Geology, 148, 105-114.
Wolf, R.A., Farley, K.A. and Silver, L.T. 1996. Helium diffusion and low-temperature thermochronometry of apatite. Geochimica et Cosmochimica Acta, 60, 4231-4240.
Wolf, R.A., Farley, K.A. and Silver, L.T. 1997. Assessment of (U-Th)/He thermochronometry: the low temperature history of the San Jacinto mountains, California. Geology, 25, 65-68.

E.7
Table E.1: Borehole samples selected for (U/Th)/He dating - West Greenland Study (Geotrack Report #883)
Sample Depth Stratigraphic age Sample type Present number (m) temperature (°C) Umiivik-1 GC883-1 278-291 E. Coniacian core 9 89-87 Ma Gane-1 GC883-3 510-515 hyalocl + sed core 15 63-62 Ma Gant-1 GC883-4 146-153 L. Campanian - L. Maastrichtian core 4 76-65 Ma GC883-5 749-758 E. - M. Campanian core 23 81-76 Ma Gro-3 GC883-8 750-780 L. Maastrichtian cuttings 23 70-65 Ma GC883-9 1000-1020 E. Maastrichtian cuttings 30 74-70 Ma GC883-10 1705-1715 Albian? - Coniacian cuttings 51 112-89 Ma

E.8
Table E.2: Apatite (U-Th)/He determinations - samples from West Greenland boreholes (Geotrack Report #883)
Sample 4He Uranium Thorium Uncorrected number He age (ncc) (atoms) (atoms) (Ma) Umiivik-1 GC883-1ua 0.307 ± 0.001 3.69E11 ± 1.55E10 1.18E12 ± 5.10E10 10.00 GC883-1ub 0.210 ± 0.001 3.06E11 ± 1.25E10 5.24E11 ± 2.23E10 10.29 GC883-1uc 0.117 ± 0.001 1.06E11 ± 4.39E09 3.48E11 ± 1.51E10 13.10 GC883-1ud 0.064 ± 0.001 9.28E10 ± 3.87E09 3.95E11 ± 1.72E10 7.28 GC883-1ue 0.021 ± 0.001 1.89E10 ± 8.73E08 1.92E11 ± 8.36E09 6.96 Gane-1 GC883-3a 0.230 ± 0.001 1.71E10 ± 7.47E08 3.56E11 ± 1.52E10 48.37 GC883-3b 0.036 ± 0.001 1.20E10 ± 5.41E08 6.40E11 ± 2.71E10 4.71 GC883-3c 10.270 ± 0.002 9.68E11 ± 3.95E10 9.76E11 ± 4.11E10 177.64 GC883-3d 0.766 ± 0.002 1.43E11 ± 5.90E09 1.22E12 ± 5.15E10 37.69 GC883-3e 0.024 ± 0.001 2.96E09 ± 1.39E08 1.07E12 ± 4.51E10 2.01 Gant-1 GC883-4ua 0.720 ± 0.002 5.58E11 ± 2.28E10 1.79E11 ± 7.65E09 25.12 GC883-4ub 0.143 ± 0.001 1.11E11 ± 4.70E09 4.31E11 ± 1.84E10 14.23 GC883-4uc 0.552 ± 0.002 7.11E10 ± 3.04E09 4.91E10 ± 2.34E09 138.61 GC883-4ud 0.165 ± 0.002 1.06E11 ± 4.50E09 5.31E10 ± 2.52E09 29.20 GC883-4ue 0.836 ± 0.004 5.95E11 ± 2.44E10 3.38E12 ± 1.43E11 12.72 GC883-5ua 0.027 ± 0.001 1.22E11 ± 5.01E09 3.70E11 ± 1.61E10 2.73 GC883-5ub 0.040 ± 0.001 6.39E10 ± 2.68E09 9.56E10 ± 4.30E09 9.74 GC883-5uc 0.004 ± 0.001 1.18E10 ± 5.19E08 6.73E10 ± 2.98E09 3.06 GC883-5ud 0.122 ± 0.001 8.38E10 ± 3.52E09 9.96E10 ± 4.65E09 23.89 GC883-5ue 0.033 ± 0.001 5.93E10 ± 2.50E09 1.83E11 ± 7.99E09 6.79 Gro-3 GC883-8ua 0.058 ± 0.002 6.62E10 ± 2.92E09 1.59E10 ± 1.04E09 17.38 GC883-8ub 0.082 ± 0.002 5.94E10 ± 2.67E09 1.50E11 ± 6.43E09 18.22 GC883-8uc 0.040 ± 0.001 5.31E10 ± 2.45E09 2.00E10 ± 1.01E09 14.51 GC883-8ud 0.105 ± 0.002 4.07E10 ± 1.91E09 1.49E11 ± 6.36E09 29.26 GC883-8ue 0.454 ± 0.002 4.19E11 ± 1.72E10 2.80E10 ± 1.34E09 22.33 GC883-9ua 0.008 ± 0.001 1.82E10 ± 8.74E08 8.59E08 ± 6.91E08 9.12 GC883-9ub 0.045 ± 0.001 1.62E11 ± 6.78E09 5.70E11 ± 2.44E10 3.21 GC883-9uc 0.045 ± 0.001 1.26E11 ± 5.33E09 4.17E10 ± 1.96E09 6.94 GC883-9ud 0.001 ± 0.001 1.44E10 ± 7.17E08 3.44E11 ± 1.45E10 0.22 GC883-10u 0.100 ± 0.001 9.68E11 ± 4.02E10 2.03E12 ± 8.48E10 1.46 GC883-10u 0.731 ± 0.002 1.03E12 ± 4.29E10 3.42E11 ± 1.51E10 13.75 GC883-10u 0.053 ± 0.001 1.03E11 ± 4.38E09 5.03E11 ± 2.10E10 5.06 GC883-10u 0.495 ± 0.002 8.24E10 ± 3.42E09 2.90E11 ± 1.23E10 69.13 GC883-10u 0.018 ± 0.001 4.87E10 ± 2.06E09 1.05E11 ± 4.50E09 5.16

E.9
Table E.3: Apatite (U-Th)/He age alpha particle ejection corrections - samples from West Greenland boreholes (Geotrack Report #883)
Sample Uranium Thorium Mean Number FT*1 Corrected
number grain of He age radius (ppm) (ppm) (µm) (Ma) Umiivik-1 GC883-1ua 52.43 162.90 50.00 1 0.70 14.29 ± 0.43 GC883-1ub 52.96 87.78 40.00 1 0.66 15.60 ± 0.48 GC883-1uc 35.31 111.84 35.00 1 0.62 21.12 ± 0.65 GC883-1ud 17.59 72.44 40.00 1 0.66 11.03 ± 0.37 GC883-1ue 2.28 22.37 55.00 1 0.72 9.66 ± 0.56 Gane-1 GC883-3a 1.52 30.44 60.00 1 0.76 63.65 ± 2.32 GC883-3b 0.47 24.16 75.00 1 0.80 5.89 ± 0.28 GC883-3c 21.17 20.67 85.00 1 0.84 211.48 ± 7.04 GC883-3d 3.40 28.16 85.00 1 0.83 45.42 ± 1.42 GC883-3e 0.06 22.07 115.00 1 0.84 2.40 ± 0.14 Gant-1 GC883-4ua 22.44 6.95 70.00 1 0.81 31.01 ± 1.15 GC883-4ub 11.02 41.49 50.00 1 0.71 20.04 ± 0.61 GC883-4uc 11.32 7.57 42.50 1 0.66 210.01 ± 7.70 GC883-4ud 26.33 12.78 42.50 1 0.64 45.63 ± 1.74 GC883-4ue 43.05 236.51 52.50 1 0.73 17.42 ± 0.52 GC883-5ua 13.83 40.72 50.00 1 0.72 3.79 ± 0.18 GC883-5ub 14.13 20.46 45.00 1 0.67 14.53 ± 0.50 GC883-5uc 1.96 10.81 40.00 1 0.67 4.56 ± 0.59 GC883-5ud 15.89 18.26 40.00 1 0.64 37.32 ± 1.28 GC883-5ue 13.12 39.25 40.00 1 0.66 10.29 ± 0.44 Gro-3 GC883-8ua 10.53 2.45 105.00 1 0.67 25.94 ± 1.25 GC883-8ub 4.30 10.52 102.50 1 0.76 23.98 ± 0.88 GC883-8uc 14.08 5.14 85.00 1 0.62 23.41 ± 1.13 GC883-8ud 2.94 10.41 105.00 1 0.76 38.51 ± 1.33 GC883-8ue 30.31 1.96 80.00 1 0.77 29.00 ± 1.14 GC883-9ua 2.89 0.13 57.50 1 0.67 13.62 ± 1.82 GC883-9ub 40.19 137.36 42.50 1 0.61 5.26 ± 0.19 GC883-9uc 7.61 2.44 55.00 1 0.77 9.02 ± 0.40 GC883-9ud 1.06 24.51 57.50 1 0.76 0.29 ± 0.29 GC883-10ua 38.53 78.29 65.00 1 0.80 1.82 ± 0.06 GC883-10ub 31.66 10.14 80.00 1 0.81 16.97 ± 0.63 GC883-10uc 8.91 42.10 62.50 1 0.76 6.66 ± 0.23 GC883-10ud 11.31 38.47 62.50 1 0.72 96.02 ± 2.82 GC883-10ue 6.93 14.46 50.00 1 0.72 7.17 ± 0.46
*1 Grain-size dependent correction factor to allow for ejection of alpha particles from grain periphery.