Thermal Expansion and Hydration Behavior of...
57
SAND REPORT SAND2003-8000 Unlimited Release Printed February 2003 Thermal Expansion and Hydration Behavior of PMMA Molding Materials for LIGA Applications S. H. Goods, R. M. Watson, M. Yi. Prepared by Sandia National Laboratories Albuquerque, New Mexico 87185 and Livermore, California 94550 Sandia is a multiprogram laboratory operated by Sandia Corporation, a Lockheed Martin Company, for the United States Department of Energy’s National Nuclear Security Administration under Contract DE-AC04-94-AL85000. Approved for public release; further dissemination unlimited.
-
Upload
nguyenkhanh -
Category
Documents
-
view
243 -
download
0
Transcript of Thermal Expansion and Hydration Behavior of...

SAND REPORT
SAND2003-8000 Unlimited Release Printed February 2003 Thermal Expansion and Hydration Behavior of PMMA Molding Materials for LIGA Applications
S. H. Goods, R. M. Watson, M. Yi.
Prepared by Sandia National Laboratories Albuquerque, New Mexico 87185 and Livermore, California 94550
Sandia is a multiprogram laboratory operated by Sandia Corporation,
a Lockheed Martin Company, for the United States Department of Energy’s
National Nuclear Security Administration under Contract DE-AC04-94-AL85000. Approved for public release; further dissemination unlimited.

Issued by Sandia National Laboratories, operated for the United States Department of Energy by Sandia Corporation.
NOTICE: This report was prepared as an account of work sponsored by an agency of the United States Government. Neither the United States Government, nor any agency thereof, nor any of their employees, nor any of their contractors, subcontractors, or their employees, make any warranty, express or implied, or assume any legal liability or responsibility for the accuracy, completeness, or usefulness of any information, apparatus, product, or process disclosed, or represent that its use would not infringe privately owned rights. Reference herein to any specific commercial product, process, or service by trade name, trademark, manufacturer, or otherwise, does not necessarily constitute or imply its endorsement, recommendation, or favoring by the United States Government, any agency thereof, or any of their contractors or subcontractors. The views and opinions expressed herein do not necessarily state or reflect those of the United States Government, any agency thereof, or any of their contractors. Printed in the United States of America. This report has been reproduced directly from the best available copy. Available to DOE and DOE contractors from
U.S. Department of Energy Office of Scientific and Technical Information P.O. Box 62 Oak Ridge, TN 37831 Telephone: (865)576-8401 Facsimile: (865)576-5728 E-Mail: [email protected] Online ordering: http://www.doe.gov/bridge
Available to the public from
U.S. Department of Commerce National Technical Information Service 5285 Port Royal Rd Springfield, VA 22161 Telephone: (800)553-6847 Facsimile: (703)605-6900 E-Mail: [email protected] Online order: http://www.ntis.gov/help/ordermethods.asp?loc=7-4-0#online

1
SAND2003-8000 Unlimited Release
Printed January 2003
Thermal Expansion and Hydration Behavior of PMMA Molding Materials for LIGA Applications
S.H. Goods, R.M. Watson,
Microsystems and Materials Mechanics Department Sandia National Laboratories/California
M. Yi,
Dept. of Mechanical Engr., University of California, Los Angeles
Abstract
The thermal expansion coefficient, swelling characteristics and solute uptake kinetics of three PMMA molding materials (Perspex-CQ, Acrylite OP-1 and Solacryl 2750) are reported. Over the temperature range of 22 °C to 50 °C, all three materials exhibited similar CTE values of approximately 7.5 x 10⁻⁵ C-1. Swelling characteristics, measured as the change in length of coupons were examined in three environments: de-ionized water, Ni Sulfamate plating solution and Ni Watts plating solution. Total swelling after ≈ 150 hours of exposure was similar for all materials in each environment but were different for each environment examined: ≈ 0.42% for de-ionized water, ≈ 0.30% for the Ni Sulfamate and ≈ 0.36 % for the Ni-Watts plating solutions. Solute uptake kinetics were measured between 4 °C and 50 °C and the pre-exponential term (Do) and the activation energy (QD) are reported for each material in the three environments. Do values ranged between 0.07 and 0.45 cm2/sec depending on the environment. QD showed little variation, ranging between 4.1 and 4.4 x 10⁵ J/mole.

2
C O N T E N T S
Abstract ............................................................................................................................... 1
I. Introduction................................................................................................................... 3
II. Experimental ................................................................................................................. 4
PMMA and Plating Bath Composition........................................................................ 4
CTE and Swelling Measurements ............................................................................... 5
Weight Change Measurements .................................................................................... 6
III. Results and Discussion ................................................................................................. 7
Thermal Expansion Coefficient ................................................................................... 7
Swelling ....................................................................................................................... 8
Weight Change Measurements .................................................................................... 9
IV. Conclusion ................................................................................................................. 14
V. Acknowledgements.................................................................................................... 15
VI. References.................................................................................................................. 16
VII. Figures ....................................................................................................................... 17
VIII. Appendix.................................................................................................................. 43
Distribution ....................................................................................................................... 53

3
Thermal Expansion and Hydration Behavior of PMMA Molding Materials for LIGA Applications
I. Introduction PMMA (polymethylmethacrylate) is used as a photoresist molding material for LIGAa fabrication. The LIGA process is capable of producing discrete, free-standing, metallic parts having lateral dimensions that measure in the ten’s of microns to centimeters and thicknesses up to several millimeters. The process is shown schematically in Figure 1. A PMMA blank, bonded to a conductive substrate (typically a metallized silicon or glass wafer), is exposed to an X-ray source through a lithography mask that replicates the features of interest. X-ray exposure renders the PMMA more susceptible to dissolution by an appropriate chemical “developer”. The result, then, is a mold consisting of deep cavities having the precise geometry of the parts and structures to be fabricated. The mold is then immersed in an electroplating bath and the cavities are filled with an electrodeposited metal or alloy. Subsequent processing steps involve the planarization of the top surface, removal of the PMMA and chemical release of the final piece parts. Because highly collimated X-ray sources are used to expose the PMMA molding blank, lateral dimensional accuracy can be quite fine. However, within the various fabrications steps of LIGA, there are processes that can degrade dimensional accuracy. Among the most significant, and of particular interest here, are the effects of thermal expansion and swelling-induced dimensional changes in the PMMA during the electroplating step. Electrodeposition is most commonly performed at temperatures between 40 °C and 60 °C, temperatures higher than that at which the development of the PMMA is performed (temperature of the PMMA during X-ray exposure is also an important consideration, but is not well characterized). The differential between the exposure/development temperature of the PMMA and the electrodeposition temperature gives rise to a characteristic dimensional artifact called “sidewall taper” where the base of a high aspect ratiob feature is wider than the top. The same artifact can arise as the result of the swelling of the PMMA while it is immersed in the plating bath. The duration of the plating step can vary significantly from a few hours to several weeks depending on the through thickness of the mold, the metal or alloy being deposited and the specific plating conditions employed. This swelling is the result of solute uptake over the prolonged immersion. An example of the extent to which sidewall taper can compromise the dimensional accuracy of a feature in a LIGA fabricated structure is shown in Figure 2. This figure shows part of a sensing device that consists of a center mass connected of 8 narrow beams or flexures. The functionality of the device is governed by the dimensional accuracy of these beams (especially their widths) about which they flex. The insert in Figure 2 shows the cross section of one of these flexures and it is evident that the width at the base of the structure (the seed surface for deposition), nominally
a LIGA is an acronym derived from the German: Lithographie- Lithography, Galvangformung- Electroforming, Abformung- molding b Aspect ratio is the ratio between the height of a feature and its width
4
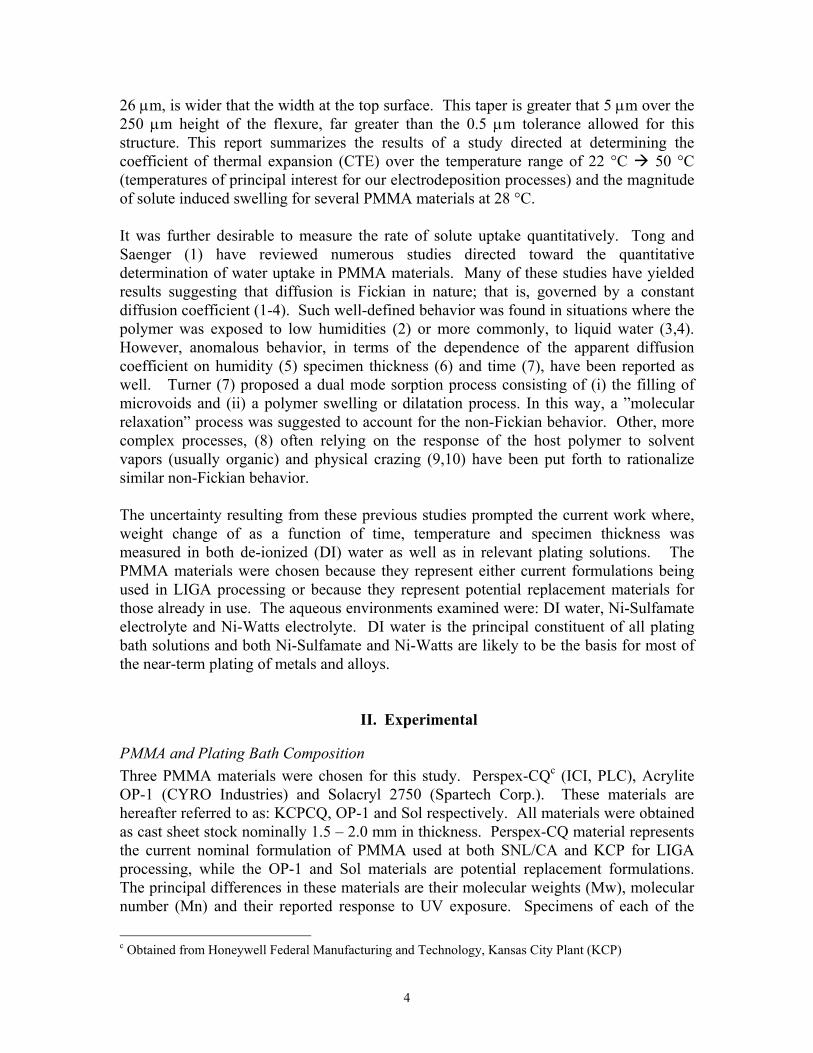
26 µm, is wider that the width at the top surface. This taper is greater that 5 µm over the 250 µm height of the flexure, far greater than the 0.5 µm tolerance allowed for this structure. This report summarizes the results of a study directed at determining the coefficient of thermal expansion (CTE) over the temperature range of 22 °C 50 °C (temperatures of principal interest for our electrodeposition processes) and the magnitude of solute induced swelling for several PMMA materials at 28 °C. It was further desirable to measure the rate of solute uptake quantitatively. Tong and Saenger (1) have reviewed numerous studies directed toward the quantitative determination of water uptake in PMMA materials. Many of these studies have yielded results suggesting that diffusion is Fickian in nature; that is, governed by a constant diffusion coefficient (1-4). Such well-defined behavior was found in situations where the polymer was exposed to low humidities (2) or more commonly, to liquid water (3,4). However, anomalous behavior, in terms of the dependence of the apparent diffusion coefficient on humidity (5) specimen thickness (6) and time (7), have been reported as well. Turner (7) proposed a dual mode sorption process consisting of (i) the filling of microvoids and (ii) a polymer swelling or dilatation process. In this way, a ”molecular relaxation” process was suggested to account for the non-Fickian behavior. Other, more complex processes, (8) often relying on the response of the host polymer to solvent vapors (usually organic) and physical crazing (9,10) have been put forth to rationalize similar non-Fickian behavior. The uncertainty resulting from these previous studies prompted the current work where, weight change of as a function of time, temperature and specimen thickness was measured in both de-ionized (DI) water as well as in relevant plating solutions. The PMMA materials were chosen because they represent either current formulations being used in LIGA processing or because they represent potential replacement materials for those already in use. The aqueous environments examined were: DI water, Ni-Sulfamate electrolyte and Ni-Watts electrolyte. DI water is the principal constituent of all plating bath solutions and both Ni-Sulfamate and Ni-Watts are likely to be the basis for most of the near-term plating of metals and alloys.
II. Experimental PMMA and Plating Bath Composition Three PMMA materials were chosen for this study. Perspex-CQc (ICI, PLC), Acrylite OP-1 (CYRO Industries) and Solacryl 2750 (Spartech Corp.). These materials are hereafter referred to as: KCPCQ, OP-1 and Sol respectively. All materials were obtained as cast sheet stock nominally 1.5 – 2.0 mm in thickness. Perspex-CQ material represents the current nominal formulation of PMMA used at both SNL/CA and KCP for LIGA processing, while the OP-1 and Sol materials are potential replacement formulations. The principal differences in these materials are their molecular weights (Mw), molecular number (Mn) and their reported response to UV exposure. Specimens of each of the
c Obtained from Honeywell Federal Manufacturing and Technology, Kansas City Plant (KCP)

5
three materials studied here were evaluated and Table I summarizes the measured values for Mw, Mn (measured via gel permeation chromatography) as well as the vendors’ indication of their UV characteristics. TABLE I: PMMA Specifications Used in This Study
Material Designation Avg. Molecular Weight, Mw
Avg. Molecular Number, Mn
UV Characteristics
Perspex -CQ KCPCQ 2.77 x 10⁶ 4.22 x 10⁵ No Stabilizer Acrylite OP-1 OP-1 2.47 x 10⁶ 3.15 x 10⁵ No Stabilizer Solacryl 2750 Sol 1.37 x 10⁶ 3.31 x 10⁵ Low absorption The swelling and solute uptake response of these PMMA materials to exposure in three environments was examined. These environments were: de-ionized water, Ni-Sulfamate plating solution, and Ni-Watts plating solution. Table II gives the composition of the two plating solutions along with relevant properties. Note that the conductivity of the electroplating solutions was measured using a Fisher-Scientific Digital Conductivity Meter (Model 09-326-2).
TABLE II: Composition and Properties of Electroplating Solutions Ni-Sulfamate Ni-Watts
1.3 M Ni-Sulfamate, [Ni(SO3)2] 30 g/L Boric Acid, [H2BO3] 0.2 g/L SDS (surfactant) ----------------------------------- pH: 4.1 Conductivity: 45 mS/cm
0.91 M Ni-Sulfate, NiSO4] 0.19 M Ni-Chloride, [NiCl2] 30 g/L Boric Acid, [H2BO3] 0.2 g/L SDS (surfactant) -----------------------------------
pH: 3.1 Conductivity: 39 mS/cm
CTE and Swelling Measurements Figure 3 shows a schematic representation of the apparatus used for both CTE and swelling measurements. The apparatus consists of a 304 stainless steel container (for holding the water or plating solutions) that was seated on a Barnstead/Thermolyne Model 732A programmable hot plate capable of maintaining a set point temperature to within ± 0.5 °C. All swelling experiments were performed at 28 °C. CTE measurements were performed by immersing the specimens in a water bath and linearly ramping the bath temperature between 22 °C and 50 °C. To prevent dimensional changes to the PMMA resulting from the uptake of water, specimens were sheathed in polyethylene bags while being immersed. The ramp rate was 15 °C/hr. Test coupons, instrumented with several thermocouples along their length, revealed that this ramp rate

6
resulted in a uniform temperature rise between the two temperature extremes. The specimens for CTE measurements measured 50 mm long by 10 mm wide and were the full thickness of the as-cast sheet stock. Expansion of the specimens was measured by monitoring the relative displacement of two stainless steel wire flags glued into holes that were drilled into the specimens. The spacing of the drill holes was nominally 40 mm. A Keyence Model 5041 Laser Micrometer having about 1 µm resolution was used to monitor the displacement of the wire flags. Data was recorded on a computer-based DAQ system. The measured changes in the flag spacing were corrected for the thermal expansion of the steel wire according to the scheme shown on Figure 4. The CTE (αflag) of the wire flags were independently measured in this same apparatus by attaching them to a titanium silicate specimen and then ramping the temperature. Since the titanium silicate has a nearly zero CTE near room temperature (11) the measured displacement of the wire flags is only attributable to the CTE of the stainless steel. In this way αflag was determined to be ≈1.3 x 10⁻⁵ °C-1
Swelling was measured in the same apparatus shown in Figure 3. In this instance, the specimens were not sheathed in polyethylene. Tests were performed on specimens having the same planar dimensions as those above but the thickness was reduced to 0.8 mm via fly cutting. This was necessary to insure that (nearly) full saturation was achieved in a tractable time period, usually about 150 hours. For these tests the environment of interest was first brought to temperature (28 °C) and stabilized. Only then was a specimen immersed. Separate measurements (where multiple thermocouples were attached to PMMA coupons) were used to determine that the PMMA specimens stabilized at the bath temperature within about a minute of being immersed and that the specimens were uniform in temperature along their length. Only then did data acquisition commence.
Weight Change Measurements Rectangular coupons of each material were prepared from a single sheet of PMMA and individually marked with a unique series of notches. In order to derive quantitative kinetic information, weight change was measured at three temperatures and for four thicknesses of each PMMA material. Samples were prepared in the as-cast thickness, and from sheet sections fly cut to 1.2 mm, 0.8 mm and 0.4 mm. The three temperatures examined were 4 °C, 28 °C and 50 °C. Mantle heaters with feedback controllers were used to maintain the temperatures of the 28 and 50 °C baths. Temperature was held constant to within 1 °C of the set point temperature. Samples were suspended by stainless steel wires and periodically removed for weight change measurements. Prior to being weighed, the coupons were patted dry. Measurements were made within a few minutes of the coupons being removed from the baths in order to minimize moisture loss. Those coupons immersed at the low temperature were suspended in beakers that were then covered and placed in a refrigerator held at a constant temperature of 4 °C. For all temperatures, baths and specimen thicknesses, two of each coupon were measured and the weight change values reported below are the average of three measurements for each coupon.

7
Finally, for both the swelling and weight change measurements, after being mechanically prepared, and prior to testing, all specimens were desiccated for two weeks over a molecular sieve bed while being held under a roughing pump vacuum. This insured a common starting condition of near zero moisture content prior to immersion in the various bath environments.
III. Results and Discussion Thermal Expansion Coefficient Figure 5a shows the measured change in the spacing of the stainless steel flags as a function of temperature for the KCPCQ PMMA. The slope of this trace, corrected for the thermal expansion of the stainless steel flags is the CTE of the material and is indicated on the Figure (7.4 x 10⁻⁵ °C-1). This value is actually a linear curve fit over the temperature range examined. Polymers often exhibit a temperature dependent CTE, even over a relatively small temperature range. This tendency would be manifested as a concave upward curvature in the traces, that is, an ever increasing slope with increasing temperature. Such upward curvature can be seen in Figure 5a. At the maximum temperature, the CTE of the PMMA is actually 7.7 x 10⁻⁵ °C-1 while at the lowest temperature the CTE is 6.6 x 10⁻⁵ °C-1. Rather than the linear fit then, the overall data is fit with somewhat greater precision by the polynomial expression:
2753 T10x80.2T10x90.310x03.1hx
×+×+−=∆ −−− (1)
Differentiating Equation 1 with respect to temperature and correcting for the CTE of the wire flags yields the temperature dependent expression for the thermal expansion coefficient, α, of the PMMA:
T10x6.510x2.5 75PMMA ×+=α −− (2)
Figure 5b shows a similar trace for the same specimen measured upon cooling. The average slope is nearly the same as that for Figure 5a. In fact, both curves essentially overlay, indicating that the measurements for the specimens sheathed in polyethylene are reversible, see Figure 5c. When similar tests are performed on PMMA specimens directly exposed to the bath, the specimens invariably exhibit a lower apparent CTE upon cooling. This apparent hysteresis results from the uptake of moisture in the PMMA as the specimen is heated. An example of this is shown in Figure 6. Figure 7a and b shows the thermal expansion measurements for OP-1 for both heating and cooling as does Figure 8a and b for Sol. Results for all of the PMMA materials are nearly identical and are summarized in Table III.

8
TABLE III: Measured CTE Values for PMMA
Material CTEd (°C-1) Temperature Dependent CTE
KCPCQ 7.5 x 10⁻⁵ 5.2 x 10⁻⁵ + 5.6 x 10⁻⁷ x T
OP-1 7.4 x 10⁻⁵ 4.9 x 10⁻⁵ + 7.3 x 10⁻⁷ x T
Sol 7.5 x 10⁻⁵ 5.9 x 10⁻⁵ + 4.2 x 10⁻⁷ x T
These values are in general agreement with CTE measurements for PMMA available in the literature (5 to 11 x 10-5 °C-1). (12-14)
Swelling Swelling, defined here as the linear change in dimension of PMMA test coupons, was measured for all three PMMA materials in each of the environments of interest. Since most electrodeposition for LIGA fabrication will be performed at plating temperature as close to ambient as possible, swelling measurements were performed only at 28 °C. Figure 9 shows the swelling response of the KCPCQ in DI water, Ni-Sulfamate and N-Watts baths. The initial rate of swelling is quite rapid. For example, in DI water, the initial rate of swelling is approximately 2 x 10⁻⁴ hr-1. This rate slows considerably with increasing time. Total dimensional change over the test time was ≈ 0.4 %, although swelling never quite plateaued. From practical considerations, plating processes last on the order of hours to several days. Rarely do electrodeposition processes for LIGA fabrication exceed 2 weeks. Thus it was considered unnecessary to continue these measurements out to excessive times. It is clear that the total swelling of the KCPCQ is measurably greater in the DI water than in either of the two plating solutions. The other PMMA materials exhibit comparable swelling in both the DI water and Watts bath electrolyte, but continue to show measurably less swelling in the Ni-Sulfamate bath. After 150 hours of exposure, swelling in the Ni Sulfamate bath was found to be about is about 25-35% less than in the DI water for all three of the test materials. This behavior parallels the observed weight change measurements discussed in the following section. Figure 10 and 11 show the swelling results for the OP-1 and Sol respectively. As with the CTE measurements, all three PMMA materials exhibit comparable behavior; higher degrees of swelling in DI water compared to that measured in the Ni plating solutions. Swelling data is summarized in Table IV below.
d Linearized over the measured temperature range

9
TABLE IV: Swelling Results for PMMA Linear Dimensional Change in 150 hr @ 28 °C (%) Material
DI Water Ni-Sulfamate Ni-Watts
KCPCQ 0.44 0.28 0.39
OP-1 0.40 0.29 0.37
Sol 0.39 0.28 0.37
Weight Change Measurements - DI Water Gravimetric measurements of the time dependence for water sorption were performed in order to obtain quantitative values for the kinetics of uptake and diffusion of water from the three different environments. Figure 12a shows the measured weight change for four different thicknesses of the KCPCQ coupons immersed in DI water at 28 °C. The plot shows the results for the duplicate specimens and it is clear that the reproducibility is quite good. Figure 12b shows the same data represented as the concentration (mg H20/g PMMA). In Figure 12b only one set of data for each specimen thickness is show for the sake of clarity. All data traces converge at approximately the same concentration value of ≈ 20.5 mg H2O/g PMMA.
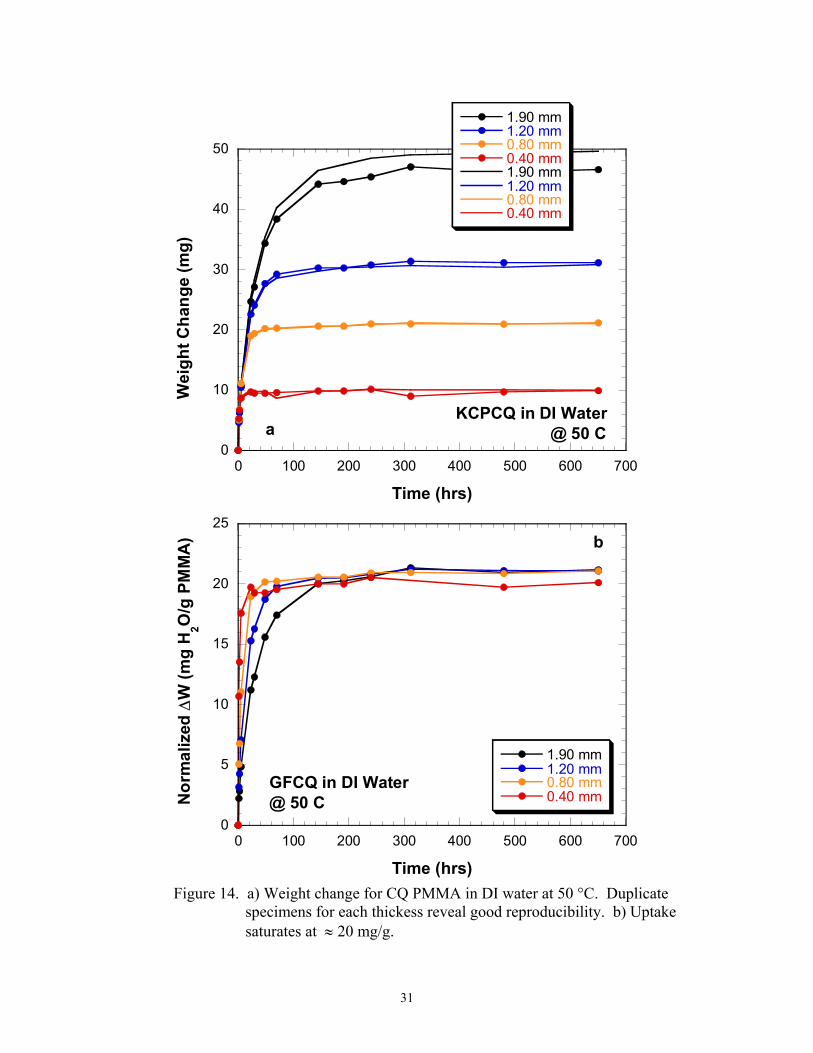
Figure 13a and b shows the measured weight change for the KCPCQ material at 4 °C plotted in the same fashion. The uptake kinetics are considerably slower at this low temperature (note the time axis) as evidenced by the fact that the thick, as-cast specimen has not yet approached saturation at the longest exposure time. Figure 14a and b show the data for the KCPCQ at 50 °C. While the rate of uptake is rapid, it is interesting to note from Figures 12b, 13b and 14b that the equilibrium concentration of water in the polymer does not appear to be temperature dependent over the range of temperature examined. At all three temperatures, the equilibrium concentration appears to be between about 20.5 and 21 mg H2O/g PMMA.
Figures 15-17 and 18-20 show the same data for the OP-1 and Sol PMMA’s respectively. The trends are the same as for the KCPCQ, namely, more rapid uptake at higher temperatures but little change in equilibrium concentration with increase in temperature. It can be noted that the specimens fly cut to the thinnest dimension appear to have somewhat lower equilibrium values. We believe that this is an artifact and results from the near surface offgassing of the dissolved water during the interval between the time the specimens are removed from the water baths, patted dried and weighed. Table V summarizes these results as well as those presented in the Appendix for the Ni-Sulfamate and the Ni-Watts baths.

10
TABLE V: Equilibrium Concentration of Solute Equilibrium Concentration (mg/g PMMA) Material Temperature
(°C) DI Water Ni-Sulfamate Ni-Watts
4 20.5 ≈ 16.4 ≈ 19.0
28 20.5 16.2 18.1 KCPCQ
50 21.2 16.1 18.7
4 21.6 16.9 19.7
28 21.2 16.5 19.1 OP-1
50 21.2 16.4 19.3
4 21.5 16.7 19.5
28 20.1 16.3 18.5 Sol
50 20.3 15.7 18.4
Beyond the absence of a temperature dependent equilibrium solubility, the most obvious finding that is apparent in Table V is the systematic difference in the solubility between the three different bath environments. This cause of this behavior may be related to the ionic strength of the various solutions and can be qualitatively rationalized. The ionic strength (concentration) of a complex solution is difficult to estimate but is related to its conductivity which is simple to measure. The conductivities of the two plating solutions are given in Table II (Ni-Sulfamate: 45 mS/cm and Ni-Watts: 39 mS/cm). By comparison the conductivity if the DI water used in this study was measured as 29 µS/cm, more than 103-fold lower than either plating solution. Thus, the ionic concentrations of the plating solutions are, not surprisingly, considerably higher than the water. With this increase in ionic concentration comes an increase in the ion-water electrostatic attraction. That is, a fraction of the water is electrostatically bound to the ionic species in the electrolyte and is no longer free to diffuse into the polymer. This increase in the “bound” water molecules as a direct function of ionic strength has been observed in ionic surfactants. (15) For the purposes of calculating solute diffusivity in the PMMA materials, we recast the data as shown in Figure 21 for the KCPCQ PMMA exposed to DI water at 28 °C. Here the relative fraction of solute sorption into the polymer, Mt/Mf, is plotted vs. exposure time. Over the elapse time of the test, all thickness of specimens save for the as-cast thickness, have achieved their equilibrium values. Based on the data trend shown in Figure 12a, Mf for the as-cast material is estimated by extrapolation as 43.5 mg. If water uptake into the polymer is a simple Fickian process, controlled by a constant diffusivity, then the expression that governs the degree of uptake at any given time for a plane sheet is given by (16):

11
∑∞
=
π+−
+−=
0n2
22
f
t t1)D(2mexp1)(2m
181M M
l (3)
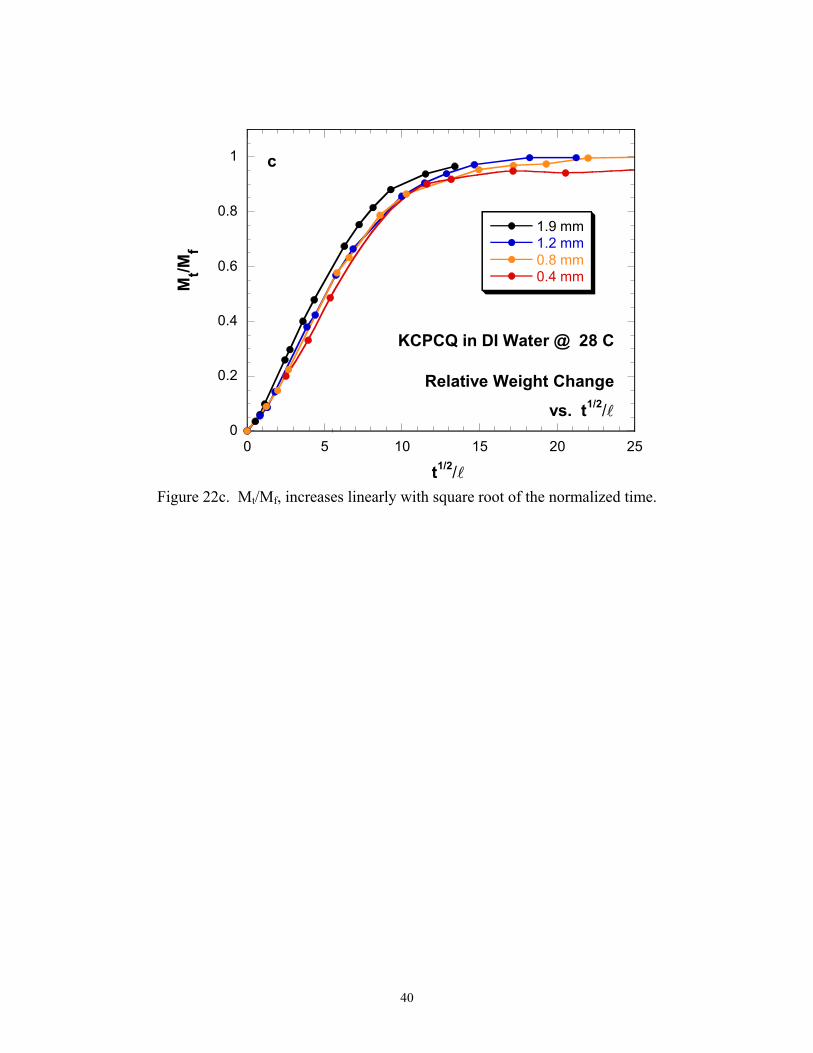
where: Mt = total amount of solute absorbed at time t Mf = equilibrium sorption D = the diffusivity under the exposure conditions, and l = the thickness of the sheet Equation 3 additionally assumes that the planar dimensions of the specimen are large compared to its thickness (that is diffusion is a one-dimensional process), that surfaces of the specimen quickly achieve their equilibrium concentration and that the sheet does not change dimensions with exposure. In this latter instance, although the specimens do swell as documented above, for the purposes of Equation (3), the degree of dimensional change is sufficiently small as to be ignored. If Equation (3) governs solute diffusion into the PMMA then all of the data shown in Figure 21 should overlay on a plot of Mf vs. t/ l 2, where the exposure time is normalized to the thickness of each specimen. Figure 22a and b shows that this is indeed the case for two examples – KCPCQ in DI water at 28 °C and KCPCQ in Ni-Sulfamate at 4 °C. Further, if the driving force for diffusion is simply controlled by the gradient in solute concentration and if D and the specimen thickness remains constant, plotting the relative uptake vs. t1/2/ l should yield as straight line for times that are short relative to the saturation timee. This behavior is clearly seen in Figure 22c. Through a relative concentration of as high as 0.7, the rate of solute uptake is clearly linear with the square root of the normalized time. The data in Figure 22a and b can then be used to calculate the diffusivity, D in the following fashion. From Equation 3, the value of t/ l 2 for which Mt/Mf = 0.5 (designated as (t/ l 2)1/2) can be written as:
( )
π−
ππ
−=922
21/22
1691
16ln
D1/t l (4)
with an error of less than 0.001%.(5) Solving for D gives the simple expression:
( )1/2/t
0.049D 2l= (5)
We use Equation 5 to calculated D for each of the materials at all three temperatures and for each specimen thickness. Tables VIa-c shows the values of D derived in this manner. for all thicknesses of the three materials the different exposure temperatures. Since D should be independent of thickness, the table then shows the average value (across all e Note that the swelling characterized earlier, is insignificant with respect to the calculation of D

12
thicknesses) of the diffusivity for each material at each temperature. Because the uptake in the thinnest specimens was so rapid, determining the time, t, at which Mt/Mf = 0.5 was difficult and so data from those specimens were excluded from these calculations. The average values of D presented in Tables VIa-c agree well with data in the literature where near room temperature diffusivities varying between 3 and 9 x 10⁻⁹ cm2/sec have been reported.(1,4,5,6,17,18)
TABLE VIa: Solute Diffusivity for KCPCQ PMMA DI Water Ni-Sulfamate Ni-Watts Temp
(C) Thickness
(mm) D (cm2/sec)
Avg. D (cm2/sec)
D (cm2/sec)
Avg. D (cm2/sec)
D (cm2/sec)
Avg. D (cm2/sec)
0.8 1.07 x10⁻⁹ 1.25 x10⁻⁹ 1.12 x10⁻⁹
1.2 1.46 x10⁻⁹ 1.31 x10⁻⁹ 1.18 x10⁻⁹ 4
AC* 9.8 x10-10
1.17 x10⁻⁹
1.30 x10⁻⁹
1.27 x10⁻⁹
8.38 x10⁻¹⁰
1.04 x10⁻⁹
0.8 4.90 x10⁻⁹ 6.88 x10⁻⁹ 4.45 x10⁻⁹
1.2 5.51 x10⁻⁹ 6.78 x10⁻⁹ 5.59 x10⁻⁹ 28
AC 4.83 x10⁻⁹
5.08 x10⁻⁹
7.03 x10⁻⁹
6.89 x10⁻⁹
4.67 x10⁻⁹
4.90 x10⁻⁹
0.8 1.96 x10⁻⁸ 2.42 x10⁻⁸ 1.74 x10⁻⁸
1.2 1.60 x10⁻⁸ 2.09 x10⁻⁸ 1.61 x10⁻⁸ 50 AC 1.55 x10⁻⁸
1.70 x10⁻⁸
1.81 x10⁻⁸
2.11 x10⁻⁸
1.38 x10⁻⁸
1.58 x10⁻⁸
*As-cast TABLE VIb: Solute Diffusivity for OP-1 PMMA
DI Water Ni-Sulfamate Ni- Watts Temp (C)
Thickness (mm) D
(cm2/sec) Avg. D
(cm2/sec)D
(cm2/sec) Avg. D
(cm2/sec)D
(cm2/sec) Avg. D
(cm2/sec)
0.8 1.09 x10⁻⁹ 1.31 x10⁻⁹ 1.07 x10⁻⁹
1.2 1.10 x10⁻⁹ 1.23 x10⁻⁹ 1.24 x10⁻⁹ 4
AC 1.46 x10⁻⁹
1.21 x10⁻⁹
1.52 x10⁻⁹ 1.35 x10⁻⁹
1.45 x10⁻⁹
1.26 x10⁻⁹
0.8 4.61 x10⁻⁹ 5.31 x10⁻⁹ 4.82 x10⁻⁹
1.2 5.59 x10⁻⁹ 6.20 x10⁻⁹ 5.58 x10⁻⁹ 28
AC 6.56 x10⁻⁹
5.59 x10⁻⁹
7.09 x10⁻⁹ 6.20 x 10⁻⁹
6.47 x10⁻⁹
5.63 x10⁻⁹
0.8 1.14 x10⁻⁸ 1.67 x10⁻⁸ 1.36 x10⁻⁸
1.2 1.55 x10⁻⁸ 1.98 x10⁻⁸ 1.62 x10⁻⁸ 50 AC 1.86 x10⁻⁸
1.52 x10⁻⁸
2.30 x10⁻⁸
1.98 x10⁻⁸
2.00 x10⁻⁸
1.66 x10⁻⁸

13
TABLE VIc: Solute Diffusivity for Sol PMMA
DI Water Ni-Sulfamate Ni- Watts Temp (C)
Thickness (mm) D
(cm2/sec) Avg. D
(cm2/sec) D
(cm2/sec) Avg. D
(cm2/sec) D
(cm2/sec) Avg. D
(cm2/sec)
0.8 1.23 x10⁻⁹ 1.49 x10⁻⁹ 1.27 x10⁻⁹
1.2 1.21 x10⁻⁹ 1.23 x10⁻⁹ 1.19 x10⁻⁹ 4
AC 1.48 x10⁻⁹
1.31 x10⁻⁹
1.53 x10⁻⁹ 1.42 x10⁻⁹
1.42 x10⁻⁹
1.29 x10⁻⁹
0.8 4.82 x10⁻⁹ 5.87 x10⁻⁹ 4.99 x10⁻⁹
1.2 5.84 x10⁻⁹ 6.17 x10⁻⁹ 5.76 x10⁻⁹ 28
AC 7.14 x10⁻⁹
5.93 x10⁻⁹
7.82 x10⁻⁹ 6.62 x10⁻⁹
6.50 x10⁻⁹
5.75 x10⁻⁹
0.8 1.36x10⁻⁸ 1.75 x10⁻⁸ 1.87 x10⁻⁸
1.2 1.58 x10⁻⁸ 1.89 x10⁻⁸ 1.64 x10⁻⁸ 50 AC 2.03 x10⁻⁸
1.66 x10⁻⁸
2.25 x10⁻⁸
1.96 x10⁻⁸
1.99 x10⁻⁸
1.83 x10⁻⁸
The diffusivity of solute diffusion in the PMMA materials can be expressed as:
)RTQexp(DD D
o −= (6)
and:
T1
RQ
DlnDln Do
−= (7)
We can therefore determine the activation energy, QD, for solute diffusion in the PMMA from the average values of D at the different temperatures in Tables VIa-c. Figures 23-25 show the data in these tables plotted as lnD vs. 1/T. The slope of this data is -QD/R, where R is the gas constant and has a value of 8.31 J/mole. Table VII summarizes the values of QD derived from these figures. With the data in hand, it is a simple matter to determine Do and those values are reported in Table VII as well.

14
TABLE VII: Diffusion Coefficient and Activation Energy for Solute Diffusion in PMMA
DI water Ni-Sulfamate Ni- Watts Material Do
(cm2/sec) QD
(J/mole) Do
(cm2/sec)QD
(J/mole) Do
(cm2/sec) QD
(J/mole) KCPCQ 0.171 4.33 x10⁴ 0.470 4.56 x 10⁴ 0.191 4.38 x10⁴
OP-1 0.073 4.11 x 10⁴ 0.218 4.35 x 10⁴ 0.098 4.18 x 10⁴
Sol 0.077 4.11 x 10⁴ 0.129 4.21 x 10⁴ 0.161 4.29 x 10⁴
It is clear that Do and QD for solute diffusion in all materials for the three environments is very nearly the same, suggesting that the solute specie responsible for the measured weight change is the same for all three environments. As it is the common constituent among all three aqueous media, it is logical to conclude that water alone is the solute that is controlling weight change and swelling. However, as a final check, a section of the KCPCQ specimen immersed in the Ni-Sulfamate bath at 50 °C for 500 hours (see Appendix Figure A3) was quantitatively characterized for metal ion concentration. ICP-mass spectroscopy (Galbratih Laboratories, Inc., Knoxville, TN) revealed that the Ni concentration of the specimen was 4.2 wt. ppm. This compares to < 0.5 wt. ppm Ni concentration for an unexposed control specimen. Since Figure A3b indicates that the equilibrium solute concentration in the sulfamate-exposed specimen was ≈ 15 mg/g PMMA, the Ni uptake into the PMMA accounts for less than 0.03 % of the net weight change.
IV. Conclusion
The CTE of PMMA’s of interest to LIGA fabrication agree with literature values for similar materials. The measured CTE’s appeared to be independent of molecular weight. Swelling, measured as the change in linear dimension was similar between all three materials but was dependent on bath composition. Swelling was generally greatest for specimens immersed in DI water. Immersion in Ni-Sulfamate resulted in the least amount of swelling, about 25% less than that resulting from exposure to DI water. The kinetics and magnitude of solute uptake were examined between 4 °C and 50 °C via gravimetric measurements. The diffusion coefficient was constant with respect to specimen thickness and time suggesting that solute uptake was a simple Fickian process. Do and QD were essentially the same for all materials and in all environments further suggesting that water alone is the solute being absorbed.

15
V. Acknowledgements
The authors wish to acknowledge the support of R. Steinhoff and colleagues (Honeywell Federal Manufacturing and Technology) for supplying some of the test material as well as for performing the molecular weight/number measurements and Dorrance McLean (8729) for sample preparation. Discussions with LeRoy Whinnery, Paul Dentinger and especially Blake Simmons (all 8722) were most helpful and are gratefully acknowledged.

16
VI. References
1. Tong, H.M., Saenger, A.J., J. Appl. Polym. Sci., 38, 937 (1989) 2. Thomas, A. M., J. Appl. Chem., 1,141, (1951) 3. Kovacs, A., J. Chim. Phys., 45, 258, (1948), 4. Braden, M., J. Prosthet. Dent.14, 307 (1964). 5. Bueche, F., J. Polym. Sci., 14, 675 (1976) 6. Roussis, P. R., J. Membr. Sci, 15, 141, (1983) 7. Turner, D.T., Polymer, 1982, 23, 197 8. Durning, C., and Tabor, M., Macromolecules, 19, 2220, (1986) 9. Berens, A. R., and Hopfenberg, h. B., J. Polym Sci., Polym Phys., Ed., 17, 1757,
(1979), 10. Chen, C. C., Shen, J., and Sauer, J. A., Polymer, 26, 89, (1985) 11. Präzisions Glas & Optik GmbH, Hegestück 11 • D-58640 Iserlohn, Germany,
Product Information Catalog, page 29. Sept 2002 12. Rohm Performance Plastics, Rohm GmbH & Co. KG, 2002) 13. ATOFINA Chemicals, Inc. ADV980735/APL:ATG-186/web/07-00 ©2000 14. Handbook of Plastics and Elastomers, C.A. Harper, McGraw-Hill, New York,
(1975) 15. Stathatos, E., Lianos, P., Del Monte, F., Levy, D., and Tsiourvas, D., Langmuir,
13, 4295, (1997) 16. Crank J. The Mathematics of Diffusion, 2nd Ed., Oxford University Press,
London, 1975 17. Turner, D.T., Polymer, 1987, 28, 293 18. Goodelle, J. P., Pearson, R. A. and Santore, M. M., J. Appl. Polym. Sci. , 86, 2463
(2002)

17
VII. Figures

18
Figure 1. Schematic representation of the LIGA process. Dimensional stability of the polymer photoresist is critical to final part tolerances.
Expose PMMA Develop Electroplate
Dissolution/Part release

19
Figure 2. Sidewall taper in high aspect ratio feature results from combined effects of moisture induced swelling and thermal
expansion of the PMMA molding material.
20 µm

20
Figure 3. Schematic illustration of measurement system used for CTE and swelling experiments.
Heat source
PMMA
ThermocoupleTransmitter Receiver

21
Figure 4. Correction scheme for CTE measurements by which the thermal expansion of the stainless steel flags are accounted for.
( ) Chx flagPMMAo∆×α−α=∆
h
x
flagPMMA Ch/x α+∆∆=α o

22
0.0000
0.0005
0.0010
0.0015
0.0020
20 25 30 35 40 45 50 55
Expa
nsio
n, ∆
x/h
(mm
/mm
)
Temp (C)
Coefficient of Thermal ExpansionforKCPCQ
(heating)
CTE = 7.4 x 10⁻⁵ oC-1
a
Figure 5a. CTE for KCPCQ PMMA (heating). Value shown is the average over the temperature range examined corrected for αflag.
0.0000
0.0005
0.0010
0.0015
0.0020
20 25 30 35 40 45 50 55
Expa
nsio
n (m
m/m
m)
Temp (C)
Coefficient of Thermal ExpansionforKCPCQ
(cooling)
CTE =7.6 x 10⁻⁵ oC-1
b
Figure 5b. CTE for KCPCQ PMMA (cooling). Value shown is the average over the temperature range examined.

23
0.0000
0.0005
0.0010
0.0015
0.0020
20 25 30 35 40 45 50 55
HeatingCooling
Expa
nsio
n (m
m/m
m)
Temp (C)
Coefficient of Thermal ExpansionKCPCQ
c
Figure 5c. Heating and cooling curves overlay when specimen is protected from the water bath.

24
0.0000
0.0005
0.0010
0.0015
0.0020
0.0025
20 25 30 35 40 45 50 55
Expa
nsio
n (m
m/m
m)
Temp (C)
Thermal Expansion of PMMASpecimen Exposed to Water Bath
heating ramp
cooling ramp
Figure 6. Water absoption during CTE measurement results in net dimensional change upon cooling. This yields incorrect values for the CTE of the material. Sheathing the specimen in a permeation barrier eliminates this problem as shown in the previous Figure.

25
-0.0005
0.0000
0.0005
0.0010
0.0015
0.0020
25 30 35 40 45 50 55
Coefficient of Thermal ExpansionforOP-1
(heating)
Expa
nsio
n (m
m/m
m)
Temp (C)
CTE = 7.5 x 10⁻⁵ oC-1
a
Figure 7a. CTE for OP-1 PMMA (heating). Value shown is the average over the temperature range examined.
0.0000
0.0005
0.0010
0.0015
0.0020
25 30 35 40 45 50 55
Coefficient of Thermal ExpansionforOP-1
(cooling)
Expa
nsio
n (m
m/m
m)
Temp (C)
CTE = 7.3 x 10⁻⁵ oC-1 b
Figure 7b. CTE for OP-1 PMMA (cooling). Value shown is the average over the
temperature range examined.

26
0.0000
0.0005
0.0010
0.0015
0.0020
20 25 30 35 40 45 50 55
Coefficient of Thermal ExpansionforSol
(heating)
Expa
nsio
n (m
m/m
m)
Temp (C)
CTE = 7.5 x 10⁻⁵ oC-1
a
Figure 8a. CTE for SOL PMMA (heating). Value shown is the average over the temperature range examined.
0.0000
0.0005
0.0010
0.0015
0.0020
20 25 30 35 40 45 50 55
Coefficient of Thermal ExpansionforSol
(cooling)
Expa
nsio
n (m
m/m
m)
Temp (C)
CTE = 7.5 x 10⁻⁵ oC-1
b
Figure 8b. CTE for SOL PMMA (cooling). Value shown is the average over the
temperature range examined.

27
0.000
0.001
0.002
0.003
0.004
0.005
0 50 100 150 200
Swelling in Plating Bath Environments
KCPCQ @ 28 oC
DI WaterNi-SulfamateNi-Watts
Line
ar S
wel
ling
(mm
/mm
)
Time (hrs)
Figure 9. Linear swelling response of KCPCQ PMMA in DI water, Ni-Sulfamate
and Ni-Watts baths.
0.000
0.001
0.002
0.003
0.004
0.005
0 50 100 150 200
Swelling in Plating Bath Environments
OP-1 @ 28 oC
DI-WaterNi-SulfamateNi-Watts
Line
ar S
wel
ling
(mm
/mm
)
Time (hrs)
Figure 10. Linear swelling response of OP-1 PMMA in DI water, Ni-Sulfamate and Ni-Watts baths.

28
0.000
0.001
0.002
0.003
0.004
0.005
0 50 100 150 200
Swelling in Plating Bath Environments
Sol @ 28 oC
DI WaterNi-SulfamateNi-Watts
Line
ar S
wel
ling
(mm
/mm
)
Time (hrs)
Figure 11. Linear swelling response of Sol PMMA in DI water, Ni-Sulfamate and Ni-Watts baths.

29
0
10
20
30
40
50
0 100 200 300 400 500 600 700
KCPCQ in DI Water@ 28 C
1.90 mm1.20 mm0.80 mm0.40 mm1.90 mm1.20 mm0.80 mm0.40 mm
Wei
ght C
hang
e (m
g)
Time (hrs)
a
0
5
10
15
20
25
0 100 200 300 400 500 600 700
KCPCQ in DI Water@ 28 C
1.90 mm1.20 mm0.80 mm0.40 mmN
orm
aliz
ed ∆
W (m
g H
2O/g
PM
MA
)
Time (hrs)
b
Figure12. a) Weight change for KCPCQ PMMA in DI water at 28 °C. Duplicate
specimens for each thickess reveal good reproducibility. b) Uptake saturates at ≈ 20 mg/g.

30
0
10
20
30
40
50
0 500 1000 1500 2000
KCPCQ in DI Water@ 4 C
1.90 mm1.20 mm0.80 mm0.40 mm
Wei
ght C
hang
e (m
g)
Time (hrs)
a
0
5
10
15
20
25
0 500 1000 1500 2000
KCPCQ in DI Water@ 4 C
1.90 mm1.20 mm0.80 mm0.40 mm
Nor
mal
ized
∆W
(mg
H2O
/g P
MM
A)
Time (hrs)
b
Figure 13. a) Weight change for KCPCQ PMMA in DI water at 4 °C. b) Uptake
saturates at ≈ 20 mg/g. 1.9 mm thick specimens have not yet saturated.
31
0
10
20
30
40
50
0 100 200 300 400 500 600 700
KCPCQ in DI Water@ 50 C
1.90 mm1.20 mm0.80 mm0.40 mm1.90 mm1.20 mm0.80 mm0.40 mm
Wei
ght C
hang
e (m
g)
Time (hrs)
a
0
5
10
15
20
25
0 100 200 300 400 500 600 700
GFCQ in DI Water@ 50 C
1.90 mm1.20 mm0.80 mm0.40 mmN
orm
aliz
ed ∆
W (m
g H
2O/g
PM
MA
)
Time (hrs)
b
Figure 14. a) Weight change for CQ PMMA in DI water at 50 °C. Duplicate
specimens for each thickess reveal good reproducibility. b) Uptake saturates at ≈ 20 mg/g.

32
0
5
10
15
20
25
30
35
40
0 50 100 150 200 250 300 350
OP-1 in DI Water@ 28 C
1.55 mm1.20 mm0.80 mm0.40 mm1.55 mm1.20 mm0.80 mm0.40 mm
Wei
ght C
hang
e (m
g)
Time (hrs)
a
0
5
10
15
20
25
0 50 100 150 200 250 300 350
OP-1 in DI Water@ 28 C
1.55 mm1.20 mm0.80 mm0.40 mmN
orm
aliz
ed ∆
W (
mg
H20)
/g P
MM
A)
Time (hrs)
b
Figure 15. a) Weight change for OP-1 PMMA in DI water at 28 °C, b) Uptake
saturates at ≈ 20 mg/g.

33
0
10
20
30
40
50
0 500 1000 1500 2000 2500
OP-1 in DI Water@ 4 C
1.55 mm1.20 mm0.80 mm0.40 mm1.55 mm1.20 mm0.80 mm0.40 mm
Wei
ght C
hang
e (m
g)
Time (hrs)
a
0
5
10
15
20
25
0 500 1000 1500 2000 2500
OP-1 in DI Water@ 4 C
1.55 mm1.20 mm0.80 mm0.40 mm
Nor
mal
ized
∆W
(mg
H2O
/g P
MM
A)
Time (hrs)
b
Figure 16. a) Weight change for OP-1 PMMA in DI water at 4 °C. Duplicate
specimens for each thickess reveal good reproducibility. b) Uptake saturates at ≈ 22 mg/g.

34
0
10
20
30
40
50
0 50 100 150 200 250 300 350
OP-1 in DI Water@ 50 C
1.55 mm1.20 mm0.80 mm0.40 mm1.55 mm1.20 mm0.80 mm0.40 mm
Wei
ght C
hang
e (m
g)
Time (hrs)
a
0
5
10
15
20
25
0 50 100 150 200 250 300 350
OP-1 in DI Water@ 50 C
1.55 mm1.20 mm0.80 mm0.40 mmN
orm
aliz
ed ∆
W (
mg
H20)
/g P
MM
A)
Time (hrs)
b
Figure 17. a) Weight change for OP-1 PMMA in DI water at 50 °C, b) Uptake
saturates at ≈ 21 mg/g.

35
0
5
10
15
20
25
30
35
40
0 50 100 150 200 250 300 350
Sol in Di Water@ 28 C
1.55 mm1.20 mm0.80 mm0.40 mm1.55 mm1.20 mm0.80 mm0.40 mm
Wei
ght C
hang
e (m
g)
Time (hr)
a
0
5
10
15
20
25
0 50 100 150 200 250 300 350
Sol in DI Water @ 28 C
1.55 mm1.20 mm0.80 mm0.40 mmN
orm
aliz
ed ∆
W (
mg
H20)
/g P
MM
A)
Time (hr)
b
Figure 18. a) Weight change for Sol PMMA in DI water at 28 °C. b) Uptake
saturates at ≈ 20 mg/g.

36
0
10
20
30
40
50
0 500 1000 1500 2000 2500
Sol in DI Water@ 4 C
1.55 mm1.20 mm0.80 mm0.40 mm1.55 mm1.20 mm0.80 mm0.40 mm
Wei
ght C
hang
e (m
g)
Time (hrs)
a
0
5
10
15
20
25
0 500 1000 1500 2000 2500
Sol in DI Water@ 4 C
1.55 mm1.20 mm0.80 mm0.40 mm
Nor
mal
ized
∆W
(mg
H2O
/g P
MM
A)
Time (hrs)
b
Figure 19. a) Weight change for Sol PMMA in DI water at 4°C, b) Uptake saturates at ≈ 22 mg/g.

37
0
5
10
15
20
25
30
35
40
0 50 100 150 200 250 300 350
Sol in DI Water@ 50 C
1.55 mm1.20 mm0.80 mm0.40 mm1.55 mm1.20 mm0.80 mm0.40 mm
Wei
ght C
hang
e (m
g)
Time (hrs)
a
0
5
10
15
20
25
0 50 100 150 200 250 300 350
Sol in DI Water@ 50 C
1.55 mm1.2 mm0.80 mm0.40 mm
Nor
mal
ized
∆W
(m
g H
20)/g
PM
MA
)
Time (hrs)
b
Figure 20. a) Weight change for Sol PMMA in DI water at 28 °C. b) Uptake
saturates at ≈ 20 mg/g.

38
0
0.2
0.4
0.6
0.8
1
0 100 200 300 400 500 600 700
KCPCQ in DI Water @ 28 C
Relative Weight Changevs.
Time
1.9 mm1.2 mm0.8 mm0.4 mm
Mt/M
f
Time (hrs)
Figure 21. Relative concentration of solute in KCPCQ PMMA. All data trend towards the saturation value, Mt/Mf = 1.0
.

39
0
0.2
0.4
0.6
0.8
1
0 100 200 300 400 500
KCPCQ in DI Water @ 28 C
Relative Weight Changevs.
Normalized Time
1.9 mm1.2 mm0.8 mm0.4 mmM
t/Mf
t/l2
a
0
0.2
0.4
0.6
0.8
1
0 200 400 600 800 1000
KCPCQ in Ni Sulfamate @ 4 C
Relative Weight Changevs.
Normalized Time
1.90 mm1.20 mm0.80 mm0.40 mmM
t/Mf
t/l2
b
Figure 22. a) Data traces from Figure 21 overlay when Mt/Mf is plotted against
the normalized time. b) Similar superposition is observed for Ni-Sulfamate exposed PMMA as it is for all weight change data. In both cases, diffusivity for solute diffusion can be calculated from the value of t/l 2 at Mt/Mf = 0.5 as shown above.
40
0
0.2
0.4
0.6
0.8
1
0 5 10 15 20 25
KCPCQ in DI Water @ 28 C
Relative Weight Change
vs. t1/2/l
1.9 mm1.2 mm0.8 mm0.4 mmM
t/Mf
t1/2/l
c
Figure 22c. Mt/Mf, increases linearly with square root of the normalized time.

41
-21.0
-20.0
-19.0
-18.0
0.003 0.0032 0.0034 0.0036
Activation Energy for Solute DiffusionKCPCQ-All media
Di WaterNi-SulfNi-Watts
ln D
1/Temp (K-1)
QDI Water
= 4.33 x 10⁴ J/mol
QNi-Sulf
= 4.56 x 10⁴ J/mol
QNi-Watts
= 4.38 x 10⁴ J/mol
slope = -QD/R
Figure 23. Activation energy for solute diffusion in KCPCQ is found as the slope of the data above.
-21.0
-20.0
-19.0
-18.0
0.003 0.0032 0.0034 0.0036
Activation Energy for Solute DiffusionOP-1-All media
DI WaterNi- SulfNi-Watts
ln D
1/Temp (K-1)
QDI Water
= 4.11 x 10⁴ J/mol
QNi-Sulf
= 4.35 x 10⁴ J/mol
QNi-Watts
= 4.18 x 10⁴ J/mol
Figure 24. Activation energy for solute diffusion in OP-1.

42
-21.0
-20.0
-19.0
-18.0
0.003 0.0032 0.0034 0.0036
Activation Energy for Solute DiffusionSol-All media
DI WaterNi-SulfNi-Watts
ln D
1/Temp (K-1)
QDI Water
= 4.11 x 10⁴ J/mol
QNi-Sulf
= 4.21 x 10⁴ J/mol
QNi-Watts
= 4.29 x 10⁴ J/mol
Figure 25. Activation energy for solute diffusion in Sol.

43
VIII. Appendix

44
0
5
10
15
20
25
30
35
40
0 500 1000 1500 2000
KCPCQ in Ni Sulfamate @ 4C
1.90 mm1.20 mm0.80 mm0.40 mm
Wei
ght C
hang
e (m
g)
Time (hrs)
a
0
5
10
15
20
0 500 1000 1500 2000
KCPCQ in Ni Sulfamate @ 4 C
1.90 mm1.20 mm0.80 mm0.40 mm
Nor
mal
ized
∆W
(mg
solu
te/g
PM
MA
)
Time (hrs)
b
Figure A1.
0
10
20
30
40
0 100 200 300 400 500 600 700 800
KCPCQ in Ni Sulfamate@ 28 C
0.40 mm0.80 mm1.20 mm1.90 mm0.40 mm0.80 mm1.20 mm1.90 mm
Wei
ght C
hang
e (m
g)
Time (hrs)
a
0
5
10
15
20
0 100 200 300 400 500 600 700
KCPCQ in Ni Sulfamate@ 28 C
1.90 mm1.20 mm0.80 mm0.40 mm
Nor
mal
ized
∆W
(mg
solu
te/g
PM
MA
)
Time (hrs)
b
Figure A2.

45
0
10
20
30
40
0 100 200 300 400 500 600 700
KCPCQ in Ni Sulfamate@ 50 C
0.40 mm0.80 mm1.20 mm1.90 mm0.40 mm0.80 mm1.20 mm1.90 mm
Wei
ght C
hang
e (m
g)
Time (hrs)
a
0
5
10
15
20
0 100 200 300 400 500
KCPCQ in Ni Sulfamate@ 50 C
1.90 mm1.20 mm0.80 mm0.40 mm
Nor
mal
ized
∆W
(mg
solu
te/g
PM
MA
)
Time (hrs)
b
Figure A3.
0
5
10
15
20
25
30
35
40
0 500 1000 1500 2000
KCPCQ in Ni Watts@ 4C
1.90 mm1.20 mm0.80 mm0.40 mm
Wei
ght C
hang
e (m
g)
Time (hrs)
a
0
5
10
15
20
0 500 1000 1500 2000
KCPCQ in Ni Watts@ 4C
1.90 mm1.20 mm0.80 mm0.40 mm
Nor
mliz
ed ∆
W (m
g so
lute
/g P
MM
A)
Time(hrs)
b
Figure A4.

46
0
10
20
30
40
50
0 100 200 300 400 500 600
KCPCQ in Ni Watts@ 28 C
1.90 mm1.20 mm0.80 mm0.40 mm
Wei
ght C
hang
e (m
g)
Time (hrs)
a
0
5
10
15
20
0 100 200 300 400 500 600
KCPCQ in Ni Watts@ 28 C
1.90 mm1.20 mm0.80 mm0.40 mm
Nor
mal
ized
∆W
(mg
solu
te/g
PM
MA
)
Time (hrs)
b
Figure A5.
0
10
20
30
40
50
0 50 100 150 200 250 300 350
KCPCQ in Ni Watts @ 50C
1.9 mm1.2 mm0.8 mm0.4 mm
Wei
ght C
hang
e (m
g)
Time (hrs)
a
0
5
10
15
20
0 50 100 150 200 250 300 350
KCPCQ in Ni Watts @ 50C
1.90 mm1.2 mm0.8 mm0.4 mm
Nor
mal
ized
∆W
(mg
solu
te/g
PM
MA
)
Time (hrs)
bb
Figure A6.

47
0
5
10
15
20
25
30
35
0 500 1000 1500 2000
OP-1 in Ni Sulfamate@ 4 C
1.55 mm1.20 mm0.80 mm0.40 mm
Wei
ght C
hang
e (m
g)
Time (hrs)
a
0
5
10
15
20
0 500 1000 1500 2000
OP-1 in Ni Sulfamate@ 4 C
1.55 mm1.20 mm0.80 mm0.40 mm
Nor
mal
ized
∆W
(mg
solu
te/g
PM
MA
)
Time (hrs)
b
Figure A7.
0
5
10
15
20
25
30
35
0 100 200 300 400 500
OP-1 in Ni-Sulfamate@ 28 C
1.55 mm1.20 mm0.80 mm0.40 mmW
eigh
t Cha
nge
(mg)
Time (hrs)
a
0
5
10
15
20
25
0 100 200 300 400 500
OP-1 in Ni-Sulfamate@ 28 C
1.55 mm1.20 mm0.80 mm0.40 mm
Nor
mal
ized
∆W
(m
g so
lute
)/g P
MM
A)
Time (hrs)
b
Figure A8.

48
0
5
10
15
20
25
30
35
0 100 200 300 400 500
OP-1 in Ni-Sulfamate@ 50 C
1.55 mm1.20 mm0.80 mm0.40 mm
Wei
ght C
hang
e (m
g)
Time (hrs)
a
0
5
10
15
20
25
0 100 200 300 400 500
OP-1 in Ni-Sulfamate@ 50 C
1.55 mm1.20 mm0.80 mm0.40 mmN
orm
aliz
ed ∆
W (
mg
solu
te/g
PM
MA
)
Time (hrs)
b
Figure A9.
0
5
10
15
20
25
30
35
40
0 500 1000 1500 2000
OP-1 in Ni Watts@ 4C
1.55 mm1.20 mm0.80 mm0.40 mm
Wei
ght C
hang
e(m
g)
Time (hrs)
a
0
5
10
15
20
25
0 500 1000 1500 2000
OP-1 in Ni Watts@ 4C
1.55 mm1.20 mm0.80 mm0.40 mmN
orm
aliz
ed ∆
W (m
g so
lute
/g P
MM
A)
Time (hrs)
b
Figure A10.

49
0
5
10
15
20
25
30
35
40
0 100 200 300 400 500 600
OP-1 in Ni Watts@ 28 C
1.55 mm1.20 mm0.80 mm0.40 mmW
eigh
t Cha
nge
(mg)
Time (hrs)
a
0
5
10
15
20
0 100 200 300 400 500 600
OP-1 in Ni Watts@ 28 C
1.55 mm1.20 mm0.80 mm0.40 mm
Nor
mal
ized
∆W
(mg
solu
te/g
PM
MA
)
Time (hrs)
b
Figure A11.
0
5
10
15
20
25
30
35
40
0 50 100 150 200 250 300 350 400
OP-1 in Ni Watts @ 50C
1.55 mm1.20 mm0.80 mm0.40 mm
Wei
ght C
hang
e (m
g)
Time (hrs)
a
0
5
10
15
20
0 50 100 150 200 250 300 350 400
OP-1 in Ni Watts @ 50C
1.55 mm1.20 mm0.80 mm0.40 mm
Nor
mal
ized
∆W
(mg
solu
te/g
PM
MA
)
Time (hrs)
b
Figure A12.

50
0
5
10
15
20
25
30
35
0 500 1000 1500 2000
Sol in Ni Sulfamate@ 4C
1.55 mm1.20 mm0.80 mm0.40 mm
Wei
ght C
hang
e (m
g)
Time (hrs)
a
0
5
10
15
20
0 500 1000 1500 2000
Sol in Ni Sulfamate@ 4C
1.55 mm1.20 mm0.80 mm0.40 mmN
orm
aliz
ed ∆
W (m
g so
lute
/g P
MM
A)
Time (hrs)
b
Figure A13.
0
5
10
15
20
25
30
35
0 100 200 300 400 500
Solacryle in Ni Sulfamate28 C
1.55 mm1.20 mm0.80 mm0.40 mm
Wei
ght C
hang
e ( m
g)
Time (hrs)
a
0
5
10
15
20
25
0 100 200 300 400 500
Sol in Ni Sulfamate @ 28 C
1.55 mm1.20 mm0.80 mm0.40 mm
Nor
mal
ized
∆W
(m
g so
lute
)/g P
MM
A)
Time (hr)
b
Figure A14.

51
0
5
10
15
20
25
30
35
0 100 200 300 400 500
Sol in Ni Sulfamate@ 50 C
1.55 mm1.20 mm0.80 mm0.40 mm
Wei
ght C
hang
e (m
g)
Time (hrs)
a
0
5
10
15
20
25
0 100 200 300 400 500
Solacryl in Ni Sulfamate@ 50 C
1.55 mm1.20 mm0.80 mm0.40 mm
Nor
mal
ized
∆W
(m
g so
lute
)/g P
MM
A)
Time (hrs)
b
Figure A15.
0
5
10
15
20
25
30
35
40
0 500 1000 1500 2000
Sol in Ni Watts@ 4C
1.55 mm1.20 mm0.80 mm0.40 mm
Wei
ght C
hang
e (m
g)
Time (hrs)
a
0
5
10
15
20
0 500 1000 1500 2000
Sol in Ni Watts@ 4C
1.55 mm1.20 mm0.80 mm0.40 mm
Nor
mal
ized
∆W
(mg
solu
te/g
PM
MA
)
Time (hrs)
b
Figure A16.

52
0
5
10
15
20
25
30
35
40
0 100 200 300 400 500 600
Sol in Ni Watts@ 28C
1.55 mm1.20 mm0.80 mm0.40 mmW
eigh
t Cha
nge
(mg)
Time (hrs)
a
0
5
10
15
20
0 100 200 300 400 500 600
Sol in Ni Watts@ 28 C
1.55 mm1.20 mm0.40 mm0.80 mm
Nor
mal
ized
∆W
(mg
solu
te/g
PM
MA
)
Time (hrs)
b
Figure A17.
0
5
10
15
20
25
30
35
40
0 50 100 150 200 250 300 350 400
Sol in Ni Watts@ 50 C
1.55 mm1.20 mm0.80 mm0.40 mm
Wei
ght C
hang
e (m
g)
Time (hrs)
a
0
5
10
15
20
0 50 100 150 200 250 300 350 400
Sol in Ni Watts @ 50 C
1.55 mm1.20 mm0.80 mm0.40 mm
Nor
mal
ized
∆W
(mg
solu
te/g
PM
MA
)
Time (hrs)
b
Figure A18.

53
Distribution 1 Dan Goods
581 Gayley Ave Los Angeles, CA 90024
3 Michelle Yi 10954 1/2 Roebling Ave.
Los Angeles, CA 90024 1 Honeywell FM&T
Rob Steinhoff MS-1C41 PO Box 419159 Kansas City, MO 64141-6159
1 Honeywell FM&T Maduri Widmer MS-MD40 PO Box 419159 Kansas City, MO 64141-6159
1 Jost Goettert Louisiana State University
Center for Advanced Microstructures & Devices 6980 Jefferson Hwy.
Baton Rouge, LA 70806 1 F. Josef Hormes
Louisiana State University Center for Advanced Microstructures & Devices 6980 Jefferson Hwy. Baton Rouge, LA 70806
1 V.Saile Forschungzentrum Karlsruhe GmbH Institut fuer Mikrostrukturtechnik Postfach 3640 76021 Karlsruhe GERMANY
1 J. Mohr Forschungzentrum Karlsruhe GmbH Institut fuer Mikrostrukturtechnik Postfach 3640 76021 Karlsruhe GERMANY
1 J. Schulz Forschungzentrum Karlsruhe GmbH Institut fuer Mikrostrukturtechnik Postfach 3640 76021 Karlsruhe GERMANY
1 S. Achenbach

54
Forschungzentrum Karlsruhe GmbH Institut fuer Mikrostrukturtechnik Postfach 3640 76021 Karlsruhe GERMANY
1 S. Megtert LURE Batiment 209 D Centre Universitaire Paris Sud 91898 Orsay cedex FRANCE
1 Frederic Perennes Sincrotrone Trieste Strada Statale 14 34012 Basovizza, Trieste ITALY
1 Laurence Singleton Institut für Mikrotechnik Mainz GmbH Carl-Zeiss-Strasse 18-20 55129 Mainz GERMANY
1 MS 0319 Carl Vanecek 1 MS 0319 Kelvin Diaz 1 MS 0889 Tom Buchheit 1 MS 1415 Sean Hearne 1 MS 9005 Jill Hruby 1 MS 9042 Stewart Griffiths 1 MS 9401 Glenn Kubiak 1 MS 9401 Georg Aigeldinger 1 MS 9401 Michelle Bankert 1 MS 9401 Dale Boehme 1 MS 9401 Christine Cuppoletti 1 MS 9401 John Hachman 1 MS 9401 Craig Henderson 1 MS 9401 David Heredia 1 MS 9401 James J. Kelly 1 MS 9401 Karen Lee Krafcik 1 MS 9401 Dorrance McLean 1 MS 9401 Alf Morales 1 MS 9401 Stanley Mrowka 1 MS 9401 Franz Josef Pantenburg 1 MS 9401 Dawn Skala 1 MS 9401 Thomas Wallow 1 MS 9401 Peter Yang 1 MS 9403 Tom Bennett

55
1 MS 9403 Bob Bradshaw 1 MS 9403 Doug Chinn 1 MS 9403 Paul Dentinger 1 MS 9403 Linda Domeier 1 MS 9403 Bill Even 1 MS 9403 Pat Keifer 1 MS 9403 James McElhanon 1 MS 9403 Jonathan Sala 1 MS 9403 Tim Shepodd 1 MS 9403 Blake Simmons 1 MS 9403 LeRoy Whinnery 1 MS 9404 John Garcia 10 MS 9404 S. H. Goods 2 MS 9404 R.M. Watson 1 MS 9405 Rick Stulen Attn: MS 9161 Bob Hwang, 08721 MS 9161 Tony Chen, 08726 MS 9403 Jim Wang, 08723 MS 9402 Chuck Cadden, 08724 MS 9409 John Goldsmith, 08730 MS 9409 Bill Replogle, 08731 MS 9042 Paul Spence, 08727 MS 9042 Christopher Moen, 08728
3 MS 9018 Central Technical Files, 8945-1 1 MS 0899 Technical Library, 9616 1 MS 9021 Classification Office, 8511/Technical Library, MS 0899, 9616
DOE/OSTI via URL 1 MS 0188 D. Chavez, LDRD Office, 1030