Thermal evolution of an early magma ocean in interaction with the ...
22
JOURNAL OF GEOPHYSICAL RESEARCH: PLANETS, VOL. 118, 1155–1176, doi:10.1002/jgre.20068, 2013 Thermal evolution of an early magma ocean in interaction with the atmosphere T. Lebrun, 1 H. Massol, 1 E. Chassefière, 1 A. Davaille, 2 E. Marcq, 3 P. Sarda, 1 F. Leblanc, 3 and G. Brandeis 4 Received 18 July 2012; revised 13 February 2013; accepted 4 March 2013; published 3 June 2013. [1] The thermal evolution of magma oceans produced by collision with giant impactors late in accretion is expected to depend on the composition and structure of the atmosphere through the greenhouse effect of CO 2 and H 2 O released from the magma during its crystallization. In order to constrain the various cooling timescales of the system, we developed a 1-D parameterized convection model of a magma ocean coupled with a 1-D radiative-convective model of the atmosphere. We conducted a parametric study and described the influences of the initial volatile inventories, the initial depth of the magma ocean, and the Sun-planet distance. Our results suggest that a steam atmosphere delays the end of the magma ocean phase by typically 1 Myr. Water vapor condenses to an ocean after 0.1, 1.5, and 10 Myr for, respectively, Mars, Earth, and Venus. This time would be virtually infinite for an Earth-sized planet located at less than 0.66 AU from the Sun. Using a more accurate calculation of opacities, we show that Venus is much closer to this threshold distance than in previous models. So there are conditions such as no water ocean is formed on Venus. Moreover, for Mars and Earth, water ocean formation timescales are shorter than typical time gaps between major impacts. This implies that successive water oceans may have developed during accretion, making easier the loss of their atmospheres by impact erosion. On the other hand, Venus could have remained in the magma ocean stage for most of its accretion. Citation: Lebrun, T., H. Massol, E. Chassefière, A. Davaille, E. Marcq, P. Sarda, F. Leblanc, and G. Brandeis (2013), Thermal evolution of an early magma ocean in interaction with the atmosphere, J. Geophys. Res. Planets, 118, 1155–1176, doi:10.1002/jgre.20068. 1. Introduction [2] It is now established that during accretion, most of the terrestrial planets underwent a magma ocean stage [Wood et al., 1970; Hostetler and Drake, 1980; Samuel, 2012; for a general review, see also Elkins-Tanton, 2012]. The total or partial melting of a planetary mantle is due to a combination of heat sources such as the energy pro- vided by impacts, radioactive decay, heat losses from the core at the CMB, and tidal heating if there is another planet nearby (like the Moon in the case of the Earth). Although not yet clearly established, it is likely that at the end of accre- tion, giant impacts could have melted the entire mantle of the planet [Tonks and Melosh, 1993; Reese and Solomatov, 2006]. The subsequent cooling history of this magma ocean 1 IDES/UMR 8148/CNRS/Université Paris-Sud, Orsay, France. 2 FAST/UMR 7608/CNRS/Université Paris-Sud, Orsay, France. 3 LATMOS/UMR 8190/CNRS/Université de Versailles St-Quentin-en- Yvelines, Versailles, France. 4 LDFG/Institut de Physique du Globe de Paris/Sorbonne Paris Cité/Univ. Paris Diderot/UMR 7154/CNRS, Paris, France. Corresponding author: T. Lebrun, Laboratoire IDES, Univ. Paris Sud, Batiment 509, Rue du Belvédère, Campus Universitaire d’Orsay, 91405 Orsay, France. ([email protected]) ©2013. American Geophysical Union. All Rights Reserved. 2169-9097/13/10.1002/jgre.20068 will set the initial conditions for the appearance and style of tectonic regimes prevailing in the solid-state mantle and for the planet habitability at early ages. The presence and nature of an atmosphere will greatly influence the evolution of the system since the greenhouse effect of a steam atmo- sphere resulting from the outgassing of the magma ocean is expected to slow down the radiation of heat to space, and therefore to decrease the cooling rate of the system. [3] In recent years, several models investigated the thermal evolution of a magma ocean. Early models [Abe and Matsui, 1985] consider Earth growing by plan- etesimal impacts, then cooled conductively through a grey radiative atmosphere. Later additions to this model consist in a more realistic water repartition between atmosphere and magma [Abe and Matsui, 1986]. Following these two papers, a radiative-convective atmosphere is then taken into account, thus slowing down the cooling of the magma ocean [Abe and Matsui, 1988; Zahnle et al., 1988]. These models set the basis for future studies of thermal evolu- tion of the magma ocean and the overlying atmosphere. Abe [1997] took into account variable viscosity with crys- tal content, phase changes during cooling, and an over- lying steam atmosphere, however not explicitly coupled with the degassing magma ocean. Following these studies, Elkins-Tanton [2008] explicitly coupled the degassing of volatiles through a grey radiative atmosphere, however 1155
Transcript of Thermal evolution of an early magma ocean in interaction with the ...

JOURNAL OF GEOPHYSICAL RESEARCH: PLANETS, VOL. 118, 1155–1176, doi:10.1002/jgre.20068, 2013
Thermal evolution of an early magma ocean in interaction withthe atmosphereT. Lebrun,1 H. Massol,1 E. Chassefière,1 A. Davaille,2 E. Marcq,3 P. Sarda,1 F. Leblanc,3and G. Brandeis4
Received 18 July 2012; revised 13 February 2013; accepted 4 March 2013; published 3 June 2013.
[1] The thermal evolution of magma oceans produced by collision with giant impactorslate in accretion is expected to depend on the composition and structure of the atmospherethrough the greenhouse effect of CO2 and H2O released from the magma during itscrystallization. In order to constrain the various cooling timescales of the system, wedeveloped a 1-D parameterized convection model of a magma ocean coupled with a 1-Dradiative-convective model of the atmosphere. We conducted a parametric study anddescribed the influences of the initial volatile inventories, the initial depth of the magmaocean, and the Sun-planet distance. Our results suggest that a steam atmosphere delaysthe end of the magma ocean phase by typically 1 Myr. Water vapor condenses to an oceanafter 0.1, 1.5, and 10 Myr for, respectively, Mars, Earth, and Venus. This time would bevirtually infinite for an Earth-sized planet located at less than 0.66 AU from the Sun.Using a more accurate calculation of opacities, we show that Venus is much closer to thisthreshold distance than in previous models. So there are conditions such as no waterocean is formed on Venus. Moreover, for Mars and Earth, water ocean formationtimescales are shorter than typical time gaps between major impacts. This implies thatsuccessive water oceans may have developed during accretion, making easier the loss oftheir atmospheres by impact erosion. On the other hand, Venus could have remained inthe magma ocean stage for most of its accretion.Citation: Lebrun, T., H. Massol, E. Chassefière, A. Davaille, E. Marcq, P. Sarda, F. Leblanc, and G. Brandeis (2013),Thermal evolution of an early magma ocean in interaction with the atmosphere, J. Geophys. Res. Planets, 118, 1155–1176,doi:10.1002/jgre.20068.
1. Introduction[2] It is now established that during accretion, most of
the terrestrial planets underwent a magma ocean stage[Wood et al., 1970; Hostetler and Drake, 1980; Samuel,2012; for a general review, see also Elkins-Tanton, 2012].The total or partial melting of a planetary mantle is dueto a combination of heat sources such as the energy pro-vided by impacts, radioactive decay, heat losses from thecore at the CMB, and tidal heating if there is another planetnearby (like the Moon in the case of the Earth). Although notyet clearly established, it is likely that at the end of accre-tion, giant impacts could have melted the entire mantle ofthe planet [Tonks and Melosh, 1993; Reese and Solomatov,2006]. The subsequent cooling history of this magma ocean
1IDES/UMR 8148/CNRS/Université Paris-Sud, Orsay, France.2FAST/UMR 7608/CNRS/Université Paris-Sud, Orsay, France.3LATMOS/UMR 8190/CNRS/Université de Versailles St-Quentin-en-
Yvelines, Versailles, France.4LDFG/Institut de Physique du Globe de Paris/Sorbonne Paris
Cité/Univ. Paris Diderot/UMR 7154/CNRS, Paris, France.
Corresponding author: T. Lebrun, Laboratoire IDES, Univ. Paris Sud,Batiment 509, Rue du Belvédère, Campus Universitaire d’Orsay, 91405Orsay, France. ([email protected])
©2013. American Geophysical Union. All Rights Reserved.2169-9097/13/10.1002/jgre.20068
will set the initial conditions for the appearance and styleof tectonic regimes prevailing in the solid-state mantle andfor the planet habitability at early ages. The presence andnature of an atmosphere will greatly influence the evolutionof the system since the greenhouse effect of a steam atmo-sphere resulting from the outgassing of the magma ocean isexpected to slow down the radiation of heat to space, andtherefore to decrease the cooling rate of the system.
[3] In recent years, several models investigated thethermal evolution of a magma ocean. Early models[Abe and Matsui, 1985] consider Earth growing by plan-etesimal impacts, then cooled conductively through a greyradiative atmosphere. Later additions to this model consistin a more realistic water repartition between atmosphereand magma [Abe and Matsui, 1986]. Following these twopapers, a radiative-convective atmosphere is then taken intoaccount, thus slowing down the cooling of the magmaocean [Abe and Matsui, 1988; Zahnle et al., 1988]. Thesemodels set the basis for future studies of thermal evolu-tion of the magma ocean and the overlying atmosphere.Abe [1997] took into account variable viscosity with crys-tal content, phase changes during cooling, and an over-lying steam atmosphere, however not explicitly coupledwith the degassing magma ocean. Following these studies,Elkins-Tanton [2008] explicitly coupled the degassing ofvolatiles through a grey radiative atmosphere, however
1155
LEBRUN ET AL.: MAGMA OCEAN AND ATMOSPHERE EVOLUTION
considering a constant viscosity varying between 0.1 and1 Pa s. This latter work that takes into account the chemicalevolution of the crystallizing phases, predicts a gravitationaloverturn once solidification is completed due to the unsta-ble density stratification resulting from the cooling of themagma ocean. Another major energy source to be consid-ered, albeit only relevant to the young Earth, is the tidal heat-ing caused by the much nearer Moon. Zahnle et al. [2007]showed that the resultant heating could overwhelm theradioactive heating, thus expanding the lifetime of a magmaocean. These models lead to very different estimates of cool-ing time scales varying from 400 years [Solomatov, 2000])to 100 million years [Abe, 1997]. As shown by this briefreview, the models have progressively taken into accountmore and more of the complexities of magma ocean dynam-ics. In comparison, the models taken for the atmospherewere much simpler. However, it has been recently shownfrom a one-dimensional radiative-convective model of amassive H2O-CO2 atmosphere [Marcq, 2012] that a morerealistic treatment of the atmospheric dynamics could havean important effect. The opacities in the thermal infrared(IR) have been computed using a k-correlated code, tab-ulated continuum opacities for H2O-H2O and CO2-CO2absorption and water clouds in the moist convective zone(whenever present). Two regimes have been identified. For asurface temperature smaller than a threshold temperature (of2350 K for 300 bars of H2O and 100 bars of CO2), an effi-cient greenhouse effect results in a cool upper atmosphereand a water cloud cover, slowing down the radiation of theheat released by the magma ocean to space. For a surfacetemperature larger than the threshold, the greenhouse effectis not efficient enough to prevent large radiative heat lossto space through a hot, cloudless atmosphere. The transitionfrom large to small radiative heat loss to space, when thesurface temperature drops below the threshold temperature,could play a major role in slowing down the cooling of themagma ocean.
[4] It is also essential to determine the conditions underwhich water could condensate into an ocean at the surfaceof the planet. One of the important objectives of the presentwork is to better understand the conditions and timing ofthe formation of the terrestrial ocean of water, and whysuch an ocean did not form on Venus, or possibly formedat an early stage but later evaporated due to the increas-ing luminosity of the young Sun. The presence of an earlymassive atmosphere of water vapor on Venus, which furtherescaped to space and/or was trapped in the interior underthe form of hydrates, is generally considered to have initi-ated the strong greenhouse effect observed today [Shimazuand Urabe, 1968; Rasool and de Bergh, 1970]. This mas-sive H2O atmosphere may have resulted either (i) from theevaporation of a primordial water ocean, followed by thehydrodynamic escape of hydrogen [Kasting, 1988], or (ii)from the outgassing of the primordial magma ocean, notnecessarily followed by the formation of a (transient) waterocean [Gillmann et al., 2009]. Determining through a com-parative modeling approach applied to the three terrestrialplanets Mars, Earth, and Venus if a water ocean ever con-densed on Venus and, if so, how long this ocean survived isone of the major challenges of modern exobiology.
[5] So in the present model we solve simultaneously (i)the thermal evolution of the convective magma ocean (based
on Solomatov parametric scaling [Solomatov, 2000, 2007])and the radiative-convective atmosphere and (ii) the volatileexchange between the magma ocean and the atmosphere. Inthe latter, the effects of (1) the convection in the troposphere,(2) the presence of water clouds, (3) the condensation ofwater vapor, and (4) the pressure contribution of N2 gas areincluded. At each time, the atmosphere should be in volatileequilibrium with the magma ocean. The dynamics of themagma ocean have been simplified compared to some pre-vious models. We do not take into account the effect oftidal heating [Zahnle et al., 2007] on the magma ocean cool-ing, nor the effect of the rotation on the convective patterns.We also do not resolve in details the sequence of petro-logical phases which crystallize as the magma ocean coolsdown [Elkins-Tanton, 2008], but we include the influence ofthe depth dependence of the solidus-liquidus curves on themagma ocean solidification. Moreover, we take into accountthe variations of the magma viscosity with temperature andcrystal content in the convective modeling. We shall see thatthese viscosity variations are not negligible regarding thecooling time scale. Our simple parametric approach, whichis focused on the estimate of cooling timescales (formationof the water ocean and early tectonic plates), is thereforecomplementary of more complex petrological models using2-D or 3-D convection codes [Breuer and Moore, 2007].
[6] Section 2 describes our model and assumptions. Insection 3, we first study the influence of a dense steam atmo-sphere on the thermal evolution of the system, and the maindifferences when compared to the cases for which (i) noatmosphere is present and (ii) the atmosphere is treated asa grey emitter [Elkins-Tanton, 2008]. Then we investigatethe influence of (1) volatile inventory and degassing path,(2) radiogenic heat production rate, and (3) distance fromthe Sun. We finally discuss in section 4 the implications ofour results on the conditions and timing of the formation ofa water ocean for Venus, Earth, and Mars.
2. The Model[7] We model the secular cooling of the magma ocean by
convective transport of heat in a 1-D spherically symmetricgeometry. The magma ocean model is coupled to a radiative-convective thermal model of the atmosphere [Marcq, 2012]through the exchange of volatile species between the magmaocean and the atmosphere and the conservation of heat atthe interface between the magma ocean and the atmosphere.In the following sections, we detail the model setup andequations. A flowchart designed to explicitly show how themain variables are implemented is given in section A.
2.1. Initial State[8] In the initial state, we consider a potential temperature
Tpi of 4000 K. Given the Earth’s mantle liquidus (Figure 1),this temperature would correspond to the Earth’s mantlebeing molten all the way to the core-mantle boundary.
[9] To determine the initial surface temperature Tsi , weconsider that the heat flux at the surface of the planet Fis in equilibrium with the blackbody flux Fb = � (T 4
s –T 4
eq) where Teq is the equilibrium temperature of theplanet. That amounts to consider that the planet initiallyhas no atmosphere.
1156

LEBRUN ET AL.: MAGMA OCEAN AND ATMOSPHERE EVOLUTION
1800
500 30002000 250015001000
1000
3000
2000
6000
4000
Depth (km)
Tem
pera
ture
(K
) 5000
7000
4000K
3600K
2800K
1400K
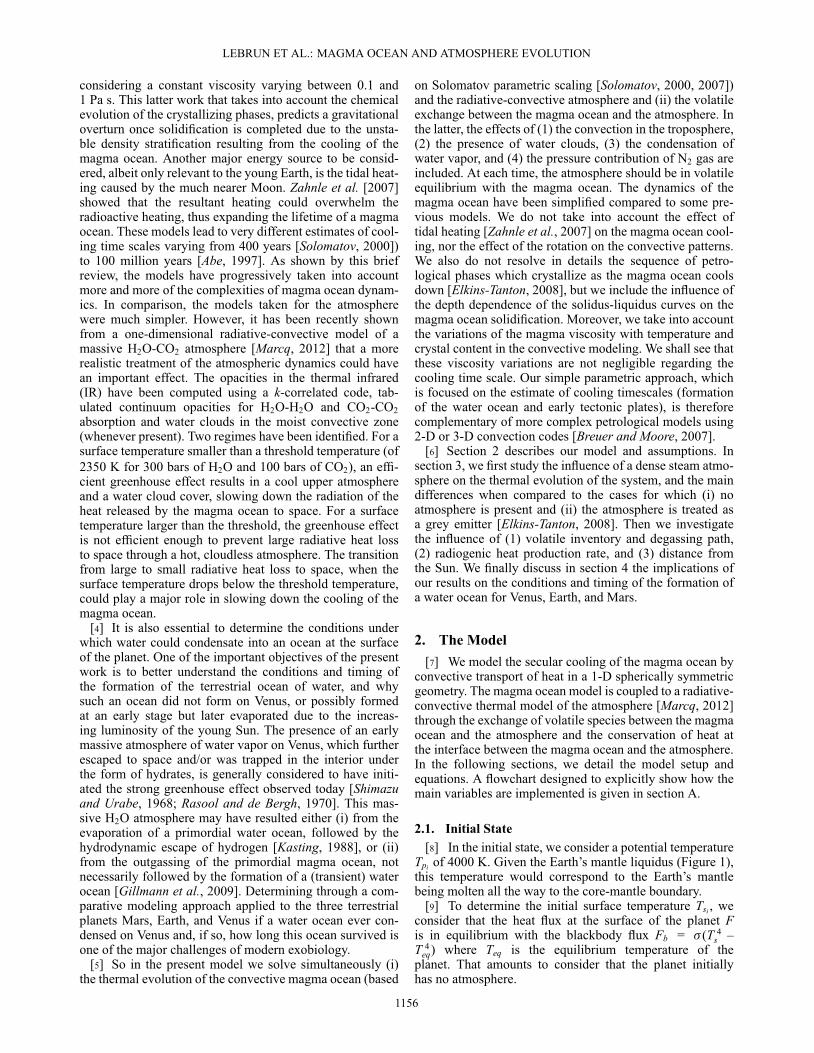
Figure 1. Liquidus (black dashed line), solidus (greydashed line) redrawn after Abe [1997]. Adiabatic tempera-ture profiles (black lines) correspond to a magma ocean withthe thickness of the Earth’s mantle. As cooling proceeds,adiabats cross the liquidus then solidus curves, the magmaocean solidifying from below [see also Elkins-Tanton, 2008;Solomatov, 2000].
[10] Initial amounts of volatiles vary from 1.4 � 10–2 to1.4 � 10–1 wt % for CO2 and H2O corresponding to partialpressures varying between 100 and 1000 bars.
2.2. Convective Cooling of the Magma Ocean[11] After an impact, the magma ocean is losing its
heat due to cooling through its upper surface with theatmosphere. The convection is characterized by two dimen-sionless parameters, the Prandtl number Pr = �/� whichcompares the viscous to the thermal dissipation, and theRayleigh number which compares the buoyancy force to thethermal and viscous dissipations:
Ra =˛g�Tp – Ts
�l3
��(1)
where Ts is the surface temperature, � is the thermal dif-fusivity, k = ��Cp is the thermal conductivity, l is thelength scale corresponding in our case to the magma oceanthickness, � = �/� is the kinematic viscosity, and � isthe dynamic viscosity at the temperature Tp of the magmaocean interior. For the magma ocean, Pr � 100, while fora solid mantle, Pr is quasi-infinite (� 1023). Due to thelarge thickness of the magma ocean (2900 km if it englobesthe whole mantle) and the low viscosity of the magma athigh temperature (typically 0.1 Pa.s) [i.e., Solomatov, 2000],Ra is high even for a very small temperature differencebetween the surface and the interior of the magma ocean(i.e., Ra � 1026 for �T = Tp – Ts = 1 K). Therefore themagma ocean is expected to convect vigorously and its inte-rior should be well mixed. In this case we can assume thatits internal temperature, T(r, t), follows an adiabatic profile.The magma ocean temperature evolution is governed by theconservation of energy [e.g., Abe, 1997]:
r2�
�Cp +�H
d�dT
�dTdt
=@
@r�r2Fr
�+ r 2�qr, (2)
where r is the planetocentric altitude, that is, the dis-tance from the center of the planet, T is the temperature,Cp is the specific heat, �H is the difference of specificenthalpy between melt and solid phases, Fr is the convectiveheat flux at radius r, qr is the radiogenic heat produc-tion rate, and � is the average magma density defined as� = �s�m/(�m(1 – �) + �s�) [Abe, 1993] , �m being the den-sity of the liquid phase, �s the density of the solid phase, and� the melt fraction defined as [Abe, 1997]
� =T – Tsol
Tliq – Tsol, (3)
with Tsol and Tliq being, respectively, solidus andliquidus temperatures. Density variations are only takeninto account in buoyancy forces (Boussinesq approxima-tion). Temperatures Tsol and Tliq are plotted in Figure 1 andare obtained from interpolations of experimentally deter-mined solidus and liquidus temperatures of lherzolite forP < 23 GPa and an ideal mixture of MgSiO3-perovskiteand MgO at higher pressure after Takahashi et al. [1993]and Zerr and Boehler [1993, 1994] (for details, see Abe[1997]). The term �Hd�/dT represents the latent heat ofsolidification.
[12] Given the slopes of the liquidus and soliduscompared to the adiabats (Figure 1), the cooling magmaocean will solidify starting from the bottom to the surface,as the adiabats cross the liquidus and the solidus curvesfirst in the bottom of the mantle. When the melt fractionincreases above a critical melt fraction noted �c (�c=0.4),there is an abrupt change in the rheological behavior ofthe partially crystallized melt [Arzi, 1978; Abe, 1995]. Thisdrastic change is due essentially to a change in the con-nectivity of solid particles. We define two main zones, onezone with � > �c where the viscosity is that of a mag-matic liquid and another zone with � < �c where the melthas a solid-like behavior and the viscosity increases dras-tically. The limit between these two zones is called therheology front (after Solomatov [2000]). As previously men-tioned, we suppose an initially completely molten magmaocean of fixed depth Rp – Rb, where Rp is the radius ofthe planet and Rb the planetocentric altitude of the bot-tom of the magma ocean. As cooling proceeds, radii Rs,Rf, and Rl (respectively, planetocentric altitudes of thebottom of the solidification front, rheological front, andbottom of the totally liquid zone) move toward the sur-face (see Figure 2). We suppose that these two layers donot mix based on what takes place in magma chambers[Turner and Campbell, 1986; Jaupart and Brandeis, 1986].Indeed, Turner and Campbell [1986] showed that for asufficiently high viscosity difference between two magmas(viscosity ratio of order of 400), the two fluids remainunmixed. In the case of the magma ocean, the viscositycontrast is much higher, on the order of 1015. Even at thelarger convection velocities involved in the magma ocean,it should remain unmixed following Turner and Campbell’scriterion. In the partially liquid zone (between Rf and Rlin Figure 2), we assume equilibrium crystallization, whichis a good enough approximation for crystals less than 1mm radius [Solomatov, 2007; Suckale et al., 2012]. Becausethe surface heat flux should not depend too much onthe details of solid convection and overturn phenomenonin the solid layer at the base of the magma ocean
1157

LEBRUN ET AL.: MAGMA OCEAN AND ATMOSPHERE EVOLUTION
Turbulentconvection
Nucleation of new crystals in the descending convective plumes
Heat flux
RP
Rb
Atmosphere
Rl
Rs
Totally liquid zone
Partially liquid zone
Solid zone
RF
Figure 2. Schematic section of the magma ocean adaptedfrom Solomatov [2007]. Three zones are pictured: a totallyliquid zone when T > Tliq. A partially liquid zone whenTsol < T < Tliq, and finally a solid zone when T < Tsol. Wedefine Rp the radius of the planet, Rf the planetocentric alti-tude of the bottom of the rheological front, Rl the bottom ofthe totally liquid zone, Rs the top of the solid zone, and Rbthe bottom of the initially molten magma ocean. As coolingproceeds, Rs, Rf, and Rl move toward the surface.
[Solomatov, 2007; Jaupart and Mareschal, 2011], we willnot consider here the details of petrological nor geochemicalprocesses occurring within this solid layer, even if these pro-cesses are essential to understand the present stratificationof the Earth [Elkins-Tanton, 2008]. The adiabatic temper-ature profile in each zone is given in section B and canbe expressed in terms of the potential temperature. Recentexperimental petrological data at high pressure and temper-ature [Fiquet et al., 2010; Labrosse et al., 2007; Nomuraet al., 2011] show that the liquidus and solidus profiles inthe very deep mantle could be different from those shownin Figure 1 and allow for the long-term existence of a par-tially molten zone there. But this is still debated [Andraultet al., 2011]. So in the present work, we will only con-sider the interaction with the atmosphere of a magma oceansolidifying from its bottom up.
[13] Integrating equation (2) over the whole magmaocean, we obtain (see section B for the full development):
IdTp
dt=hR2
pFi
+ Qr, (4)
where Tp is the potential temperature, that is, the tempera-ture of a parcel of magma ocean decompressed adiabaticallyto the atmosphere pressure, Qr is the radiogenic heat pro-duction, and F is the heat flux at the magma ocean surface.Equation (4) assumes that the heat flux coming from the coreat the bottom of the magma ocean is negligible. I and Qr aredefined in section B.
[14] In Rayleigh-Benard convection, the surface heat fluxscales as
F = C0k�Tp – Ts
�l
Ran, (5)
where C0 and n are constants which depends onthe regime and pattern of convection [Malkus, 1954;
Siggia, 1994; Grossmann and Lohse, 2000; Solomatov,2007; Davaille and Limare, 2007] and the thermal boundarylayer thickness scales as
ı =k�Tp – Ts
�F
(6)
[15] An exponent n = 1/3 in equation (5) means that heatloss is governed solely by local instabilities of the upperthermal boundary layer (TBL) and does not depend explic-itly on the magma ocean thickness. It has been observed inexperiments with constant viscosity for 106 < Ra < 1010
with constant C0 varying between 0.05 and 0.18 (seeSiggia [1994] and Davaille and Limare [2007] for a review).On the other hand, the appearance of a large-scale circu-lation connecting the top TBL to the bottom of the layer,either due to turbulent motions in confined boxes (for108 < Ra < 1014, see Castaing et al. [1989] and Grossmannand Lohse [2000]) or due to large viscosity variations [e.g.,Solomatov and Moresi, 1997; Androvandi et al., 2011]would give an exponent lower than 1/3. For very high Ra(greater than 1014), it has been proposed that an ultimateregime [Kraichman, 1962] could occur where the TBLs arenot limiting the heat transport anymore and the exponent isn = 1/2. This may have been recently observed in very talland thin cavities [Chavanne et al., 1997; Ahlers et al., 2012]but the scaling remains controversial and the correspondingflow organization unknown. Anyway, another complicationarises for the magma ocean: In its liquid state, its convec-tive pattern and heat transport will be sensitive to rotation.But there again there is no consensus yet on the exponent nwhich may be much higher than 1/3 [e.g., King et al., 2012].So it follows that although the regime is not clear for thevery high Ra of the magma ocean, a value of n = 1/3 isprobably a lower conservative bet. That is the value that weshall adopt for the liquid stage of the magma ocean, withC0 = 0.089 [e.g., Siggia, 1994].
[16] On the other hand, the definition of Ra (equation (1))shows that F depends on the viscosity of the magma oceaninterior and therefore depends on its temperature and crys-tal content. It is the strong increase of the viscosity as themagma ocean cools which is going to influence the patternof convection and therefore the heat flux when the rheolog-ical front reaches the surface. We consider that for � > �c,the viscosity of the magma corresponds to the viscosity of amagmatic liquid containing crystals [Roscoe, 1952]:
� =�l�
1 – (1–�)(1–�c)
�2.5 , (7)
where [Karki and Stixrude, 2010]
�l = A exp�
BTp – 1000
�, (8)
is the viscosity of the magmatic liquid derived from theVogel-Fulcher-Tammann equation where A = 0.00024 Pa sand B = 4600 K.
[17] For � < �c the viscosity of the magma is controlledby the viscosity of the solid particles [Solomatov, 2007]:
� = �s exp (˛n�) , (9)
1158
LEBRUN ET AL.: MAGMA OCEAN AND ATMOSPHERE EVOLUTION
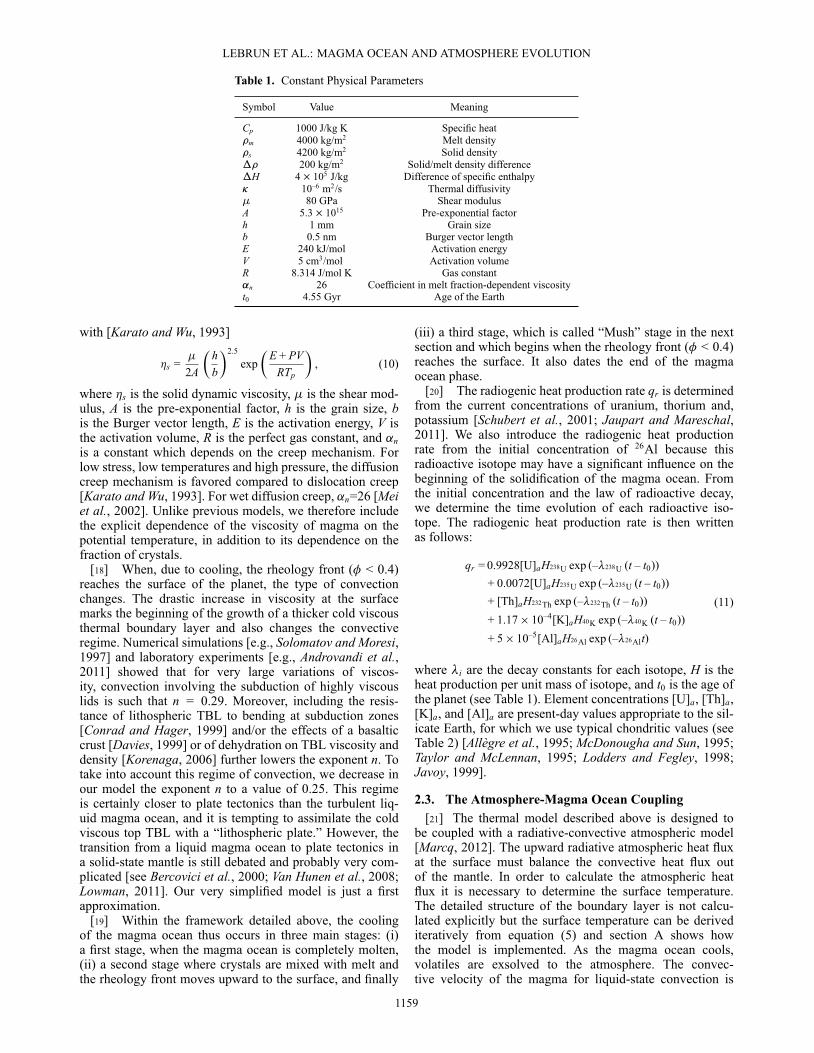
Table 1. Constant Physical Parameters
Symbol Value Meaning
Cp 1000 J/kg K Specific heat�m 4000 kg/m2 Melt density�s 4200 kg/m2 Solid density�� 200 kg/m2 Solid/melt density difference�H 4� 105 J/kg Difference of specific enthalpy� 10–6 m2/s Thermal diffusivity� 80 GPa Shear modulusA 5.3� 1015 Pre-exponential factorh 1 mm Grain sizeb 0.5 nm Burger vector lengthE 240 kJ/mol Activation energyV 5 cm3/mol Activation volumeR 8.314 J/mol K Gas constant˛n 26 Coefficient in melt fraction-dependent viscosityt0 4.55 Gyr Age of the Earth
with [Karato and Wu, 1993]
�s =
2A
�hb
�2.5
exp�
E + PVRTp
�, (10)
where �s is the solid dynamic viscosity, is the shear mod-ulus, A is the pre-exponential factor, h is the grain size, bis the Burger vector length, E is the activation energy, V isthe activation volume, R is the perfect gas constant, and ˛nis a constant which depends on the creep mechanism. Forlow stress, low temperatures and high pressure, the diffusioncreep mechanism is favored compared to dislocation creep[Karato and Wu, 1993]. For wet diffusion creep, ˛n=26 [Meiet al., 2002]. Unlike previous models, we therefore includethe explicit dependence of the viscosity of magma on thepotential temperature, in addition to its dependence on thefraction of crystals.
[18] When, due to cooling, the rheology front (� < 0.4)reaches the surface of the planet, the type of convectionchanges. The drastic increase in viscosity at the surfacemarks the beginning of the growth of a thicker cold viscousthermal boundary layer and also changes the convectiveregime. Numerical simulations [e.g., Solomatov and Moresi,1997] and laboratory experiments [e.g., Androvandi et al.,2011] showed that for very large variations of viscos-ity, convection involving the subduction of highly viscouslids is such that n = 0.29. Moreover, including the resis-tance of lithospheric TBL to bending at subduction zones[Conrad and Hager, 1999] and/or the effects of a basalticcrust [Davies, 1999] or of dehydration on TBL viscosity anddensity [Korenaga, 2006] further lowers the exponent n. Totake into account this regime of convection, we decrease inour model the exponent n to a value of 0.25. This regimeis certainly closer to plate tectonics than the turbulent liq-uid magma ocean, and it is tempting to assimilate the coldviscous top TBL with a “lithospheric plate.” However, thetransition from a liquid magma ocean to plate tectonics ina solid-state mantle is still debated and probably very com-plicated [see Bercovici et al., 2000; Van Hunen et al., 2008;Lowman, 2011]. Our very simplified model is just a firstapproximation.
[19] Within the framework detailed above, the coolingof the magma ocean thus occurs in three main stages: (i)a first stage, when the magma ocean is completely molten,(ii) a second stage where crystals are mixed with melt andthe rheology front moves upward to the surface, and finally
(iii) a third stage, which is called “Mush” stage in the nextsection and which begins when the rheology front (� < 0.4)reaches the surface. It also dates the end of the magmaocean phase.
[20] The radiogenic heat production rate qr is determinedfrom the current concentrations of uranium, thorium and,potassium [Schubert et al., 2001; Jaupart and Mareschal,2011]. We also introduce the radiogenic heat productionrate from the initial concentration of 26Al because thisradioactive isotope may have a significant influence on thebeginning of the solidification of the magma ocean. Fromthe initial concentration and the law of radioactive decay,we determine the time evolution of each radioactive iso-tope. The radiogenic heat production rate is then writtenas follows:
qr = 0.9928[U]aH238U exp (–238U (t – t0))+ 0.0072[U]aH235U exp (–235U (t – t0))+ [Th]aH232Th exp (–232Th (t – t0))+ 1.17 � 10–4[K]aH40K exp (–40K (t – t0))+ 5 � 10–5[Al]aH26Al exp (–26Alt)
(11)
where i are the decay constants for each isotope, H is theheat production per unit mass of isotope, and t0 is the age ofthe planet (see Table 1). Element concentrations [U]a, [Th]a,[K]a, and [Al]a are present-day values appropriate to the sil-icate Earth, for which we use typical chondritic values (seeTable 2) [Allègre et al., 1995; McDonougha and Sun, 1995;Taylor and McLennan, 1995; Lodders and Fegley, 1998;Javoy, 1999].
2.3. The Atmosphere-Magma Ocean Coupling[21] The thermal model described above is designed to
be coupled with a radiative-convective atmospheric model[Marcq, 2012]. The upward radiative atmospheric heat fluxat the surface must balance the convective heat flux outof the mantle. In order to calculate the atmospheric heatflux it is necessary to determine the surface temperature.The detailed structure of the boundary layer is not calcu-lated explicitly but the surface temperature can be derivediteratively from equation (5) and section A shows howthe model is implemented. As the magma ocean cools,volatiles are exsolved to the atmosphere. The convec-tive velocity of the magma for liquid-state convection is
1159
LEBRUN ET AL.: MAGMA OCEAN AND ATMOSPHERE EVOLUTION
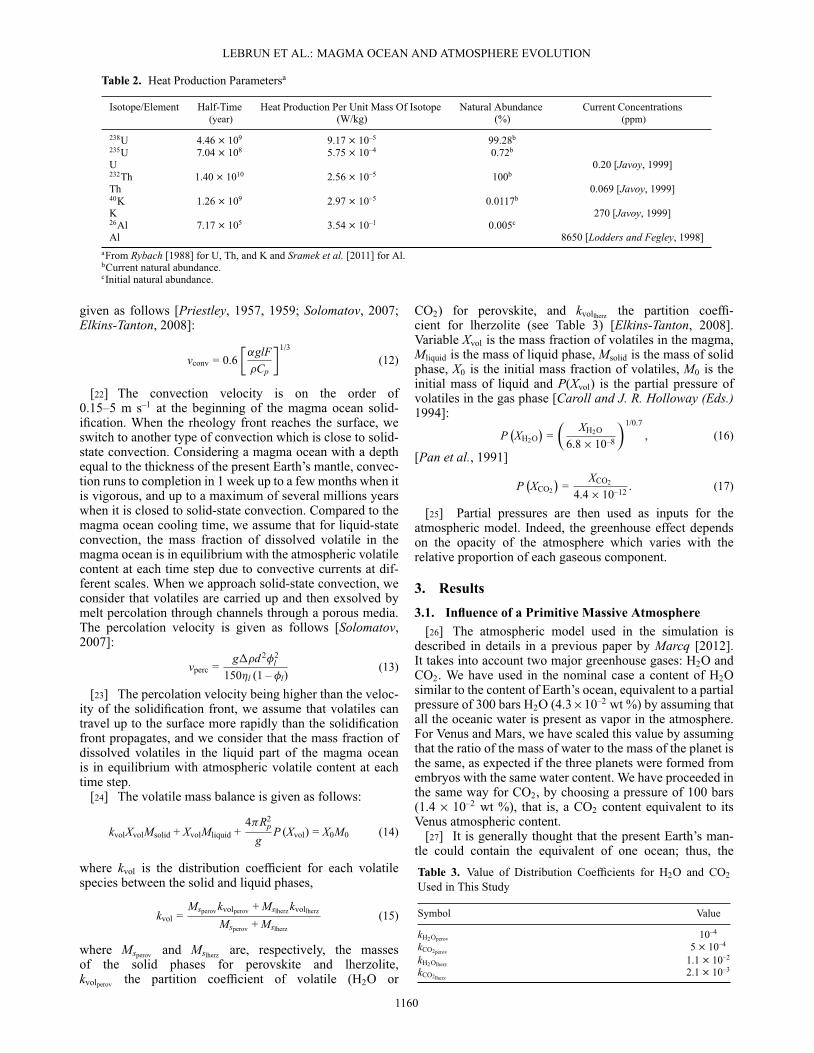
Table 2. Heat Production Parametersa
Isotope/Element Half-Time Heat Production Per Unit Mass Of Isotope Natural Abundance Current Concentrations(year) (W/kg) (%) (ppm)
238U 4.46� 109 9.17� 10–5 99.28b
235U 7.04� 108 5.75� 10–4 0.72b
U 0.20 [Javoy, 1999]232Th 1.40� 1010 2.56� 10–5 100b
Th 0.069 [Javoy, 1999]40K 1.26� 109 2.97� 10–5 0.0117b
K 270 [Javoy, 1999]26Al 7.17� 105 3.54� 10–1 0.005c
Al 8650 [Lodders and Fegley, 1998]aFrom Rybach [1988] for U, Th, and K and Sramek et al. [2011] for Al.bCurrent natural abundance.cInitial natural abundance.
given as follows [Priestley, 1957, 1959; Solomatov, 2007;Elkins-Tanton, 2008]:
vconv = 0.6�˛glF�Cp
1/3
(12)
[22] The convection velocity is on the order of0.15–5 m s–1 at the beginning of the magma ocean solid-ification. When the rheology front reaches the surface, weswitch to another type of convection which is close to solid-state convection. Considering a magma ocean with a depthequal to the thickness of the present Earth’s mantle, convec-tion runs to completion in 1 week up to a few months when itis vigorous, and up to a maximum of several millions yearswhen it is closed to solid-state convection. Compared to themagma ocean cooling time, we assume that for liquid-stateconvection, the mass fraction of dissolved volatile in themagma ocean is in equilibrium with the atmospheric volatilecontent at each time step due to convective currents at dif-ferent scales. When we approach solid-state convection, weconsider that volatiles are carried up and then exsolved bymelt percolation through channels through a porous media.The percolation velocity is given as follows [Solomatov,2007]:
vperc =g��d 2�2
l150�l (1 – �l)
(13)
[23] The percolation velocity being higher than the veloc-ity of the solidification front, we assume that volatiles cantravel up to the surface more rapidly than the solidificationfront propagates, and we consider that the mass fraction ofdissolved volatiles in the liquid part of the magma oceanis in equilibrium with atmospheric volatile content at eachtime step.
[24] The volatile mass balance is given as follows:
kvolXvolMsolid + XvolMliquid +4�R2
p
gP (Xvol) = X0M0 (14)
where kvol is the distribution coefficient for each volatilespecies between the solid and liquid phases,
kvol =Msperov kvolperov + Mslherz kvollherz
Msperov + Mslherz
(15)
where Msperov and Mslherz are, respectively, the massesof the solid phases for perovskite and lherzolite,kvolperov the partition coefficient of volatile (H2O or
CO2) for perovskite, and kvollherz the partition coeffi-cient for lherzolite (see Table 3) [Elkins-Tanton, 2008].Variable Xvol is the mass fraction of volatiles in the magma,Mliquid is the mass of liquid phase, Msolid is the mass of solidphase, X0 is the initial mass fraction of volatiles, M0 is theinitial mass of liquid and P(Xvol) is the partial pressure ofvolatiles in the gas phase [Caroll and J. R. Holloway (Eds.)1994]:
P�XH2O
�=�
XH2O
6.8 � 10–8
�1/0.7
, (16)
[Pan et al., 1991]
P�XCO2
�=
XCO2
4.4 � 10–12 . (17)
[25] Partial pressures are then used as inputs for theatmospheric model. Indeed, the greenhouse effect dependson the opacity of the atmosphere which varies with therelative proportion of each gaseous component.
3. Results3.1. Influence of a Primitive Massive Atmosphere
[26] The atmospheric model used in the simulation isdescribed in details in a previous paper by Marcq [2012].It takes into account two major greenhouse gases: H2O andCO2. We have used in the nominal case a content of H2Osimilar to the content of Earth’s ocean, equivalent to a partialpressure of 300 bars H2O (4.3�10–2 wt %) by assuming thatall the oceanic water is present as vapor in the atmosphere.For Venus and Mars, we have scaled this value by assumingthat the ratio of the mass of water to the mass of the planet isthe same, as expected if the three planets were formed fromembryos with the same water content. We have proceeded inthe same way for CO2, by choosing a pressure of 100 bars(1.4 � 10–2 wt %), that is, a CO2 content equivalent to itsVenus atmospheric content.
[27] It is generally thought that the present Earth’s man-tle could contain the equivalent of one ocean; thus, theTable 3. Value of Distribution Coefficients for H2O and CO2Used in This Study
Symbol Value
kH2Operov 10–4
kCO2perov 5� 10–4
kH2Olherz 1.1� 10–2
kCO2lherz2.1� 10–3
1160
LEBRUN ET AL.: MAGMA OCEAN AND ATMOSPHERE EVOLUTION
(f )
(g)
(a)
(b)
(c)
(h)
(j)
(i)
(k)
(e)
(d) (l)
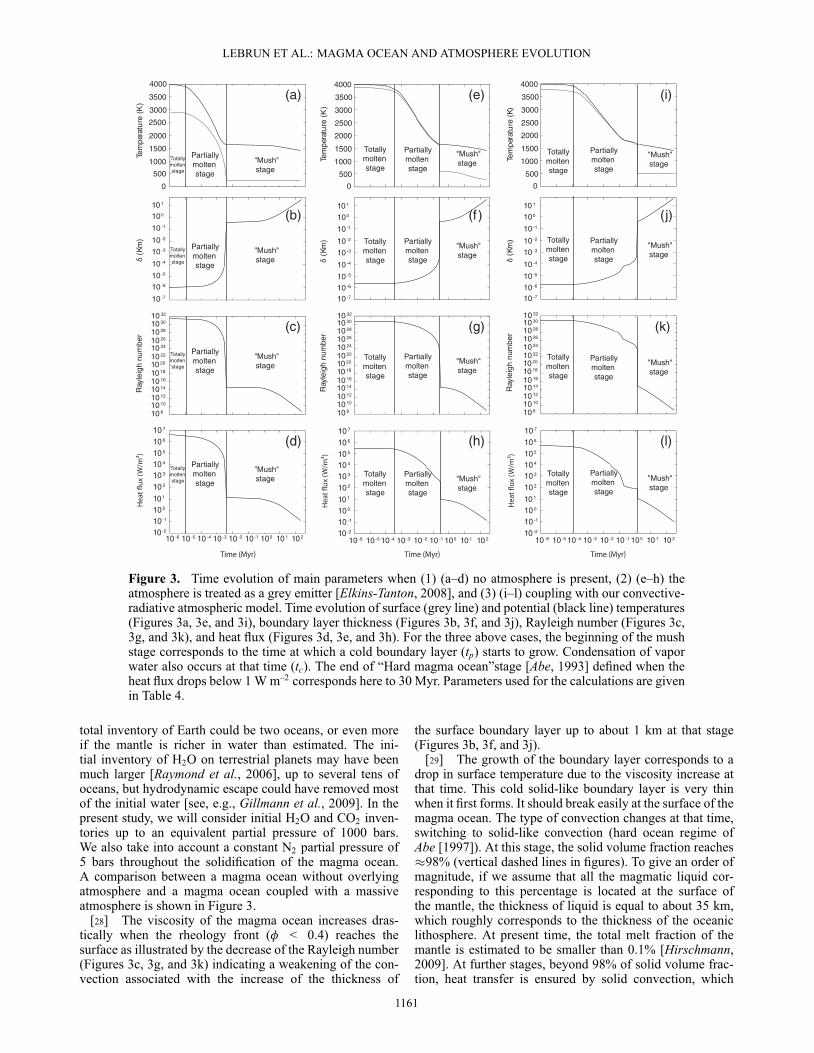
Figure 3. Time evolution of main parameters when (1) (a–d) no atmosphere is present, (2) (e–h) theatmosphere is treated as a grey emitter [Elkins-Tanton, 2008], and (3) (i–l) coupling with our convective-radiative atmospheric model. Time evolution of surface (grey line) and potential (black line) temperatures(Figures 3a, 3e, and 3i), boundary layer thickness (Figures 3b, 3f, and 3j), Rayleigh number (Figures 3c,3g, and 3k), and heat flux (Figures 3d, 3e, and 3h). For the three above cases, the beginning of the mushstage corresponds to the time at which a cold boundary layer (tp) starts to grow. Condensation of vaporwater also occurs at that time (tc). The end of “Hard magma ocean”stage [Abe, 1993] defined when theheat flux drops below 1 W m–2 corresponds here to 30 Myr. Parameters used for the calculations are givenin Table 4.
total inventory of Earth could be two oceans, or even moreif the mantle is richer in water than estimated. The ini-tial inventory of H2O on terrestrial planets may have beenmuch larger [Raymond et al., 2006], up to several tens ofoceans, but hydrodynamic escape could have removed mostof the initial water [see, e.g., Gillmann et al., 2009]. In thepresent study, we will consider initial H2O and CO2 inven-tories up to an equivalent partial pressure of 1000 bars.We also take into account a constant N2 partial pressure of5 bars throughout the solidification of the magma ocean.A comparison between a magma ocean without overlyingatmosphere and a magma ocean coupled with a massiveatmosphere is shown in Figure 3.
[28] The viscosity of the magma ocean increases dras-tically when the rheology front (� < 0.4) reaches thesurface as illustrated by the decrease of the Rayleigh number(Figures 3c, 3g, and 3k) indicating a weakening of the con-vection associated with the increase of the thickness of
the surface boundary layer up to about 1 km at that stage(Figures 3b, 3f, and 3j).
[29] The growth of the boundary layer corresponds to adrop in surface temperature due to the viscosity increase atthat time. This cold solid-like boundary layer is very thinwhen it first forms. It should break easily at the surface of themagma ocean. The type of convection changes at that time,switching to solid-like convection (hard ocean regime ofAbe [1997]). At this stage, the solid volume fraction reaches�98% (vertical dashed lines in figures). To give an order ofmagnitude, if we assume that all the magmatic liquid cor-responding to this percentage is located at the surface ofthe mantle, the thickness of liquid is equal to about 35 km,which roughly corresponds to the thickness of the oceaniclithosphere. At present time, the total melt fraction of themantle is estimated to be smaller than 0.1% [Hirschmann,2009]. At further stages, beyond 98% of solid volume frac-tion, heat transfer is ensured by solid convection, which
1161
LEBRUN ET AL.: MAGMA OCEAN AND ATMOSPHERE EVOLUTION
Table 4. Physical Parameters Used in This Study
Figures X0H2O X0CO2Distance from the Sun Gravitational Acceleration g Planetary Radius Rp Initial Depth (Rp – Rb)
(10–2 wt %) (10–2 wt %) (au) (m s–2) (km) (km)
Figures 3a–3d / / 1 9.8 6378 2885Figures 3e–3l 4.3 1.4 1 9.8 6378 2885Figure 4 1.4–14.3 1.4–14.3 1 9.8 6378 2885Figure 5a 1.4 1.4 1 9.8 6378 2885Figure 5b 14.3 1.4 1 9.8 6378 2885Figure 6 4.3 1.4 1 9.8 6378 2885Figure 7 4.3 1.4 1 9.8 6378 2885Figure 8 4.3 1.4 1 9.8 6378 2885Figure 9 4.3 1.4 1 9.8 6378 2885Figure 10a 4.3 1.4 0.7 9.8 6378 2885Figure 10b 4.3 1.4 1 9.8 6378 2885Figure 10c 4.3 1.4 1.5 9.8 6378 2885Figure 11 4.3 1.4 1.55–0.66 9.8 6378 2885Figure 12a 4.3 1.4 0.7 8.9 6052 3000Figure 12b 4.3 1.4 1 9.8 6378 2885Figure 12c 4.3 1.4 1.5 3.7 3390 1800Figure 13a 4.3 1.4 0.7 8.9 6052 3000Figure 13b 4.3 1.4 1 9.8 6378 2885Figure 13c 4.3 1.4 1.5 3.7 3390 1800Figure 14 1.4–14.3 1.4 0.89–0.63 9.8 6378 2885Figure 15 1.4–14.3 1.4 0.69 9.8 6378 2885Figure 16 1.4 1.4–14.3 1.55–0.63 9.8 6378 2885Figure 17 4.3 1.4 1.55–0.63 3.5–10.5 3000–7000 2885Figure 18 4.3 1.4 0–1.8 3.7; 9.8; 8.8 3390; 6378; 6052 1800; 2885; 3000
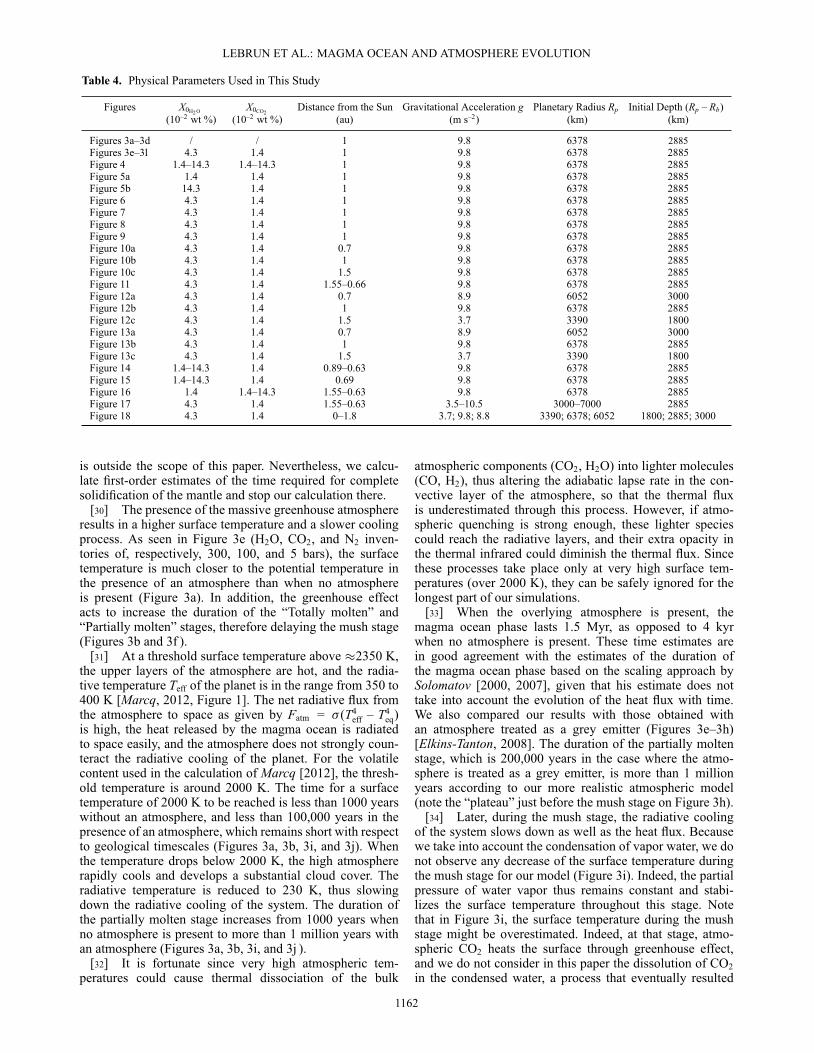
is outside the scope of this paper. Nevertheless, we calcu-late first-order estimates of the time required for completesolidification of the mantle and stop our calculation there.
[30] The presence of the massive greenhouse atmosphereresults in a higher surface temperature and a slower coolingprocess. As seen in Figure 3e (H2O, CO2, and N2 inven-tories of, respectively, 300, 100, and 5 bars), the surfacetemperature is much closer to the potential temperature inthe presence of an atmosphere than when no atmosphereis present (Figure 3a). In addition, the greenhouse effectacts to increase the duration of the “Totally molten” and“Partially molten” stages, therefore delaying the mush stage(Figures 3b and 3f ).
[31] At a threshold surface temperature above �2350 K,the upper layers of the atmosphere are hot, and the radia-tive temperature Teff of the planet is in the range from 350 to400 K [Marcq, 2012, Figure 1]. The net radiative flux fromthe atmosphere to space as given by Fatm = � (T4
eff – T4eq)
is high, the heat released by the magma ocean is radiatedto space easily, and the atmosphere does not strongly coun-teract the radiative cooling of the planet. For the volatilecontent used in the calculation of Marcq [2012], the thresh-old temperature is around 2000 K. The time for a surfacetemperature of 2000 K to be reached is less than 1000 yearswithout an atmosphere, and less than 100,000 years in thepresence of an atmosphere, which remains short with respectto geological timescales (Figures 3a, 3b, 3i, and 3j). Whenthe temperature drops below 2000 K, the high atmosphererapidly cools and develops a substantial cloud cover. Theradiative temperature is reduced to 230 K, thus slowingdown the radiative cooling of the system. The duration ofthe partially molten stage increases from 1000 years whenno atmosphere is present to more than 1 million years withan atmosphere (Figures 3a, 3b, 3i, and 3j ).
[32] It is fortunate since very high atmospheric tem-peratures could cause thermal dissociation of the bulk
atmospheric components (CO2, H2O) into lighter molecules(CO, H2), thus altering the adiabatic lapse rate in the con-vective layer of the atmosphere, so that the thermal fluxis underestimated through this process. However, if atmo-spheric quenching is strong enough, these lighter speciescould reach the radiative layers, and their extra opacity inthe thermal infrared could diminish the thermal flux. Sincethese processes take place only at very high surface tem-peratures (over 2000 K), they can be safely ignored for thelongest part of our simulations.
[33] When the overlying atmosphere is present, themagma ocean phase lasts 1.5 Myr, as opposed to 4 kyrwhen no atmosphere is present. These time estimates arein good agreement with the estimates of the duration ofthe magma ocean phase based on the scaling approach bySolomatov [2000, 2007], given that his estimate does nottake into account the evolution of the heat flux with time.We also compared our results with those obtained withan atmosphere treated as a grey emitter (Figures 3e–3h)[Elkins-Tanton, 2008]. The duration of the partially moltenstage, which is 200,000 years in the case where the atmo-sphere is treated as a grey emitter, is more than 1 millionyears according to our more realistic atmospheric model(note the “plateau” just before the mush stage on Figure 3h).
[34] Later, during the mush stage, the radiative coolingof the system slows down as well as the heat flux. Becausewe take into account the condensation of vapor water, we donot observe any decrease of the surface temperature duringthe mush stage for our model (Figure 3i). Indeed, the partialpressure of water vapor thus remains constant and stabi-lizes the surface temperature throughout this stage. Notethat in Figure 3i, the surface temperature during the mushstage might be overestimated. Indeed, at that stage, atmo-spheric CO2 heats the surface through greenhouse effect,and we do not consider in this paper the dissolution of CO2in the condensed water, a process that eventually resulted
1162
LEBRUN ET AL.: MAGMA OCEAN AND ATMOSPHERE EVOLUTION
in the formation of carbonates on Earth. If part of the CO2is sequestered in carbonates, the heating effect of CO2 isreduced. This process could have played an important rolein controlling the surface temperatures at the end of thesolidification of the magma ocean.
3.2. Influence of H2O and CO2 Volatiles[35] Volatiles have a significant impact on the different
characteristic times when they are exsolved and degassedto the atmosphere. Indeed, these gases promote greenhouseeffect and influence the surface temperature significantly. Ifthe total and final amount of volatile released in the atmo-sphere during solidification depends directly on the initialmass fractions of volatiles initially dissolved in the magmaocean, the way volatiles are released with time (degassingpath) depends on the temporal evolution of the amount ofmagmatic liquid. Therefore, this evolution trend might beinfluenced either by the initial depth of the magma ocean orby the shape of the liquidus and solidus curves.3.2.1. Initial Mass Fractions of Volatiles
[36] Based on the knowledge of initial volatile con-tent of protoplanets and accretion scenarios [e.g., Raymondet al., 2006], it is likely that the initial water content at earlytimes for terrestrial planets varies from almost 0 wt % to5 wt %. The initial amount of volatiles dissolved in magmaoceans is one of the key parameters governing the timingof solidification through greenhouse effect. In this section,we investigate the influence of the inventories of volatileson the end of the magma ocean phase (tp). The sensitiv-ity study has been conducted for initial mass fractions ofvolatile species (H2O and CO2) varying from 1.4�10–2 wt %to 1.4� 10–1 wt %, that translate into global equivalent pres-sures varying from 100 to 1000 bars. Above a threshold oftotal gas pressure of 1000 bars, we attain the upper limit ofthe atmospheric model because the thickness of the atmo-sphere becomes too large regarding the other assumptionsof the model.
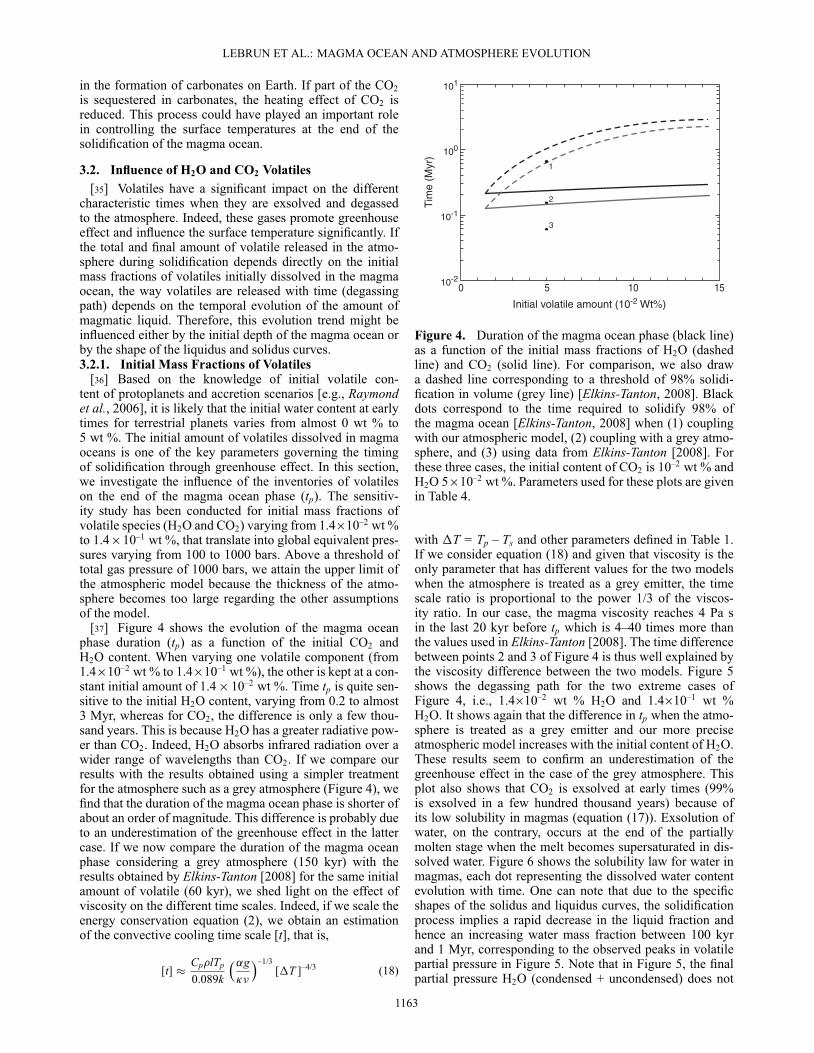
[37] Figure 4 shows the evolution of the magma oceanphase duration (tp) as a function of the initial CO2 andH2O content. When varying one volatile component (from1.4�10–2 wt % to 1.4�10–1 wt %), the other is kept at a con-stant initial amount of 1.4 � 10–2 wt %. Time tp is quite sen-sitive to the initial H2O content, varying from 0.2 to almost3 Myr, whereas for CO2, the difference is only a few thou-sand years. This is because H2O has a greater radiative pow-er than CO2. Indeed, H2O absorbs infrared radiation over awider range of wavelengths than CO2. If we compare ourresults with the results obtained using a simpler treatmentfor the atmosphere such as a grey atmosphere (Figure 4), wefind that the duration of the magma ocean phase is shorter ofabout an order of magnitude. This difference is probably dueto an underestimation of the greenhouse effect in the lattercase. If we now compare the duration of the magma oceanphase considering a grey atmosphere (150 kyr) with theresults obtained by Elkins-Tanton [2008] for the same initialamount of volatile (60 kyr), we shed light on the effect ofviscosity on the different time scales. Indeed, if we scale theenergy conservation equation (2), we obtain an estimationof the convective cooling time scale [t], that is,
[t] �Cp�lTp
0.089k
�˛g��
�–1/3[�T ]–4/3 (18)
1
Tim
e (M
yr)
0
Initial volatile amount (10-2 Wt%)
5 10 15
101
100
10-1
10-2
2
3
Figure 4. Duration of the magma ocean phase (black line)as a function of the initial mass fractions of H2O (dashedline) and CO2 (solid line). For comparison, we also drawa dashed line corresponding to a threshold of 98% solidi-fication in volume (grey line) [Elkins-Tanton, 2008]. Blackdots correspond to the time required to solidify 98% ofthe magma ocean [Elkins-Tanton, 2008] when (1) couplingwith our atmospheric model, (2) coupling with a grey atmo-sphere, and (3) using data from Elkins-Tanton [2008]. Forthese three cases, the initial content of CO2 is 10–2 wt % andH2O 5�10–2 wt %. Parameters used for these plots are givenin Table 4.
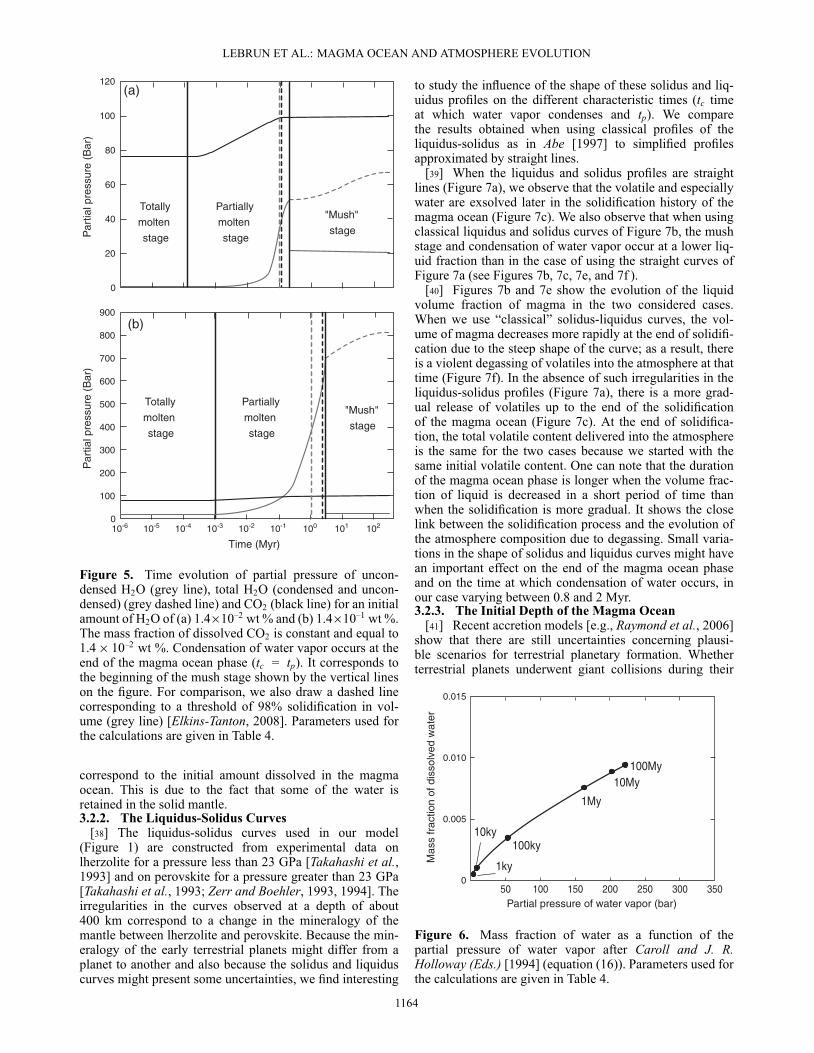
with �T = Tp – Ts and other parameters defined in Table 1.If we consider equation (18) and given that viscosity is theonly parameter that has different values for the two modelswhen the atmosphere is treated as a grey emitter, the timescale ratio is proportional to the power 1/3 of the viscos-ity ratio. In our case, the magma viscosity reaches 4 Pa sin the last 20 kyr before tp which is 4–40 times more thanthe values used in Elkins-Tanton [2008]. The time differencebetween points 2 and 3 of Figure 4 is thus well explained bythe viscosity difference between the two models. Figure 5shows the degassing path for the two extreme cases ofFigure 4, i.e., 1.4�10–2 wt % H2O and 1.4�10–1 wt %H2O. It shows again that the difference in tp when the atmo-sphere is treated as a grey emitter and our more preciseatmospheric model increases with the initial content of H2O.These results seem to confirm an underestimation of thegreenhouse effect in the case of the grey atmosphere. Thisplot also shows that CO2 is exsolved at early times (99%is exsolved in a few hundred thousand years) because ofits low solubility in magmas (equation (17)). Exsolution ofwater, on the contrary, occurs at the end of the partiallymolten stage when the melt becomes supersaturated in dis-solved water. Figure 6 shows the solubility law for water inmagmas, each dot representing the dissolved water contentevolution with time. One can note that due to the specificshapes of the solidus and liquidus curves, the solidificationprocess implies a rapid decrease in the liquid fraction andhence an increasing water mass fraction between 100 kyrand 1 Myr, corresponding to the observed peaks in volatilepartial pressure in Figure 5. Note that in Figure 5, the finalpartial pressure H2O (condensed + uncondensed) does not
1163
LEBRUN ET AL.: MAGMA OCEAN AND ATMOSPHERE EVOLUTION
(a)
(b)
10-6 10-5 10-4 10-3 10-2 10-1 100 101 102
Time (Myr)
0
40
60
80
100
Par
tial p
ress
ure
(Bar
)
0
100
200
300
400
500
600
700
Par
tial p
ress
ure
(Bar
)
Totally
molten
stage
Partially
molten
stage
"Mush"
stage
Totally
molten
stage
Partially
molten
stage
"Mush"
stage
20
800
900
120
Figure 5. Time evolution of partial pressure of uncon-densed H2O (grey line), total H2O (condensed and uncon-densed) (grey dashed line) and CO2 (black line) for an initialamount of H2O of (a) 1.4�10–2 wt % and (b) 1.4�10–1 wt %.The mass fraction of dissolved CO2 is constant and equal to1.4 � 10–2 wt %. Condensation of water vapor occurs at theend of the magma ocean phase (tc = tp). It corresponds tothe beginning of the mush stage shown by the vertical lineson the figure. For comparison, we also draw a dashed linecorresponding to a threshold of 98% solidification in vol-ume (grey line) [Elkins-Tanton, 2008]. Parameters used forthe calculations are given in Table 4.
correspond to the initial amount dissolved in the magmaocean. This is due to the fact that some of the water isretained in the solid mantle.3.2.2. The Liquidus-Solidus Curves
[38] The liquidus-solidus curves used in our model(Figure 1) are constructed from experimental data onlherzolite for a pressure less than 23 GPa [Takahashi et al.,1993] and on perovskite for a pressure greater than 23 GPa[Takahashi et al., 1993; Zerr and Boehler, 1993, 1994]. Theirregularities in the curves observed at a depth of about400 km correspond to a change in the mineralogy of themantle between lherzolite and perovskite. Because the min-eralogy of the early terrestrial planets might differ from aplanet to another and also because the solidus and liquiduscurves might present some uncertainties, we find interesting
to study the influence of the shape of these solidus and liq-uidus profiles on the different characteristic times (tc timeat which water vapor condenses and tp). We comparethe results obtained when using classical profiles of theliquidus-solidus as in Abe [1997] to simplified profilesapproximated by straight lines.
[39] When the liquidus and solidus profiles are straightlines (Figure 7a), we observe that the volatile and especiallywater are exsolved later in the solidification history of themagma ocean (Figure 7c). We also observe that when usingclassical liquidus and solidus curves of Figure 7b, the mushstage and condensation of water vapor occur at a lower liq-uid fraction than in the case of using the straight curves ofFigure 7a (see Figures 7b, 7c, 7e, and 7f ).
[40] Figures 7b and 7e show the evolution of the liquidvolume fraction of magma in the two considered cases.When we use “classical” solidus-liquidus curves, the vol-ume of magma decreases more rapidly at the end of solidifi-cation due to the steep shape of the curve; as a result, thereis a violent degassing of volatiles into the atmosphere at thattime (Figure 7f). In the absence of such irregularities in theliquidus-solidus profiles (Figure 7a), there is a more grad-ual release of volatiles up to the end of the solidificationof the magma ocean (Figure 7c). At the end of solidifica-tion, the total volatile content delivered into the atmosphereis the same for the two cases because we started with thesame initial volatile content. One can note that the durationof the magma ocean phase is longer when the volume frac-tion of liquid is decreased in a short period of time thanwhen the solidification is more gradual. It shows the closelink between the solidification process and the evolution ofthe atmosphere composition due to degassing. Small varia-tions in the shape of solidus and liquidus curves might havean important effect on the end of the magma ocean phaseand on the time at which condensation of water occurs, inour case varying between 0.8 and 2 Myr.3.2.3. The Initial Depth of the Magma Ocean
[41] Recent accretion models [e.g., Raymond et al., 2006]show that there are still uncertainties concerning plausi-ble scenarios for terrestrial planetary formation. Whetherterrestrial planets underwent giant collisions during their
15050 350250 300200100
0.005
0.015
0.010
Partial pressure of water vapor (bar)
Mas
s fr
actio
n of
dis
solv
ed w
ater
01ky
10ky100ky
1My
10My100My
Figure 6. Mass fraction of water as a function of thepartial pressure of water vapor after Caroll and J. R.Holloway (Eds.) [1994] (equation (16)). Parameters used forthe calculations are given in Table 4.
1164

LEBRUN ET AL.: MAGMA OCEAN AND ATMOSPHERE EVOLUTION
1400
4000K3600K
(a) 4000K3600K
2800K1800K
2800K1800K
1400K
(d)
Totally molten stage
(f )
Totally molten stage
10-6
Partially molten stage
"Mush" stage
(b)
(c)
Totally molten stage
Partially molten stage
"Mush" stage
Partially molten stage
"Mush" stage
Totally molten stage
Partially molten stage
"Mush" stage
(e)
0
50
100
150
200
250
Par
tial p
ress
ure
(Bar
)1000
3000
2000
6000
4000
Tem
pera
ture
(K
)
5000
7000
Time (Myr)
500 1000 1500 2000 2500 3000
3000
2000
1000
4000
5000
6000
7000
0
Tem
pera
ture
(K
)
Depth (Km)
500 1000 1500 2000 2500 30000
Depth (Km)
0
50
100
150
200
250
Par
tial p
ress
ure
(Bar
)
Time (Myr)
0 0
0.60.70.80.91.0
Liqu
id v
olum
e fr
actio
n
10-5 10-4 10-3 10-2 10-1 100 101 102 10-6 10-5 10-4 10-3 10-2 10-1 100 101 102
10-6 10-5 10-4 10-3 10-2 10-1 100 101 10210-6 10-5 10-4 10-3 10-2 10-1 100 101 102
Time (Myr) Time (Myr)
0.50.40.30.20.1
0.60.70.80.91.0
0.50.40.30.20.1Li
quid
vol
ume
frac
tion
Figure 7. Evolution of (b–e) volumetric melt fraction, (c and f) partial pressure for (a and b) two differ-ent liquidus -solidus profiles defined in the main text. Condensation of water vapor occurs at the end ofthe magma ocean phase (tc = tp). It corresponds to the beginning of the mush stage shown by the verti-cal line on the figure. For comparison, we also draw a dashed line corresponding to a threshold of 98%solidification in volume (grey line) [Elkins-Tanton, 2008]. Parameters used for the calculations are givenin Table 4.
formation is still a matter of debate [e.g., Horner et al.,2009]. Given that the initial depth of the magma oceandepends on the speed and radius of the impactor and on theplanet gravity, we want to investigate in this section differ-ent magma ocean depths possibly corresponding to differentimpact scenarios.
[42] It has been suggested that a giant impact with animpactor speed of about 10–15 km s–1 is able to melt the en-tire planet and mantle [Tonks and Melosh, 1993]. If we con-sider the same initial amount of volatiles of 1.4�10–2 wt %for CO2 and 4.3�10–2 wt % for H2O, for a magma oceandepth of 500 km, tp is about 120 kyr, while for a completelymolten mantle of 2885 km, tp is 1.4 Myr. This result wasintuitively expected, as for the same initial mass fractionof volatiles, more H2O is released into the atmosphere forlonger magma ocean depth.
3.3. Influence of the Radiogenic Heat Production Rate[43] During planetary formation, internal heating is
mainly produced by radiogenic elements contained in con-stitutive primitive material. Some radiogenic elements witha short period such as 26Al produced abundant heat at thebeginning of the solar system formation before rapidly dis-appearing and could be responsible for the differentiationof bodies which formed the planets [Breuer and Moore,2007]. Other radiogenic elements such as U, Th, and K,which have a long period, have an influence at the end ofthe solidification of the magma ocean, when the heat fluxbecomes low. Long period elements do not impact the dura-tion of the totally and partially molten stages, but increasethe mush stage from 300 Myr to 1.5 Gyr (Figures 8a and 8b).In contrast, short period elements have an influence duringthe totally and partially molten stages (Figures 8b and 8c)
1165

LEBRUN ET AL.: MAGMA OCEAN AND ATMOSPHERE EVOLUTION
Totally molten stage
Partiallymoltenstage
Partiallymoltenstage
Partiallymoltenstage
"Mush" stage
Totally molten stage
"Mush" stage
Totally molten stage
"Mush" stage
(a)
(b)
(c)
500
1000
1500
2000
2500
3000
3500
4000
Tem
pera
ture
(K
)
500
0
0
1000
1500
2000
2500
3000
3500
4000
Tem
pera
ture
(K
)
500
0
1000
1500
2000
2500
3000
3500
4000
Tem
pera
ture
(K
)
10-6 10-5 10-4 10-3 10-2 10-1 100 101 102
Time (Myr)
103
Figure 8. Time evolution of potential temperature (blackline) and surface temperature (grey line) (a) without radio-genic heat production and with radiogenic heat producedby (b) U, Th, and K and by (c) U, Th, K, and 26Al. Con-densation of water vapor occurs at the end of the magmaocean phase (tc = tp). It corresponds to the beginning ofthe mush stage shown by the vertical lines on the figure.For comparison, we also draw a dashed line correspondingto a threshold of 98% solidification in volume (grey line)[Elkins-Tanton, 2008]. Parameters used for the calculationsare given in Table 4.
and increase the magma ocean phase duration (tp) from 1to 8 Myr. In Figure 8, the 26Al/27Al ratio is chondritic,i.e., maximum; therefore, our estimation of tp � 8 Myr isalso maximum.
[44] Short period elements may have an influence onlyif terrestrial planets have been accreted very soon. Theeffect of the accretion duration on magma ocean durationthrough the energy released by radioactive decompositionof 26Al is shown in Figure 9. It may be seen that for anaccretion period duration larger than 4.5 Myr, the effect of26Al becomes negligible. Because terrestrial planets proba-bly accreted definitively later than 10 Myr [Raymond et al.,2006], short period radioactivity probably played a minorrole.
3.4. Influence of the Distance From the Sun,Comparison Between Earth, Venus, and Mars
[45] In this section, we study the influence of the distancefrom the Sun on the duration of the magma ocean phasefor totally molten planetary mantles. For that we first studythe influence of solar flux alone by considering an Earth-like planet placed at the distances of Mars and Venus fromthe Sun. When Earth is placed at Venus’ position, tp timeis delayed significantly: approximately 1 Myr for the trueEarth and 10 Myr when Earth is placed at the position ofVenus (Figures 10a and 10b). On the contrary, at Mars’ posi-tion, there is no influence of solar constant alone on theduration of the magma ocean phase (see Figure 10c).
[46] We then vary the position of the Earth in a range ofdistances corresponding to a solar flux in the range from 100to 550 W m–2, that is, from 1.55 to 0.66 AU (Figure 11)considering a solar constant of 957 W m–2. Above a solarflux threshold of 540 W m–2, corresponding to a distancefrom the Sun of 0.66 AU, the planet cannot release its excessheat to space, and the surface and potential temperatures arestabilized before reaching the mush stage.
[47] This threshold is related to the Nakajima limit[Nakajima et al., 1992] and is different to that calculated byKasting [1988]. Indeed, it appears that the main differencelies in the assumed planetary albedo: Kasting [1988] andAbe and Matsui [1988] derive an Earth-like albedo of 0.3,whereas Marcq assumes an albedo of 0.7 when thick cloudsare found in the model (similar to present-day Venus). It maybe therefore expected that the insolation limit will be higher
Accretion time (Myr)
2
3
4
5
6
7
11
1020 3 4 5 6 7 8 9
t p (M
yr)
Figure 9. Magma ocean phase duration (tp) as a functionof the accretion time. Parameters used for the calculationsare given in Table 4.
1166

LEBRUN ET AL.: MAGMA OCEAN AND ATMOSPHERE EVOLUTION
0
Time (Myr)10-6 10-5 10-4 10-3 10-2 10-1 100 101 102
(c)
1000
500
2000
1500
3000
2500
4000
3500
Tem
pera
ture
(K
)
1000
2000
1500
3000
2500
4000
3500
Tem
pera
ture
(K
)
2500
0
0
3500
1500
500
500
1000
3000
2000
Tem
pera
ture
(K
)
4000
(a)
(b)
Totally liquid stage
Partially liquid stage
"Mush" stage
Totally liquid stage
Partially liquid stage
"Mush" stage
Totally molten stage
Partially molten stage
"Mush" stage
Figure 10. Time evolution of surface temperature (greyline) and potential temperatures (black line) of Earth for adistance from the Sun equal to that of (a) Venus, (b) theEarth, and (c) Mars. Condensation of water vapor occurs atthe end of the magma ocean phase (tc = tp). It correspondsto the beginning of the mush stage and it is shown by thevertical lines on the figure. For comparison, we also drawa dashed line corresponding to a threshold of 98% solid-ification in volume (grey line) [Elkins-Tanton, 2008]. Theblack and white circles correspond to a solid state of 98% ofthe magma ocean [Elkins-Tanton, 2008] without atmosphereand with a grey atmosphere, respectively. Parameters usedfor the calculations are given in Table 4.
in such a case, since less solar light is absorbed. Actually,it is more meaningful to compare outgoing IR fluxes at thisthreshold (Nakajima limit) that should balance the absorbedsolar radiation (at or near radiative equilibrium). Kasting[1988] and Abe and Matsui [1988] find a value close to310 W m–2 whereas Marcq [2012] finds a value close to160 W m–2. This discrepancy for Nakajima limit is discussedin Marcq [2012]: it appears that the 1980s era radiativemodel underestimated IR absorption because of the lesssophisticated random band models required by the smalleravailable computing power. More recent, k-correlated com-putations of IR opacities yield thicker opacities and loweroutgoing IR fluxes, as it is the case in Marcq [2012].
[48] Beyond this threshold, and provided that volatiles arenot lost to space, the planet remains in the magma oceanphase. Venus, which is at 0.72 AU, is just outside this limit,below which magma ocean never freezes, but Mercury,which is at 0.4 AU from the Sun, is inside. Nevertheless,due to its small size, Mercury has been unable to prevent itsatmosphere from escaping to space, and our model cannotbe applied to Mercury.
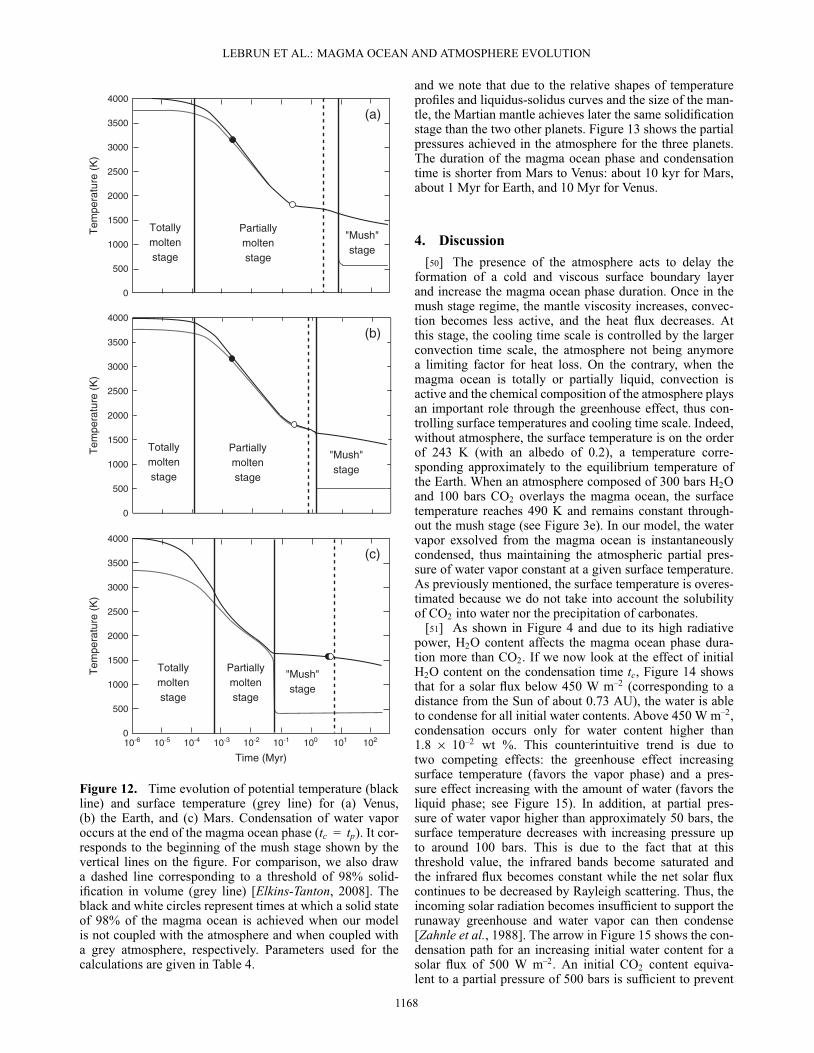
[49] If we now consider the cooling history of a planetarymantle magma ocean for each telluric planet at its own posi-tion, we found that the duration of the magma ocean phaseis not so different from the previous case for the Earth andVenus, which have similar radii (see Figures 10a, 10b, 12a,and 12b). Mars, however, remains in a totally molten stagelonger than Earth because of its smaller radius (Figures 12band 12c). Indeed, at the smaller pressure of the Martian man-tle, the adiabats intersect the liquidus at lower temperaturesvalues. In contrast, the time at which water vapor condensesis smaller than for the two other planets (see Figure 12c).Indeed, we considered accretion scenario for which initialmass fraction of volatiles is the same for the three plan-ets; thus, for a smaller mantle depth, the amount of initialvolatiles is smaller and the final atmosphere is more tenu-ous acting to reduce the greenhouse effect. We also draw onFigure 12 the time at which the mantle is solidified at 98%,
)450 Incident solar500400300200100 550350250150
1.55
Tim
es (
Myr
) 101
100
10-1
102
Distance from the sun (AU)
1.26 1.10 0.98 0.89 0.83 0.77 0.73 0.69 0.66
Figure 11. End of magma ocean phase as a function ofthe solar flux in a range of distances to the Sun from1.55 AU (100 W m–2) to 0.66 AU (550 W m–2). Condensa-tion of water vapor occurs at the end of the magma oceanphase (tc = tp). Parameters used for the calculations aregiven in Table 4.
1167
LEBRUN ET AL.: MAGMA OCEAN AND ATMOSPHERE EVOLUTION
10-6 10-5 10-4 10-3 10-2 10-1 100 101 102
Time (Myr)
500
0
1000
1500
2000
2500
3000
3500
4000
Tem
pera
ture
(K
)
2500
0
3500
1500
500
1000
3000
2000
Tem
pera
ture
(K
)
4000
2500
0
3500
1500
500
1000
3000
2000
Tem
pera
ture
(K
)4000
Totallymoltenstage
Partiallymoltenstage
"Mush"stage
Totallymoltenstage
Partiallymoltenstage
"Mush"stage
Totallymoltenstage
Partiallymoltenstage
"Mush"stage
(a)
(b)
(c)
Figure 12. Time evolution of potential temperature (blackline) and surface temperature (grey line) for (a) Venus,(b) the Earth, and (c) Mars. Condensation of water vaporoccurs at the end of the magma ocean phase (tc = tp). It cor-responds to the beginning of the mush stage shown by thevertical lines on the figure. For comparison, we also drawa dashed line corresponding to a threshold of 98% solid-ification in volume (grey line) [Elkins-Tanton, 2008]. Theblack and white circles represent times at which a solid stateof 98% of the magma ocean is achieved when our modelis not coupled with the atmosphere and when coupled witha grey atmosphere, respectively. Parameters used for thecalculations are given in Table 4.
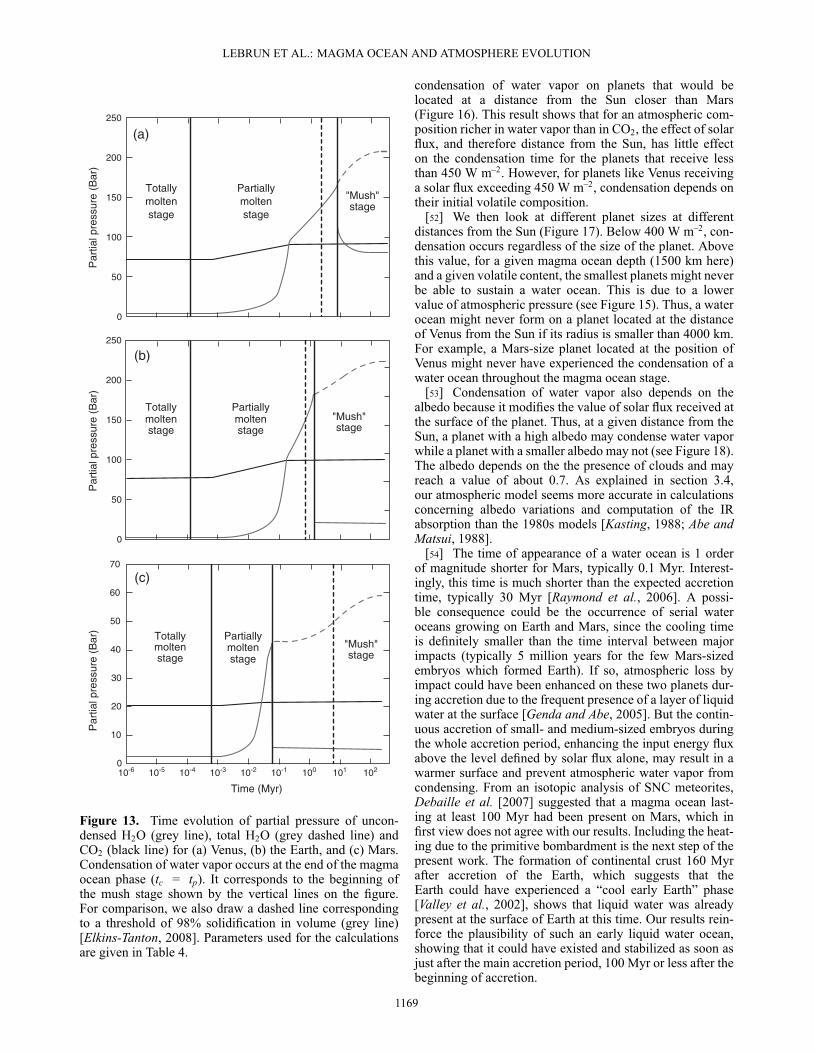
and we note that due to the relative shapes of temperatureprofiles and liquidus-solidus curves and the size of the man-tle, the Martian mantle achieves later the same solidificationstage than the two other planets. Figure 13 shows the partialpressures achieved in the atmosphere for the three planets.The duration of the magma ocean phase and condensationtime is shorter from Mars to Venus: about 10 kyr for Mars,about 1 Myr for Earth, and 10 Myr for Venus.
4. Discussion[50] The presence of the atmosphere acts to delay the
formation of a cold and viscous surface boundary layerand increase the magma ocean phase duration. Once in themush stage regime, the mantle viscosity increases, convec-tion becomes less active, and the heat flux decreases. Atthis stage, the cooling time scale is controlled by the largerconvection time scale, the atmosphere not being anymorea limiting factor for heat loss. On the contrary, when themagma ocean is totally or partially liquid, convection isactive and the chemical composition of the atmosphere playsan important role through the greenhouse effect, thus con-trolling surface temperatures and cooling time scale. Indeed,without atmosphere, the surface temperature is on the orderof 243 K (with an albedo of 0.2), a temperature corre-sponding approximately to the equilibrium temperature ofthe Earth. When an atmosphere composed of 300 bars H2Oand 100 bars CO2 overlays the magma ocean, the surfacetemperature reaches 490 K and remains constant through-out the mush stage (see Figure 3e). In our model, the watervapor exsolved from the magma ocean is instantaneouslycondensed, thus maintaining the atmospheric partial pres-sure of water vapor constant at a given surface temperature.As previously mentioned, the surface temperature is overes-timated because we do not take into account the solubilityof CO2 into water nor the precipitation of carbonates.
[51] As shown in Figure 4 and due to its high radiativepower, H2O content affects the magma ocean phase dura-tion more than CO2. If we now look at the effect of initialH2O content on the condensation time tc, Figure 14 showsthat for a solar flux below 450 W m–2 (corresponding to adistance from the Sun of about 0.73 AU), the water is ableto condense for all initial water contents. Above 450 W m–2,condensation occurs only for water content higher than1.8 � 10–2 wt %. This counterintuitive trend is due totwo competing effects: the greenhouse effect increasingsurface temperature (favors the vapor phase) and a pres-sure effect increasing with the amount of water (favors theliquid phase; see Figure 15). In addition, at partial pres-sure of water vapor higher than approximately 50 bars, thesurface temperature decreases with increasing pressure upto around 100 bars. This is due to the fact that at thisthreshold value, the infrared bands become saturated andthe infrared flux becomes constant while the net solar fluxcontinues to be decreased by Rayleigh scattering. Thus, theincoming solar radiation becomes insufficient to support therunaway greenhouse and water vapor can then condense[Zahnle et al., 1988]. The arrow in Figure 15 shows the con-densation path for an increasing initial water content for asolar flux of 500 W m–2. An initial CO2 content equiva-lent to a partial pressure of 500 bars is sufficient to prevent
1168
LEBRUN ET AL.: MAGMA OCEAN AND ATMOSPHERE EVOLUTION
10-6 10-5 10-4 10-3 10-2 10-1 100 101 102
Time (Myr)
0
10
20
30
40
50
60
70
Par
tial p
ress
ure
(Bar
)
0
50
100
150
200
250
Par
tial p
ress
ure
(Bar
)
0
50
100
150
200
250
Par
tial p
ress
ure
(Bar
)
Totallymoltenstage
Partiallymoltenstage
"Mush"stage
Totallymoltenstage
Partiallymoltenstage
"Mush"stage
Totallymoltenstage
Partiallymoltenstage
"Mush"stage
(a)
(c)
(b)
Figure 13. Time evolution of partial pressure of uncon-densed H2O (grey line), total H2O (grey dashed line) andCO2 (black line) for (a) Venus, (b) the Earth, and (c) Mars.Condensation of water vapor occurs at the end of the magmaocean phase (tc = tp). It corresponds to the beginning ofthe mush stage shown by the vertical lines on the figure.For comparison, we also draw a dashed line correspondingto a threshold of 98% solidification in volume (grey line)[Elkins-Tanton, 2008]. Parameters used for the calculationsare given in Table 4.
condensation of water vapor on planets that would belocated at a distance from the Sun closer than Mars(Figure 16). This result shows that for an atmospheric com-position richer in water vapor than in CO2, the effect of solarflux, and therefore distance from the Sun, has little effecton the condensation time for the planets that receive lessthan 450 W m–2. However, for planets like Venus receivinga solar flux exceeding 450 W m–2, condensation depends ontheir initial volatile composition.
[52] We then look at different planet sizes at differentdistances from the Sun (Figure 17). Below 400 W m–2, con-densation occurs regardless of the size of the planet. Abovethis value, for a given magma ocean depth (1500 km here)and a given volatile content, the smallest planets might neverbe able to sustain a water ocean. This is due to a lowervalue of atmospheric pressure (see Figure 15). Thus, a waterocean might never form on a planet located at the distanceof Venus from the Sun if its radius is smaller than 4000 km.For example, a Mars-size planet located at the position ofVenus might never have experienced the condensation of awater ocean throughout the magma ocean stage.
[53] Condensation of water vapor also depends on thealbedo because it modifies the value of solar flux received atthe surface of the planet. Thus, at a given distance from theSun, a planet with a high albedo may condense water vaporwhile a planet with a smaller albedo may not (see Figure 18).The albedo depends on the the presence of clouds and mayreach a value of about 0.7. As explained in section 3.4,our atmospheric model seems more accurate in calculationsconcerning albedo variations and computation of the IRabsorption than the 1980s models [Kasting, 1988; Abe andMatsui, 1988].
[54] The time of appearance of a water ocean is 1 orderof magnitude shorter for Mars, typically 0.1 Myr. Interest-ingly, this time is much shorter than the expected accretiontime, typically 30 Myr [Raymond et al., 2006]. A possi-ble consequence could be the occurrence of serial wateroceans growing on Earth and Mars, since the cooling timeis definitely smaller than the time interval between majorimpacts (typically 5 million years for the few Mars-sizedembryos which formed Earth). If so, atmospheric loss byimpact could have been enhanced on these two planets dur-ing accretion due to the frequent presence of a layer of liquidwater at the surface [Genda and Abe, 2005]. But the contin-uous accretion of small- and medium-sized embryos duringthe whole accretion period, enhancing the input energy fluxabove the level defined by solar flux alone, may result in awarmer surface and prevent atmospheric water vapor fromcondensing. From an isotopic analysis of SNC meteorites,Debaille et al. [2007] suggested that a magma ocean last-ing at least 100 Myr had been present on Mars, which infirst view does not agree with our results. Including the heat-ing due to the primitive bombardment is the next step of thepresent work. The formation of continental crust 160 Myrafter accretion of the Earth, which suggests that theEarth could have experienced a “cool early Earth” phase[Valley et al., 2002], shows that liquid water was alreadypresent at the surface of Earth at this time. Our results rein-force the plausibility of such an early liquid water ocean,showing that it could have existed and stabilized as soon asjust after the main accretion period, 100 Myr or less after thebeginning of accretion.
1169

LEBRUN ET AL.: MAGMA OCEAN AND ATMOSPHERE EVOLUTION
No water
condensation
Water condensation
500 600450 550300 400350
14
2
10
Initi
al H
2O c
onte
nt (
10 -2
Wt%
)
4
6
8
12
20
0.2
40
30
10
Vapor w
ater condensation time (M
yr)
Distance from the sun (AU)0.89 0.77 0.69 0.630.83 0.73 0.66
Figure 14. Diagram showing condition for condensation of water vapor as a function of initial H2Ocontent and solar flux. Calculations are conducted for a planet with the physical characteristics of Earth.The initial amount of CO2 is fixed at a value of 1.4 � 10–2 wt % (corresponding to 100 bars). Color scaleshows times at which condensation of water vapor occurs. Time increases from blue to red.
[55] Concerning Venus, our results suggest that the dura-tion of the magma ocean phase is much larger than on theEarth, typically 10 Myr. This time is of the same orderas the time interval between major impacts, and not muchshorter than the whole accretion time (about 30 Myr fromexisting models). Consequently, Venus could have remainedduring several tens of millions of years, that is, the wholeaccretion duration, in the magma ocean stage due to theregular melting of its mantle by major impacts. Venus isjust outside the distance of 0.66 AU from the Sun belowwhich an Earth-type planet would remain in the magma
104
103
102
101
10-1
10-2
100
10-3
400 500 600 700 1400
Temperature (K)
Pre
ssur
e (B
ar)
800 900 1000 1300
Liquid
Vapor
Critical point
Figure 15. Phase diagram for H2O. Condensation path forincreasing water content (following the black arrow) from4.3 � 10–6 to 1.4 � 10–1 wt %. The black squares representseveral initial H2O amount with an initial CO2 amount of1.4 � 10–2 wt % and a solar flux of 500 W m–2. The partialpressure of water vapor and the surface temperature for eachsquare are obtained at the end of the solidification of magmaocean (Tp � 1400 K).
ocean phase. According to our model, which does not takeinto account hydrodynamic escape at this stage, an Earth-type planet closer than 0.66 AU, and possibly Venus due tothe regular occurrence of global melting events can remainin a stable, hot, configuration following H2O outgassingduring a long time. Including H escape (and associated Ofrictional escape) would result in a progressive decreaseof the H2O partial pressure [Kasting and Pollack, 1983;Chassefière, 1996, 1997; Gillmann et al., 2009], thereforea weakening of the greenhouse effect and the condensationof the remaining water vapor at some later stage. Includinghydrodynamic escape in our model is a necessary step for amore realistic simulation of magma ocean and water oceanformation and evolution.
[56] The occurrence, or non-occurrence, of a water oceanat the beginning of Venus’ evolution, when the solar fluxwas definitely smaller than now, is a longstanding puzzlingquestion. The critical point of H2O is located at 647 K. Asshown by Matsui and Abe [1986], the surface temperature ofEarth at the end of accretion could have been�600 K, there-fore lower than the critical temperature, and water wouldhave been able to condense, as confirmed by our results.From the same authors, the temperature of Venus surface atthe end of the accretion was�700 K, larger than the criticaltemperature, potentially preventing atmospheric water fromcondensing out. Kasting [1988], taking into account thecooling effect of clouds (increasing the planetary albedo),suggested that a water ocean could have nevertheless formedat the beginning of Venus’ evolution. Our results do notallow giving a definitive answer to this question. From thepresent model, a water ocean may possibly form on Venustypically 10 Myr after a major impact melting the mantle.About 10 major impacts occurring over a typical time of30 Myr would be sufficient to prevent a water ocean fromforming during accretion. But our results show that the for-mation of an ocean of water on Venus after accretion mayor may not have happened, depending on both the initialamounts of volatiles (H2O, CO2) and any extra IR opacity
1170
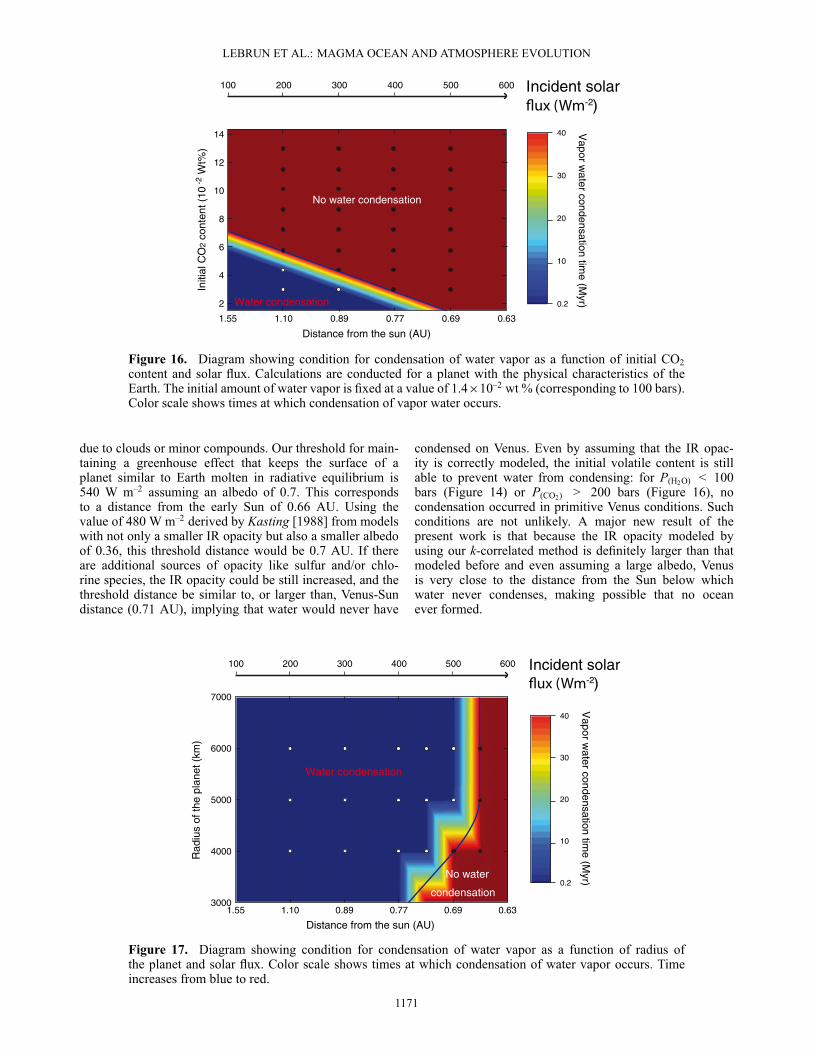
LEBRUN ET AL.: MAGMA OCEAN AND ATMOSPHERE EVOLUTION
No water condensation
Water condensation2
Initi
al C
O2
cont
ent (
10 -
2 W
t%)
4
6
8
10
12
14
300 500200 400100 600
40
30
20
10
0.2
Vapor w
ater condensation time (M
yr)
Distance from the sun (AU)
1.55 1.10 0.89 0.77 0.69 0.63
Figure 16. Diagram showing condition for condensation of water vapor as a function of initial CO2content and solar flux. Calculations are conducted for a planet with the physical characteristics of theEarth. The initial amount of water vapor is fixed at a value of 1.4�10–2 wt % (corresponding to 100 bars).Color scale shows times at which condensation of vapor water occurs.
due to clouds or minor compounds. Our threshold for main-taining a greenhouse effect that keeps the surface of aplanet similar to Earth molten in radiative equilibrium is540 W m–2 assuming an albedo of 0.7. This correspondsto a distance from the early Sun of 0.66 AU. Using thevalue of 480 W m–2 derived by Kasting [1988] from modelswith not only a smaller IR opacity but also a smaller albedoof 0.36, this threshold distance would be 0.7 AU. If thereare additional sources of opacity like sulfur and/or chlo-rine species, the IR opacity could be still increased, and thethreshold distance be similar to, or larger than, Venus-Sundistance (0.71 AU), implying that water would never have
condensed on Venus. Even by assuming that the IR opac-ity is correctly modeled, the initial volatile content is stillable to prevent water from condensing: for P(H2O) < 100bars (Figure 14) or P(CO2) > 200 bars (Figure 16), nocondensation occurred in primitive Venus conditions. Suchconditions are not unlikely. A major new result of thepresent work is that because the IR opacity modeled byusing our k-correlated method is definitely larger than thatmodeled before and even assuming a large albedo, Venusis very close to the distance from the Sun below whichwater never condenses, making possible that no oceanever formed.
No water
condensation
Water condensation
300 500200 400100 600
Rad
ius
of th
e pl
anet
(km
)
7000
6000
5000
4000
3000
40
30
20
10
0.2
Distance from the sun (AU)1.55 1.10 0.89 0.77 0.69 0.63
Vapor w
ater condensation time (M
yr)
Figure 17. Diagram showing condition for condensation of water vapor as a function of radius ofthe planet and solar flux. Color scale shows times at which condensation of water vapor occurs. Timeincreases from blue to red.
1171

LEBRUN ET AL.: MAGMA OCEAN AND ATMOSPHERE EVOLUTION
Alb
edo
0.1
0.3
0.5
0.7
0.9
0.6
0.4
0
0.2
0.8
1.0
Distance from the Sun (AU)
1 1.2 1.4 1.6 1.80.2 0.4 0.6 0.8
V E M
Figure 18. Water condensation limit (black line) as a func-tion of the planet albedo and its distance from the sun. Notethat the limit of condensation of water vapor obtained inour case is closer from Venus compared to previous work(grey line) [Abe and Matsui, 1988; Kasting, 1988]. Venus,Earth, and Mars are plotted for an albedo value of 0.63 cor-responding to the mean albedo throughout solidification ofthe magma ocean.
5. Conclusion[57] Our results suggest that after a major impact, the time
for a planetary mantle magma ocean to cool and allow thecondensation of the dense steam atmosphere into a waterocean is of the order of 1 Myr on Earth and depends onthe various parameters mentioned in the previous sections.More generally,
[58] (i) The presence of the atmosphere delays the timeat which a cold viscous thermal boundary layer forms byapproximately 1 Myr compared to a case where no atmo-sphere is present.
[59] (ii) Volatiles’ initial content, especially H2O and itsdegassing path, controls the duration of magma ocean phaseincreasing the duration of about 1 order of magnitude for1 order of magnitude difference in initial content on Earth,with a few thousands years for 1.5�10–2 wt % and 2 Myr for1.5 � 10–1 wt %. Deeper magma ocean or earlier degassingalso increases magma ocean stage duration.
[60] (iii) Initial CO2 content controls the ability to con-dense water ocean for distance from the Sun greater than0.66 AU.
[61] (iv) For an accretion phase duration shorter than5 Myr, the magma ocean phase duration might be twicelonger when taking into account 26Al abundance at earlytimes. The heat generated by long-lived elements such as U,Th, and K, is non-negligible only at the end of the solidifi-cation of the magma ocean when the heat flux falls below10 W m–2.
[62] This work has potentially important implications.First, it shows that Venus is close to the distance from theSun (0.66 AU) below which an Earth-size planet remainsin the magma ocean stage for a virtually infinite time. Thetypical time for an ocean of water on Venus to appear isof the order of 10 Myr, comparable to the duration of themain accretion sequence, suggesting that Venus could have
remained in the magma ocean stage during most of its accre-tion. Our model shows that a water ocean may or may nothave condensed on Venus after accretion, depending on thedetails of both IR radiative transfer and volatile inventory.A more realistic model including accretional heating dueto small impacts and hydrodynamic escape is required fora more detailed analysis. Accretional heating and hydro-dynamic escape of H2O are expected to play against thecondensation of water, whereas hydrodynamic escape ofCO2 should favor the formation of an ocean. Second, thetime for condensing a water ocean on Earth and Mars issmaller than 1 Myr (1 Myr for Earth and 0.1 Myr for Mars),suggesting that a water ocean could have formed in theperiods between major impacts (able to melt a significantfraction of the mantle). If serial water oceans developed onEarth and Mars during their accretion, impact erosion of theatmosphere could have been more efficient on these planets,explaining their relatively tenuous atmosphere with respectto Venus. Concerning Mars, geochemical analyses of SNCmeteorites suggest that the planet could have experienceda continuous magma ocean phase of �100 Myr [Debailleet al., 2007], which contradicts the results of our model.The reason could be that we do not take into account theaccretional heating resulting from the frequent impacts bysmall embryos.
[63] In this paper, we focused on the thermal evolutionof one magma ocean cooling sequence. We do not considerthe details of accretionary scenario. We assumed the pres-ence of a magma ocean of a given depth (which depends onthe energy injected in the system by a major impact) at acertain time of the accretion process, considered thereafteras the initial time in the model. Most of the results pre-sented in this paper concern a completely molten magmaocean resulting from a giant impact [Melosh, 1990]. A real-istic description of the full accretion sequence, with multipleimpacts and serial magma ocean phases, was beyond thescope of the present paper. In particular, we do not takeinto account, at this stage, the energy released to the planetby the continuous flux of small impactors, adding to theinput solar energy. The major goal of this paper was to con-duct a parametric study in order to define which conditionsmay favor the formation of an early water ocean and theonset of plate growth, providing habitability criteria for agiven planet under given conditions. Extending the accre-tion phase over a long period, and considering the effects of(i) major impacts melting large fractions of the mantle and(ii) frequent small impacts increasing the energy flux fromthe outside, (iii) realistic hydrodynamic escape model willbe the subject of a second paper.
Appendix A: Numerical Method
A1. Time Loop[64] From the solubility laws for H2O and CO2
(equations (16) and (17)), we determine the partial pressureof each gas in the atmosphere. These partial pressures andthe surface temperature allow to determine the heat flux atthe top of the atmosphere. This heat flux must match theheat flux at the surface of the magma ocean. Therefore,an iterative loop is used to reach a balance between thesefluxes. It is noted that the atmospheric model is limited bya threshold on the total pressure of gas of approximately
1172
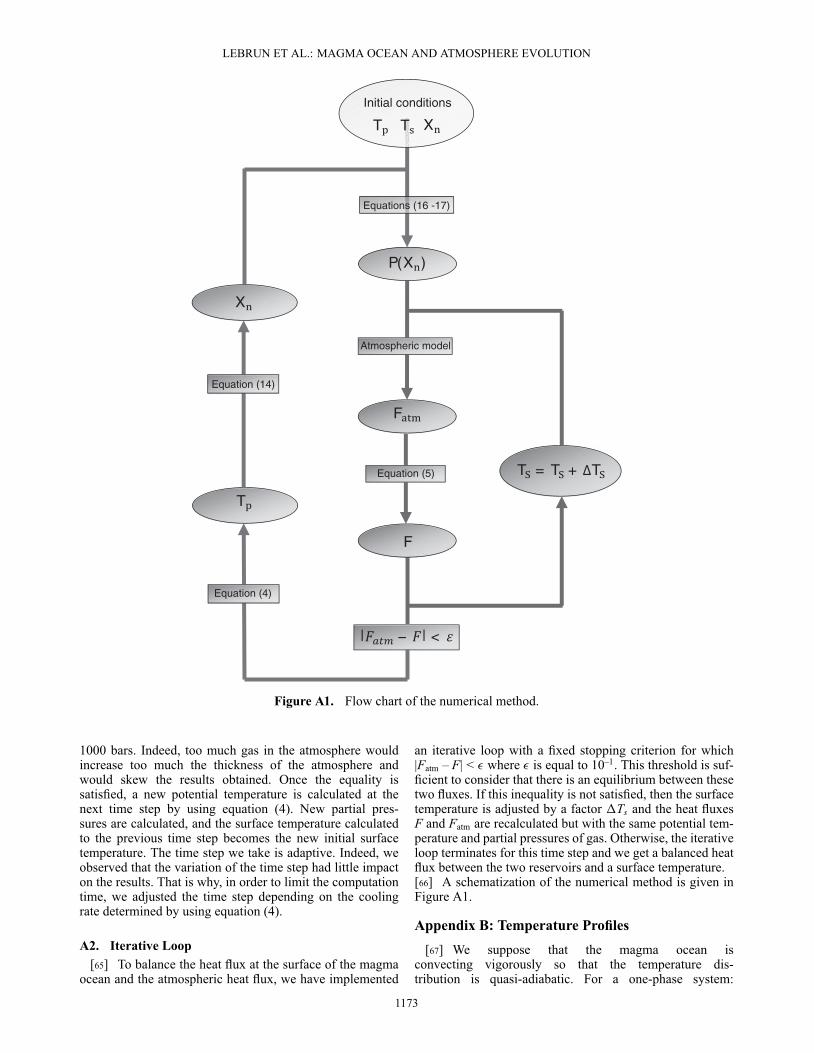
LEBRUN ET AL.: MAGMA OCEAN AND ATMOSPHERE EVOLUTION
Initial conditions
T
F
| − | <
P(X )
Equations (16 -17)
T
Equation (5)
Atmospheric model
T = T + T
Equation (4)
F
T X
X
Equation (14)
Figure A1. Flow chart of the numerical method.
1000 bars. Indeed, too much gas in the atmosphere wouldincrease too much the thickness of the atmosphere andwould skew the results obtained. Once the equality issatisfied, a new potential temperature is calculated at thenext time step by using equation (4). New partial pres-sures are calculated, and the surface temperature calculatedto the previous time step becomes the new initial surfacetemperature. The time step we take is adaptive. Indeed, weobserved that the variation of the time step had little impacton the results. That is why, in order to limit the computationtime, we adjusted the time step depending on the coolingrate determined by using equation (4).
A2. Iterative Loop[65] To balance the heat flux at the surface of the magma
ocean and the atmospheric heat flux, we have implemented
an iterative loop with a fixed stopping criterion for which|Fatm – F| < � where � is equal to 10–1. This threshold is suf-ficient to consider that there is an equilibrium between thesetwo fluxes. If this inequality is not satisfied, then the surfacetemperature is adjusted by a factor �Ts and the heat fluxesF and Fatm are recalculated but with the same potential tem-perature and partial pressures of gas. Otherwise, the iterativeloop terminates for this time step and we get a balanced heatflux between the two reservoirs and a surface temperature.[66] A schematization of the numerical method is given inFigure A1.
Appendix B: Temperature Profiles[67] We suppose that the magma ocean is
convecting vigorously so that the temperature dis-tribution is quasi-adiabatic. For a one-phase system:
1173

LEBRUN ET AL.: MAGMA OCEAN AND ATMOSPHERE EVOLUTION
dTdP
=˛T�Cp
. (B1)
[68] In the partially molten zone, the equation for anadiabat is given by [see Solomatov, 2007]
dTdP
=˛0T�C0p
, (B2)
with all variables being defined in the main text. Integratingequation (B1) between Rl and Rp in the liquid zone gives anexpression for the temperature profile as a function of thepotential temperature Tp:
T(r) = Tp exp�˛gCp
�Rp – r
�, (B3)
with T(Rl) = Tp exph˛gCp
�Rp – Rl
�i. In the partially molten
zone, integrating equation (B2) gives
T(r) = T(Rl) exp
"˛0gC0p
(Rl – r)
#, (B4)
or expressed in terms of Tp,
T(r) = Tp exp�˛gCp
�Rp – Rl
�exp
"˛0gC0p
(Rl – r)
#, (B5)
[69] For convenience, we express all temperature profilesas a function of Rp – r, so that equation (B5) is rewritten as
T(r) = A Tp exp
"˛0gC0p
�Rp – r
�#, (B6)
with A = exph˛gCp
�Rp – Rl
�iexp
h–˛0g
C0p
�Rp – Rl
�i. At the
limit Rs between the totally solid zone and partially moltenzone, T(Rs) = A Tp exp
h˛0gC0p
�Rp – Rs
�i. In the solid zone,
integrating equation (B1) gives
T(r) = T(Rs) exp�˛gCp
(Rs – r)
, (B7)
expressing equation (B8) as a function of Tp and variableRp – r leads to
T(r) = A B Tp exp�˛gCp
�Rp – r
�, (B8)
with B = exph–˛g
Cp
�Rp – Rs
�iexp
h˛0gC0p
�Rp – Rs
�i.
[70] Given these temperature profiles, constant I inequation (4) is written as
I = �m
�Cp +�H
d�dT
�Z Rp
Rl
r2 exp�˛g(Rp – r)
Cp
�dr+
AZ Rl
Rs
�
�C0p +�H
d�dT
�r2 exp
˛0g(Rp – r)
C0p
!dr+
B�s
�Cp +�H
d�dT
�Z Rs
Rb
r2 exp�˛g(Rp – r)
Cp
�dr
(B9)
andQr =
Z Rp
Rb
r2�qrdr (B10)
[71] Radii Rl, Rs, and Rb are, respectively, the planetocen-tric altitudes of the bottom of the totally liquid zone, thetop of the solid zone, and the bottom of the initially moltenmagma ocean (Figure 2), g is the gravitational accelerationand ˛ is the coefficient of volumetric thermal expansion.
[72] For a zone of partial melting, the coefficient of vol-umetric thermal expansion ˛0 and the specific heat C0p aregiven as follows [Solomatov, 2007]:
˛0 � ˛ +��
��Tliq – Tsol
� (B11)
C0p � Cp +�H�
Tliq – Tsol� (B12)
where�� is the density difference between solid and liquid.The thermal expansion coefficient is determined as follows[Abe, 1997]:
˛ = ˛0
�PK0
K0+ 1–(m–1+K0)/K0
(B13)
where P is pressure in GPa, ˛0 = 3 � 10–5 K–1,K0 = 200 GPa, K0 = 4, and m = 0 taken as the standardvalue.
[73] Acknowledgments. This work was supported by the FrenchSpace Agency CNES (Centre National d’Etudes Spatiales) and PNP(Programme National de Planétologie) from INSU (Institut National desSciences de l’Univers). This work was funded by the interdisciplinaryEPOV program of CNRS and ANR “PTECTO.” We thank two anony-mous reviewers for their careful and insightful reviews that greatly improvethe manuscript.
ReferencesAbe, Y. (1993), Thermal evolution and chemical differentiation of the
terrestrial magma ocean, Geophys. Monogr., 74, 41–54.Abe, Y. (1995), Basic equations for evolution of partially molten mantle
and core, in The Earth’s Central Part: Its Structure and Dynamics, editedby T. Yukutake, pp. 215–235, TERRAPUB, Tokyo, Japan.
Abe, Y. (1997), Thermal and chemical evolution of the terrestrial magmaocean, Phys. Earth Planet, 100, 27–39.
Abe, Y., and T. Matsui (1985), The formation of an impact-generated H20atmosphere and its implications for the thermal history of the Earth, J.Geophys. Res., 90(suppl.), C545–C559.
Abe, Y., and T. Matsui (1986), Early evolution of the Earth: Accretion,atmosphere formation, and thermal history, J. Geophys. Res., 91(suppl.),E291–E302.
Abe, Y., and T. Matsui (1988), Evolution of an impact-generated H2O-CO2atmosphere and formation of a hot proto-ocean on Earth, J. Atmos. Sci.,45, 3081–3101.
Ahlers, X. H., D. Funfschilling, H. Nobach, E. Bodenschatz, and G. Ahlers(2012), Transition to the ultimate state of turbulent Rayleigh-Bénardconvection, Phys. Rev. Lett., 108, 024502.
Allègre, C. J., J.-P. Poirier, E. Humler, and A. W. Hofmann (1995),The chemical composition of the Earth, Earth. Planet. Sci. Lett., 134,515–526.
Andrault, D., N. Bolfan-Casanova, G. L. Nigro, M. A. Bouhifd, G.Garbarino, and M. Mezouar (2011), Solidus and liquidus profiles ofchondritic mantle: Implication for melting of the Earth across its history,Earth. Planet. Sci. Lett., 304, 251–259.
Androvandi, S., A. Davaille, A. Limare, A. Fouquier, and C. Marais (2011),At least three scales of convection in a mantle with strongly temperature-dependent viscosity, Phys. Earth Planet. Int., 188, 132–141.
Arzi, A. (1978), Critical phenomena in the rheology of partially meltedrocks, Tectonophysics, 44, 173–184.
Bercovici, D., Y. Ricard, and M. A. Richards (2000), The relation betweenmantle dynamics and plate tectonics: A primer, in AGU GeophysicalMonograph 21: The History and Dynamics of Global Plate Motions,edited by M. A. Richards, R. Gordon, and R. Van der Hilst, AGU,Washington DC, 5–46.
1174

LEBRUN ET AL.: MAGMA OCEAN AND ATMOSPHERE EVOLUTION
Breuer, D., and W. B. Moore (2007), Dynamics and thermal history ofthe terrestrial planets, the Moon, and Io, Treatise of Geophysics, 7,89–165.
Caroll, M. R., and J. R. Holloway (Eds.) (1994), Volatiles in Magma,vol. 30, Mineralogical Society of America, Fredericksburg, Va.
Castaing, B., et al. (1989), Scaling of hard turbulence in Rayleigh-Bernardconvection, J. Fluid Mech., 204, 1–30.
Chassefière, E. (1996), Hydrodynamic escape of hydrogen from a hotwater-rich atmosphere: The case of Venus, J. Geophys. Res., 101,26,039–26,056.
Chassefière, E. (1997), Loss of water on the young Venus: The effect of astrong primitive solar wind, Icarus, 126, 229–232.
Chavanne, X., F. Chilà, B. Castaing, B. Hébral, B. Chabaud, and J.Chaussy (1997), Observation of the ultimate regime in Rayleigh-Bénardconvection, Phys. Rev. Lett., 79(19), 3648–3651.
Conrad, C. P., and B. H. Hager (1999), Effects of plate bending and faultstrength at subduction zones on plate dynamics, J. Geophys. Res., 104,17,551–17,571, doi:10.1029/1999JB900149.
Davaille, A., and A. Limare (2007), Laboratory studies of mantle convec-tion, Treatise of Geophysics, 7, 89–165.
Davies, G. F. (1999), Dynamic Earth: Plates, Plumes, and Mantle Convec-tion, 458, Cambridge University Press, Cambridge, UK.
Debaille, V., A. D. Brandon, Q. Y. Yin, and B. Jacobsen (2007), Coupled142nd-143nd evidence for a protoacted magma ocean in Mars, Nature,450, 525–528.
Elkins-Tanton, L. (2008), Linked magma ocean solidification and atmo-spheric growth for Earth and Mars, Earth. Planet. Sci. Lett., 271,181–191.
Elkins-Tanton, L. (2012), Magma oceans in the inner solar system, Annu.Rev. Earth Planet. Sci., 40, 113–139.
Fiquet, G., A. L. Auzende, J. Siebert, A. Corgne, H. Bureau, H. Ozawa, andG. Garbarino (2010), Melting of peridotite to 140 gigapascals, Science,329, 1516–1518.
Genda, H., and Y. Abe (2005), Enhanced atmospheric loss on protoplan-ets at the giant impact phase in the presence of oceans, Nature, 433,842–844.
Gillmann, C., E. Chassefière, and P. Lognonné (2009), A consistent pictureof early hydrodynamic escape of Venus atmosphere explaining presentNe and Ar isotopic ratios and low oxygen atmospheric content, EarthPlanet. Sci. Lett., 286, 503–513.
Grossmann, S., and D. Lohse (2000), Scaling in thermal convection: Aunifying theory, J. Fluid Mech., 407, 27–56.
Hirschmann, M. M. (2009), Partial melt in the oceanic low velocity zone,Phys. Earth Planet. Inter., 179, 60–71.
Horner, J., O. Mousis, J.-M. Petit, and B. W. Jones (2009), Differencesbetween the impact regimes of the terrestrial planets: Implications forprimordial d:h ratios, Planet. Space Sci., 57, 1338–1345.
Hostetler, C. J., and M. J. Drake (1980), On the early global melting of theterrestrial planets, Proceeding of the 11th Lunar and Planetary ScienceConference, pp. 1915–1929, Houston, Tex.
Jaupart, C., and G. Brandeis (1986), The stagnant bottom layer of convect-ing magma chambers, Earth. Planet. Sci. Lett., 80, 183–199.
Jaupart, C., and J.-C. Mareschal (2011), Heat Generation and Transport inthe Earth, Cambridge University Press, New York.
Javoy, M. (1999), Chemical earth models, C. R. Acad. Sci. Paris, 329,537–555.
Karato, S. I., and P. Wu (1993), Rheology of the upper mantle: A synthesis,Science, 260, 771–778.
Karki, B. B., and L. P. Stixrude (2010), Viscosity of MgSiO3 liquidat Earth’s mantle conditions: Implications for an early magma ocean,Science, 328, 740–742.
Kasting, J. F. (1988), Runaway and most greenhouse atmospheres and theevolution of Earth and Venus, Icarus, 74, 472–494.
Kasting, J. F., and J. B. Pollack (1983), Loss of water from Venus. I.Hydrodynamic escape of hydrogen, Icarus, 53, 479–508.
King, E. M., S. Stellmach, and J. M. Aurnou (2012), Heat transferby rapidly rotating Rayleigh-Bénard convection, J. Fluid Mech., 691,568–582.
Korenaga, J. (2006), Archean geodynamics and the thermal evolution ofEarth, in Archean Geodynamics and Environments: Geophysical Mono-graph, 64, edited by K. Benn et al., pp. 7–32, AGU, Washington,D. C.
Kraichman, R. H. (1962), Turbulent thermal convection at arbitrary Prandtlnumber, Phys. Fluid., 5, 1374–1389.
Labrosse, S., J. W. Hernlund, and N. Coltice (2007), A crystallizing densemagma ocean at the base of Earth’s mantle, Nature, 450, 866–869.
Lodders, K., and B Fegley (1998), The Planetary Scientist’s Companion,Oxford University Press, New York.
Lowman, J. P. (2011), Mantle convection models featuring plate tectonicbehavior: An overview of methods and progress, Tectonophysics, 510,1–16.
Malkus, W. V. R. (1954), Discrete transitions in turbulent convection, Proc.R. Soc. Lond. A, 225, 185–195.
Marcq, E. (2012), A simple 1d radiative-convective atmospheric modeldesigned for integration into coupled models of magma ocean planets,J. Geophys. Res, 117, E01,001.
Matsui, T., and Y. Abe (1986), Evolution of an impact-induced atmosphereand magma ocean on the accreting Earth, Nature, 319, 303–305.
McDonougha, W. F., and S.-s. Sun (1995), The composition of the Earth,Chem. Geol., 120, 223–253.
Mei, S., W. Bai, T. Hiraga, and D. L. Kohlstedt (2002), Influence of melt onthe creep behavior of olivine-basalt aggregates under hydrous conditions,Earth Planet. Sci. Lett., 201, 491–507.
Melosh, H. J. (1990), Giant impacts and the thermal state on the early Earth,in Origin of the Earth, edited by H. Newsom, and J. Jones, pp. 69–83,Oxford University Press, New York.
Nakajima, S., Y. Hayashi, and Y. Abe (1992), A study on the “run-away greenhouse effect” with a one-dimensional radiative-convectiveequilibrium model, J. Atmos. Sci., 49, 2256–2265.
Nomura, R., H. Ozawa, S. Tateno, K. Hirose, J. Hernlund, S. Muto, H. Ishii,and N. Hiraoka (2011), Spin crossover and iron-rich silicate melt in theEarth’s deep mantle, Nature, 473, 199–202.
Pan, V., J. R. Holloway, and R. L. Hervig (1991), The pressure and temper-ature dependence of carbon dioxide solubility in tholeiitic basalt melts,Geochim. Cosmochim. Acta., 55, 1587–1595.
Priestley, C. H. B. (1957), Convection from the Earth’s surface, Proc. R.Soc. Lond., A238, 287–304.
Priestley, C. H. B. (1959), Turbulent Transfer in Lower Atmosphere, 130,Univ. Chicago Press, Chicago.
Rasool, S. I., and C. de Bergh (1970), The runaway greenhouse andaccumulation of CO2 in the Venus atmosphere, Nature, 226, 1037–1039.
Raymond, S. N., T. Quinn, and J. I. Lunine (2006), High-resolution simu-lations of the final assembly of earth-like planets. I. Terrestrial accretionand dynamics, Icarus, 183, 265–282.
Reese, C., and V. S. Solomatov (2006), Fluid dynamics of local martianmagma oceans, Icarus, 184, 102–120.
Roscoe, R (1952), The viscosity of suspensions of rigid spheres, Br. J. Appl.Phys., 3, 267–269.
Rybach, L (1988), Determination of heat production rate, in Handbook ofTerrestrial Heat-Flow Density Determination, edited by R. Haenel et al.,pp. 125–142, Kluwer Academic Publishers, The Netherlands.
Samuel, H. (2012), A re-evaluation of metal diaper breakup and equili-bration in terrestrial magma oceans, Earth. Planet. Sci. Lett., 313-314,105–114.
Schubert, G., D. L. Turcotte, and P. Olson (2001), Mantle in the Earth andPlanets, Cambridge University Press, Cambridge, U. K.
Shimazu, Y., and T. Urabe (1968), An energetic study of the evo-lution of the terrestrial and cytherean atmospheres, Icarus, 9,498–506.
Siggia, E. D. (1994), High Rayleigh number convection, Annu. Rev. FluidMech., 26, 137–168.
Solomatov, V. S., and L. N. Moresi (1997), Three regimes of mantle con-vection with non-Newtonian viscosity and stagnant lid convection on theterrestrial planets, Geophys. Res. Lett., 24, 1907–1910.
Solomatov, V. (2000), Fluid dynamics of magma oceans, in Origin of theEarth and Moon, edited by R. Canup, and K. Righter, pp. 323–338, Univ.of Arizona Press, Tucson, Ariz.
Solomatov, V. S. (2007), Magma oceans and primordial mantle differentia-tion, Treatise on Geophysics, 9, 91–120.
Sramek, O., L. Milelli, Y. Ricard, and S. Labrosse (2011), Thermal evolu-tion and differentiation of planetesimals and planetary embryos, Icarus,217, 339–354.
Suckale, J., J. A. Sethian, J. Yu, and L. T. Elkins-Tanton (2012), Crystalsstirred up: 1. Direct numerical simulations of crystal settling in nondilutemagmatic suspensions, J. Geophys. Res., 117, E08004.
Takahashi, E., T. Shimazaki, Y. Tsuzaki, and H. Yoshida (1993), Meltingstudy of a peridotite klb-1 to 6.5 gpa, and the origin of basaltic magmas,Phil. Trans. R. Soc. Lond. A, 342, 105–120.
Taylor, S. R., and S. M. McLennan (1995), The geochemical evolution ofthe continental crust, Reviews of Geophysics, 33, 241–265.
Tonks, W. B., and H. J. Melosh (1993), Magma ocean formation due togiant impacts, J. Geophys. Res., 98, 5319–5333.
Turner, J. S., and I. H. Campbell (1986), Convection and mixing in magmachambers, Earth-Sciences Reviews, 23, 255–352.
Valley, J. W., W. H. Peck, E. M. King, and S. A. Wilde (2002), A cool earlyearth, Geology, 30, 351–354.
Van Hunen, J., P. E. van keken, A. Hynes, and G. F. Davies (2008),Tectonics of Early Earth: Some Geodynamic Considerations, edited by
1175
LEBRUN ET AL.: MAGMA OCEAN AND ATMOSPHERE EVOLUTION
K. C. Condie and V. Pease, p. 440, The Geological Society of AmericaSpecial Paper, Boulder, Colo.
Wood, J. A., J. S. Dickey, U. B. Marvin, and B. N. Powell (1970),Anorthosites and a geophysical model of the moon, Proceedings ofthe Apollo 11 Lunar Planetery Science Conference, pp. 965–988,Houston, Tex.
Zahnle, K. J., J. F. Kasting, and J. B. Pollack (1988), Evolu-tion of a steam atmosphere during Earth’s accretion, Icarus, 74,62–97.
Zahnle, K., N. Arndt, C. Cockell, A. Halliday, E. Nisbet, F. Selsis, andN. H. Sleep (2007), Emergence of a habitable planet, Space Sci. Rev., 129,35–78.
Zerr, A., and R. Boehler (1993), Melting of (Mg, Fe) SiO3-perovskiteto 625 kilobars: Indication of a high melting temperature in the lowermantle, Science, 262, 553–555.
Zerr, A., and R. Boehler (1994), Constraints on the melting tempera-ture of the lower mantle from high-pressure experiments on mgo andmagnesiowustite, Nature, 371, 506–508.
1176