Thermal Energy Storage in Greater...
164
Thermal Energy Storage in Greater Copenhagen A study of the role of calculative devices and social perceptions in facilitating the implementation of thermal energy storage in Greater Copenhagen Master’s Thesis MSc in Engineering Sustainable Cities Department of Planning Authors Nis Bertelsen Uni R. Petersen Supervisor Peter Karnøe
Transcript of Thermal Energy Storage in Greater...

Thermal Energy Storage in Greater Copenhagen
A study of the role of calculative devices and social perceptions
in facilitating the implementation of thermal energy storage in Greater Copenhagen
Master’s Thesis MSc in Engineering Sustainable Cities Department of Planning Authors Nis Bertelsen Uni R. Petersen Supervisor Peter Karnøe
AalborgUniversityCopenhagenSemester:Sustainable Cities 4st semester
Projecttitle:Thermal Energy Storage in Greater Copenhagen: A study of the role of calculative devices and social perceptions in facilitating the implementation of thermal energy storage in Greater Copenhagen Projectperiod:Feb. 1th 2017 – Jun. 9th 2017 Semestertheme:Master thesis Supervisor(s):Peter Karnøe
Copyright©2017.Thisreportandenclosedmaterialmaynotbepublishedwithoutthewrittenconsentoftheauthors.
Authors:Nis Bertelsen Uni Reinert Petersen
Summary:This report examines the issues of implementing Pit Thermal Energy Storage (PTES) which actors of the Greater Copenhagen district heating (DH) system currently face. The issue is characterized by a catch-22 situation: In order to invest in the technology, actors need to know which benefits they will get. However, before the investment is made and the technology implemented, the actors cannot know exactly which benefits it will entail.
This report takes an interdisciplinary approach to the issue at hand, and combines inquiry into the actors’ valuations of the PTES with techno-economic energy system modelling. By analysing which valuations are deployed by the actors, knowledge about which potential benefits actors will prefer is gained. By combining this with a calculative demonstration of the potential benefits through energy system modelling, the PTES’ effects are made visible to the actors.
Several valuation framings are identified among the actors. While some suggestions overlap, others diverge, suggesting a situation of uncertainty concerning the properties of the PTES. As the energy system model is able to support some framings while rejecting others, the demonstration can decrease the uncertainty around the benefits from the PTES. These benefits include increased CHP production, lowered natural gas boiler production and decreased heat expenses for transmission companies.
Based on these two analyses, a business model is proposed, describing possible ways of sharing the investment between the actors who stand to gain benefits.
Aalborg University Copenhagen A.C. Meyers Vænge 15 2450 København SV
i
Preface This report is the product of authors’ master’s thesis written on the 4th semester of the Master of Science in Engineering in Sustainable Cities at Aalborg University Copenhagen, under the supervision of professor Peter Karnøe. The report was written in the period from February 1st to June 9th, 2017.
The report focuses on the potentials and the conditions for implementing thermal energy storage in the Greater Copenhagen district heating system. The topic is relevant, as stakeholders in the industry are currently facing issues of uncertainty. The aim of the report is therefore to contribute to the process of implementing thermal energy storage in district heating systems, by producing scientific knowledge of the social, technical and economic conditions which co-shape the potentials of implementing the technology in the existing system. The report thus draws on relevant literature, interviews with relevant stakeholders and a comprehensive energy system analysis using the modelling tool EnergyPRO.
For referencing, the Chicago Manual of Style 16th Edition is used, and thus references given in the text include the author’s name and the year of the publication, e.g. (Jensen 2017). The bibliography is available in the end of the report, presenting the authors in alphabetical order according to surname. Figures and tables are numbered sequentially according to chapter. The currency used for economic values is 2016 DKK, whereas values originally in € are converted at a rate of 7.45 DKK/€.
Several people have provided valuable inputs to the making of this report, and for this the authors would like to express their sincerest gratitude. The authors were originally made aware of the topic through the energy systems consultancy company Ea Energy Analysis, in which one of the authors was an intern. Furthermore, throughout the process of making this report, Jesper Werling and Anders Kofoed-Wiuff, partners at Ea, provided valuable inputs to how to access and analyse the topic. Access to EnergyPRO was made possible by EMD International A/S, with valuable help provided by Christian Frandsen. Moreover, numerous interviewees enlightened the authors of the complexity of the topic, and thus the authors would also like to thank:
• Morten Stobbe, Vice President, and Jens Brandt Sørensen, project developer at VEKS • Uffe Schleiss, technical manager at Høje Taastrup District Heating • Klaus W. Jensen, Vice President at KARA/NOVEREN • Peter Folke, economist at Varmelast.dk • Mia Nordqvist Nielsen and Niels Hendriksen, energy planners at HOFOR
Finally, the authors would like to thank Peter Karnøe for supervision and guidance throughout the project period.

ii
Abbreviations
ARC Amager Ressource Center
AMV Amagerværket
AVV Avedøreværket
CTR Centralkommunernes Transmissionsselskab I/S
CHP Combined Heat and Power
DEA Danish Energy Agency
DH District Heating
ES Energy Storage
CPH-DHS Greater Copenhagen District Heating System
HCV H. C. Ørstedsværket
HP Heat Pump for district heating
HOFOR Hovedsstadsområdets Forsyningsselskab
K/N Kara/Novoren
KKV Køge Kraftvarmeværk
LCOE Levelized Cost Of Energy
O&M Operations and Maintenance
PTES Pit Thermal Energy Storage
RES Renewable Energy Sources
STS Science and Technology Studies
SBI Statens Byggeforskningsinstitut
TTES Tank Thermal Energy Storage
TES Thermal Energy Storage
VPH Varmeplan Hovedstaden
VEKS Vestegnens Kraftvarmeselskab I/S
VF Vestforbrænding

iii
TableofContents
Preface....................................................................................................................................i
Abbreviations.........................................................................................................................ii
1Introduction........................................................................................................................11.1Technicalthermalenergystoragepotential................................................................................21.2Thesituatedknowledgeofactorsandtheperceptionoftechnology..........................................21.3Makingvaluevisiblethroughcalculativedemonstrations...........................................................31.4ResearchQuestion......................................................................................................................41.5Reportstructure.........................................................................................................................5
2Methodology.......................................................................................................................72.1Researchapproach.....................................................................................................................72.2Theoriesofscience.....................................................................................................................82.3EpistemologicalprocessesinScienceandTechnologyStudies....................................................8
3TheoreticalFramework......................................................................................................133.1Valuationprocessesofnoveltechnologies................................................................................13
3.1.1Valuationframes......................................................................................................................14
3.1.2Theroleofcalculativedevices–bringinginnovationsintobeing............................................15
3.2Anovelapproachtobusinessmodels.......................................................................................163.3Summary..................................................................................................................................18
4Datagenerationandmethods...........................................................................................214.1Interviews................................................................................................................................21
4.1.1Thematization...........................................................................................................................22
4.1.2Design.......................................................................................................................................22
4.1.3Conductingtheinterview.........................................................................................................24
4.1.4Transcription.............................................................................................................................24
4.1.5Analysis.....................................................................................................................................24
4.1.6Verification...............................................................................................................................24
4.1.7Reporting..................................................................................................................................25
4.1.8Limitationsoftheinterviewmethod........................................................................................25
4.2EnergyPROmodelling...............................................................................................................254.2.1Setupoftheanalysis.................................................................................................................26
4.2.2Businesseconomiccalculations................................................................................................28
4.2.3Modellimitations......................................................................................................................28
4.3LiteratureStudy........................................................................................................................294.3.1VarmeplanHovedstaden..........................................................................................................29
4.3.2TheDanishEnergyAgency’sTechnologyCatalogue.................................................................29
4.3.3Peer-reviewedacademicliterature..........................................................................................30
5Classificationofthermalenergystoragetechnologies.......................................................33

iv
5.1Energystoragetechnologies.....................................................................................................335.2PotentialTEStechnologies........................................................................................................35
5.2.1TankThermalEnergyStorage(TTES)........................................................................................35
5.2.2PitThermalEnergyStorage(PTES)...........................................................................................36
5.2.3SummaryofTEStechnologies..................................................................................................37
6ThedistrictheatingsystemofGreaterCopenhagen...........................................................396.1Thesystems,companiesandplants..........................................................................................39
6.1.1Transmissioncompanies...........................................................................................................39
6.1.2Theplants.................................................................................................................................40
6.2VarmeplanHovedstaden..........................................................................................................416.3Thedistrictheatingmarketarchitecture...................................................................................42
6.3.1Loadschedulingofplants.........................................................................................................42
6.3.2Determiningtheheatprice......................................................................................................44
6.4Summary..................................................................................................................................45
7ThevaluationframingsofthePTES....................................................................................477.1VEKS.........................................................................................................................................477.2HøjeTaastrupDistrictHeating..................................................................................................497.3KARA/NOVEREN.......................................................................................................................507.4Varmelast.dk............................................................................................................................517.5HOFOR......................................................................................................................................527.6Discussionofvaluationframes.................................................................................................54
8TechnicalimpactofPTESimplementation.........................................................................598.1Referencescenario...................................................................................................................59
8.1.1CPH-DHSheatproduction.........................................................................................................59
8.2HøjeTaastrupDistributionsystem............................................................................................628.3SystemimpactofPTESimplementation....................................................................................63
8.3.1Productionunitimpact.............................................................................................................63
8.3.2Changeinfuelconsumption.....................................................................................................64
8.3.3Changeinelectricityproduction...............................................................................................64
8.3.4Changeinwasteincinerationoperation...................................................................................65
8.4PTESoperation.........................................................................................................................698.5Transmissioncompanyimpacts................................................................................................71
8.5.1TheheatproductionforVEKS,CTRandVF...............................................................................71
8.6SummaryoftechnicalimpactsfromPTESimplementation.......................................................73
9EconomicimpactofPTESimplementation.........................................................................779.1Systemeconomyimpact...........................................................................................................779.2Transmissioncompanyimpact..................................................................................................78
9.2.1VEKSeconomyimpacts.............................................................................................................78
9.2.2CTReconomyimpacts..............................................................................................................79
9.2.3VFeconomyimpacts.................................................................................................................80
9.3Productionplantimpact...........................................................................................................81

v
9.4SummaryofeconomicimpactofimplementingPTES................................................................82
10Discussionofresults........................................................................................................8510.1“Reducingpeakproduction”...................................................................................................8510.2“IncreasingCHPproduction”...................................................................................................8510.3“Systemeconomyandoptimization”......................................................................................8510.4“Usingexcessheat”................................................................................................................8610.5“Flexibleincinerationplantrenovation”and“Increasedsummerdemand”............................8610.6“Delivertotransmissiongridviareturnorbooster”................................................................8610.7Summary................................................................................................................................87
11DevelopingabusinessmodelforaPTES..........................................................................8911.1Setupofthebusinessmodel...................................................................................................8911.2ClassificationofPTESinvestment............................................................................................9211.3Potentialrevenuemodelalternatives.....................................................................................92
11.3.1Sharedinvestment..................................................................................................................92
11.3.2Investmentbasedonareductioninheatsalesprices............................................................93
11.3.3Marginalpricingbusinessmodel............................................................................................95
11.4Implicationsoftheproposedrevenuemodels........................................................................96
12Conclusion.......................................................................................................................9912.1Valuationframes....................................................................................................................9912.2Technicalcalculativemodel..................................................................................................10012.3Businessmodel.....................................................................................................................10012.4Applyingthegeneratedknowledge......................................................................................101
13Epilogue..........................................................................................................................103
14Bibliography...................................................................................................................107
Listoffigures.......................................................................................................................110
Listoftables........................................................................................................................112
AppendixAModelSetup.....................................................................................................115
AppendixBInterviewguides...............................................................................................125
AppendixCPlantCharacteristics.........................................................................................131
AppendixDEnergyPROOutput...........................................................................................132


1
1 Introduction Several stakeholders in the Greater Copenhagen district heating system (CPH-DHS) currently seek to increase the Thermal Energy Storage (TES) capacity of the system. Initial studies conducted by the various actors have shown, that this would contribute to the shift from fossil fuel powered peak boilers to biomass combined heat and power plants (CHP), thus decreasing costs for energy system actors and being in line with established low carbon goals.
However, as it is uncertain how the benefits of a TES are distributed among the stakeholders of the system, they face issues regarding the coordination of the investment. To reduce this uncertainty, the potentials of TES implementation must be demonstrated and made visible to the actors by calculations and narratives. Currently, this is a task which one of the Greater Copenhagen transmission companies, VEKS1, is trying to perform, and a task which this report is seeking to contribute to.
The effects of a TES are relatively well known in decentral district heating (DH) systems, where one plant typically owns and operates the units and the grid. In such cases, it is rather simple to establish the effect of TES implementation, and there are no actors who must share investments and profits. In the CPH-DHS, however, this is different. In such complex multi-actor DH systems with several types of heat producing technologies, multiple stakeholders may profit in different ways from the implementation of a new TES. In this system, four CHP plants and three waste incineration plants are delivering heat to two transmission companies and several distributions companies. The district heating companies also own their own peak boiler capacities and other heat production technologies to ensure stable and efficient supply. Furthermore, as several plants are online at the same time, it is not possible to establish which exact plants are delivering to and utilizing the storage at a specific time. Therefore, investing in the technology is no longer the issue of one single plant, but concerns multiple stakeholders.
If multiple stakeholders are going to harvest benefits from the TES, surely, they should also contribute to its implementation. However, if stakeholders are going to invest in the technology, they need reassurance that they will indeed harvest benefits from its implementation reflecting their share of the investment. As such, the stakeholders find themselves in a catch-22 situation: To invest in the technology, they need to know what benefits they will get. However, before the investment is made and the technology implemented, they cannot know exactly which benefits it will entail. Currently several stakeholders agree, that a TES will improve the DH system economy. Nevertheless, for them to move forward, a further qualification of the impacts for the specific actors is needed.
1 A detailed description of VEKS and other actors in the DH system is presented in Chapter 6

2
1.1 Technical thermal energy storage potential Several analyses show the potential of integrating the electricity and heating sectors as the first step towards a flexible and integrated energy system, especially with large potential in energy systems with DH (Lund et al. 2010, 2014; Mathiesen, Lund, and Connolly 2014). DH systems enable the use of waste heat from co-generation at power plants, which improves fuel efficiency considerably.
Challenges emerge from coordinating heat and power production from CHP plants in times of either high electricity demand and low heat demand or vice versa, as the heat and power outputs are co-produced. Even though extraction CHP plants can adjust their power-to-heat ratio, they lose fuel efficiency in full condensation mode (only generating electricity). During high electricity price hours, production can be limited in case of low heat demand, while CHP plants can be forced to run during low electricity price hours due to high heat demand. A TES allows the co-production of heat and power while storing the thermal energy for later usage (Verda and Colella 2011; Lee 2013). TES is a well-known and developed technology used in several district heating networks for optimizing the co-production of heat and power. Two commonly used TES technologies exist in Danish DH systems today, Tank Thermal Energy Storage (TTES) and Pit Thermal Energy Storage (PTES). While some TTES capacity is installed at CHP plants in the CPH-DHS, no PTES capacity is installed. However, actors currently seek to increase PTES capacity, and therefore this report investigates the potentials of this technology. Danish examples are regarded as best-practice examples (DEA 2015; PlanEnergi 2016), but these are primarily situated in decentral DH systems in Jutland.
1.2 The situated knowledge of actors and the perception of technology
While the scientific literature has developed well established knowledge about the potential for using PTES with single plants and in decentral DH systems, less knowledge exists about their impact in complex multi-plant DH systems such as that of Greater Copenhagen. As the technical, organizational and institutional setups differ from decentral to central DH areas, it is not simple to transfer knowledge from one setting to another. As mentioned above, it is difficult to establish which actors receive which benefits from PTES implementation. Furthermore, it is not certain that the actors seek the same benefits. While CHP operators will likely wish to increase their production, or produce during peak electricity price hours, distribution companies may seek to lower peak boiler consumption. It is not a simple issue to determine which benefits actors are after, and which benefits they are likely to receive.
The implementation of the PTES is therefore more than merely a technical issue, it also entails a social dimension. This report takes an epistemological relativist position towards technology, and argues that technologies exist in relation to the wider socio-technical network within which they are constituted (Bijker and Law 1997). Furthermore, as will be shown in later chapters, the stakeholders perceive the PTES in relation to their specific situation and position in the socio-technical network, and as such there is no “true” or “pure” form of technology which can be reached through scientific inquiry. Technology and practice rather exist through the perception of

3
the actors’ situated knowledge. Just as the pedestrian and SUV driver will have different perceptions of car traffic, so will the CHP plant operator and the director of a transmission company have different perceptions of a PTES. Therefore, it is necessary to understand the different valuations deployed by the actors of the field.
1.3 Making value visible through calculative demonstrations If agreement and a mutual understanding of the PTES is to be reached, it must be qualified and valued. As the actors are uncertain about the benefits of the PTES, the potentials must be qualified and demonstrated. For the actors to commit to an investment, they must have some idea about which benefits they are likely to receive. By using calculative demonstrations (Jensen, Cashmore, and Elle 2017; Muniesa et al. 2017), the PTES can be revealed and thereby the actors will be able to visualize their own roles and benefits. Mitchell (2008) argues that when Thomas Edison proposed his electrical systems for investors, they were not enrolled by the precision of his calculations, but by his ability to visualize their roles. Just at Edison’s demonstrations allowed him to enrol allies, so can demonstration of the PTES enrol the actors of the CPH-DHS to support the PTES. Energy system models can make the demonstration of technical impacts visible. While such calculative demonstrations will never be true representations of reality, they possibly produce realities that enable the involved actors to engage in the shaping of the PTES.
Just as energy system modelling is an enactment of reality, so is the business model. A business model is perceived as one form of a calculative device, that presents the given investment in a certain framing, to meet the investors particular valuation (Doganova and Eyquem-Renault 2009). Therefore, it is a tool to make the PTES visible to the actors. These devices are not seen as objective representations of reality, but as specific framings, bringing a given object into being. The process of describing objects make them visible, and thereby real. Their purpose and ability is to enrol actors into their narrative of investment, by showcasing the given object as calculations and figures.
The purpose of this report is thereby to demonstrate the potential of implementing a PTES in the CPH-DHS system, while considering the specific framings and understandings of the actors in question. Based on the analysis of actor perceptions and calculative demonstrations, this report will propose a business model, to be used in the work of enrolling actors in the investment of a PTES.

4
1.4 Research Question Based upon this presentation and understanding of the subject in question, the following overall research question is posed:
How can model-based knowledge be applied for facilitating the implementation of a PTES in the Greater Copenhagen district heating system?
With the following sub questions explicating the subject matter:
• Which different perceptions and valuations of the properties of a PTES can be identified among the actors of the system?
• How can a technical calculative model demonstrate the benefits of a PTES? • How can the actors’ perceptions and valuations of the demonstrated benefits be integrated in a business
model enabling the actors to envision their role in the collective investment?

5
1.5 Report structure This report consists of 13 chapters plus bibliography and appendices. The report structure is illustrated in Figure 1.1 to the right.
Chapters 2 develops the scientific foundation for this research project, as it includes methodological considerations for designing the research process with the chosen theories and methods.
Chapter 3 presents the theoretical framework used to analyse the identified subject matter, while chapter 4 presents the methods used for data generation.
Chapter 5 provides a description of the TES technology, including its role and potentials for the energy system. This chapter also compares two relevant technologies, i.e. the TTES and the PTES, and recommends the PTES as the suitable technology to pursue in in the CHP-DHS.
Chapter 6 presents the CPH-DHS as a socio-technical network of organisations, technologies and a specific market architecture.
Chapter 7 is an analysis of how the actors of the CPH-DHS perceive and value a PTES. Thereby, this chapter investigates the first research sub-question.
Chapters 8 and 9 demonstrate and analyse the technical and economic impact from implementing a PTES in the CPH-DHS. The former is an analysis of the technical impacts of implementing a PTES in the system, while the latter is an analysis of the economic impacts from implementing a PTES. Thus, this chapter investigates the second research sub question.
Chapter 10 compares the obtained results from the valuation analysis and the EnergyPRO analysis, and discusses how accurate the valuations are compared to the demonstrated impacts of the PTES, as well as contemplates on the significance of these conditions for the implementation of the PTES.
Chapter 11 integrates the obtained results in a business model for the PTES, proposing four alternatives for dividing the investment among the actors of the system, thereby investigating the third sub-research question.
Chapter 12 is the conclusion, which answers the research question including the three sub questions.
Chapter 13 reflects upon the benefits and limitations of the chosen research design, including choices of theories and methods.
Figure 1.1 Report structure

6

7
2 Methodology This chapter describes the research process and the choices made regarding theories and methods for analysing the topic of this research project.
2.1 Research approach The research question entails two scientific dimensions. First, it entails a sociological dimension, calling for a sociological investigation of how the different stakeholders perceive and value the PTES to understand how a business model can convince relevant stakeholders to invest in the PTES. Second, it entails an engineering dimension, calling for a techno-economic analysis based on an energy system modelling tool. Very often, these two dimensions are not combined, but rather treated as separate fields of research. Nevertheless, being a product of the authors scientific position within the interdisciplinary studies of engineering and social sciences, the combination of both dimensions, the authors argue, provides valuable insights and knowledge of the conditions that shape the realization of the PTES technology in society.
Combining these two dimensions in the research project thus requires establishing a theoretical framework, which takes both dimensions into account. Therefore, as will be further described below, this report draws upon literature within the field of Science and Technology Studies (STS). Furthermore, as the aim is to make calculations and to propose a business model for the PTES, these are also considered in the theoretical framework, which describes how business models, in this report, are viewed as both calculative and narrative devices.
The nature of the research question also requires combining quantitative methods of energy system modelling and qualitative methods of studying how stakeholders value the PTES technology. Therefore, as will be further explained in chapter 4 below, the energy system modelling tool EnergyPRO was chosen for the techno-economic analysis, and the interview method was chosen for the stakeholder valuation analysis.
As such, the authors of this report view themselves technologists, that use an energy system modelling tool (EnergyPRO) to design energy system simulation-based knowledge about the PTES, demonstrating its technological effects in the DH system. However, without assigning positive value to these effects, the actors of CPH-DHS will not want to invest in the PTES technology. Therefore, the authors also seek to understand how stakeholders come to assign value to the effects of the PTES. Inspired by Mitchell (2008)’s study of Edison’s use of economic demonstrations, mentioned in the introduction, the authors then seek to propose a business model designed based on both the EnergyPRO model and the actors’ valuation of the PTES.
As the field of inquiry is based upon a specific issue of the implementation of a PTES in the CPH-DHS, it can be regarded as a case study (Bryman 2008), examining the valuation and qualification processes of bringing a technical object into being through epistemic production. While being of concrete value to the actors in question, Flyvbjerg (2006) also argue for the scientific value of conducting in-depth case research, as it enables valuable context-dependent knowledge.

8
2.2 Theories of science Consider, for a second, the definition of water. An essentialist approach to defining water would say, that water is the composition of hydrogen and oxygen molecules in the chemical formula of H2O. However, this one-dimensional definition does not include physical qualities of water, such as its ability to keep ships afloat or to extinguish fires, the risk of it being contaminated or its necessity in maintaining all life on earth. How accurate then is the definition of H2O?
Essentialism seeks to find an inherent value that defines an object’s properties through scientific inquiry. This report takes an alternative approach, by arguing that an object under investigation, be it water or be it a PTES, can be defined in many ways. To account for this fact, John Dewey proposed the term subject matter, which is “not a one-dimensional object waiting to be viewed correctly once and for all”, but rather a “repository of multiple possibilities” (Boisvert 1998). From this perspective, multiple definitions of objects may exist, and they may all be valid. Following this perspective, the authors discard the essentialist’s view which would assume that there is one true way of viewing the PTES. Rather, the authors approach the PTES with an epistemological relativist view, meaning that the differing ways stakeholders view the PTES are all considered valid. Examining a subject matter is thus done with a particular objective, such as the chemist examining the chemical formula of water as H2O or the biologist examining water’s importance for maintaining biological life. This act of examining subject matters from a particular objective is what Dewey describes as productive inquiry (Boisvert 1998) . In addition to the objective, objects must be provoked or interfered with to get a response. The particular objective of this research project is to generate knowledge which may support the implementation of a PTES in the CPH-DHS. The theoretical framework and the methods chosen for doing this research are thus acts of productive inquiry, examining the topic with a specific objective.
2.3 Epistemological processes in Science and Technology Studies
From the research question it is shown, that for the new PTES to be successfully implemented, new knowledge of how the PTES technology will function in the DH system needs to be produced.
This raises questions of what knowledge is and how it is to be produced. An essentialist approach to this question might argue, that PTES as a technology has fixed properties that are possible to define through scientific inquiry. From this view, existing PTES implemented in the fields of Jutland should be similar to the one being planned in Høje Taastrup and should thus provide adequate knowledge for stakeholders to implement the technology in the CPH-DHS. This, however, is clearly not the case, as the problem description above illustrates. The PTES technology does not stand alone, but is rather part of a larger socio-technical network comprised of existing technology and its limitations, differing political and economic interests, spatial constraints and much more. Accordingly, Unruh (2000) argues:
In general, the limits on technological change lie not with science and technology, which tend to evolve much faster than governing institutions, but rather with the organizational, social and institutional changes that allow the diffusion of new technological solutions (Unruh 2000).

9
As Unruh argues, the diffusion of novel technology is dependent on the wider societal context within which it is implemented. Thus, the case of a PTES from Jutland cannot be directly transferred to the CPH-DHS as the organizational and institutional setups differ. Therefore, in order to account for these dimensions of the PTES when producing new knowledge about it, an STS approach is applied for this report. Opposite the mentioned essentialist approach, Sismondo (2010) argues, that “STS takes a variety of anti-essentialist positions with respect to science and technology. Neither science nor technology is a natural kind, having simple properties that define it once and for all.”
Literature in the field of STS has paid special attention to what knowledge is and how it is generated. The general logic of this approach is, that
The sources of knowledge and artefacts are complex and various: there is no privileged scientific method that can translate nature into knowledge, and no technological method that can translate knowledge into artefacts (Sismondo 2010).
As such, opposed to the idea that knowledge creation is a rational process of producing facts from observations of nature, knowledge is a social-technical construction. Being constructed, Sismondo (2010) argues, “the interpretations of knowledge and artefacts are complex and various: claims, theories, facts, and objects may have very different meanings to different audiences”. As the interpretation of knowledge and artefacts depends on the actors, several understandings of the same technological artefact can be present. Furthermore, the actors’ perception of technology is dependent upon the specific socio-technical network within which they are placed. As such, the applied knowledge within a socio-technical network regarding a technology may be defined as situated knowledge (Sismondo 2010).
While there is a need for new technical knowledge about the functionality of the PTES for it to be implemented, existing social structures, technological infrastructures, organisations and institutions around it need to be taken into account in this process. Sismondo (2010) argues that the “builders of technology do heterogenous engineering” and that “technologists need to combine raw material, skills, knowledge, and capital, and to do this they must enrol any number of actors, not all of whom may be immediately compatible”. The engineer building technological artefacts must also construct networks by manufacturing statements and claims, i.e. making representations of the material world. The technologist’s work thus consists of his ability to translate and enrol actors to support the network in which he and the technological artefact are situated.
Callon (1995) describes science as a process driven by the production of statements, through the notion of translation networks. Statements build upon a vast network of other scientific statements from peer reviewed journals, observations and claims etc. To make credible claims about the world, the researcher needs to draw upon an accepted and established translation network for him to be able to engage with and enrol other actors (Callon 1995). As scientists create the conditions for enacting, i.e. measure and observe their objects, their epistemic conclusions may be inscribed and circulated in networks. As more observations supporting these claims surface, they start to translate into reports and documents and thus expand the translation network. For example, within the science of climate change there is a strong translation network building upon reports, conferences and agreements. The Brundtland Report, the Kyoto Protocol, the COP conferences and the Paris Agreement, all based on scientific measurements of ice caps, tree rings, forecasts of CO2 emissions etc, inscribed in tables, figures and report, are building and expanding the translation network.

10
Furthermore, new scientific findings and statements are continuously being produced within this network about the critical state of the earth’s climate and the increasing need for countries and individuals to act. This translation network is, however, continuously being challenged by those who argue, that climate change is not caused by humans; a translation network having gained strength through past geopolitical events such as the presidential election in the USA.
Taking these matters into account, knowledge creation from the STS perspective builds upon observations about the world, and acknowledges that objects are framed and mediated by instruments that shape how frames and statements are produced through situated chains and networks, and therefore they are socio-technically produced. STS does not oppose the ability to measure the material world to make claims, but argues, that this will always be the technologist’s representation mediated through the utilized epistemic devices and networks.
By having developed a general framework for the understanding of epistemological processes, this report now turns to the theoretical question of how novel technologies are valued and enter into already established systems.

11

12

13
3 Theoretical Framework This chapter presents the theoretical framework through which the issue presented in chapter 1 is approached and analysed. First, the chapter describes how novel technologies entering markets are valued in a process of framing and calculation. It is argued that the devices which mediate the observations are important in the framing of objects. Second, this chapter presents this report’s definition of business models and describes what they do and how they are used.
3.1 Valuation processes of novel technologies Just as knowledge creation is dependent on the situated network as argued in chapter 2, so is the valuation of a certain good. Valuation studies (e.g. Beunza and Garud 2007; Muniesa et al. 2017; Doganova and Eyquem-Renault 2009) are concerned with how stakeholders define and value the properties of objects.
Novel goods, products and technologies entering a market need to have their qualities defined, classified and eventually priced. Whereas neoclassical economics traditionally proclaims that in a free market this is a natural and inevitable process settled by the forces of supply and demand, scholars within the field of Economic Sociology argue, that this is a social process happening within a framed market architecture. Accordingly, Fligstein and Calder (2015) define markets as follows:
Markets are socially constructed arenas where repeated exchanges occur between buyers and sellers under a set of formal and informal rules governing relations among competitors, suppliers, and customers. These arenas operate according to local understandings and rules that guide interaction, facilitate trade, define what products are produced, indeed constitute the products themselves, and provide stability for buyers, sellers, and producers. Marketplaces are also dependent on governments, laws, and cultural understandings supporting market activity (Fligstein and Calder 2015).
From Fligstein and Calder's (2015) perspective, governmental actors, firms and organisations have inputs as to how a product’s qualities should be defined and valued. Furthermore, the markets in which the new good is to be embedded consists of established trust and common understandings between these actors. Therefore, the qualities and values of novel goods are produced by social relationships and common understandings evolving over time, which in turn generates stable prices; i.e. through processes of valuation.
In processes of valuation, Çalışkan and Callon (2010) argue, there are two types of entities; i.e. the things to be valued and the agencies of valuation. The things to be valued are entities where qualities have not yet been defined, whereas the agencies of valuation are entities, which can engage in calculations and judgement of the former’s qualities. If in the present case, the thing to be valued is the new PTES, then the agencies of valuation must be the actors, which through calculations and judgement are active in the decision-making process of implementing the PTES, i.e. the heterogeneous actors of the DH market. Within STS, the term heterogeneous actors accounts for human and non-human entities, which have agency in a socio-technical network (E.g. Sismondo

14
2010). These actors of valuation are participating in a process of disentangling the object from a wild unknown to a passive object, through epistemic processes (Çalışkan and Callon 2010).
Once a consensus regarding the properties of a new good is reached, it is rendered passive. This notion, which was developed by Çalışkan and Callon (2010), is used to illustrate, that once a good is finally defined, it is unable to express novelty or perform unexpectedly, i.e. it is passive. Before objects are pacified, the situation indicates uncertainty (Weick 1995) as the actors try to make sense of the situation. In situations of uncertainty, there is a lack of information available for the actors to make informed decisions, and it is possible for actors to project their own understanding into the situation, and as such propose their own problem-solving or object properties. In such situations, actors may have different value orientations, which causes them to rely on personal and/or professional values, when trying to make sense of the situation (Weick 1995). Here, the existence of different epistemic positions among actors becomes clear, as also argued by Sismondo (2010) above.
The following two subsections present two key notions which describe how valuation is performed. First, the notion of a valuation frame is presented, to explain how actors compete in imposing their definitions and values to novel goods. Second, the notion of a calculative device is presented, to explain how actors apply certain calculations and models to support certain valuation frames and to qualify novel goods.
3.1.1 Valuation frames The notion of a valuation frame refers to what qualities are included and excluded when market actors classify and calculate the worth of a given good or service, including which specific metrics and analogies are used to describe the value of the good. These can be economic qualities such as costs and prices, but also non-economic social qualities, such as environmentally friendly, CO2 neutral, organic, etc. (Doganova and Karnøe 2012). While framing is to put the world into brackets, what is left out of the framing may be defined as overflows, which closely relates to the notion of externalities in economic terms (Callon 1998).
The notion of valuation frame is related to that of frame-maker used by Beunza and Garud (2007) in their description of how different financial analysts value the internet bookstore Amazon.com. One analyst compares the likely revenue of Amazon.com to other internet companies such as Dell or AOL and thus he recommends investors to buy stock. Another analyst compares Amazon.com to other bookstores such as Barnes & Nobles with lower revenue, and thus recommends investors to sell. These different conclusions constitute two different valuation frames, which are created based on specific assumptions and calculations used by the two analysts.
The activity of proposing new value to things also entails a political dimension, as competing market actors may benefit from enrolling new actors to their valuation frame, creating valuation networks (Doganova and Karnøe 2012) supporting certain dominant valuation frames. For example, Mortensen and Karnøe (2017) analysed the framing of the British nuclear power plant Hinkley Point C, and how stakeholders developed and changed the valuation frame of nuclear energy from ‘unsubsidized and cheap’ to ‘subsidized but necessary’. The valuation frame included heterogeneous elements such as political coalitions, ageing infrastructure, engineering and energy

15
systems knowledge and the physical-materiality of steel for constructing the reactor. When once-loyal actors failed to support the established framing, contestations and overflows were limited by re-framing the valuations. Valuation frames were shifted after calculative devices showed increasing plant LCOE, which thus failed to support the ‘unsubsidized’ framing. This, in turn, called for new coalitions, new key metrics and valuation frames, as support had to be found elsewhere in the networks.
As such, calculative devices are a key component constructing, and being constructed by, valuation frames. Before a novel good has been rendered passive in a market, market actors compete in defining the dominant valuation frame, including the key metrics and calculative means through which to value the good. As will be seen in later chapters of this report, the market actors of the CPH-DHS currently propose differing valuation frames, when defining the value the new PTES. Accordingly, the identified valuation frames entail certain metrics, which describe the value of the PTES under the respective valuation frames. The following sub-section elaborates on the role of calculative devices in such situations.
3.1.2 The role of calculative devices – bringing innovations into being Jensen, Cashmore, and Elle (2017) propose the term calculative device “as any analytical apparatus used to structure knowledge production”. Using calculative devices, epistemic practices may be made visible, thereby bringing novel ways of perceiving the impact of technology into being. The establishment and use of calculative devices are important in this process, as they participate in the construction and framing of statements and facts about objects as explained by Callon's (1995) notion of translation networks. By constructing claims about the object with calculative devices, building on translation chains, statements and claims about the material world can be made. As situations of uncertainty can produce divergent perceptions of the artefact, new statements can possibly translate actors into the network of the calculative device. The device’s ability to translate actors depends on the power of the translation network and its ability to enrol actors. Powerful statements, building on established translation networks, can, as powerful magnets pull objects closer, enrol other actors in the network. But some statements can also be weaker than others, just as one magnet will be pulled towards a more powerful magnet, or statements can further divide the argument between actors, just like magnets of opposite poles are pushed away from each other.
By taking the current market architecture into account, calculative demonstrations have the ability to make innovations and technologies visible and tangible. In doing this, the valuation is framed and boundaries are established between which qualities of the innovations are included and which are excluded (Doganova and Karnøe 2012; Doganova and Eyquem-Renault 2009). Muniesa et al. (2017) present this as an organized space in which the valuation can take place. An example of such a process is presented in Mitchell (2008)’s study of the success of Edison’s electrical system. Crucial for Edison’s success was his ability of building alliances between patents, generators, political connections and capital etc. Economic calculations were largely a part of demonstrating the abilities of his inventions, and were thus “helping to bring into being the world they calculated” (Mitchell 2008). As Mitchell points out, it was not the accuracy of the calculations, but rather the enabling of the network being built where actors could envision their own roles, that was the primary objective of

16
the demonstrative calculations. While calculating, the demonstrations also envision new relationships (Doganova and Eyquem-Renault 2009).
Calculative devices are thus important tools in alleviating uncertain situations. For novel goods to become pacified, alliances must be built and actors translated to follow and support a dominant valuation frame. While calculations should not be seen as objective truths, they can support the enrolment of actors into certain valuation networks, as well as lead to the pacification of novel goods. In this regard, establishing a business model for the novel good may serve as a crucial catalyst. The following section presents a novel approach to business models, defining them as calculative and narrative devices able to translate and enrol actors by demonstrating and framing a good.
3.2 A novel approach to business models Very often, the business model has been viewed as a more or less realistic description or representation of how value is created for a company and how to marketize a new good. Conventionally, a business model has been defined as a combination of three main components (Doganova and Karnøe 2012; Doganova and Eyquem-Renault 2009):
1. The value proposition, which identifies a current unmet need, problem or challenge and proposes a solution for solving these for the actors in question.
2. The value architecture, which considers the partners and channels through which value is delivered.
3. The revenue model, which translates the value into a cost and revenue stream supporting the proposed innovation, making a sustainable business model (Muniesa et al. 2017; Doganova and Karnøe 2012).
However, as argued by Doganova and Eyquem-Renault (2009), this essentialist view is problematic, especially if applied for business models for new ventures as their reality has not yet materialised. The business model for such ventures thus describes or represents something which does not yet exist. To illustrate this point, two examples of how a business model for a PTES could be constructed are presented in Table 3.1 below. Both are possible representations of how the business model for a PTES could be constructed, but as the PTES has not yet materialized, different focus and perspectives lead to differing business models.
Table 3.1 Two examples of the focus for a business model

17
As argued above, the knowledge and perceptions of technologists are situated in their specific network, and this will influence their representation through the business model. This has led scholars to question the ability of the business model to realistically represent the ventures, and instead of asking what a business model is, they ask what do business models do? (Doganova and Eyquem-Renault 2009).
From this perspective, a business model can be viewed as a calculative device. As such, a business model allows an entrepreneur to bring his innovation into existence through calculations and narratives. Furthermore, as it circulates, it builds the network of the new venture that it represents (Doganova and Eyquem-Renault 2009). In other words, it creates the coalitions and alliances that form the valuation network. Accordingly, examining the business model of a new venture from this perspective led Doganova and Eyquem-Renault (2009) to conclude:
Like demonstrations, business models aim at providing evidence for the feasibility of an innovative project and at gaining the interest of third parties by mobilising the repertoires of both proof and persuasion, and the logic and rhetoric elements that they include.
As such, business models are means for storytelling and of calculation, tying stories to numbers (Doganova and Eyquem-Renault 2009). Therefore, the way the numbers and calculations which guide the narrative are generated is a crucial element of a business model.
Calculative demonstrations do as such provide examples of what could be, they are a calculative articulation of answers to the three typical components of the business model (Muniesa et al. 2017). In this sense, the purpose of calculative demonstrations in the business model is to provide a sense of certainty to the investor, while not necessarily to be a representation of reality. Instead, the purpose of the calculations is to enrol and convince investors of the plans overall seriousness. And it is only once a “wild unknown” object has been quantified and transformed by the mechanics of valuation that investors and others can compare the object to other possible investments and thus be more certain of their investment (Muniesa et al. 2017). As such, the business model serves to reduce uncertainty for the investors by producing news about the object (Weick 1995). Weick argues
Business model component Example 1 Example 2
The value proposition Inefficient use of energy CHP plants unable to produce during peak electricity spot prices
The value architecture Shifting production with a PTES from peak boilers to CHP plants
Load shifting operation of CHP plants to produce during peak pricing hours, as they are not limited by heat demand
The revenue model
Lowering heat expenses for DH transmission and distribution companies by shifting from peak to CHP production.
CHP plants increase revenue, as they can produce during peak pricing hours.
18
that news alleviate uncertainty as they bring information about possible futures, and provide guidance of which direction for actors to take (Weick 1995). New calculative demonstrations can enrol actors into new or reconfigured networks, while also limiting the influence of others.
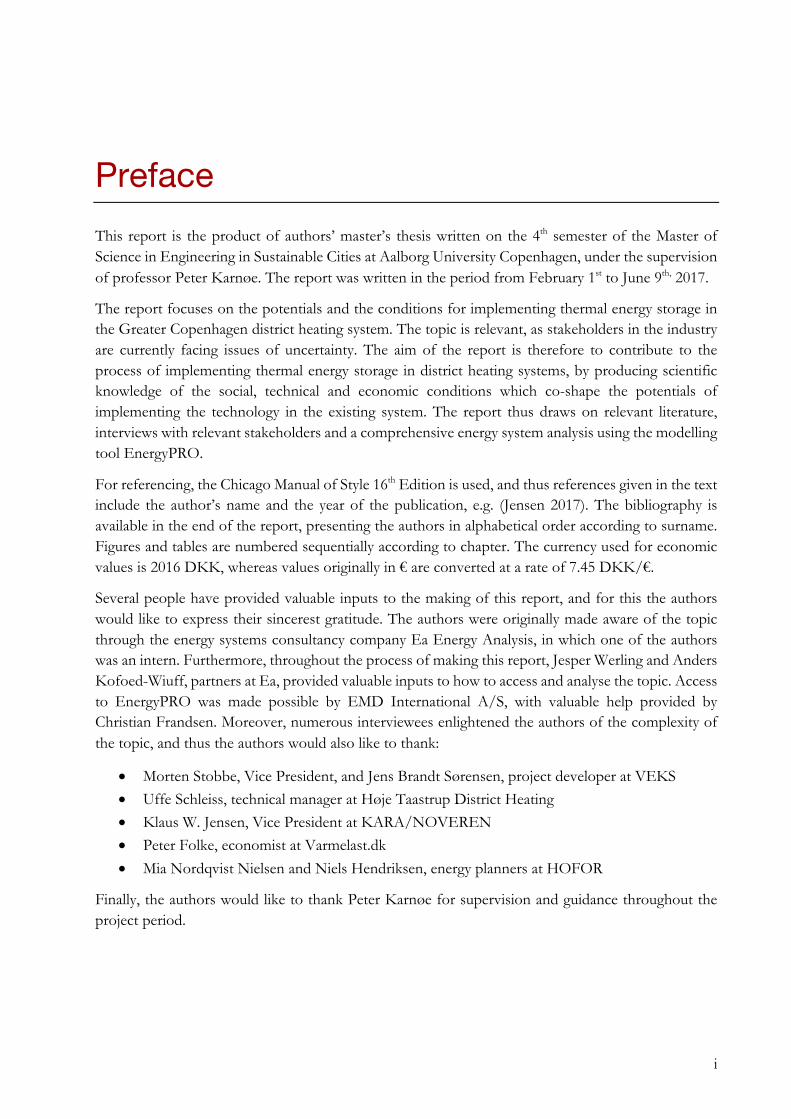
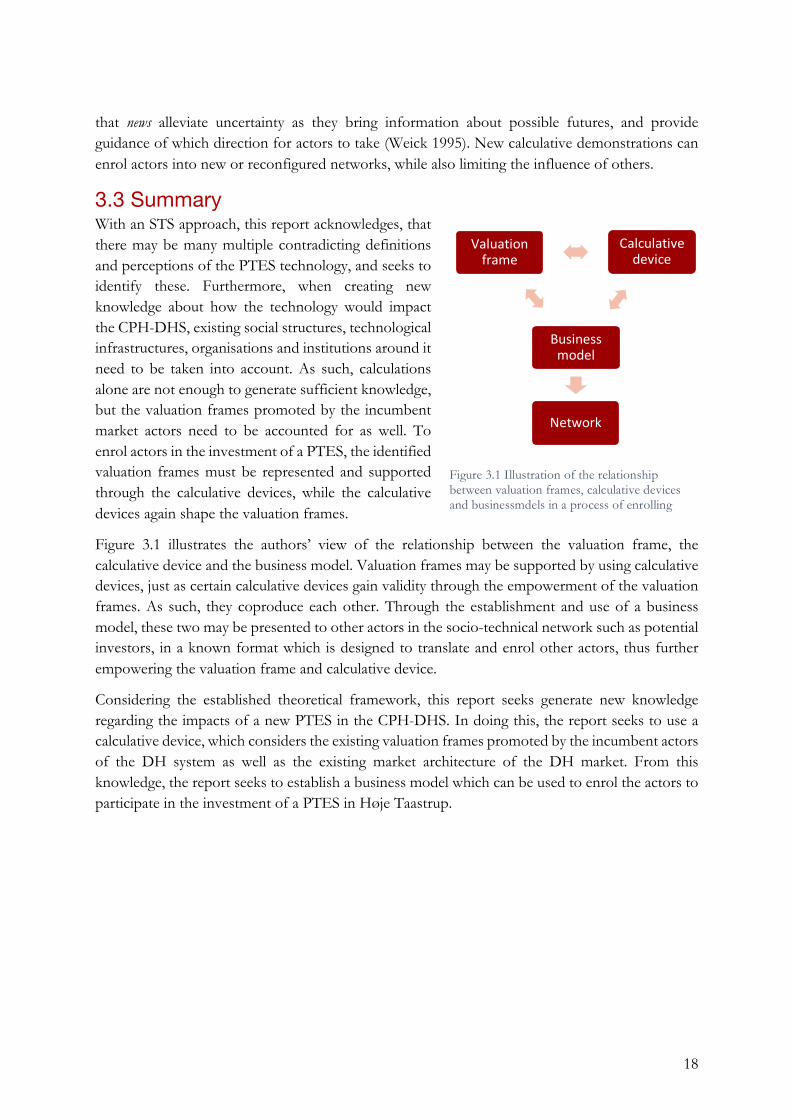
3.3 Summary With an STS approach, this report acknowledges, that there may be many multiple contradicting definitions and perceptions of the PTES technology, and seeks to identify these. Furthermore, when creating new knowledge about how the technology would impact the CPH-DHS, existing social structures, technological infrastructures, organisations and institutions around it need to be taken into account. As such, calculations alone are not enough to generate sufficient knowledge, but the valuation frames promoted by the incumbent market actors need to be accounted for as well. To enrol actors in the investment of a PTES, the identified valuation frames must be represented and supported through the calculative devices, while the calculative devices again shape the valuation frames.
Figure 3.1 illustrates the authors’ view of the relationship between the valuation frame, the calculative device and the business model. Valuation frames may be supported by using calculative devices, just as certain calculative devices gain validity through the empowerment of the valuation frames. As such, they coproduce each other. Through the establishment and use of a business model, these two may be presented to other actors in the socio-technical network such as potential investors, in a known format which is designed to translate and enrol other actors, thus further empowering the valuation frame and calculative device.
Considering the established theoretical framework, this report seeks generate new knowledge regarding the impacts of a new PTES in the CPH-DHS. In doing this, the report seeks to use a calculative device, which considers the existing valuation frames promoted by the incumbent actors of the DH system as well as the existing market architecture of the DH market. From this knowledge, the report seeks to establish a business model which can be used to enrol the actors to participate in the investment of a PTES in Høje Taastrup.
Network
Businessmodel
Calculativedevice
Valuationframe
Figure 3.1 Illustration of the relationship between valuation frames, calculative devices and businessmdels in a process of enrolling other actors within the network, such as

19

20

21
4 Data generation and methods This chapter presents the methods applied for generating data for this report. In the following sections, the applied methods are described individually with an explanation of the purpose of using each method as well as how each method is used. The methods are:
• Interviews • Energy system modelling with the tool EnergyPRO • Literature studies
4.1 Interviews In order to investigate how the stakeholders of the Greater Copenhagen DH grid value a PTES, five semi-structured interviews were conducted for this report. While traditionally qualitative research is seen as an inductive method for theory building, it can also be used as a deductive method, as it is used in this case (Bryman 2015). As the research questions consider the valuation frames and perceptions in relation to a not yet constructed PTES, the interview method enables the inquiry into the social understanding of this object.
In the sense that validity measures the ability of the method to produce knowledge about its subject matter (Kvale and Brinkmann 2015), then a semi-structured interview method gives an in-depth knowledge about the subject in questions. Bryman (2015) argues, that validity as a measure is problematic, as it originates from positivist quantitative research, and is thus difficult to transfer to relativistic qualitative research. Instead, he presents the measure of trustworthiness (Bryman 2015). Social reality can be made up of several possible accounts, and therefore it is not possible to measure the correctness of a statement. Instead, the researchers can use respondent validation, to double check if statements, obtained during the interview, were indeed understood and interpreted as the interviewee meant them to be. To increase the research’s transferability, Bryman argues that a fulfilling account of the interview’s setting and details should be presented, to provide the necessary context used for interpretation. The dependability, a term related to reliability, must be ensured by providing a fulfilling account of the research process and findings. The process is elaborated below, by the use of Kvale and Brinkmann's (2015) seven phases of interviews. Related to dependability is confirmability, which accounts for establishing no overly personal influence from the researchers during the interview phases. As complete objectivity is impossible in research, the credibility must be ensured by a full account of the methods applied and questions asked. Thus, the steps used during the interview phase are presented below.
Kvale and Brinkmann (2015) identify seven chronological phases of qualitative interview research, which have been followed when planning, conducting and analysing the interviews for this report2 .
2 The textbook is in Danish, which is why all references to the specific text are translated by the authors.

22
The seven phases are:
1. Thematization, which is to identify the purpose of conducting the interviews. 2. Design, which is to decide how the interview study should be structured. 3. Conducting the interview, where good interview conduct needs to be followed. 4. Transcription, which is to consider how to document the acquired information. 5. Analysis, which is to consider how the acquired information is interpreted. 6. Verification, to establish the trustworthiness of the acquired information. 7. Reporting, which is how to present and communicate the obtained information.
The following sections describe how the seven phases were considered for the interview study of this report.
4.1.1 Thematization The first step of planning the interview is to identify the purpose of conducting the interviews; i.e. why choose the interview method and what information is needed from the interview (Kvale and Brinkmann 2015). From the theoretical framework, it has been elaborated in order to establish a business model for the PTES, it is relevant and important that the points of view of the stakeholders, i.e. their valuation frames, are identified and included. Therefore, the interview method becomes relevant to apply in this research project, to gather information regarding how the different actors are likely to approach this new unit, to support the creation of a feasible business model.
4.1.2 Design Having decided to apply the interview method, the next question is how to structure the interview in order to get the optimal outcome. The number of interviews needed and the structure of the interviews should also be considered in the design phase (Kvale and Brinkmann 2015).
Due to the complex nature of the research problem at hand, the semi-structured interview was chosen. The flexible nature of the semi-structured interview makes room for follow-up questions, elaboration on specific topics, or discussion of new relevant topics, which go beyond the predefined questions.
There are many actors in the DH system whose operation will be affected by a new PTES. However, due to time restraints, the authors decided not to interview all relevant actors, but to choose one actor from each of a series of actor types. The identified actor types being: CHP plants, waste incineration plants, transmission companies, distribution companies and the market operator. The interviewees, which represent these organisational actor types, are summed up in Table 4.1 below. The implications of this grouping of actors is discussed in chapter 0.

23
Table 4.1 Overview of the interviewees, the organization they represent and their relevance regarding this report
Organisation Name / Position Relevance
VEKS Jens Brandt Sørensen / Project developer Morten Stobbe / Vice President
VEKS is currently trying to find a business model for the PTES. As such, they, together with Høje Taastrup DH, are the project developers and as such, they are the ones meeting the challenges addressed by this report. Therefore, as project developer and vice president respectively, J.B. Sørensen and M. Stobbe are relevant interviewees, as they can inform the authors of the problem and collaborate on viable solutions.
Høje Taastrup District Heating
Uffe Schleiss / Technical manager
Høje Taastrup DH is planning to implement the PTES in their distribution area. As such, they have made some considerations as to the technical setup of the PTES and have some specific requirements regarding its use. As the technical manager, U. Schleiss is in a position of speaking on behalf of the company about these matters.
KARA/ NOVEREN
Klaus W. Jensen / Vice President
Being a waste incineration plant, K/N might be influenced by the implementation of a PTES, and therefore they are relevant to include in this study. As vice president, K.W. Jensen is in a position of speaking on behalf of the organization regarding their planned PTES.
Varmelast.dk Peter Folke / Economist
Being the market operator scheduling the daily heat production, Varmelast.dk has an essential role in the potential future operation of the PTES. P. Folke, economist, is part of the team which optimizes the load scheduling, and as such, he has valuable insights as to how the system works as well as how a new PTES storage fits to the current system.
HOFOR
Mia Nordqvist Nielsen / Energy Planner Niels Hendriksen / Energy Planner
HOFOR is both the owner and operator of a CHP plant as well as a utility company. As energy planners, M. N. Nielsen and N. Hendriksen are in a position of speaking both on the behalf of the CHP plant as well as the heating utility.

24
4.1.3 Conducting the interview When conducting a semi-structured interview, using an interview guide to steer the interview ensures that the topics are covered, even though the chronology of the topics discussed may vary from the interview guide, due to the nature of the semi-structured approach (Kvale and Brinkmann 2015). Accordingly, interview guides were created for each interview. A couple of days before the interview was to be held, the interview guides were sent out to the interviewees, so that they would know exactly what to expect of the interview and could prepare for it. The interview guides contained specific questions which were divided into categories, such as technical, economic, organizational etc. Due to the differing types of organizations, individual interview guides were created for each interview and these can be found in appendix B. To produce knowledge through productive inquiry, the object in questions must be provoked, to get a response. By bringing results and observation from the EnergyPRO analysis to the interviews it enabled the authors to engage the interviewees in a conversation about the object and get their responses and critique. This method gave insight to new knowledge that possibly would not have surfaced without provocation, but also allow for the actors’ own bias and perception to enter the interview setting and data generation.
4.1.4 Transcription The interviews were recorded and afterwards important parts were transcribed. As the process of transcribing interviews can be rather time consuming, the researchers chose to transcribe only the moments of the interview, which are especially useful for the report (Kvale and Brinkmann 2015). The transcription also filtered out any mumbling, long passages without speaking or other part without use. This introduces an interpretation from the researches, as they chose which parts are relevant and which part are not. Furthermore, the process of translating quotes from Danish to English also entails a degree of interpretation. The transcriptions are not included in this report due to concerns of confidentiality, but are available upon request.
4.1.5 Analysis Depending on the type of interview study, there are multiple ways of analyzing the interviews and multiple levels of detail which may be relevant to dig into. Some studies may wish to compare the answers of the interviewees, while others may wish to analyze the specific language used by the interviewees etc. (Kvale and Brinkmann 2015). When analyzing the interviews conducted for this report, the focus was to identify how each interviewee values and frames the PTES. Therefore, even though much valuable information was obtained in each interview, only the statements regarding these specific matters were applied in the actual analysis.
4.1.6 Verification While in a positivist approach validity would be seen as replicability and the ability of the method to measure what is in question, the epistemological relativist approach is concerned with the perceptions of the actors in question. As such, there is no right or wrong answers. Kvale and Brinkmann (2015) argue, that instead of seeking to verify statements produced from interviews, the transparent methods, presentation of results and critical reflections are enough to ensure the

25
validity and reliability. Following Bryman (2015), respondent validation was ensured by confirming all statements with the interviewees before publication.
4.1.7 Reporting The reporting has taken ethical considerations into account (Kvale and Brinkmann 2015), by making agreements about the use of statements with the interviewees. The interviewees were also accepting their statements in writing before publication.
The results are presented in chapter 7, where quotes are used to present the interviewees perceptions. In order to contextualize the statements, they are interpreted and related to each other, to present the wider context in which they were stated. As it is not possible to present an objective account of the interviews, this report presents the interviews in relation to interpretations to put the statements into context.
4.1.8 Limitations of the interview method Some limitations of the data generated by the qualitative inquiry apply. One interview with each type of district heating actor was conducted, being transmission company, system operator, CHP plant, waste incineration, and two distribution companies, HOFOR and Høje Taastrup DH. As HOFOR and Høje Taastrup DH are different in size, ownership of plants, organization etc., it is difficult to compare the two actors. This showcases that it is difficult to generalize across actors within the same type. Therefore, the results should not be seen as general statements for that particular type of actor, but as examples of how different actors can perceive the object in question. Had more interviews been conducted; more valuation frames would have surfaced.
The applied method generates knowledge of the different actors’ valuation frames, but does not make inquiry into what shapes these different valuations. Following Callon’s (1995) argument of translation chains, the actors’ valuation frames build upon past obtained knowledge. Several actors mentioned, that past analytical work shapes their understanding of potentials of the PTES, but due to time and resource constraints, these sources of knowledge have not been possible to examine. Therefore, the inquiry into different valuation frames only consider the identified frames, but does not develop what shapes these framings in detail.
4.2 EnergyPRO modelling To generate knowledge of the impact of implementing a PTES in the CPH-DHS, a digital energy system modelling tool is applied. As such, the purpose is to ‘bring the PTES into being’ by using a calculative device, capable of modelling the CPH-DHS, including plants, transmission areas, storages, heat demands, electricity prices etc. This section presents the chosen modelling software, EnergyPRO, including why it was chosen, how it is used and what its limitations are. The EnergyPRO (version 4.4) modelling software was chosen for the energy system analysis, due to its capability of making detailed techno-economic analyses of regional and local energy systems with fossil, bio and renewable energy sources and technologies (EMD 2016). Analysing the Copenhagen energy system alone, the local scale configuration of EnergyPRO is considered suitable, compared to e.g. the EnergyPLAN software, which is more suitable for larger national energy systems, following an aggregation approach in which it combines total capacities rather than modelling

26
individual plants (e.g. Lund 2005). EnergyPRO can model limitations in district heating transmission systems, an important limitation to consider when load-scheduling plants.
The model takes an analytical and least-cost approach to fulfilling demands, by calculating a priority number for every unit for every time step. Units are then scheduled based on this priority, with the units with highest priority scheduled first. For CHP plants, this takes the electricity spot price into account, where a high spot price result in high priority and vice-versa. Certain units are prioritized in the market as HOFOR’s geothermal heat pump. These units are thus given the highest priority every hour they are available. The model then dispatches available units to fulfil demands in every time step. This process is illustrated in figure A.4 in appendix A
4.2.1 Setup of the analysis In the tool, a reference scenario is established, which represents a business-as-usual situation, where no new actions are taken other than already established policies towards the year 2025. This reference year was chosen, as the system is expected to change during the years up to 2025, phasing out the use of coal and oil as fuels as well as moving away from steam-based DH to water-based DH in Central Copenhagen. Having built the reference scenario, this is tested against two alternative scenarios, which include two ways of configuring the PTES in Høje Taastrup. The purpose of these scenarios are to analyse, how the implementation of the PTES will influence the system in terms of fuel use, energy production and economy. In this section, the overall design of the analysis and scenarios is presented, whereas the detailed inputs for the model are presented in appendix A.
4.2.1.1 BuildingthereferencescenarioThe EnergyPRO interface is presented in Figure 4.1 below. In general, the different input data are inserted in the folders in the ‘input data’ box is the top left corner, while the large window is a visualisation of the model and the interconnections between the different inputs. Different outputs are available when running the model, and these are generated by choosing one of the reports in the lower left box. When building a model, the inputs are added following the order of the list presented in the top left corner of the figure.

27
Figure 4.1 Screenshot showing the EnergyPRO interface including an overview of the modelled reference scenario
In the reference scenario, the entire CPH-DHS is modelled, including all transmission areas and their demands, all fuels with costs and heat values, all plants and their production as well as all connections and their capacities. However, due to lengthy computational time and excessive data handling, a certain level of aggregation is applied. For example, some production units have been grouped to get outputs representing each plant instead of each unit of a plant. Appendix C provides an overview of the grouped units. Furthermore, the model only includes the transmission grid level, having aggregated all the demands of the distribution areas. The only distribution area which is modelled individually is that of Høje Taastrup, as this where the PTES is to be installed.
The tool offers certain options regarding the operation strategy of the plants to fit the model to the desired market design. In the current DH market, certain units are prioritized, such as waste incineration plants and HOFOR’s geothermal heat pump, meaning that these will always be scheduled first for production. These units thus produce at peak load every hour they are available, regardless of heat production costs. However, in the established model, the waste incineration plants are not prioritized, but follow the same marginal price load scheduling as the CHP plants. The reason for this change in the model is, that people within the industry are currently discussing whether waste incineration should remain prioritized, or whether it should be subject to the same scheduling rules as other plants. Therefore it is relevant to include in the analysis, how a PTES would influence the waste incineration plants in such a case. By prioritizing the waste incineration plants, any potential impact from the PTES would not be analysed, and therefore does this approach give insight into possible changes in waste incineration production.
Emissions from the operation of the system as well as their costs are accounted for in the model. The emissions are modelled per plant based on fuel type. Finally, all the different costs are added to the model, including taxes and emission fees, yet without investment costs.

28
4.2.1.2 AlternativescenariosThe alternative scenarios are similar to the reference scenario in all matters, except they have an added PTES connected to the distribution area of Høje Taastrup. In alternative 1, the PTES can receive heat from the transmission grid but it cannot transport heat back to the transmission grid, whereas in alternative 2 heat can be transported both ways. These alternatives were chosen, to analyse whether the PTES should only supply heat for the distribution grid in Høje Taastrup, or if it should rather be capable of receiving and supply heat on transmission grid level.
4.2.2 Business economic calculations As EnergyPRO only takes the system economy into question, it does not consider the bilateral heat sales contracts between producers and transmission companies. As will be presented in section 6.3, the heat production costs and the price at which heat is sold are not the same. Thus, the demonstration of the impacts on the individual plants and transmission companies are done in a separate spreadsheet analysis. It assumes the heat sales price is determined by bilateral contracts, and is calculated by a fixed share of fuel use and O&M for the heat and electricity production.
The import and export heat price between the transmission companies is assumed to be governed by a marginal pricing principle, where the marginal producer in the given exporting area sets the export price. As all plants supply heat through a transmission company, and several producers are online at the same time, it is not possible to determine which plants production is being exported. Therefore, a single price for export must be determined, and a reasonable assumption is that the transmission company will set the export price at the marginal producer’s sales price. As information about the method of heat price determination, this is an assumption. The calculations are presented in Appendix A.
4.2.3 Model limitations While the model predicts perfect worlds, complex systems like the CPH-DHS are prone to mistakes, unforeseen events and abnormalities. In a digital model, technology is pure in the sense that no unforeseen events or influences affect the operation of the system. As such, there are a number of inevitable limitations present when modelling complex energy systems, and a couple of the most evident limitations of the model are presented here.
The model has perfect knowledge about external conditions such as electricity prices, weather conditions and heating demands, and thus the software can plan optimal unit dispatch for the whole year without any unexpected happenings such as extreme weather events or unforeseen outages, which in real circumstances would cause sub-optimal operation. Such events would be handled by back-up generators and other adjustable units, but is not included in this analysis. For example, the TTES at AMV and AVV are used in the optimal dispatch planning of EnergyPRO, but according to HOFOR they are actually mostly used to adjust to variations in demand and production (HOFOR 2017).
Electricity marked bidding strategies and regulation markets are not considered, even though this could have an impact on operation strategies. Units as AVV2 gas turbines or Høje Taastrup DH’s heat pump could possibly gain revenue by providing balancing services, although that is beyond the scope of this report. As the electricity prices are external conditions in the EnergyPRO model

29
and defined before analysis, they are not affected by changes in supply and demand. Theoretically, changes in CHP production would affect the electricity price, but this is not considered in the model. Furthermore, a number of limitations apply to the unit modelling. Due to model constraints, it is not possible to model extraction plants with a variable heat and power output. Therefore, all CHP plants are modelled as back-pressure units with a fixed ratio between heat and power production. As the computational time increases significantly, ramp up and down times are also not considered in the model. The units are thus able to turn on and off without using time and resources on the start-up process. This results in a too optimistic unit scheduling, as they are able to make faster adjustments than in reality.
4.3 Literature Study Literature studies have been used for various parts of this report. The majority of the data used for energy system modelling in this report is collected by official agencies and organizations, while the theoretical framework builds upon peer-reviewed literature. As mentioned above, Callon (1995) describes how scientific observations are being used in the further production of scientific statements, with the notion of translation networks. In order to produce credible statements, this report utilizes these resources and builds upon already established statements. By building on knowledge from accepted sources, it is possible to produce reliable and valid statements, for further circulation in the translation network. The main literature sources are presented below.
4.3.1 Varmeplan Hovedstaden A vast amount of the background data used in this report is originally produced by the project Varmeplan Hovedstaden3 (VPH), which is a cooperative development project between transmission companies CTR and VEKS and distribution and production company HOFOR. The development of the CPH-DHS is coordinated through VPH. This project has been ongoing in phases from 2008-2014 and has collected several datasets describing the transmission networks, plants, units and demands of the DH system. A vast amount of the background data used in this report is originally produced by this project.
4.3.2 The Danish Energy Agency’s Technology Catalogue The Danish Energy Agency (DEA) publishes catalogues on data for energy system technologies. Both technical and economic data is compiled, and forecasts about future developments are included. The data is highly aggregated and therefore, local factors change the actual data from project to project. Moreover, technical and economic forecasts are always difficult to assess, which is why the technology catalogue is updated regularly on novel technologies or where mayor technological innovation has happened. For example, offshore wind and heat pump data have been updated recently (DEA 2016b). Although the data on technologies is generic and lacks site-specific characteristics, it is a trusted and widely used source of information, especially when there is a lack of information from elsewhere. As power plants often withhold specific efficiencies, capacities and emissions as classified information, the technology catalogue has provided reasonable approximations for this data.
3 English: Heatplan Greater Copenhagen

30
4.3.3 Peer-reviewed academic literature The academic literature has provided insights primarily in two fields for this report: for the theoretical understanding of socio-technical systems, and for energy system dynamics and the impacts from PTES implementation. The academic literature enables the report to build upon the past work of scholars, thereby again utilizing the translations networks of scientific facts. As Kuhn argues that science exists in paradigms (Sismondo 2010), scientific facts and arguments should not be understood as the only truths or reality, but as situated knowledge built in specific scientific networks. STS open doors for explaining the socio-technical existence of technology and how changes in such networks can be understood. Other theoretical understandings would perceive the problem area and possible solutions different, and thus come up with different conclusions. This will be elaborated in chapter 13 about limitations and other possible routes.

31

32

33
5 Classification of thermal energy storage technologies
This chapter presents a general description of thermal energy storage (TES) technologies. First, this chapter provides an explanation of how TES in general fits and compliments an energy system with fluctuating energy supply and demand. Second, this chapter provides a description of two types of TES technologies, i.e. the Tank TES and the Pit TES, which are considered the most relevant to apply in the CPH-DHS and recommends the Pit TES be implemented.
5.1 Energy storage technologies Supply and demand for energy does not necessarily occur simultaneously. Demand varies on a daily, weekly and seasonal basis, while the energy supply also increasingly fluctuates; both due to more and more intermittent renewable energy sources (RES) being added to the energy system, as well as due to volatile electricity prices causing CHP plants to wish to produce at high prices without being limited by having to meet the heating demand. This mismatch between supply and demand for energy has led to increased interest in energy storage (ES) technologies (Lee 2013).
Depending on the setting (i.e. energy system requirements and limitations, geographical conditions etc.), different types of ES technologies become attractive to apply. Among the electrical ES technologies available, the most reliable and well-developed is pumped hydro. However, the specific geographical requirements for this solution limit the number of applicable locations for this technology. Other electrical ES technologies have seen major development in both increased efficiency and reduced costs in the past few years, including battery solutions for private houses and electrical vehicles. Nevertheless, among large scale ES solutions, TES has proven to be the most efficient and economically feasible (Powell et al. 2016).
The basic principle of TES is as follows: The TES is charged at times with abundant or cheap energy, and stored for a certain amount of time. Later, when energy is scarce or expensive, the TES is discharged. This makes TES capable of detaching the energy production from the demand, providing flexibility to the system (Lee 2013; Kousksou et al. 2014).
There are multiple types of TES technologies available today with differing characteristics. As illustrated in Figure 5.1, Lee (2013) classifies the different characteristics of TES into three categories, stating that they may vary in temperature level, time duration of storage and physical storage material.
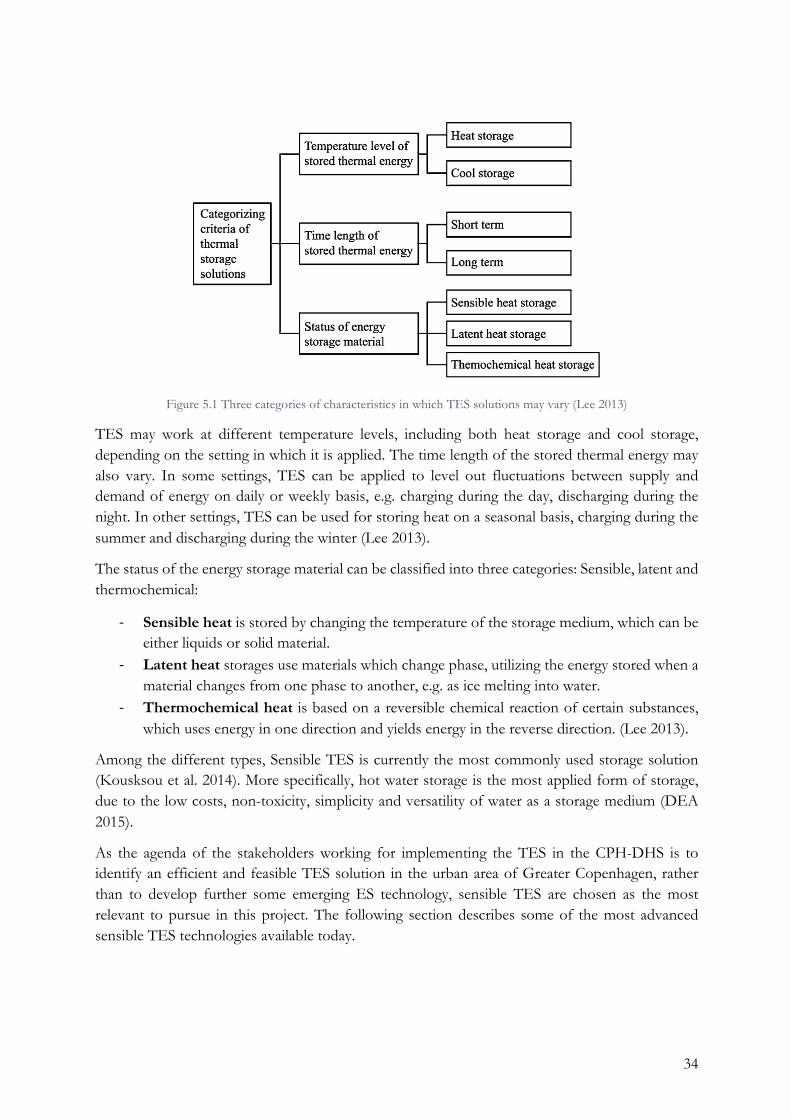
34
Figure 5.1 Three categories of characteristics in which TES solutions may vary (Lee 2013)
TES may work at different temperature levels, including both heat storage and cool storage, depending on the setting in which it is applied. The time length of the stored thermal energy may also vary. In some settings, TES can be applied to level out fluctuations between supply and demand of energy on daily or weekly basis, e.g. charging during the day, discharging during the night. In other settings, TES can be used for storing heat on a seasonal basis, charging during the summer and discharging during the winter (Lee 2013).
The status of the energy storage material can be classified into three categories: Sensible, latent and thermochemical:
- Sensible heat is stored by changing the temperature of the storage medium, which can be either liquids or solid material.
- Latent heat storages use materials which change phase, utilizing the energy stored when a material changes from one phase to another, e.g. as ice melting into water.
- Thermochemical heat is based on a reversible chemical reaction of certain substances, which uses energy in one direction and yields energy in the reverse direction. (Lee 2013).
Among the different types, Sensible TES is currently the most commonly used storage solution (Kousksou et al. 2014). More specifically, hot water storage is the most applied form of storage, due to the low costs, non-toxicity, simplicity and versatility of water as a storage medium (DEA 2015).
As the agenda of the stakeholders working for implementing the TES in the CPH-DHS is to identify an efficient and feasible TES solution in the urban area of Greater Copenhagen, rather than to develop further some emerging ES technology, sensible TES are chosen as the most relevant to pursue in this project. The following section describes some of the most advanced sensible TES technologies available today.

35
5.2 Potential TES technologies Among sensible TES technologies, this report examines two. The Pit Thermal Energy Storage (PTES) and Tank Thermal Energy Storage (TTES) are two options used in Danish DH grids. Other options, such as Borehole and Aquifier thermal energy storage, are also available but will not be analysed in this report.
5.2.1 Tank Thermal Energy Storage (TTES) A TTES is essentially an insulated tank in which water is stored. The size of the TTES may vary according to the needed storage capacity. The TTES can be constructed in steel, glass-fibre reinforced plastic or concrete, and it is usually insulated with 30-35cm mineral wool (DEA 2015).
TTES is an established technology. In Denmark, the technology is typically used together with CHP plants (see Figure 5.2), allowing the plant to run more efficiently and strategically according to the electricity spot market or heat demand. TTES is also applied for almost all biomass heating plants, smoothing their operation and reducing emissions, and also frequently used together with solar thermal plants (DEA 2015). The main issue with this technology is that it requires large volumes, and therefore the setting in which it is implemented needs to have the required space (DEA 2015). TTES are most commonly placed on ground level, but may also be placed underground, as illustrated in Figure 5.3 below.
All TTES have certain degrees of thermal stratification, as warm water rises to the top and chilly water remains at the bottom. Accordingly, a distribution system is installed in the centre of the storage, to eliminate mixing of the temperatures during storage, and studies have shown that this feature increases the efficiency of the storage (Kousksou et al. 2014). The concept is illustrated in the conceptual figure above.
Recent TTES installed in Danish DH systems have been from 1,000 m3 to above 50,000 m3, while the TTES at AMV is 24,000 m3 (Varmeplan Hovedstaden 2014a). In order to be able to charge and discharge following CHP production, TTES typically has a higher charge/discharge capacity than a Pit Thermal Energy Storage (PTES). The TTES at AMV has a charge/discharge capacity of 330 MJ/s.
There is an economy-of-scale present for the technology, meaning that the price per volume differs depending of the size of the tank. A 5000 m3 tank costs around 1100 DKK/m3, while a larger tang
Figure 5.2 CPH plant with connected TTES in Viborg, Denmark (Mørch 2014)
Figure 5.3 Conceptual drawing of underground TTES (DEA 2015)

36
is expected to be slightly cheaper, due to the economy of scale. It is worth noting, that this price does not include the cost of the land on which the TTES is to be placed. The typical heat loss is approximately 5% with a charge/discharge cycle of one week (DEA 2015).
5.2.2 Pit Thermal Energy Storage (PTES) PTES is a relatively cheap solution for storing large volumes of energy in water (DEA 2015; PlanEnergi et al. 2013). The technology essentially consists of a large pit in the ground with a water-proof membrane preventing the water from leaking into the ground. The pit is filled with water and is covered by an insulating lid. The side walls of the pit are normally not insulated, as the soil provides an insulating effect.
Like the TTES, thermal stratification occurs within the pit, and so, a distribution system is also installed in the centre of the pit, as illustrated in Figure 5.5 below. The side walls of the pit are normally not insulated, as the soil provides an insulating effect During the first four years of operation, the heat loss of the PTES is higher than afterwards. This is due to the fact, that the surrounding ground needs to be heated up to ensure proper insulation, and this takes time. The heat loss however gets as low as 3 % after the first few years for very large storages of 500,000 m3, while smaller storages have a bit more loss.
The annual heat loss from a PTES is dependent on the temperatures in the storage, the insulation quality and the charge/discharge capacity. PTES are normally used for seasonal storage, particularly together with solar thermal plants. The size of PTES is therefore typically greater than that of TTES and the costs are lower, although the charge/discharge capacity is lower than a TTES. Due to the spatial requirements of PTES, they are most frequently applied in the perimeter of small towns, where land for accommodating the storage unit (and typically the solar collectors) is relatively cheap (PlanEnergi et al. 2013).
Denmark has numerous PTES installed, including one of the world’s largest, a 203,000 m3 unit in Vojens. The unit has a loss of about 7 % over one charge/discharge cycle and a cost of approximately 150 DKK/m3. Other examples in Denmark are a 60,000 m3 PTES in Dronninglund (Figure 5.4 above), which had a cost of 253 DKK/m3 of which the insulating cover constituted the
Figure 5.4 PTES connected to solar thermal plant in Dronninglund, Denmark (PlanEnergi 2016) Figure 5.5 Conceptual drawing of PTES (DEA 2015)

37
largest individual cost of around 26% (DEA 2015; PlanEnergi 2016). Like the TTES, these prices do not include the cost for purchasing the land, and depending on the geography, these costs may be high, especially in dense urban areas such as the city of Copenhagen.
5.2.3 Summary of TES technologies The two types of TES technologies mentioned above come with different qualities and down sides. The TTES has higher investment costs than the PTES. The PTES has lower cost, but comes with higher space requirements. The PTES also have a higher storage capacity than the TTES. The different characteristics of the mentioned TES technologies are summed up in Table 5.1 below.
Table 5.1 Summary of characteristics of the TES technologies
TTES PTES
Storage medium Water Water
Heat loss (%) 5 5 - 20
Investment (DKK/m3) 1100 253
Advantage High charge/discharge
capacity Low investment costs/
high storage amount
Disadvantage High investment costs / Requires lots of space
Requires lots of space/ low charge/discharge capacity
Due to these characteristics, a PTES solution for implementation in Høje Taastrup DH is chosen. Costing approximately 20% of what a TTES costs, the PTES is the most cost effective and recommendable storage technology for the specific location of Høje Taastrup.

38

39
6 The district heating system of Greater Copenhagen
This chapter presents an overview of the CPH-DHS, including an introduction of the relevant organisational actors, plants and infrastructure, development plans and market setup for DH. The CHP-DHS is a socio-technical network, constituted by the heterogeneous actors of physical transmission and connected heat production plants, organizations, legislation and regulation governing the transactions and delivery of heat. Heat is generated at multiple locations with multiple technologies, spread across municipal borders and managed by multiple companies. Furthermore, the market architecture for DH is designed in a particular way with overall algorithms scheduling the plants and bilateral contracts which determine the price of heat. As such, the CPH-DHS is the market in which the new PTES is to enter. Therefore, this chapter seeks to classify the system and its actors, in order to understand the socio-economic and technological interests of the actors in question.
6.1 The systems, companies and plants The following two subsections describe the transmission companies and their role in the DH system as well as the heat producing plants and their ownership.
6.1.1 Transmission companies There are two DH transmission companies in the Greater Copenhagen area: VEKS4 and CTR5. Figure 6.1 to the right shows the logos of the companies, while Figure 6.2 below shows the geographical areas which these companies cover. VEKS, illustrated in blue, covers 12 municipalities in the western part of the system, while CTR, illustrated in red, covers 5 municipalities in the eastern part of the system. There are currently two additional DH systems in the area. The yellow area in Central Copenhagen illustrates a steam-based DH system which is managed by HOFOR. The green area in the north illustrates the West Incineration area, supplied by the waste incineration plant Vestforbrænding (VF) (Varmeplan Hovedstaden 2014b).
4 Western Municipalities’ Heat and Power Company. In Danish: Vestegnens Kraftvarme Selskab 5 Central Municipalities’ Transmission Company. In Danish: Centralkommunernes Transmissionsselskab
Figure 6.1 The logos of transmission companies VEKS and CTR

40
Figure 6.2 The district heating system of Greater Copenhagen,Authers own representation after Varmelast.dk
The transmission systems of VEKS and CTR, as well as the West Incineration Area, are connected, adding to the flexibility of the overall system, as heat can be transported across organizational boundaries to supply heat demands. The transmission between CTR and VEKS is limited by one 335 MJ/s connection (Varmeplan Hovedstaden 2013). The temperature of the West Incineration Area is higher than that of VEKS and CTR, and therefore heat can only be transferred from the West Incineration Area to VEKS and CTR and not back to the West Incineration Area.
The different plants spread across the system deliver heat to the transmission companies, who in turn deliver it to local DH distribution companies or directly to the consumers (Varmeplan Hovedstaden 2014b). The following section provides an overview of the existing plants.
6.1.2 The plants There are currently four CHP plants and three waste incineration plants in the system, and these are also illustrated in Figure 6.2 above. The waste incineration plants are:
• KARA/NOVEREN (K/N), • Vestforbrænding (VF), • Amager Ressource Center (ARC).

41
The CHP plants are:
• Avedøreværket (AVV), which is owned and operated by DONG Energy • H.C. Ørstedværket (HCV), which is also owned and operated by DONG Energy • Amagerværket (AMV), which is owned and operated by HOFOR • Køge Kraftvarmeværk (KKV), which is owned and operated by VEKS
In the figure, AVV and AMV are represented by two units each, as they are composed of two different heat producing units each. In addition to these, there is also a geothermal plant at AMV, a heat pump (HP) supplying district heating and cooling in Høje Taastrup, and multiple peak load boilers placed across the system supplying peak load heating and providing backup capacity in case of outages in the main plants. DONG Energy also owns the plant of Svanemølleværket, but as this only produce at peak consumption, it is included as part of the peak natural gas boiler capacity.
Towards 2025, which is the reference year of the EnergyPRO model, certain developments are assumed to be done in the system. Firstly, the steam-based DH system in Central Copenhagen is assumed converted to hot water. Second, the AVV and AMV, which currently run on natural gas, coal and biomass, are assumed to be converted fully to biomass in 2025. AVV still has two gas turbines, which are assumed to run on natural gas in 2025. These developments can be expected to occur towards 2025, as DONG has published goals to phase out coal before 2025 (DONG Energy 2017a), and as they are some of the goals established by the project Varmeplan Hovedstaden, which is described below.
6.2 Varmeplan Hovedstaden The major heating companies of Copenhagen, VEKS, HOFOR and CTR started the project Varmeplan Hovedstaden (VPH) in 2008. The initial purpose of the project was to describe available options for developing the DH system towards 2025 (Varmeplan Hovedstaden 2014b). VEKS, HOFOR and CTR all agree on moving towards a CO2-neutral DH supply in 2025. Therefore, the plan seeks to phase out fossil fuels, largely substituting them with biomass. For peak production units, the substitution of fuels is not determined, yet it is assumed to be CO2-neutral. As this transition is still uncertain, this report assumes natural gas is used for peak production, while oil boilers are assumed to be phased out in 2025. VPH argues that large-scale heat pumps (HP) and electrification has potential in the CPH-DHS, if the biomass resources are restricted and terms are made more favorable for HP.
The VPH project also concludes, that there is potential for increasing the TES capacity to increase the flexibility between electricity and thermal production. Further conclusions include positive benefits from lowering the DH temperature to increase the efficiency of plants and allow better conditions for HP and geothermal (Varmeplan Hovedstaden 2014b). The overall DH demand is projected to increase as more dwellings are assumed connected to DH grids, while investments in energy efficiency can limit the overall increase.
As such, the work done by VPH is meant to be a calculative demonstration of the possible future of a CO2-neutral DH supply. It enables a framing of future development where certain technologies are sanctioned, while others, such as fossil fuels, are not part of the future system. It translates DH

42
actors to support a common direction for the system, and thus serves to limit contestations about the future of the DH supply. The VPH project is a central epistemic device, showcasing possible futures for developing the CPH-DHS towards CO2-neutrality. As the project has the support of VEKS, CTR and HOFOR, it shapes the further development of the system by translating actors into a common understanding of the direction of development.
As the above sections show, the DH system is highly interconnected with differing types of companies working together while also having individual interests to pursue, as they own and operate individual plants. To maintain this system, a particular market is established, designed to schedule plants in a least cost marginal price order while also allowing the actors to negotiate individual bilateral contracts determining the price of heat. This market architecture is explained below.
6.3 The district heating market architecture A specific market architecture regulates the heat production and transmission of the CPH-DHS. This report argues, that there are always a set of rules and understandings, laws and regulations, relationships and agreements which constitute a specific market architecture, in which a commodity is traded and priced. DH as a commodity has, in a Danish context, traditionally been produced as a by-product of electricity generation, and has thereby increased overall plant efficiency. It is produced at CHP or waste incineration plants, and supplied through a dedicated infrastructural system of pipes, pumps and exchange stations. This, in turn, has coevolved with the supporting legislation and organizational setup, where heat price regulation is in place to counter monopoly pricing while making sure plants can cover their investments. Today in the CPH-DHS, load-scheduling is done following marginal production prices by one central actor, Varmelast.dk, while prices are set by bilateral contracts. Thus, a specific market architecture exists for the scheduling of plants, and one exists for determining the price. The following sections will elaborate on the scheduling of plants and the price setting mechanisms in the CPH-DHS.
6.3.1 Load scheduling of plants Load-scheduling is done by Varmelast.dk, by optimizing after least-cost approach to meet the heat demands. Varmelast.dk is a partnership between VEKS, CTR and HOFOR established in 2008 (Varmelast.dk 2017a). The reason for establishing a separate scheduling institution was to economically optimise the heat production across all plants, while still maintaining the needed confidentiality related to the CHP plants’ operation on the electricity market. The daily heat plans are generated based on an economic optimisation considering the following criteria:
• Heat and electricity demand forecasts • Prioritised production capacities • Production costs, including
o Fuel prices, o O&M costs, o Taxation, o CO2 quotas, o Revenue from electricity sales
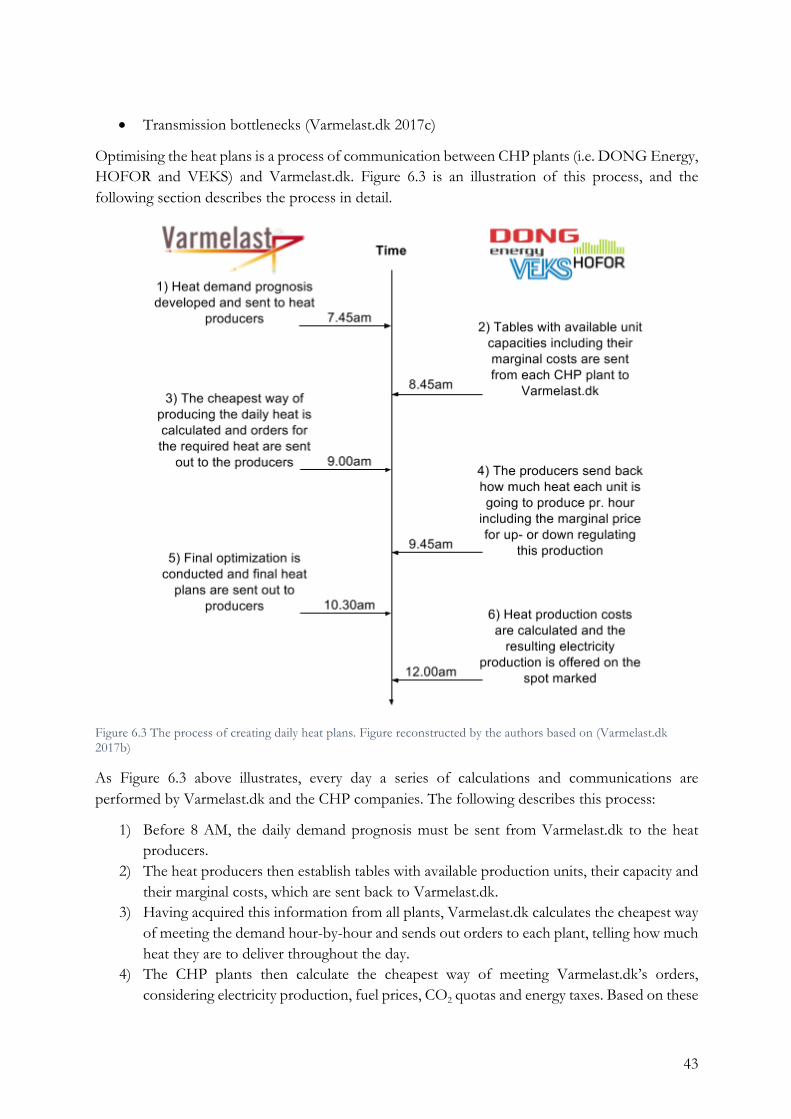
43
• Transmission bottlenecks (Varmelast.dk 2017c)
Optimising the heat plans is a process of communication between CHP plants (i.e. DONG Energy, HOFOR and VEKS) and Varmelast.dk. Figure 6.3 is an illustration of this process, and the following section describes the process in detail.
Figure 6.3 The process of creating daily heat plans. Figure reconstructed by the authors based on (Varmelast.dk 2017b)
As Figure 6.3 above illustrates, every day a series of calculations and communications are performed by Varmelast.dk and the CHP companies. The following describes this process:
1) Before 8 AM, the daily demand prognosis must be sent from Varmelast.dk to the heat producers.
2) The heat producers then establish tables with available production units, their capacity and their marginal costs, which are sent back to Varmelast.dk.
3) Having acquired this information from all plants, Varmelast.dk calculates the cheapest way of meeting the demand hour-by-hour and sends out orders to each plant, telling how much heat they are to deliver throughout the day.
4) The CHP plants then calculate the cheapest way of meeting Varmelast.dk’s orders, considering electricity production, fuel prices, CO2 quotas and energy taxes. Based on these

44
calculations, the heat producers send detailed plans to Varmelast.dk for how much each unit is going to produce hour by hour, as well as marginal prices for up or down regulating this production.
5) Having gathered this information, Varmelast.dk performs a final optimization considering bottlenecks in the system and optimal usage of the TTES at AMV and AVV. Final heat plans are then sent to each producer ordering the exact amount of heat to be produced by each unit, hour-by-hour for the next 24 hours.
6) Due to the producers’ parallel operation on the electricity spot market, the final scheduling of the plants must be done before 10.30 AM so that the producers know how much heat they are to produce, and thereby also how much electricity they can offer on the spot market which closes at noon.
Nevertheless, even after the calculations and optimisations, the heat plans are adjusted three times a day to meet unexpected events affecting the supply and demand. For example, the actual heat demand might differ from the projected head demand on which the plans are based, or incidences might occur at the CHP plants causing them not to be able to meet the required production. Therefore, the heat plans are adjusted at 8 AM, 3.30 PM and at 10 PM (Varmelast.dk 2017c).
While this method ensures that the plant with the lowest marginal heat costs is scheduled first, this does not translate into the actual heat sale price. This is explained in the next section.
6.3.2 Determining the heat price The price at which heat is traded is not determined at Varmelast.dk, but by bilateral agreements between VEKS, CTR and HOFOR on one side, and the CHP and waste incineration plants on the other. Several schemes are used in determining the heat prices. First off, the price of heat is determined by a non-profit principle6, described in §20 of the Statutory order of law on heat supply (LBK nr 1307 2014)7. It describes, that only necessary expenses can be included in the price, such as investments, fuel costs, O&M, salaries etc. Biomass fuelled plants can include the taxation advantage8 compared to fossil fuels in the heat price, according to §20 pt. 15. This states, that biomass fuelled plants may include the difference payed in energy taxation between fossil fuels and biomass, as revenue from their heat sales, thus resulting a financial advantage for biomass based plants.
The price of heat production from waste incineration plants is regulated by the lowest of two calculation methods (BEK nr 1213 2012): the price cap or the necessary cost of heat as described in LBK 1307 §20 above. The price cap is 306 DKK/MWh in 2017 (Danish Energy Regulatory Authority 2016), thus not allowing waste incineration plants to charge more for their heat production. The waste incineration plants must choose the lowest price of their heat production costs and the price cap. The necessary cost of heat is determined following the same regulation as other CHP plants.
6 Danish: Hvile-i-sig-selv princippet 7 Bekendtgørelse af lov om varmeforsyning (Varmeforsyningsloven) 8 Danish: Afgiftsfordel

45
Furthermore, waste incineration plants are subject to the substitution principle, regulating that no plant can produce heat, if a cheaper option is available. This principle is what Varmelast.dk follows in their load scheduling, by prioritizing the least cost plants. It is, however, not necessarily subject to the actual heat pricing, as the heat sales price is different from the scheduling costs.
As the heat sale prices are determined in classified bilateral contracts, it has not been possible to access and confirm the specific method used for heat price setting. From interviews with the actors in the field, a general understanding of the principles used is reached. Typically, the heat sales are split between a fixed yearly cost covering investment costs, fixed O&M and other non-production dependent expenses, and a variable cost covering fuel costs, variable O&M and other production dependent expenses. As it is difficult the determine the share of fuel costs and O&M between the electricity and heat production, a fixed ratio is used. For waste incineration plants, the heat sales price cover both fixed and variable costs, as they have historically run as base load units. As a result, the actual heat sale price is not necessarily a representation of the actual costs attributed to heat production, but rather a negotiated method of pricing.
The pricing mechanisms used is thus shaped by the particular market architecture of the DH system. Legislation describes which factors can be included in the heat price, and the actual share of fuel used for heat and electricity must be approximated. Although a general non-profit principle exists, there are possibilities for actors to include some revenue, either through a larger share of fuel costs covered by the heat side or including the option of the biomass taxation benefit.
6.4 Summary This chapter has presented the CPH-DHS, including the organisations, technologies and market architecture of which it consists. Conclusively, the system is a socio-technical network composed of an interconnected web of different heterogeneous actors. On the one side, the organisations cooperate in developing the DH system through the planning activities of the VPH. On the other side, however, they also have their own technical and economic interests to pursue, as they own and operate different plants and infrastructure. Therefore, their position and operation in the DH market are governed by a specific market architecture, which has coevolved with the technological development of the DH system. A particular property of the DH market set-up is the fact, that the price of heating is not the same as the marginal cost for producing heating, as load scheduling is performed after a marginal cost optimisation, while the price of heating is determined in bilateral contracts between heating companies and producers.
As the different organisational actors of the CHP-DHS are configured differently within the socio-technical network, their perceptions and valuations of a new PTES entering the DH market are shaped by their configuration and thus they differ. Embarking from the descriptions of this chapter, the following chapter analyses how the interviewed actors value a new PTES.

46

47
7 The valuation framings of the PTES Novel technologies need to have their properties defined, valued and eventually priced. This also applies when the PTES is to enter the DH market of Greater Copenhagen. This chapter seeks to analyse, which qualities of a PTES are highlighted, when the incumbent actors of the DH market describe their specific wishes and requirements regarding the technical and economic configuration of the new PTES. It also aims to present the state of uncertainty actors experience when addressing the PTES, as this can result in a divergence of valuations, with a larger emphasis of actors own socio-technical network position and perception of the technology. As such, the goal is to identify these differing valuations, and analyse them as valuation frames. The valuation frames are identified by perceiving the interviewed actors as frame-makers.
To assess why the actors propose differing valuation frames, it is also necessary to consider their socio-technical and economic positions, which shape their way of valuing the qualities of the new PTES. The actors’ techno-economic constellation is described above in the preceding chapter. This is further applied in this chapter in relation to how this shapes the actors’ valuation of the PTES. Starting with VEKS, this chapter thus describes which valuation frames are proposed by the interviewed actors. This is done by considering their techno-economical configuration as well as applying their statements during the interviews. Furthermore, this chapter concludes with a discussion of how the identified valuation frames overlap or differ in the pursuit of settling the qualities of the PTES, as the actors support different valuation frames.
To recapitulate, the interviewed actors are:
• VEKS • Høje Taastrup District Heating • KARA/NOVEREN • Varmelast.dk • HOFOR
7.1 VEKS VEKS is one of the transmission companies in the CPH-DHS and delivers heat to 12 municipalities in the western part of the system. Furthermore, they are part of the VPH collaboration and they are part of Varmelast.dk. As such, they have a significant role in the system, being the link between producers and consumers of heat and being one of the key developers of the system. This role has led them to view themselves as either the project owner or as owning the project together with someone else. J.B. Sørensen explains:
When something is added to the system, we want it to go through Varmelast.dk, to ensure that no one is sub-optimizing for themselves. And this, we believe, works best if we are the ones adding it to the system, and thereby are the owners of it (VEKS 2017).
This statement presents the valuation frame of “system optimization”. VEKS believes the best setup would be for the PTES to be dispatched through the optimisation process at Varmelast.dk,
48
so that the entire system benefits from it, rather than individual actors sub-optimizing for themselves.
Being the project owner, VEKS need to convince the other actors that the project is a worthwhile investment. This requires VEKS to consider the value for other actors in the system, and this seems to characterise the valuation frames VEKS creates. During the interview, M. Stobbe and J.B. Sørensen frame several potentials from implementing the PTES, including benefits for both heating and producing companies:
We can all agree, that the benefit for the heating companies will typically be, that they can exchange some peak production [Natural gas boiler production, ed.] with some CHP production … And the CHP plants also see a benefit in using the storage, when they can sell their electricity at a good price (VEKS 2017).
This statement frames the PTES as having the ability of lowering natural gas boiler production as well as increasing the electricity sales for CHP plants, creating valuation frames “reduce peak production” and “increase CHP production”. However, they also mention that CHP plants are likely to have the greatest potential benefit, and therefore, they should also contribute to the investment of the PTES:
There is a value in the storage for both heating companies and CHP companies, and it looks like … it is the CHP companies, who receive the largest value from it. This is what we want to try to tell them. And if they think that it is interesting and they buy into the premise, well, then we think that they should contribute to the installation costs, corresponding approximately to the share of value, which they gain from it (VEKS 2017).
In order to enrol actors, VEKS suggests that a set of qualifying calculations should be set up, through which all actors can get their valuations tested and classified. The comment by M. Stobbe of “It looks like..”, suggest a uncertain situation where several devices of both profession and calculation shape the valuation. J.B. Sørensen states, “We need to make some calculations, which all stakeholders believe in, and then this is what we act upon”. As such, calculative work is needed, “bringing the PTES into being” to alleviate the uncertainty surrounding the impacts of the PTES.
Currently one factor of uncertainty is related the PTES’s ability to deliver back to the transmission grid. VEKS’s former analytical work implies that there is a benefit in it being able to return to transmission, but the technical solution of how to practically discharge to the transmission grid is not determined yet. VEKS has one main proposal; discharging into the return transmission and thereby increasing the return temperature as a consequence. This implies a tariff for decreasing the efficiency at the CHP plants, but according to their analyses this would still be a feasible option. A framing of “deliver to transmission via return” is identified.
If all actors can be enrolled to support the investment by a calculative device, then the calculations could form the basis for dividing the investment among the actors. According to J.B. Sørensen, agreeing on the division before the investment is made would be better than trying to identify who really harvests the benefits of the PTES after its implementation and dividing the investment based on this. VEKS rather argues, that the investments should be split according to the actors’ benefits. Thus a framing of the investment model of “actors invest per benefits” is identified.

49
Thus, VEKS, just like Mitchell’s (2008) example with Edison, creates a set of valuation frames which together are supposed to translate and enrol the other actors to participate in the investment of the PTES. The valuation frames proposed by VEKS are presented in Figure 7.1. Firstly, they frame the PTES as substituting peak production with CHP production, lowering expenses for heating companies and increasing profits for CHP plants. Furthermore, they frame the PTES as being a system storage, which accordingly should be dispatched through the optimisation process at Varmelast.dk. Uncertainties still exist about the benefits for individual actors and the method for enabling the PTES to deliver back to the transmission grid.
7.2 Høje Taastrup District Heating Høje Taastrup District Heating is the DH company of the municipality of Høje Taastrup. As such, they buy heat from VEKS, and distribute it to their local costumers. A reason why Høje Taastrup DH proposed building a PTES, is that they have excess heat available from a HP, which currently generates district cooling during the summer season. It also generates heating, but during the summer period, where cooling demand is high and heating demand low, part of the heating is not utilized and thus wasted. The idea is therefore, that the excess heat from the HP could be stored during the summer and used during colder months; hence the valuation framing of “use excess heat” is identified. According to the initial project proposal for their HP, the PTES and utilization of the excess heat is a condition for the economic feasibility of the HP (Rambøll 2015). In addition to the HP, there is also industry in Høje Taastrup DH, which generates some excess heat that can be utilized, and there are currently plans for adding photovoltaics, which will also provide excess heating from electricity production. In addition to this, U. Schleiss also sees a possibility for the HP to play a role in the Balancing Market for electricity, if the HP is connected to the PTES (Høje Taastrup Fjernvarme 2017).
HTDH argues, that being able to deliver back to the transmission network will increase the value, but they are uncertain about the specific method for doing this. While the “deliver via return” is possible as mentioned by VEKS, Høje Taastrup DH also propose an option of “deliver via booster”, which via an electric boiler or heat pump can increase the temperature of the water, and supply to the delivery transmission system. This has
VEKS
Reducedpeak
prod.
Systemoptimiza-
tion
IncreasedCHP
prod.
Delivertotrans.viareturn
Figure 7.1 Elements in the valuation frame of VEKS
HTDH
UseExcess
heat
Delivertotrans.via
booster
Figure 7.2 Elements in the valuation frame of Høje Taastrup DH DH

50
higher investment costs, but does not increase the return temperature and thus eliminates the need for a tariff payment for the resulting lower plant efficiency.
HTDH argues that as long as they can utilize the excess heat, the store can be operated by other actors, for example Varmelast.dk. Their main priority is the ability to store heat, and not necessarily who operates the PTES.
7.3 KARA/NOVEREN Kara/Noveren (K/N) is a waste incineration plant in the town of Roskilde, located in the transmission grid of VEKS. Being a waste incineration plant, their main purpose is to incinerate waste produced by the nine municipalities which own the plant. As waste disposal is a bound task, they are currently prioritised in Varmelast.dk’s daily heat plans and they produce district heating and electricity at peak capacity most of the time. According to K/N, had they not been prioritised in the heat plans, however, they would probably still produce heat and power at baseload, as they have the low marginal costs. This is because, whereas conventional CHP plants must pay for the fuel they burn, waste incineration plants are payed for receiving and incinerating waste.
As K/N is prioritised in the market, even with a new PTES, they would not have much incentive to run flexibly following the electricity price, according to K.W. Hansen, but rather produce stable baseload. However, they see another type of potential in the new PTES. According to K.W. Hansen, the heat demand is currently too low during the summer months, which means that the incineration plants do not get to run on full capacity. This wears down their turbines, which should preferably run at full capacity at all times. As such, K.W. Hansen frames the PTES as a new heat consumer, which would increase the demand during the summer, thereby potentially making the summer operation of K/N smoother. Therefore, the valuation framing of “increasing summer demand” is identified.
In addition to the summer-related challenge, K/N also sees a potential for the PTES to make their operations and maintenance more flexible. Currently, they are bound to perform a thorough three-week cleaning of their boilers during the summer months, as this is the period of the lowest heat demand. However, this is also the time during which the other incineration plants perform their cleaning. This creates a logistical problem, as there are only a limited number of maintenance workers available, who can do these types of operations, and this makes the whole affair more costly and complicated. Furthermore, due to an increasing expertise in operating and maintaining waste incineration plants, there is, according to K. W. Jensen, no longer a need for cleaning the boilers every summer. Technically, the three-week cleaning could take place less frequently. This would make the incineration plant run more hours a year, increasing the feasibility of the plants, thus resulting in the “flexible O&M” framing (KARA/NOVEREN 2017).
K/N
FlexibleO/M
Increasedsummer
demand
Figure 7.3 Valuation frame of K/N

51
Asked if he believes the new PTES would make this possible, K.W. Jensen states: “yes, because there needs to be a demand somewhere, and the PTES is essentially just a large consumer” (KARA/NOVEREN 2017).
Thus, K/N frames the PTES as having the potential of increasing heat demand during the summer period as well as bringing the possibility of postponing the three-week cleaning period. These two valuation frames are presented in Figure 7.3.
7.4 Varmelast.dk As previously explained, Varmelast.dk is the coordinator of the daily heat plans, scheduling when and how much heat each plant needs to produce every day. As such, they seek to optimize both heat and power production.
P. Folke, economist at Varmelast.dk, sees potentials for implementing more storage capacity in the CPH-DHS. Especially a new PTES would supplement the existing TTES well, because a PTES typically has low charge and discharge capacities, but high total heat storage capacities, in contrast to the existing TTES, which have high charge and discharge capacities, but low total heat storage capacity. However, P. Folke sees one major limitation in the CPH-DHS when it comes to implementing more TES capacity: the connection between VEKS’ transmission system in the west and CTR’s transmission system in the east has too low capacity. He explains:
We have a lot of production [in VEKS’ area] and a lot of consumption [in CTR’s area], and then we have one connection between CTR and VEKS’ systems, which is by Damhussøen. And it is a constant challenge to push the heat in to Copenhagen, where the consumption is (Varmelast.dk 2017b).
Here P. Folke stress, that because most of the heat demand is in Copenhagen and most of the production capacity is located in the western part of Greater Copenhagen, the one connection poses challenges for the system to supply heat efficiently to all customers. Furthermore, this fact causes P. Folke to believe, that a new TES would be more beneficial if it was implemented east of Damhussøen, i.e. in the transmission system of CTR. “It would be so much better, if you build a storage in here [i.e. in CTR’s area, ed.]” he states (Varmelast.dk 2017b). The challenge, however, is finding an area in this part of Copenhagen, with enough space and which is not too costly. As P. Folke puts it: “It’s not so straight-forward to find an unused gravel pit in Central Copenhagen.”(Varmelast.dk 2017b).
Therefore, Varmelast.dk frames the PTES as being a “system storage”, which has the potential of supplementing the existing TTES, if it is operated through their optimization. This valuation frame is presented in Figure 7.4.
Varmelast.dk
Systemoptimiza-
tion
Figure 7.4 Valuation frame of Varmelast.dk

52
7.5 HOFOR HOFOR is the Copenhagen utility company in charge of supplying DH for Central Copenhagen. Furthermore, they own and operate Amagerværket (AMV). Together with CTR and VEKS, they engaged in VPH and the establishment of Varmelast.dk. Furthermore, HOFOR is responsible for managing the planning activities of the Municipality of Copenhagen in reaching its 2025 carbon neutrality climate plan. As such, they have had interest in increasing TES capacities in their area for some time, and have made some analyses of the issue, including one feasibility study of building a PTES in a drydock in the North Harbour. This location, however, turned out to be too far away from the transmission lines for the project to be feasible (HOFOR 2017).
M. N. Nielsen explains, that they have since looked at the geographical and technical opportunities that are present in Central Copenhagen, and due to the limitations of being in the city, the most realistic option, from their view, is to build more TTES capacity in the vicinity of AMV. Accordingly, they agree with Varmelast.dk in that the spatial requirements for at PTES is a limitation in the eastern part of Greater Copenhagen. As N. Hendriksen states, “It’s not like there is a giant field available, and if there is, it would rather be used for housing, as otherwise the TES would become extremely expensive” (HOFOR 2017). Nevertheless, they also agree that having both PTES and TTES capacities would be the optimal setup. M. N. Nielsen argues, “It would be optimal to have both [types of storages, ed.] in the capital’s district heating area, since they are capable of different things”(HOFOR 2017).
Through HOFOR’s own analyses, they have found out, that the most economically feasible set up of a storage is for it to be a system storage, meaning that it should be connected to the transmission grid and dispatched through Varmelast.dk. HOFOR’s analyses contribute to the view that a PTES will enable increased CHP production while decreasing peak production, this being of value to HOFOR and AMV. They, like VEKS, argue, that the most feasible solution is a PTES that can deliver heat back to the transmission system. They although disagree on the solution for transmission discharge through the return delivery, as this will increase the return temperature and be against the goals from VPH of lowering the DH temperatures. For HOFOR, another solution, such as a connected electric booster HP would be a preferable option, and they thus apply the “return to transmission via booster” framing.
However, in their economic analyses they have reached the same problem as VEKS; i.e. they have identified a set of system potentials from implementing more storage capacity, but they have not been able to specify, which actors will harvest the profits. Therefore, they are also faced with the issue of establishing a business model which fairly divides the investment and the use of the storage among the actors, according to their harvested benefits. Nevertheless, they have made some considerations as to how a business model could and should look like. M. N. Nielsen states:
I, for one, see it as being problematic, if multiple actors competing on the electricity market invest or own the same heat storage together. I don’t think it would work. That’s why we have concluded, that a new heat storage in Copenhagen can only be owned by a DH company, e.g. HOFOR DH, and then the producers should somehow pay to the storage, whether it be a rental cost or a tariff or something (HOFOR 2017).

53
Accordingly, they believe that the heating companies should agree on one type of best-practice model, which they can present to the heat producers as the model which will be used for all storages in the future. Furthermore, HOFOR has doubts regarding a version of a business model where competing CHP plants invest in the same PTES, like AVV and AMV. HOFOR applies a “no competitors should invest together” as a framing of the investment. Essential for the investment model, they argue, is that every actor pays according to his share of the profits, unlike the case of the existing TTES at AMV and AVV, where VEKS and CTR invested one third each, while AMV invested the remaining third for the AMV TTES and AVV invested the remaining third for the AVV TTES (HOFOR 2017). This model includes some overflows, as some actors are bound to pay for the benefits harvested by others. Therefore, HOFOR promotes the framing of the investment, that “actors pay per benefits”.
HOFOR thus values the system benefits, increased CHP production and return via booster of an eventual TES, and therefore promotes these valuation frames, as shown in Figure 7.5. Whether it should be a PTES or TTES depends on the actor planning it, and HOFOR has found increased TTES capacity more applicable in their area, while still agreeing, that a PTES would work well in VEKS’ area. However, HOFOR stresses, the business model for both types of storages should be similar and agreed upon before any investment is made. The model should be based on a set of energy system calculations, which show the division of the benefits, and on which all actors concur; i.e. calculations which bring the TES into being. HOFOR also have two framings of the business model: that actors should pay according to benefits, and it is problematic to have competitors invest in the same storage.
HOFOR
Systemoptimisa-
tion
IncreasedCHP
operation
Delivertotrans.viabooster
Reducedpeakprod.
Figure 7.5 Valuation frame of HOFOR

54
7.6 Discussion of valuation frames From the above sections, multiple valuation frames have been identified, and these are summed up in Table 7.1 below. Different valuation realities have been identified, being shaped by the actors’ socio-technical configurations within the district heating infrastructure.
Table 7.1 Valuation frames of the interviewed actors
From the identified valuation frames it can be seen, that the current situation is unsettled. The actors find themselves in a techno-economically uncertain space, in which they have certain wishes
Valuation frame Narrative/Metric Valuation network
Reduced peak production District Heating companies save expenses and shift away from fossil fuels.
VEKS, HOFOR
Increased CHP production CHP companies increase revenue from electricity sales.
VEKS, HOFOR
System economy and optimization
The PTES brings benefits for the system and should therefore be dispatched through the optimization process at Varmelast.dk.
VEKS, HOFOR, Varmelast.dk
Use Excess heat The PTES utilizes excess heat available in Høje Taastrup.
Høje Taastrup DH
Flexible incineration plant renovation and increased summer demand
The PTES is a new heat consumer, which increases the heat demand during summer and allows for postponing the renovation period.
KARA/NOVEREN
Deliver to transmission – Via return
Increasing the value of the PTES, as the DH system it can deliver to is expanded. Will deliver through the return on transmission network.
VEKS
Deliver to transmission – Via booster
Increasing the value of the PTES, as the DH system it can deliver to is expanded. Argues, that delivery via return decreases the efficiency at plants and is against goals set by VPH. Hence recommending a booster HP.
HOFOR, Høje Taastrup DH

55
and anticipations regarding the qualities of the PTES, but since these have not been qualified, they remain uncertain about them. All the actors have expressed uncertainty about the situation, and called for additional knowledge production concerning the PTES.
However, whether the qualification will lead to a settlement of the situation is not certain, as the valuation going into creating the model may produce results which do not comply with those of the actors. If a settlement is to be reached, then some valuation frames must prevail over others and actors must be enrolled into the valuation network. As argued in the theoretical framework in chapter 3, situations of framing do often also result in overflows, where certain valuation framings are not considered or left out. Thus, it is important to be aware of which valuation frames are not supported by prevailing framings.
The different proposed valuation frames imply, that the PTES has not yet been rendered passive and still has several “unknown” properties. As an example, several actors promote the valuation frame of system optimization, arguing that the PTES needs to support the overall system performance rather than individual actor’s proposals. Simultaneously, actors also promote valuation frames closely tied to their own technological reality, as Høje Taastrup DH and K/N mention the usage of excess heat in Høje Taastrup DH and the flexible O&M at K/N, thus promoting valuation frames supporting individual needs for the actors. As the PTES has not yet been qualified, it remains uncertain whether it is able to meet all these valuation frames.
Likewise, HOFOR is also basing their valuation framings on their own calculative demonstration, analysing a different storage, yet subject to the same challenges of valuation. While HOFOR agrees that a business model needs to be replicable, and the PTES should operate as a system store, they do not deploy the same valuation of the ability to return on transmission level. While VEKS is prepared to pay a tariff for using the return transmission, HOFOR argues that this conflicts with overall goals of lowering the DH temperature. The value of both the “return to transmission” and how the two models are proposed to technically function, are in a need of being qualified.
While not directly related to the value of the PTES, framings of the investment have also been identified. HOFOR applies a “no competitors should invest together” framing, and VEKS and HOFOR both argue, that the investment should be made so “actors invests per benefits”. The “actors invest per benefits” implies a shift from past models where the investment costs were distributed evenly among investors, not taking individual benefits into account.
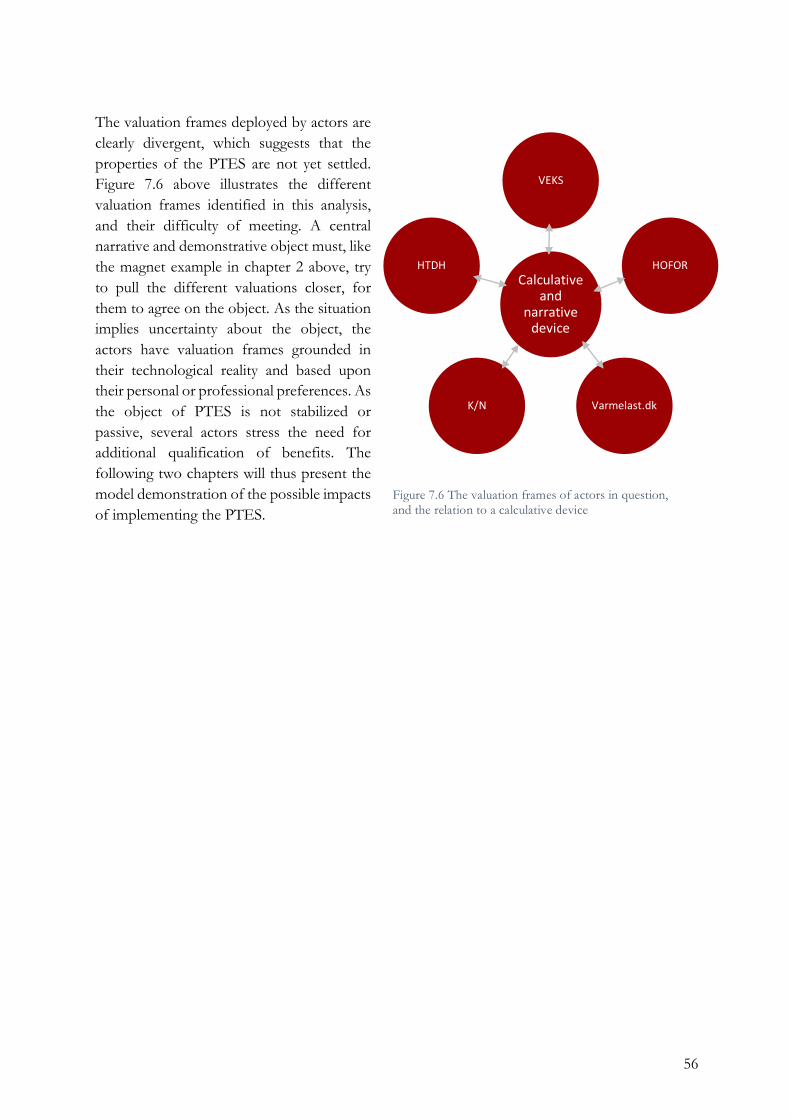
56
The valuation frames deployed by actors are clearly divergent, which suggests that the properties of the PTES are not yet settled. Figure 7.6 above illustrates the different valuation frames identified in this analysis, and their difficulty of meeting. A central narrative and demonstrative object must, like the magnet example in chapter 2 above, try to pull the different valuations closer, for them to agree on the object. As the situation implies uncertainty about the object, the actors have valuation frames grounded in their technological reality and based upon their personal or professional preferences. As the object of PTES is not stabilized or passive, several actors stress the need for additional qualification of benefits. The following two chapters will thus present the model demonstration of the possible impacts of implementing the PTES.
Calculativeand
narrativedevice
VEKS
HOFOR
Varmelast.dkK/N
HTDH
Figure 7.6 The valuation frames of actors in question, and the relation to a calculative device

57

58

59
8 Technical impact of PTES implementation
This chapter presents the technical results of the EnergyPRO analysis. The structure of this analysis is as follows: First, the results of the established business-as-usual reference scenario are presented. Second, the two alternative scenarios are compared to the reference scenario in terms of technical impacts of implementing the PTES. To recapitulate, the alternative scenarios are:
• Alternative 1: Implementation of 100.000 m3 PTES in the Høje Taastrup DH distribution area, without the ability to deliver heat back to transmission level.
• Alternative 2: Implementation of 100.000 m3 PTES in the Høje Taastrup DH distribution area, with the ability to deliver heat back to transmission level.
8.1 Reference scenario The following subsections present the results of the reference scenario. First the overall heat production of the reference year 2025 is presented, including which plants produce heat when throughout the year. Second, the heat production from the HP currently installed in Høje Taastrup is presented.
8.1.1 CPH-DHS heat production Figure 8.1 illustrates the share of production units meeting the demand in the reference scenario. CHP plants produce two-thirds of the supply with waste incineration supplying 29%. Peak boilers supply 4%, and the Høje Taastrup HP and geothermal unit at AMV supplies the last 1%.
Figure 8.2 below presents the daily heat production in the reference scenario. Waste incineration plants produce throughout almost the entire year, with CHP plants supplying heat outside of the summer period. Natural gas boilers are producing to meet peak demand during high consumption.
Except for the waste incineration plants and partly AVV2, the production is limited during summer due to low heat demand. The downtime for plant renovation can also be observed in Figure 8.2, for example as AVV2 is out during May, and the waste incineration facilities following each other from end of July to August.
29%
66%
4% 1%
Shareofproductionsupply
type
WasteIncineration CHPPlants
PeakBoilers Other
Figure 8.1 Share of production type

60
Figure 8.2 The reference scenario heat production profile, daily.
A duration curve for the yearly heat production profile is presented in Figure 8.3 below. Waste incineration supplies baseload through most of the year. ARC and KN have a capacity factor of 94% with 93% for VF. The CHP plants are producing with capacity factors around 50%. Natural gas boiler production is needed for about a third of the year, and 89 days with a daily production above 1000 MWh. The total amount of natural gas production is 484.000 MWh in the reference scenario, with a capacity factor of 4%. The maximum natural gas peak boiler capacity used is 1546 MW.
00
10
20
30
40
50
60
70
80
GWh
ReferenceScenarioHeatProduction
Geothermal_ElecHeatpump ARC KN_WasteVF_Waste KKV_CHP AMVBIO4AMVBIO4_bypass AVV_1 AMV1_CHPAVV_2_main AVV_2_Straw_boiler HCV_CHPGasboiler AVV_2_Gas_T HTHeatPump

61
Figure 8.3 Duration curve for heat production, daily
In the reference scenario, 67.6% of the fuel consumed is biomass, with the majority being wood pellets (40.6%), followed by wood chips (23.5%) and straw (3.5%). Waste supplies 28.7% of the fuel consumption, and natural gas supplies 3.7%. The system is therefore widely dependent on biomass and waste supply, and no significant amount of electricity for heating is used in the system.
Figure 8.4 Share of fuel consumption in the reference scenario
0
20
40
60
80
100
0102030405060708090
100
110
120
130
140
150
160
170
180
190
200
210
220
230
240
250
260
270
280
290
300
310
320
330
340
350
360
GWh
HeatproductiondurationcurveReferencescenario
Geothermal_ElecHeatpump ARC KN_Waste
VF_Waste KKV_CHP AMVBIO4
AVV_1 AMV1_CHP AVV_2_main
AVV_2_Straw_boiler HCV_CHP AMVBIO4_bypass
Gasboiler AVV_2_Gas_T ElecBoiler
44%
24%
2%
26%
4%
ReferenceScenario
FuelConsumption
WoodPellets
WoodChips
Straw
Waste
NaturalGas

62
8.2 Høje Taastrup Distribution system The only distribution level system included in the analysis is the district heating area of Høje Taastrup, due to the location and technical aspects of the PTES. Figure 8.5 below presents the production profile of the heat pump along with the surplus heat produced during summer. The heat pump production profile is tied to the cooling demand, and capacity increases from 10 MW to 14 MW as efficiency increases during summer. This results in a yearly heat rejection of 4,039 MWh from a total production of 35,224 MWh, or 11.5% of the total heat pump thermal production.
Figure 8.5 Høje Taastrup DH heat pump production profile, with unused heat production
00
20
40
60
80
100
120
140
160
180
200
MWh
HøjeTaastrupHeatPump
Productionprofile
HTHeatPump HeatRejection

63
8.3 System impact of PTES implementation The following sub-sections present the technical impacts of implementing a PTES in the CPH-DHS. First, the impacts on the production units are addressed including how the PTES affects heat and electricity production, as well as fuel consumption of the system. Then follows an in-depth description of how waste incineration plants are affected when unprioritized in the market.
8.3.1 Production unit impact The change in heat production per unit from the implementation of a PTES, compared to the reference scenario, can be seen on Figure 8.6 below. Positive impact illustrates increased production, while negative impact illustrates decreased heat production. Figure 8.6 shows that there is not necessarily a linear impact on the same unit from alternative 1 and 2, meaning that some units increase production in alternative 1 while decrease in alternative 2, and vice-versa. Other plants have more clear impact of increased or decreased production.
Figure 8.6 The change in heat production per plant in alternative 1 and alternative 2
The calculations show, that ARC is lowering the heat production in alternative 1 and 2, and VF and K/N are lowering the heat production in alternative 1 but increasing the production in alternative 2. AMV 1 is projected to increase the heat production, but with a higher heat production in alternative 1 than alternative 2. AMV BIO4 decrease production in alternative 1 and increase production in alternative 2, while the bypass function has the opposite impact. AVV 1 is increasing the heat production in alternative 1 while lowering the heat production in alternative 2. All units at AVV 2 are expected to increase heat production. The CHP production at HCV is increasing in both scenarios, while KKV is decreasing in alternative 1 and increasing in alternative 2. The Peak heat production is lowered in both scenarios. Furthermore, the excess heat from the HP in Høje
-40
-30
-20
-10
0
10
20
30
40
GWh
Changeinproductionfromreferencescenario
Alternative1 Alternative2

64
Taastrup is utilized with the PTES, and as such is 4,039 MWh of heat is added from the HP production.
8.3.2 Change in fuel consumption The change in fuel consumption is presented in Figure 8.7. The natural gas consumption is decreasing in both alternatives as peak generation is limited. Waste incineration is also decreasing, while straw usage is increasing in alternative 1 but decreasing in alternative 2. Wood chip consumption decreases in alternative 1 but increases in alternative 2, while wood pellet consumption increases in alternative 1 and decrease in alternative 2. Alternative 1 saves 27 GWh and Alternative 2 saves 35 GWh of natural gas consumption, while shifting the consumption towards biomass. For Alternative 1 this is a reduction of 4.4% while Alternative 2 reduces the natural gas consumption with 5.8%.
8.3.3 Change in electricity production Figure 8.8 below shows the change in electricity production from the reference scenario to the two alternatives. From implementing a PTES, several MWh will be shifted and additional electricity generation is allowed. The increase in electricity generation is 14.3 GWh for alternative 1 and 8.1 GWh for alternative 2. As the figure only illustrates the change in electricity generation, the peaks illustrated only represent increased or decreased production in a given day. In general t can be seen, that due to the PTES implementation, more electricity is generated during hours with high electricity prices, and less electricity is produced during hours with low electricity prices.
Alternative1 Alternative2
NaturalGas -27 -35 Waste -12 -05 Straw 01 02
WoodChips -28 12
WoodPellets 44 -10
-80 -60 -40 -20 00
20
40
60
GWh
Changeinfuelconsumption
WoodPellets WoodChips Straw
Waste NaturalGas
Figure 8.7 Change in fuel consumption from the reference scenario to alternatives 1 and 2, GWh

65
Figure 8.8 Change in electricity generation from reference to alternative 1 and 2, daily
8.3.4 Change in waste incineration operation The model results show, that un-prioritising the waste incineration plants and adding a new PTES has an impact on waste incineration plant operation, and depending on the chosen alternative, these results can be positive and negative for their production profiles. Especially ARC is facing a lowering of their heat production as Figure 8.6 above shows. The main impact on waste incineration facilities occurs during the summer period of low heat consumption, where the combined waste incineration capacity exceeds the heat demand as shown in Figure 8.9 below.
-1500
-1000
-500
0
500
1000
1500
-1500
-1000
-500
0
500
1000
1500
DKK/M
Wh
MWh
Changeinelectricityproductionfrom
referencetoalternative1and2
ALT1Changeinelectricitygeneration,totalincrease14,358MWh
ALT2Changeinelectricitygeneration,totalincrease8,161MWh
ElectricitySpotPrices(RightAxis)

66
Figure 8.9 Change in waste incineration operation from reference to alternative 1 and 2
Figure 8.9 illustrates the changes in waste incineration heat production from the reference scenario to the two alternative scenarios. The change in production is illustrated per plant, to describe which plant experiences positive or negative impacts from the implementation of the PTES. The total system heat demand is illustrated by the yellow curve, and the combined waste incineration capacity is illustrated by the green line. The change in waste incineration heat production occurs mainly in the period where the total waste incineration capacity is higher than the total demand. During this
-125
-75
-25
25
75
-2500
-1500
-500
500
1500
GWh
MWh
ChangeinwasteincinerationoperationFromreferencetoalternative1
ARC VF_Waste
KN_Waste Wasteincinerationmaxdailyproduction(rightaxis)
DailyDemand(rightaxis)
-125
-75
-25
25
75
-2500
-1500
-500
500
1500
GWh
MWh
ChangeinwasteincinerationoperationFromreferencetoalternative2
ARC VF_Waste
KN_Waste Wasteincinerationmaxdailyproduction(rightaxis)
DailyDemand(rightaxis)

67
period, one of the waste incineration plants will likely be the marginal producer, and thus subject to changes in production. From the figure above it can be seen, that the implementation of a PTES in the CPH-DHS impacts the production at waste incineration plants, as changes occur in both alternative scenarios. Alternative 2, however, shows greater changes in production, with ARC producing less. The following section seeks to explain why this happens.
8.3.4.1 HowvolatileelectricitypricesandPTESaffectwasteincinerationheatproduction–a10-dayexamplefromJune2025
A detailed description of the energy system dynamics is needed to explain the shift in waste incineration operation when implementing a PTES in the system. Figure 8.10 below illustrates the period between 19/06/2025 and 29/06/2025, where a high increase in electricity prices occurs. This situation occurs three times during the period in the reference scenario, where CHP plants, illustrated in orange, turn on to produce during high electricity prices. As the heat demand is met by waste incineration plants in the beginning of the period, the CHP plants produce to the existing TTES available at AMV and AVV. The charging of the TTES is illustrated by the blue line in Figure 8.10 which is illustrated as negative as the PTES takes produced energy out of the system for later usage. To allow for continued production on the CHP plants during the next electricity price peak, the TTES is discharged, illustrated in yellow, pushing out production on the waste incineration plants.
In alternative 1, the PTES is used only during the hours where electricity prices are above 1,700 DKK/MWh in this 10-day cycle, illustrated by the dark-blue line which like the TTES falls negative during charge. However, its presence allows for increased use of the TTES especially during the 26/06 and 27/06 and a decreased use between 28/06 and 29/06, compared to the reference scenario. The PTES is not discharged in a significant amount during this period. Compared to the reference scenario, the TTES is charged one additional cycle in alternative 1, between the 26/06 and 27/06.
The PTES is allowed a larger role in alternative 2, as here it can also deliver back to the DH transmission system. The PTES is charged during hours of high electricity prices, and discharged during hours of lower electricity price. In addition to the increased usage of the PTES, the TTES are also used more compared to the reference scenario. As the storages are charged through high electricity price hours, they allow for decreasing the production on waste incineration facilities in the following hours.

68
-3000
-2000
-1000
0
1000
2000
3000
-1000
-500
0
500
1000
1500
DKK/M
Wh
MW
REFERENCE
WasteIncineration CHPPlants PeakBoiler
TankTESDischarge TankTESCharge ElectricitySpotprice(rightaxis)
-3000
-1000
1000
3000
-1.000
-500
00
500
1.000
1.500
DKK/M
Wh
MW
ALTERNATIVE1
WasteIncineration CHPPlants PeakBoiler
TankTESDischarge HTStoreDischarge TankTESCharge
HTStoreCharge ElectricitySpotprice(rightaxis)
-3000
-1000
1000
3000
-1000
-500
0
500
1000
1500
DKK/M
Wh
MW
ALTERNATIVE2
WasteIncineration CHPPlants PeakBoiler
TankTESDischarge HTStoreDischarge TankTESCharge
HTStoreCharge ElectricitySpotprice(rightaxis)
Figure 8.10 Plant operation 19/06/2025 - 29/06/2025

69
8.3.4.2 SummarywasteimpactThis section has described the impact from un-prioritising waste incineration plants and implementing the PTES. The model results indicate, that ARC will decrease the heat production in both alternatives, while VF and K/N decrease their production in alternative 1 but increase it in alternative 2. While the PTES does not directly impact the waste incineration heat production, it allows for alternative use of the TTES which replaces waste incineration during periods of low demand, where waste incineration is the marginal producer.
8.4 PTES operation A central question regarding the PTES, is whether it should have the ability to return heat to the transmission system, or whether it should be limited to delivering to the Høje Taastrup DH area. This is what alternatives 1 and 2 aim at exploring. Figure 8.11 presents a duration curve for the Høje Taastrup heat demands compared to the discharge capacity of the PTES. The PTES with a discharge capacity of 50 MW would be able to discharge full load in 41 days of the year, while it must deliver on partial load for the remaining days of the year. If the PTES can return to the transmission grid, as Alternative 2 describes, this limitation will be removed.
The hourly amount of stored energy in the proposed PTES is presented in Figure 8.12 below. The PTES operates in cycles, where the store is charged during high electricity prices and discharged when the spot price drops. The PTES is thus mainly used to adjust the production on daily and weekly basis, and not on a monthly or seasonal basis. In alternative 1, however, the usage of the PTES during June to September is limited. In alternative 2, the PTES is used for several cycles during this period. The total amount stored in alternative 1 is 92,849 MWh whereas in alternative 2, 137,274 MWh is stored. Both scenarios eliminate the heat rejection from the Høje Taastrup HP.
0
10
20
30
40
50
60
70
1
23
45
67
89
111
133
155
177
199
221
243
265
287
309
331
353
MW
HTheatdemandandTES
dischargecapacity
HTDemanddurationcurve
TankTESDischargecapacity
Figure 8.11 Høje Taastrup DH heat demand duration curve and PTES discharge capacity
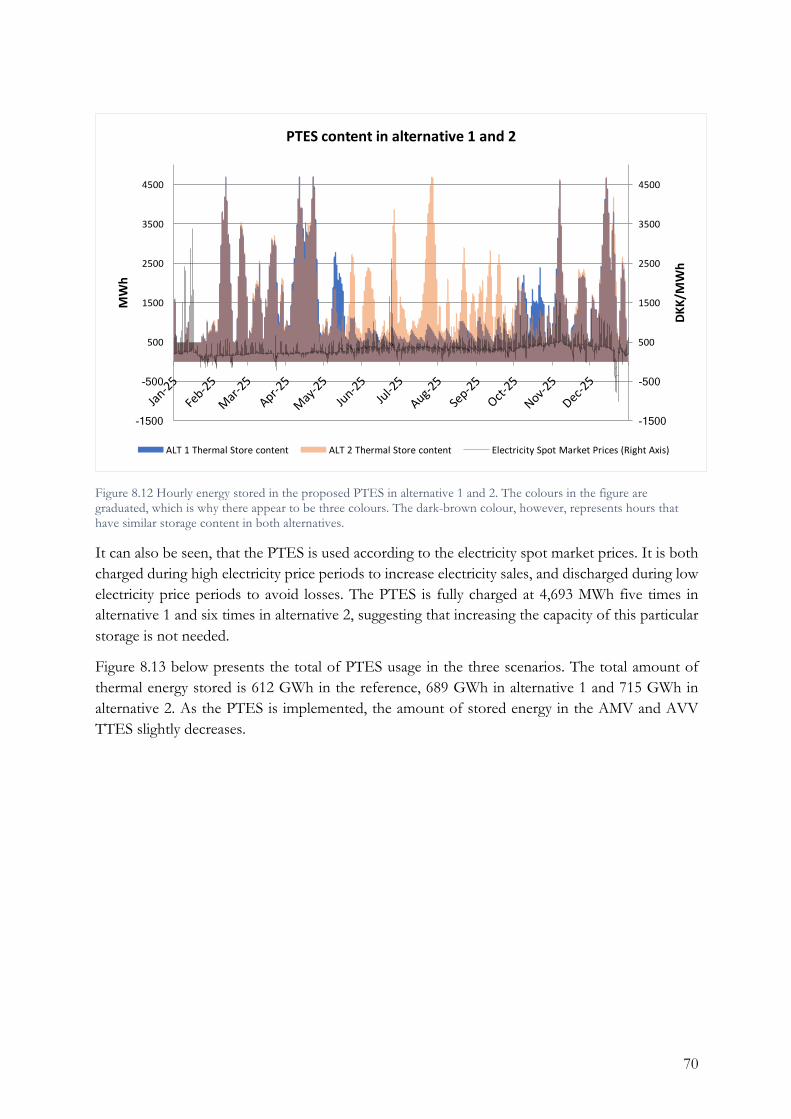
70
Figure 8.12 Hourly energy stored in the proposed PTES in alternative 1 and 2. The colours in the figure are graduated, which is why there appear to be three colours. The dark-brown colour, however, represents hours that have similar storage content in both alternatives.
It can also be seen, that the PTES is used according to the electricity spot market prices. It is both charged during high electricity price periods to increase electricity sales, and discharged during low electricity price periods to avoid losses. The PTES is fully charged at 4,693 MWh five times in alternative 1 and six times in alternative 2, suggesting that increasing the capacity of this particular storage is not needed.
Figure 8.13 below presents the total of PTES usage in the three scenarios. The total amount of thermal energy stored is 612 GWh in the reference, 689 GWh in alternative 1 and 715 GWh in alternative 2. As the PTES is implemented, the amount of stored energy in the AMV and AVV TTES slightly decreases.
-1500
-500
500
1500
2500
3500
4500
-1500
-500
500
1500
2500
3500
4500
DKK/MWh
MWh
PTEScontentinalternative1and2
ALT1ThermalStorecontent ALT2ThermalStorecontent ElectricitySpotMarketPrices(RightAxis)

71
Figure 8.13 TES usage in the reference scenario and alternative 1 and 2
8.5 Transmission company impacts This section presents the potential benefits for the transmission companies in CPH-DHS, VEKS and CTR, as well as for the company of VF, which supplies heat to the northern part of Greater Copenhagen.
8.5.1 The heat production for VEKS, CTR and VF Figure 8.14 below shows the units supplying heat for the transmission area of VEKS as well as the impact of implementing a PTES in Høje Taastrup. Overall, VEKS is a major exporter of heat to CTR, which is set to increase from 1,338 GWh in the reference scenario to 1,339 GWh in alternative 1 and 1,358 GWh in alternative 2. As AVV 1, AVV2 and K/N supply most the heat in VEKS, peak boiler production is relatively low, with 5.3 GWh in the reference scenario, 4.1 GWh in alternative 1 and 3.9 GWh in alternative 2.
152 147 143
461 449 435
93 137612
689 715
0
100
200
300
400
500
600
700
800
Reference Alternative1 Alternative2
GWh
TESusage
AMV AAV PTES Total

72
Figure 8.14 The heat supply for VEKS transmission area, GWh
As shown in Figure 8.15 below, CTR is a net importer of heat from VEKS and VF, with the import from VEKS expected to increase, while decreasing from VF in the two alternatives. AMV BIO4 supplies the majority of heat, with ARC and HCV following. Peak heat supply is set to decrease from 439 GWh in the reference scenario, to 413 GWh in alternative 1 and 406 GWh in alternative 2.
Figure 8.15 The heat supply for CTR transmission area, GWh
Figure 8.16 below shows the heat supply in the transmission area of VF. The waste incineration facility of VF supplies most of the heat with a limited peak supply. VF is an exporter of heat, and cannot import as the DH temperature is higher in the VF area than in CTR and VEKS, as mentioned in chapter 6. The waste incineration production decreases from the reference scenario to alternative 1, but increases in alternative 2, from 1168 GWh to 1162 GWh and 1178 GWh
-1500 -1000 -500
0
500
1000
1500
2000
GWh
VEKSHeatSupply
REF ALT1 ALT2
-1500
-1000
-500
0
500
1000
1500
2000
GWh
CTRHeatSupply
REF ALT1 ALT2

73
respectively. The peak boiler production decreases in both alternative 1 and 2, from 95.5 GWh in the reference scenario to 94.7 GWh and 94.4 GWh respectively. The transmission of heat to VEKS and CTR thus decreases from 378.2 GWh in the reference scenario to 370.9 GWh in alternative 1, while increasing to 386.7 GWh in alternative 2.
Figure 8.16 The heat supply for VEKS transmission area, GWh
8.6 Summary of technical impacts from PTES implementation The first part of the analysis presented above shows, that by implementing a PTES in the CPH-DHS, the fuel consumption can be shifted from natural gas to biomass, primarily by lowering the peak boiler consumption. CHP plants can produce increased amounts of electricity and heat due to the PTES and by replacing peak boiler production. According to the model, the PTES is utilized in cycles and not as a seasonal storage. As such it enables CHP and waste incineration plants to produce following fluctuations in electricity prices, by increasing production during high price hours and lowering production during low price hours.
The model results also show, that the changes in production for the individual plants can be both positive and negative. Especially ARC is projected to lower the production, due to electricity spot price spikes during the summer period of low consumption where the waste incineration plants are the marginal producers. Other plants are also subject to decreasing production, depending on the chosen scenario. AAV1 is projected to increase production in alternative 1 while decrease in alternative 2.
The second part of the analysis above present the technical results for the transmission companies. Table 8.1 below illustrates the change in heat supply for VEKS, CTR and the VF area compared to the reference. CTR increases the heat supply from CHP plants, while VEKS increases the supply in alternative 1 but decrease in alternative 2. The waste incineration heat supply in VEKS is almost constant, while CTR has a lowered waste incineration heat supply. VF decrease the heat supply from waste incineration in alternative 1, but increase in alternative 2. Peak boiler consumption is decreasing in all areas for both scenarios, with the majority of the savings in the CTR area.
-1500 -1000 -500
0
500
1000
1500
2000
2500
VF Peak TransmissiontoCTRandVEKS
GWh
VFHeatSupply
REF ALT1 ALT2

74
Table 8.1 Change in heat supply compared to reference scenario, GWh
CHP
Production, GWh
Waste Incineration,
GWh
Peak Boiler, GWh
Export, GWh
Import, GWh
VEKS
Alternative 1 6.0 -0.7 -1.2 1.2 -7.0
Alternative 2 -0.7 0.7 -1.4 20.7 18.1
CTR
Alternative 1 27.5 -2.4 -26.0 -1.9 -1.1
Alternative 2 37.5 -15.5 -33.1 -2.7 8.4
VF
Alternative 1 - -6.4 -0.8 -7.3 -
Alternative 2 - 9.6 -1.1 8.5 -
Having presented the technical impacts, the following chapter presents the economic impacts from implementing a PTES in the CPH-DHS.

75

76

77
9 Economic impact of PTES implementation
This chapter presents the results from the economic analysis of implementing a PTES in the CPH-DHS. Firstly, the overall system economy is presented. As argued above, the system economy is difficult to translate into actor economy, as the specific market architecture needs to be taken into account. Therefore, secondly, economic changes for transmission companies CTR and VEKS are considered. Thirdly, economic changes for production units in the system are considered.
9.1 System economy impact The overall system economy is presented in Table 9.1 below. The implementation of a PTES results in increased revenue from sales of electricity on the spot market, increased fuel costs, lower O&M and decreased spending on energy taxation. As CHP plants increase production, their revenue from electricity sales increase. As fuel use is shifted from natural gas to biomass, fuel costs increase, as shown in appendix A. Alternative 1 increases more than alternative 2, but both increase compared to the reference scenario. O&M expenses decrease slightly from the reference to alternative 1 and 2. Energy taxation expenses decrease, again as fuel usage is shifted from natural gas toward biomass. The system economy is thus in a deficit, to be covered by district heating sales. As this deficit decrease from the reference to the two alternatives, district heating sales are covering a smaller part of the system economy, thus resulting in a saving for the overall system costs.
Table 9.1 System economy M.DKK
Electricity Sales Fuel Cost O&M Taxation District heating
consumer coverage
REF 1,804.6 2,672.3 144.1 523.4 -1,535.2
ALT1 1,812.6 2,681.4 143.6 521.3 -1,533.6
ALT2 1,811.3 2,675.7 143.4 520.9 -1,528.8
The change from the reference scenario to the two alternatives is presented in Figure 9.1 below. The increase in electricity spot market revenue is 8 M. DKK in alternative 1, and 6.6 M. DKK in alternative 2. Fuel costs increase with 9.1 M. DKK in alternative 1 and 3.4 M. DKK in alternative 2, O&M decrease with 0.5 and 0.7 M. DKK, and the energy taxation expenses decrease with 2.1 M. DKK and 2.5 M. DKK in alternative 1 and 2 respectively. The total system saving is thus 1.6 M. DKK in alternative 1 and 6.4 M. DKK in alternative 2.
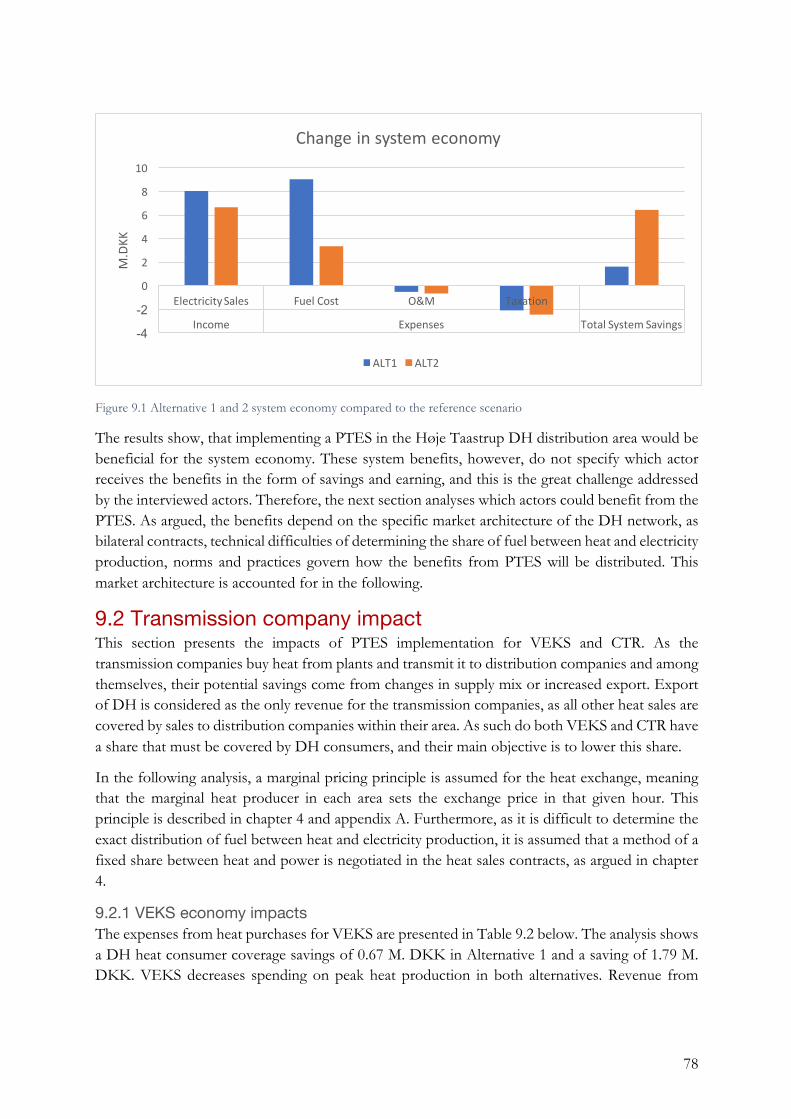
78
Figure 9.1 Alternative 1 and 2 system economy compared to the reference scenario
The results show, that implementing a PTES in the Høje Taastrup DH distribution area would be beneficial for the system economy. These system benefits, however, do not specify which actor receives the benefits in the form of savings and earning, and this is the great challenge addressed by the interviewed actors. Therefore, the next section analyses which actors could benefit from the PTES. As argued, the benefits depend on the specific market architecture of the DH network, as bilateral contracts, technical difficulties of determining the share of fuel between heat and electricity production, norms and practices govern how the benefits from PTES will be distributed. This market architecture is accounted for in the following.
9.2 Transmission company impact This section presents the impacts of PTES implementation for VEKS and CTR. As the transmission companies buy heat from plants and transmit it to distribution companies and among themselves, their potential savings come from changes in supply mix or increased export. Export of DH is considered as the only revenue for the transmission companies, as all other heat sales are covered by sales to distribution companies within their area. As such do both VEKS and CTR have a share that must be covered by DH consumers, and their main objective is to lower this share.
In the following analysis, a marginal pricing principle is assumed for the heat exchange, meaning that the marginal heat producer in each area sets the exchange price in that given hour. This principle is described in chapter 4 and appendix A. Furthermore, as it is difficult to determine the exact distribution of fuel between heat and electricity production, it is assumed that a method of a fixed share between heat and power is negotiated in the heat sales contracts, as argued in chapter 4.
9.2.1 VEKS economy impacts The expenses from heat purchases for VEKS are presented in Table 9.2 below. The analysis shows a DH heat consumer coverage savings of 0.67 M. DKK in Alternative 1 and a saving of 1.79 M. DKK. VEKS decreases spending on peak heat production in both alternatives. Revenue from
-4 -2 0
2
4
6
8
10
ElectricitySales FuelCost O&M Taxation
Income Expenses TotalSystemSavings
M.DKK
Changeinsystemeconomy
ALT1 ALT2

79
export to CTR increases in alternative 1, while expenses from import, waste incineration and peak production decrease. Expenses from CHP plants increase.
In alternative 2, the import expenses, waste incineration expenses and export revenue are higher than the reference, while CHP plant and peak heat production expenses are lower, resulting in a saving compared to the reference scenario.
Table 9.2 Impact on VEKS: revenue and expenses, M. DKK
Revenue
from Expenses from
Export Import Waste
Incineration CHP plants
Peak production
HT HP
District heating
consumer coverage
REF 467.1 72.1 244.2 1,306.0 2.3 5.8 1,163.5
Change from reference
ALT1 0.49 -2.44 -0.21 2.97 -0.52 - -0.67
ALT2 6.05 5.30 0.21 -0.65 -0.60 - -1.79
As shown in Figure 8.6 above, the PTES makes it possible to utilize 4,039 MWh more from the Høje Taastrup HP, as this production is not rejected in alternative 1 and 2. As Høje Taastrup DH is located within the transmission area of VEKS, their economic impacts are included in the overall impacts of the economy of VEKS. While Table 9.2 shows no change in the economy from the Høje Taastrup HP, it is because this heat is produced regardless of the scenario. The utilized heat replaces other production in the area of VEKS, thereby assisting in decreasing the DH consumer coverage.
9.2.2 CTR economy impacts The heat purchase expenses for CTR is presented in Table 9.3 below. Both alternatives result in a lower DH coverage for CTR, with 0.50 M. DKK saved in alternative 1 and 1.36 M. DKK saved in alternative 2. In alternative 1, CTR decrease the revenue from export, decrease the expenses for waste incineration, peak production and import, while increase the expenses from CHP plants. In alternative 2, CTR decrease the revenue from export, increase the expenses from import and CHP plants while lowering the expenses for waste incineration and peak production.

80
Table 9.3 Impact on CTR: revenue and expenses, M. DKK
Revenue from
Expenses from
Export Import Waste
Incineration CHP plants
Peak production
Geo-thermal
District heating
consumer coverage
REF -27.6 538.3 477.5 1,342.9 193.6 1.2 2,525.9
Change from reference
ALT1 -0.89 -0.21 -0.73 11.03 -11.49 - 0.50
ALT2 -1.08 2.26 -4.73 14.65 -14.62 - 1.36
9.2.3 VF economy impacts As a distribution company, VF can supply district heating with waste incineration and peak gas boilers. As VF both owns and operates the waste incineration facility and supplies heat directly to customers, they are treated as both a production plant and distribution company in Table 9.4. Thus, VF gains revenue from heat and electricity sales as well as from waste incineration. They have expenses for O&M, energy taxation and the peak boiler production necessary to meet the demand which the waste incineration facility cannot.
Table 9.4 Change in VF economy from reference to alternative 1 and 2, M. DKK
Revenue From Expenses From
Electricity Sales
Heat Sales
Waste Incineration O&M Taxation
Peak boiler production
District heating
consumer coverage
Ref 109.1 357.5 145.6 12.0 94.1 0.1 506.1
Change from reference
ALT 1 -1.59 -1.96 -0.81 -0.07 -0.71 -0.0008 3.58
ALT 2 0.53 2.93 1.21 0.11 1.08 -0.0008 -3.49
As VF decrease production in alternative 1, they decrease revenue from waste incineration, electricity and heat sales. Likewise, O&M and taxation is decreasing. As the waste incineration plant covers a higher share of the heat demand, peak boiler production is also decreased. The result is

81
increased district heating costs of 3.58 M. DKK. In alternative 2, the production increases, and so does the revenue from waste incineration, electricity and heat sales, while O&M and taxation also increase. The same impact on peak boiler production as in alternative 1 is identified, although it is near zero. This results in alternative 2 is a lower cost to be covered by district heating sales of 3.49 M. DKK.
9.3 Production plant impact Figure 9.2 below presents the changes in revenue on a plant scale for the waste incineration and CHP plants. Figure 9.2 shows, that in general, when revenue from electricity and heat production increases, so do expenses for fuel and taxation where applicable, and vice versa. In alternative 1, the revenue of ARC, KN, AMV and KKV decrease, while AVV and HCV increase their revenue. In alternative 2, it is only ARC that has a negative impact on the income, while the remaining plants increase profits from the implementation of a PTES.
Figure 9.2 Changes in revenue and expenses from reference to alternative 1 and 2 M. DKK
In general, CHP and waste incineration plants can increase profits in two ways: by increasing production and by shifting production to hours with more favourable electricity prices. A ratio describing the relation between electricity and heat production revenue is presented for all plants in the three scenarios in Figure 9.3 below. It is calculated by dividing the electricity spot market revenue with the heat sales revenue for each plant in each scenario, and describes the electricity revenue for each unit of heat sold.
-20
-15
-10
-5
0
5
10
15
20
ALT1 ALT2 ALT1 ALT2 ALT1 ALT2 ALT1 ALT2 ALT1 ALT2 ALT1 ALT2
ARC KN AMV AVV HCV KKV_CHP
M.DKK
Changeinunitrevenuefromreferencetoalternative1and2
Electricityspotmarketrevenue FuelCost O&M Taxation Heatsalerevenue Totalchangeinincome

82
Figure 9.3 Electricity and heat production ratio factor for reference scenario and alternative 1 and 2
As the electricity and heat revenue ratio is close to constant for the individual plants, no significant change from shifting production hours to more favorable electricity prices, is detected. The main difference in revenue for each plant is mainly due to increasing or decreasing production.
9.4 Summary of economic impact of implementing PTES Table 9.5 below shows the change in income due to the PTES implementation. In alternative 1, ARC, KN, AMV, KKV and VF are projected to have a negative impact, while AVV, HCV, VEKS and CTR are set to gain a positive impact. The total benefit, when taking the specific DH market architecture into account, is 1.51 M. DKK, compared to the system benefit of 1.62 M. DKK. In alternative 2, KN, AMV, AVV, HCV, KKV, VEKS, CTR and VF are set to have a benefit from the PTES implementation, while ARC is set to have a negative impact. The total benefit is 6.28 M. DKK compared to the system savings of 6.44 M.DKK.
Table 9.5 Change in income per actor from reference to alternative 1 and 2, M. DKK
ARC KN AMV AVV HCV KKV VEKS CTR VF Total
REF - - - - - - - - - -
ALT1 -0.71 -0.79 -0.05 6.03 1.63 -2.19 0.67 0.50 -3.58 1.51
ALT2 -5.47 0.68 1.00 0.32 1.86 1.24 1.79 1.36 3.49 6.28
As alternative 2 provides the highest increased income combined for the majority of actors, this alternative is recommended, despite the fact that it results in a 5.47 M. DKK loss for ARC as shown in Figure 9.4 below. Furthermore, AVV has the potential of increasing the income with 6.03 M.
0,340,340,340,310,300,30
0,380,370,380,350,350,35
0,700,700,70
0,290,290,29
0,390,380,39
0
0,1
0,2
0,3
0,4
0,5
0,6
0,7
0,8
REF ALT1ALT2 REF ALT1ALT2 REF ALT1ALT2 REF ALT1ALT2 REF ALT1ALT2 REF ALT1ALT2 REF ALT1ALT2
ARC VF KN AMV AVV HCV KKV_CHP
Electricityrevenue/Heatrevenueratio
Electricityandheatproductionrevenueratio

83
DKK in alternative 1, but as their result still is positive in alternative 2, this scenario is recommended.
Figure 9.4 Changes in plant income in from reference scenario to the two alternatives.
Having brought the PTES into being by demonstrating its technical and economic impacts on the system and actors of the CPH-DHS, it is relevant to compare and discuss these results against the valuation frames promoted by the interviewed actors. Therefore, this is done in the following chapter.
-8 -6 -4 -2 0
2
4
6
8
ARC KN AMV AVV HCV KKV_CHP VEKS CTR VFDHM.DKK
Changeinincomefrom
referencescenariotoalternative1and2
ALT1 ALT2

84

85
10 Discussion of results This chapter compares and discusses the results acquired from the three preceding analyses, i.e. the valuation frame analysis in chapter 7 and the EnergyPRO analyses in chapters 8 and 9. Comparing the results, some of the identified valuation frames are confirmed and qualified in the model, whereas others are not. The following sections discuss and qualify the identified valuation frames individually, comparing them to the modelled results
10.1 “Reducing peak production” VEKS and HOFOR frame the PTES as reducing peak production. This valuation frame represents the means through which the PTES could generate value for the heating companies, i.e. by saving expenses for natural gas peak boilers while also shifting away from fossil fuels. This has been analysed in the EnergyPRO model. On an actor level, alternative 1 entails peak production savings of approximately 0.52 M. DKK for VEKS and 11.4 M.DKK for CTR while alternative 2 entails peak savings of 0.60 M. DKK for VEKS and 14.6 M. DKK for CTR (see Table 9.2 and Table 9.3). As peak load boilers have the highest marginal price for producing heating, a reduced use of these entails economic savings for the heating companies, as well as reduced use of fossil fuels. As such, the model confirms this valuation frame.
10.2 “Increasing CHP production” The second valuation frame presented by VEKS and HOFOR is the framing of the PTES as increasing CHP production. This valuation frame represents how the PTES can generate value for the CHP companies, i.e. by increasing their revenue. These matters have been analysed in the EnergyPRO model and electricity sales increase by 8.0 M. DKK in alternative 1 and 6.6 M.DKK in alternative 2 (see Figure 9.1). However, as Figure 9.4 shows, the division of the increased income are not evenly distributed among the plants in the two alternative scenarios. In alternative 1, AVV and HCV are the only plants with increased incomes, whereas all other plants have reduced incomes. In alternative 2, on the other hand, all CHP plants are expected to have increased incomes from the implementation of the PTES. Therefore, this valuation frame is also confirmed by the EnergyPRO model. The analysis shows, that the primary increase in revenue comes from increased production, and not from CHP plants being able to shift production to other, more favourable hours. The PTES is, however, shown to be used flexibly following electricity prices.
10.3 “System economy and optimization” Multiple actors promote the valuation frame of system economy and optimization, arguing that the PTES should be operated through the optimization process at Varmelast.dk, which schedules plants in a least cost marginal price order. As explained in chapter 4, the EnergyPRO model optimizes the load scheduling across the different plants in a similar manner. Therefore, the model arguably confirms this valuation frame, as it shows positive economy from operating the PTES this way.
86
10.4 “Using excess heat” HTDH frame the PTES as being able to store excess heat available from the HP in Høje Taastrup during the summer months. In both alternatives of the EnergyPRO model, the waste heat is utilised. The 4,039 MWh of rejected heat is 4% of the total stored amount in alternative 1 and 3% in alternative 2, thus not enough to justify the investment in a PTES alone. However, if looking at the value of this heat for Høje Taastrup DH specifically, there is a benefit. All in all, the heat which is currently being rejected, but which is utilized in the alternative scenarios, is 4,039 MWh corresponding to 11.5% of the total heat pump thermal production (see Figure 8.5). If calculating the value of not having to buy this heat from VEKS, it corresponds to 1.2 M. DKK. Therefore, the EnergyPRO model confirms Høje Taastrup DH’s valuation frame.
10.5 “Flexible incineration plant renovation” and “Increased summer demand”
K/N frame the PTES as being able to provide flexible incineration plant renovation and to increase the summer heating demand which would result in increased waste incineration during the summer period. Due to model constraints, it has not been possible to analyse the first valuation frame. However, the EnergyPRO model provides some qualification of the second valuation frame. The model confirms, that during the summer period waste incineration plant capacity exceeds the heating demand, causing them to run below full capacity. Likewise does the model show that during the summer period, the PTES will be charged, thus increasing demand. However, as the PTES is used in cycles, it does not charge during the whole summer period, and will thus only be charged when feasible. Figure 8.12 presents the modelled operation of the PTES, and it shows a short-term operation profile, not a seasonal steady consumption during summer.
As shown in Figure 8.7, alternative 1 shows a 12 GWh reduction of total waste incineration, while alternative 2 shows a 5 GWh reduction. This indicates, that adding a PTES to the system in fact causes total waste incineration to decrease, rather than increase as framed by K/N. However, the model also shows, that the individual plants are affected differently in the two alternatives. While all incineration plants are subject to reduced production in alternative 1, ARC is subject to most of the reduced production in alternative 2, while K/N and VF increase production slightly. Therefore, the valuation framing of “increased summer demand” is partially confirmed, as the PTES does allow for increased production during low summer demand, but as it is shown to operate in cycles it will not be charged during the whole low demand period. A major cause for these identified variations is in fact that the modelled waste incineration plants are not prioritized in the load scheduling.
10.6 “Deliver to transmission grid via return or booster” The final identified valuation frames argue, that the PTES should be able to deliver back to transmission grid. This is analysed in the EnergyPRO model by testing the two alternative scenarios. A central result from the analysis is that alternative 2 is the most feasible for the system economy and for several actors and therefore the recommended alternative. Therefore, the analysis shows that allowing the PTES to both receive and deliver heat to the transmission supply is the most feasible set-up. As such, this result confirms the valuation frame of VEKS, HOFOR and

87
Høje Taastrup DH, which argue, that the PTES should be able to deliver to the transmission grid. However, whether this should be done via the return flow or via a booster has not been analysed due to model constraints. A limitation in the modelling analysis is that EnergyPRO does not allow to test either solution, and therefore it can neither be confirmed nor rejected. While it is confirmed that the ability to deliver back to transmission is preferable, the uncertainty to which method of return deliver has not been solved.
10.7 Summary This chapter has compared and discussed the results acquired through the three preceding analyses. The chapter has shown, that some valuation frames are confirmed by the EnergyPRO model, some are disconfirmed, while some remain uncertain. The overall perception of the PTES as beneficial for the system operation has been confirmed. Heating companies are indeed expected to save expenses for natural gas peak load boilers, and CHP plants are also expected to gain revenue from electricity sales. Høje Taastrup DH can utilize their excess heat, saving expenses for buying heat from the transmission grid. If waste incineration plants are not prioritised in the system, VF and K/N are expected to either decrease or increase production slightly from the implementation of a PTES, depending on the chosen scenario, while ARC is expected to decrease production severely in both scenarios. As alternative 2 has proven to be the most feasible alternative, the PTES should be able to deliver heat back to the transmission grid. Some uncertainties remain. The model results have partillay confirmed the valuation framing of K/N, and neither have they considered how the PTES should deliver heat back to the transmission grid.

88

89
11 Developing a business model for a PTES
This chapter departs from the results of the previous chapters and presents a proposal for a business model for financing a PTES in the distribution area of Høje Taastrup. As highlighted by the third research sub-question, the aim is to propose a business model, which integrates the actors’ valuation frames as well as the modelled benefits of the PTES, enabling the actors to envision their role in the collective investment of the PTES.
Developing a business model is done in the following order: First, based on discussions of the results acquired in previous analyses chapters, the setup of a business model is developed, including a definition of the three components of a business model, i.e. the value proposition, the value architecture and the revenue model. Here it is argued, that while the acquired results lead to a total of four potential revenue models, the value proposition and the value architecture are the same for all four potential revenue models. Second, the economic conditions constituting the investment is presented, explicating the total costs of the investment as well as the annual payments needed to cover the investment. Third, the four revenue models are elaborated, explicating how much each actor is to pay according to the principles of the mentioned revenue models. Advantages and disadvantages of the four identified revenue models are discussed as well.
11.1 Setup of the business model Several results acquired in the previous analysis chapters are relevant to consider when establishing a business model for the PTES, and these are discussed in this section. The valuation frame analysis, chapter 7, identified several valuation frames among the interviewed actors, whereas the energy system analysis, chapter 8 and 9, confirmed some valuation frames and disconfirmed other. The confirmed valuation frames form the basis for the value proposition and the value architecture of the business model proposed in this report.
The value proposition identifies challenges, which the PTES is capable of solving. As the PTES can solve multiple issues, these together form the value proposition. For the district heating companies, the value proposition is the PTES’ ability to solve the issue of inefficient and expensive energy production based on peak load DH boilers. For the CHP plants, the value proposition is the PTES’ ability to solve the issue related to limited production due to heat demand. Lastly, for the waste incineration plants, the value proposition is the PTES’ ability to increase heating demand during the summer period. These value propositions are summed up in Table 11.1 below.
The value architecture is closely related to the value proposition, but explicates the means through which value is created for the actors. Therefore, the value architecture for the heating companies is that the PTES shifts production from expensive peak load DH boilers to CHP plants, thereby increasing fuel efficiency and decreasing heating expenses. This valuation frame was promoted by VEKS and CTR and it was also confirmed by the EnergyPRO model, and thus, this can be used for translating and enrolling the heating companies. The value architecture for the CHP plants is

90
that the PTES decouples the electricity production from the heating demand, granting CHP plants the ability to produce more heat and power. This valuation frame was promoted by VEKS and HOFOR, which represents the CHP plant AMV. Thus, this can be used for translating and enrolling CHP plant actors. The value architecture for the waste incineration plants is that the PTES is essentially a heat consumer, which increases the heating demand during the summer period, allowing certain incineration plants to produce more heat and power. These value architectures are also summed up in Table 11.1 below.
The identified value proposition and architecture may be considered as the narrative of the business model, and depending on which actors are to be enrolled, different narratives should be applied; i.e. when seeking to enrol CHP plants, the narrative (and calculative background) of the CHP plants ability to produce more heat and power should be applied. If seeking to enrol waste incineration plants, the narrative and calculative background of the increased heating demand should be applied.
Having identified the value proposition and the value architecture, the remaining element to identify is the revenue model. From the acquired results it is clear, that multiple revenue models can be proposed. Firstly, as the results from the EnergyPRO analysis provide knowledge of the division of benefits among all the actors in the system, one option for dividing the investment of the PTES among the actors is for each actor to invest a share corresponding to his share of the calculated benefits. This is presented in Table 11.1 below as the “Shared investment model”. A prerequisite for this model is that all actors agree on the calculated results.
Considering the statements made by VEKS and HOFOR, this type of setup fits well to the valuation frame of “actors invest per benefit”, through which they argue, that the division of the investment should reflect the actors’ individual benefits. However, considering another statement by HOFOR, this type of setup might prove difficult to implement. HOFOR promoted the valuation frame of “no competitors should invest together”, arguing that it would be problematic, if competing plants co-invest in a PTES. Therefore, considering this statement, a second type of revenue model is proposed in Table 11.1, in which the heating companies invest in the PTES, while the producers pay for using the PTES through reduced heat sale tariffs. This model, however, consists of two options, which each have their pros and cons. Either the producers should pay a common tariff per MWh heat produced, or they should pay individual tariffs, corresponding to the benefits they harvest. The former is beneficial in the sense that it would be highly replicable; a quality which VEKS and HOFOR promote. Furthermore, it would be easy to manage, as it would not require individual contracts to be negotiated. On the other hand, however, this model would not divide the costs fairly, corresponding to the actors’ harvested benefits. Therefore, a second model can be proposed, arguing that the producers should pay individual tariffs corresponding to their share of the benefits. As the calculated results show a highly unequal division of benefits among the different plants, this model would be more fair, especially considering ARC which is expected to be affected negatively from the PTES’ implementation. This model however also requires, that all actors agree on the calculated results.
A final revenue model which can be discussed, is a model based on differences in marginal costs of heating. This model proposes, that the heating companies establishing a new market actor which runs the PTES, buying heat at hours with low heat prices (such as hours with high electricity prices),

91
and selling heat at hours with high heating prices (such as during peak heat demand and low electricity prices). The price difference would thus cover the investment expenses for the PTES. Due to the current market architecture of the DH system, however, this model is not realistic, since the price of heating is not settled by the marginal cost of producing it, as explained in previous chapters. However, the authors argue, that this model would be highly transparent and market based, although it requires the market architecture to change radically. This option was presented to the actors during the interviews. Even though the actors expressed interest in the idea, the topic was not developed further throughout this report, as radically changing the market architecture is outside the scope of this report. Nevertheless, it poses a relevant discussion, and thus it is granted space here.
Table 11.1 The three components of a business model for the PTES
Shared investment model
Heating companies invest, producers pay through reduced heat
sale prices
Marginal price model
Common tariff model
Individual tariff model
The value proposition
• Inefficient and expensive energy production • CHP production limited by heat demand • Not enough heat demand during summer
The value architecture
• PTES shifts production from peak boilers to CHP, thereby increasing efficiency of energy production
• PTES decouples electricity production from heating demand, allowing CHP plants to increase production
• PTES increases the heating demand during the summer period, thus allowing certain waste incineration plants to produce more heat
The revenue model
Actors agree on the calculated results, and thus they make a shared investment based on individual calculated benefits
No competing actors should co-invest, and thus the heating companies invest and the producers pay a common tariff, no matter who gets which benefits
All actors agree on the calculated results. No competing actors should co-invest, and thus the heating companies invest and the producers pay individual tariffs corresponding to their harvested benefits
With a marginal-price based system, the PTES would be charged during high electricity prices and discharged during low prices. Initial investment made by heating companies, payback through price-difference.
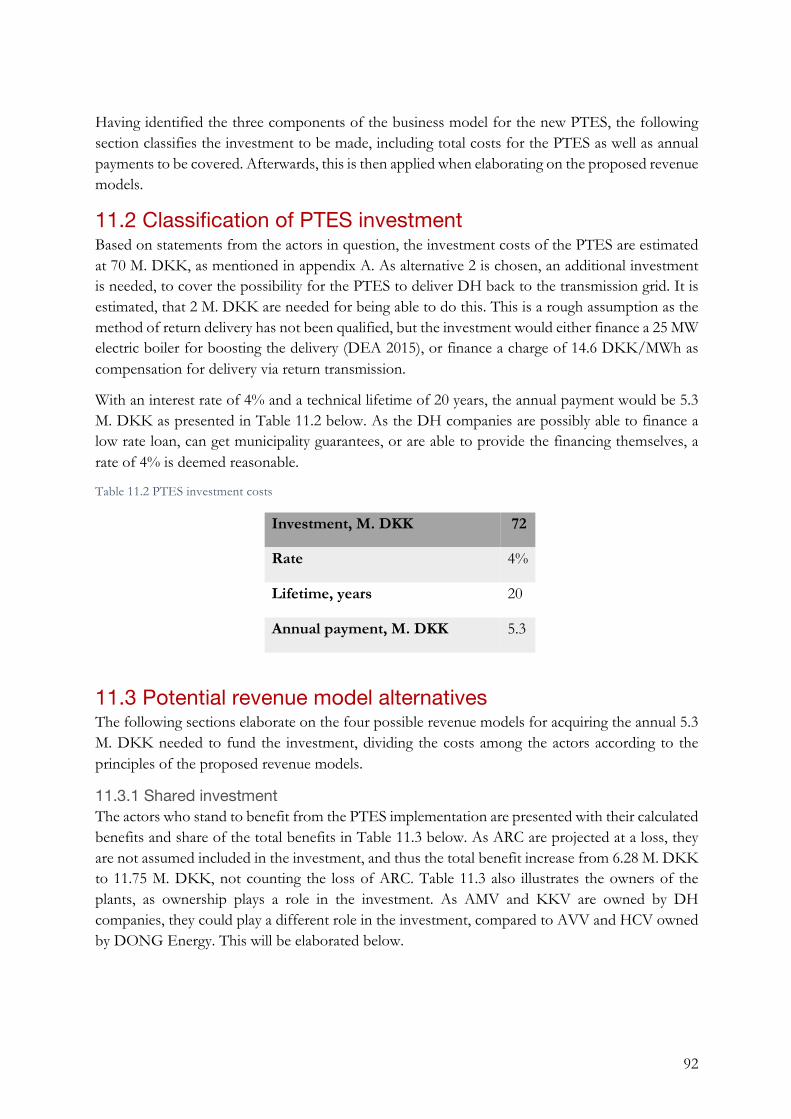
92
Having identified the three components of the business model for the new PTES, the following section classifies the investment to be made, including total costs for the PTES as well as annual payments to be covered. Afterwards, this is then applied when elaborating on the proposed revenue models.
11.2 Classification of PTES investment Based on statements from the actors in question, the investment costs of the PTES are estimated at 70 M. DKK, as mentioned in appendix A. As alternative 2 is chosen, an additional investment is needed, to cover the possibility for the PTES to deliver DH back to the transmission grid. It is estimated, that 2 M. DKK are needed for being able to do this. This is a rough assumption as the method of return delivery has not been qualified, but the investment would either finance a 25 MW electric boiler for boosting the delivery (DEA 2015), or finance a charge of 14.6 DKK/MWh as compensation for delivery via return transmission.
With an interest rate of 4% and a technical lifetime of 20 years, the annual payment would be 5.3 M. DKK as presented in Table 11.2 below. As the DH companies are possibly able to finance a low rate loan, can get municipality guarantees, or are able to provide the financing themselves, a rate of 4% is deemed reasonable.
Table 11.2 PTES investment costs
Investment, M. DKK 72
Rate 4%
Lifetime, years 20
Annual payment, M. DKK 5.3
11.3 Potential revenue model alternatives The following sections elaborate on the four possible revenue models for acquiring the annual 5.3 M. DKK needed to fund the investment, dividing the costs among the actors according to the principles of the proposed revenue models.
11.3.1 Shared investment The actors who stand to benefit from the PTES implementation are presented with their calculated benefits and share of the total benefits in Table 11.3 below. As ARC are projected at a loss, they are not assumed included in the investment, and thus the total benefit increase from 6.28 M. DKK to 11.75 M. DKK, not counting the loss of ARC. Table 11.3 also illustrates the owners of the plants, as ownership plays a role in the investment. As AMV and KKV are owned by DH companies, they could play a different role in the investment, compared to AVV and HCV owned by DONG Energy. This will be elaborated below.
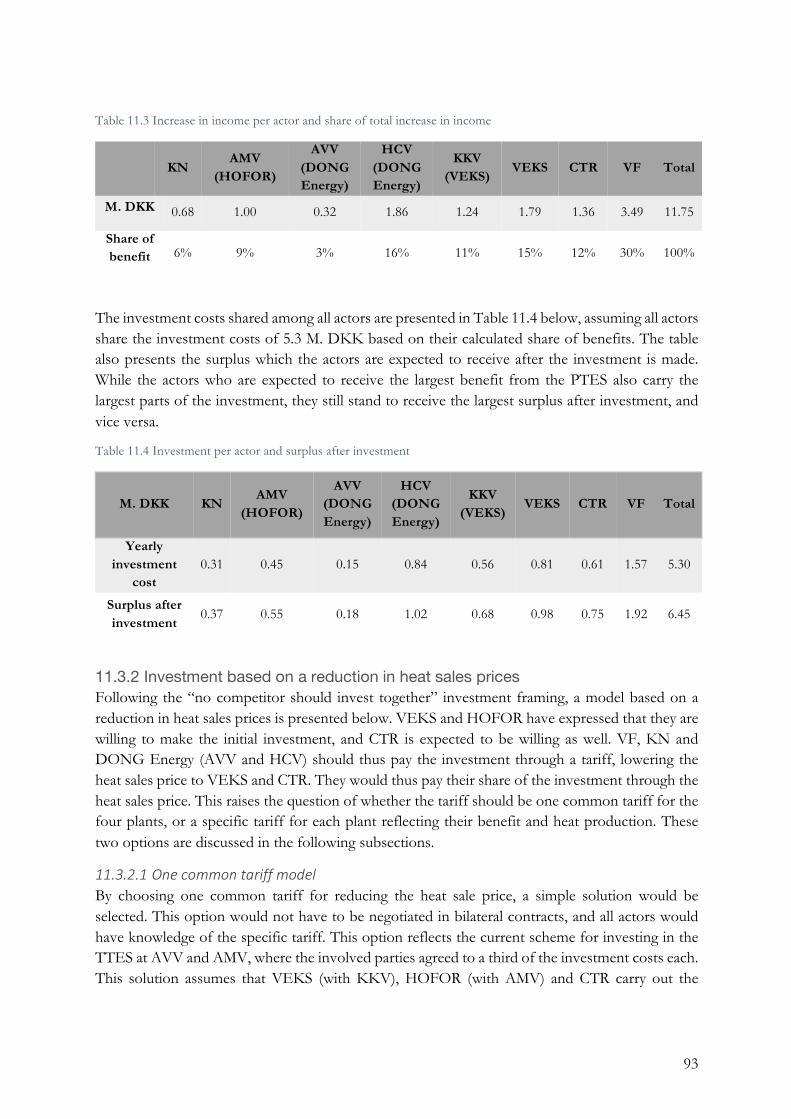
93
Table 11.3 Increase in income per actor and share of total increase in income
KN
AMV (HOFOR)
AVV (DONG Energy)
HCV (DONG Energy)
KKV (VEKS)
VEKS CTR VF Total
M. DKK 0.68 1.00 0.32 1.86 1.24 1.79 1.36 3.49 11.75
Share of benefit 6% 9% 3% 16% 11% 15% 12% 30% 100%
The investment costs shared among all actors are presented in Table 11.4 below, assuming all actors share the investment costs of 5.3 M. DKK based on their calculated share of benefits. The table also presents the surplus which the actors are expected to receive after the investment is made. While the actors who are expected to receive the largest benefit from the PTES also carry the largest parts of the investment, they still stand to receive the largest surplus after investment, and vice versa.
Table 11.4 Investment per actor and surplus after investment
M. DKK KN AMV
(HOFOR)
AVV (DONG Energy)
HCV (DONG Energy)
KKV (VEKS)
VEKS CTR VF Total
Yearly investment
cost 0.31 0.45 0.15 0.84 0.56 0.81 0.61 1.57 5.30
Surplus after investment
0.37 0.55 0.18 1.02 0.68 0.98 0.75 1.92 6.45
11.3.2 Investment based on a reduction in heat sales prices Following the “no competitor should invest together” investment framing, a model based on a reduction in heat sales prices is presented below. VEKS and HOFOR have expressed that they are willing to make the initial investment, and CTR is expected to be willing as well. VF, KN and DONG Energy (AVV and HCV) should thus pay the investment through a tariff, lowering the heat sales price to VEKS and CTR. They would thus pay their share of the investment through the heat sales price. This raises the question of whether the tariff should be one common tariff for the four plants, or a specific tariff for each plant reflecting their benefit and heat production. These two options are discussed in the following subsections.
11.3.2.1 OnecommontariffmodelBy choosing one common tariff for reducing the heat sale price, a simple solution would be selected. This option would not have to be negotiated in bilateral contracts, and all actors would have knowledge of the specific tariff. This option reflects the current scheme for investing in the TTES at AVV and AMV, where the involved parties agreed to a third of the investment costs each. This solution assumes that VEKS (with KKV), HOFOR (with AMV) and CTR carry out the

94
investment and collect the remaining investment costs through a tariff lowering the heat price from VF, KN and DONG. The investment is presented below in Table 11.5.
Table 11.5 DH supply companies’ yearly investment costs in PTES
KKV (VEKS) VEKS CTR AMV (HOFOR) Total
M. DKK 0.56 0.81 0.61 0.45 2.43
This results in the district heating transmission and distribution companies to cover 2.43 M.DKK of the investment, thereby leaving 2.87 M. DKK for the heat producers. By dividing this investment by the combined heat production of AVV, HCV, VF and K/N of 6.10 TWh, this results in 0.47 DKK/MWh as presented in Table 11.6 One common heat sale price reduction based upon heat production below. For the plants to cover their share of 2.87 M.DKK of the investment, they would thus have to lower their heat sales price with 0.47 DKK/MWh.
Table 11.6 One common heat sale price reduction based upon heat production
AVV HCV VF K/N Total
M. DKK 0.15 0.84 1.57 0.31 2.87
TWh heat production
3.40 0.72 1.18 0.80 6.10
Lower heat sale price
DKK/MWh 0.47
This method of allocating the investment would penalize the units with high heat production and prioritize the units with lower heat production, as it would not consider the individual benefits from the PTES. The resulting investment costs per plant is presented Table 11.7 Projected investment costs based upon on common reduction in heat sale price below. Although VF stands to gain the highest benefit from the PTES, based on their production they invest 0.55 M. DKK. While AVV increase their income with 0.32 M. DKK, they stand to invest 1.6 M. DKK. When comparing the economy for DONG Energy by combining AVV and HCV, the increased income is 2.18 M. DKK, compared to the investment cost of 1.94 M. DKK, resulting in a net increase in income of 0.24 M. DKK.

95
Table 11.7 Projected investment costs based upon on common reduction in heat sale price
AVV HCV VF KN Total
DKK/MWh 0.47 0.47 0.47 0.47 -
TWh heat production
3.40 0.72 1.18 0.80 6.10
Resulting costs for investment PTES,
M. DKK 1.60 0.34 0.55 0.38 2.87
A revenue model with a single tariff for lowering the heat sales price is a simple way of dividing costs, but lacks a mechanism for reflecting the specific plants actual benefits from the PTES. Although simple to manage, the model lacks the ability to translate actors, as it offers, for some actors, a share of investment costs which does not reflect the actual benefit. Therefore, an alternative option is discussed below.
11.3.2.2 IndividualtariffmodelA second possible tariff model for lowering heat sales prices are individual negotiated tariffs, based on the actors benefits and heat production. Instead of reaching a common tariff, one for each plant would be negotiated. By dividing the investment cost for each plant by the amount of heating supplied, a plant-specific tariff for lowering their heat sales price is reached, as illustrated by Table 11.8 Individual heat sale price reductions based upon heat production below.
Table 11.8 Individual heat sale price reductions based upon heat production
AVV HCV VF KN Total
M. DKK benefit 0.15 0.84 1.57 0.31 2.87
TWH produced 3.40 0.72 1.18 0.80 6.10
DKK/MWh 0.04 1.17 1.34 0.38 -
This model would result in a share of the investment corresponding to the plants specific income benefits. However, this model is more complicated than the former, as it relies on individual negotiations with the specific plants, and would re-open contracts already agreed upon. While this model reaches a share of investment costs closer to the calculated benefits, it also relies on a more complicated translation of actors, and requires that all actors agree on the calculated results.
11.3.3 Marginal pricing business model A model using marginal pricing for heat sales is another plausible way to facilitate the transmission of heat from producers to transmission and distribution companies. By implementing hourly heat

96
pricing, it would, in theory, be possible for the owner and operator of the PTES to charge it during low price hours, and discharge it during high price hours.
When asked about the possibility of a marginal pricing model for facilitating the heat sales from a PTES, several actors agree, that currently several organisational and structural restraints apply before a marginal pricing market for district heating sales can be implemented. A marginal pricing model would require several relations in the market architecture to be redesigned. A major part of the market architecture of the CPH-DHS is the load-scheduling through Varmelast.dk and the actual price setting through bilateral contracts. While the load-scheduling follows a marginal-pricing principle, this structure would have to be carried through to the price setting mechanism, and would remove the existing price-setting contracts.
Several impacts would be the result of a marginal pricing scheme. First, as the electricity sector already has experienced a similar transition to marginal based pricing, the plants in question for the report have experienced such a change. Since the revenue from electricity sales has been based on marginal pricing, plants have faced lowered revenue as a product of declining electricity prices, among others. Although governed by the non-profit principle of the DH sector, heat sales cover part of the plants investment costs. If both revenue streams of CHP and waste incineration plants are subject to marginal pricing, this could possibly further increase the uncertainty of income. It raises the question of whether plants would be able to cover their fixed costs while being subject to a marginal pricing heat market. Second, as previously argued in this report, it is difficult to determine the exact share of fuel and O&M expenses for heat and power generation. In a marginal pricing bidding scheme, these costs would have to be allocated to the heat and power production, instead of the scheme used today of a simple ratio share. Third, as the physical conditions of heat and electricity transmission are different, possibly different time-resolutions could be used. While hourly rates are used in the electricity market, several actors mention that longer time-slots might be useful for heating. The question arises, of whether different time-resolutions for heat and power would constitute problems, as the electricity and heating price could participate in co-producing each other.
11.4 Implications of the proposed revenue models Four ways of constructing a business model have been proposed above. As business models are calculative devices constructed to enrol actors into their narratives, the next step for these models is to circulate among the actors interested in investing in the PTES. As Doganova and Eyquem-Renault (2009) argue, the business model is not a representation of reality, but a specific framing. Furthermore, in their study of what business models do, Doganova and Eyquem-Renault emphasise that as the model circulates to enrol actors, the model itself also adjusts with the framings and perceptions it meets. The proposed models should thus not be seen as final answers to how to split the investment, but rather as an input to discussion and framing of the investment. Just as Edison enrolled his investors by a convincing narrative, and not by precise calculations, so must these proposed business models enrol actors based on their ability to convince.
If the arguments presented in this report are strong enough to convince investors, then they could move ahead with investing. As the results from the calculative model of this report support other

97
reports and studies made by the actors, they add to the translation chain and thus the validity of the results. In case investors find the numbers and calculations convincing, the proposed models are directly applicable. In the case of overflows, where new valuation frames or contestations of results surface, the actors must re-visit the calculations and the framing of investment. Just as HOFOR and VEKS contest the previous investment model for TES as it produced overflows, so can the proposed model also result in overflows. HOFOR and VEKS argue, that actors should invest according to their share of benefits, but these benefits will be estimates based upon calculative demonstrations. The business model is therefore dependent on the credibility of the numbers. The more credible the numbers, and the more actors they can enrol, the more detailed the share of investments can be made. In the case that the results are contested, then actors must move back to a more general or common investment model.
By taking the different valuations by the actors into account, these overflows can possibly be alleviated, but as framings put the world in brackets, it will likely be difficult to establish a stable valuation framing without any contestations and overflows. As the results of this report are calculative demonstrations, they could prove different after the PTES is in operation, and thereby could new valuations surface which are not encompassed in the business model. As possible investment models now have been presented, the process of enrolling actors and converging valuations frames can move forward.

98

99
12 Conclusion This report has examined how the district heating companies of the Greater Copenhagen areas value a PTES, and how the potential benefits of this technology can be demonstrated through energy system modelling. While the heating actors wish to implement a PTES, they find themselves in a Catch-22 situation: to decide and invest in the technology, they need confirmation about the benefits. But before the investment is made and the technology implemented, they cannot know exactly which benefits it will entail. The purpose of this report is therefore to make an epistemic contribution to the issues currently preventing heating companies in investing in a PTES. By mapping the valuations deployed by actors, and demonstrating the potential benefits of the PTES, the decision-making process can hopefully be brought forward. Therefore, inquiry into the valuations through which the actors frame the PTES has been carried out, and by generating model-based knowledge of how the benefits from the storage will be divided, the catch-22 situation may be eluded and the realisation of the investment brought closer.
This concluding chapter seeks to sum up the results obtained throughout the report and to answer the research questions posed in the introduction. Therefore, the following three sections answer the sub-questions individually so that the overall research question may be answered.
12.1 Valuation frames Based on a Science and Technology Studies approach, this report argues that knowledge and technology may hold different meanings to different audiences. Therefore, while technical model-based knowledge is seen as useful for generating knowledge of the thermal energy storage, the perceptions and valuations promoted by the relevant actors of the DH system need to be taken into account as well.
Through interviews with relevant actors of the DH system, multiple differing perceptions and valuations of the PTES have been identified, some of which are promoted by multiple actors, others which are promoted by individual actors only. In total, seven different valuation frames are identified. These framings stretch from viewing the storage as a piece of equipment, which can optimize the entire system in terms of technical and economic operation, to viewing the storage as a mean for solving individual issues. As the identified valuation frames are diverse, the situation is characterized by uncertainty, and thus the actors relate their valuations to their own technical and professional reality. Conclusively, the situation is unsettled.
As long as the actors apply differing valuation frames, no valuation frame will become dominant, and thus, no settlement can be reached. Furthermore, as long as the valuation frames have not been qualified, the actors cannot know how the benefits from the PTES will be divided, and thus the investment will not be made. Therefore, to qualify the differing valuation frames and bringing the actors’ perceptions closer together, while also determining how the benefits of the PTES can be divided, a technical demonstration of the PTES’ impacts on the DH system is carried out.
100
12.2 Technical calculative model The technical demonstration of the PTES is carried out using the energy system modelling tool EnergyPRO. In order to bring the PTES into being, the model analysis is designed with a reference scenario set up for the year of 2025 without the PTES. In addition, two alternative scenarios including the PTES in the distribution system of Høje Taastrup are set up. As the actors are currently uncertain of whether the PTES should be able to deliver heat back to the transmission system or not, these two configurations are tested through the two alternative scenarios. Furthermore, the specific market architecture of the CPH-DHS implies, that while heat sales are governed by bilateral contracts, the load scheduling of plants is governed by their marginal production cost. Considering these differences, the modelled results are divided into technical and economic impacts.
The technical results demonstrate the PTES as being a system storage, operating based on marginal pricing. It can shift heat production from natural gas peak boilers to CHP production. CHP plants can increase production as more storage capacity allows heat to be stored for later usage. Waste incineration production is affected as well. The storage causes two waste incineration plants, K/N and VF, to produce more, while the third, ARC, produces less. These results are found with the assumption that waste incineration plants operate according to the same load scheduling criteria as other plants.
The economic results demonstrate, that the PTES has an impact on the income of the individual actors. Transmission companies can decrease their heat expenses as heat production is shifted from natural gas peak boilers to CHP plants. As CHP plants can produce more heat and power, they increase revenue from the electricity spot market and heat sales. In alternative 2, all transmission companies and all plants, except for ARC, increase their income because of the PTES, resulting in a total annual value of 6.28 M.DKK. Therefore, it is concluded that alternative 2, where the PTES is able to deliver back to the transmission grid, is the most feasible alternative, and thus this configuration is recommended.
The demonstration supports certain valuation frames, reject others, and disregards some due to model limitations. As such, the model-based epistemic device has qualified the PTES in several aspects, thereby brought it into being. By demonstrating the potential benefits and addressing certain valuation frames, actors in doubt of the produced effects can now turn to the demonstration to envision the impact and their specific role. However, some valuations have not been qualified in the model and are thus still uncertain and up for contestation. This implies, that valuation is an ongoing process which cannot be completed by a single epistemic device, finally determining the objects properties.
12.3 Business model Based on the preceding results, this report establishes and proposes a business model, which through narratives and calculations may translate and enrol actors to participate in the investment of the PTES.

101
As the preceding results indicate a situation of uncertainty, it is not possible to establish one final business model. Therefore, four potential revenue models are proposed, which, depending on their ability to enrol actors, may become dominant, as the business model circulates in the network.
Having identified the existing valuation frames, it is possible to know which valuation frames need to be shifted, and to target the narrative of the business model accordingly. If the valuation frames had not been identified, the aim of the business model might not have been accurate. While CHP plants will likely invest if they can increase their production, district heating companies will likely invest given lower heat costs. Furthermore, by supporting the targeted narratives with the calculations presented through the calculative model, the business model can now circulate in the socio-technical network of the CPH-DHS.
12.4 Applying the generated knowledge In this report, the role of model-based knowledge has been examined, in the process for the PTES to move from a wild unknown towards a passive object. By bringing the PTES into being, it has been brought closer to being pacified, as some valuation frames have been confirmed while others have been rejected. The potential of this demonstration, brought forward as a technical energy system simulation and presented in the format of the business model, is the ability to enrol actors by translating their valuations into a common framing supporting the investment.
As such, this report has shown, that through model based knowledge, combined with an insight into the actors’ perceptions and valuation of a PTES and the use of a business model, the catch-22 situation may be eluded, although not escaped completely. The actors were in a situation where they could not invest, because the impacts were unknown, and the impacts were unknown as the investment was not yet made. Due to the demonstrated effects, the PTES has been brought into being, allowing the actors to come closer to making the investment.

102

103
13 Epilogue This chapter provides some reflections about the quality and limitations of the research carried out in this report, and presents some thoughts and recommendations for future research.
While the interdisciplinary approach taken in this report allows for the analysis of how the social and technical aspects of DH planning affect each other, it also limits the detail which a more focused approach could provide. Several technical uncertainties remain unanswered, and these could possibly have been solved with increased focus in one of the areas. For example, the questions regarding method of return to transmission level could have been developed further, just a more detailed energy system modeling would have been possible. The modeling of the CPH-DHS is in itself a complicated task, and several assumptions were necessary to take about the operation and technical details of the system. Furthermore, due to space and time constraints, sensitivity analyses were not granted much space in this report; a limitation which could have been averted with a solely technical approach.
Likewise, the valuation part of this report could also have been developed further. As valuation is shaped through heterogeneous networks, the valuations build upon past research, reports and professional perceptions. An analysis, of which factors affect the valuations identified in this report, could provide knowledge about how actors take decisions and frame perceptions of technology in the DH sector. Furthermore, the number of actors included in the analysis could also have been expanded, as actors could have different valuations, given the same kind of technical reality. K/N might not be representable for ARC and VF, nor can HOFOR with AMV speak on behalf of AVV owned by DONG Energy. It is reasonable to expect that more valuations could be uncovered by including a larger dataset.
As valuation and enrollment happens through a process, the process as a whole has been impossible to examine, given the time for the research for this report. Examining the process from the idea was pitched to the investment decision is taken, could provide knowledge about which factors shape investment decisions and how valuation frames are formed and shaped through such a process. As of now, a proposal for how to divide the investment costs has been provided, but it is not possible to examine the effect of the proposal. But as business models circulate, so too will they be valuated and adjusted to the perceptions of the DH actors.
Future research into the process of valuation could examine the next phase of the valuation process, where actors are presented to the business model and have their perceptions converged or diverged. Conversely, future research of the use of calculative modelling tools could examine and compare different models, such as the Energy PRO model and the Balmorel model, currently used by HOFOR and VEKS (via Ea Energy Analysis), and see whether they provide comparable results, and whether this could bring actors closer to an agreement.
The theoretical standpoint of this report has shaped the approach and results. By choosing the STS approach, a broad analysis covering both social and technical aspects was conducted, as otherwise valuable knowledge could be left out. It provides a good starting point for mapping possible

104
barriers for implementation of novel technologies such as the PTES, whereas it lacks the ability to go in depth with identified specific barriers. The strength of this report thus lies in the novel interdisciplinary approach by combining technical model expertise with social inquiry, and can thereby, hopefully, provide new knowledge to an established field of science and technology.

105

106

107
14 Bibliography BEK nr 1213. 2012. Bekendtgørelse Om Fastsættelse Af Prislofter Og Maksimalpriser for Fjernvarme Fra
Affaldsforbrændingsanlæg. https://www.retsinformation.dk/forms/R0710.aspx?id=144617. Beunza, Daniel, and Raghu Garud. 2007. ‘Calculators, Lemmings or Frame-Makers? The
Intermediary Role of Securities Analysts’. The Sociological Review 55 (October): 13–39. doi:10.1111/j.1467-954X.2007.00728.x.
Bijker, Wiebe E., and John Law. 1997. Shaping Technology / Building Society: Studies in Sociotechnical Change / Ed. by Wiebe E. Bijker, John Law. Inside Technology. Cambridge, Mass: MIT Press.
Bøhm, Benny, Niels C. Bergsøe, and Flemming Schrøder. 2009. ‘Hot Water Usage - Measuring the Consumption and Heat Loss from Circluation’. SBI. http://www.sbi.dk/byggeteknik/installationer/varmt-brugsvand/sbi-2009-10.pdf.
Boisvert, Raymond D. 1998. John Dewey - Rethinking Our Time. USA: State University of New York. Bryman, Alan. 2008. ‘The Nature of Quantitative Research’. In Social Research Methods, Third edition.
Oxford University Press. ———. 2015. Social Research Methods. 5 edition. Oxford ; New York: OUP Oxford. Çalışkan, Koray, and Michel Callon. 2010. ‘Economization, Part 2: A Research Programme for the
Study of Markets’. Economy and Society 39 (1): 1–32. doi:10.1080/03085140903424519. Callon, Michel. 1995. ‘2 Four Models for the Dynamics of Science’. In Handbook of Science and
Technology Studies, 28–63. 2455 Teller Road, Thousand Oaks California 91320 United States of America: SAGE Publications, Inc. http://srmo.sagepub.com/view/handbook-of-science-and-technology-studies/d6.xml.
———. 1998. ‘An Essay on Framing and Overflowing: Economic Externalities Revisited by Sociology’. The Sociological Review 46 (S1): 244–69. doi:10.1111/j.1467-954X.1998.tb03477.x.
Danish Energy Regulatory Authority. 2016. ‘ORIENTERING OM UDMELDING AF VARMTVANDSPRISLOFT FOR AFFALDSFORBRÆNDINGSANLÆG GÆLDENDE FOR ÅR 2017’. http://energitilsynet.dk/fileadmin/Filer/0_-_Nyt_site/VARME/Afgoerelser/Sekretariatsafgoerelser/Prislofter/2017Udmelding_af_prisloft_for_aar_2017_-_j.nr._16-09581.pdf.
DEA, Danish Energy Agency. 2015. ‘Technology Data for Energy Plants - Generation of Electricity and District Heating, Energy Storage and Energy Carrier Generation and Conversion’. https://ens.dk/sites/ens.dk/files/Analyser/teknologikatalog_august_2016_08082016.pdf.
———. 2016a. ‘Brændselspriser 2016’. ———. 2016b. ‘Technology Data for Energy Plants Updated Chapters, August 2016’. Doganova, Liliana, and Marie Eyquem-Renault. 2009. ‘What Do Business Models Do?: Innovation
Devices in Technology Entrepreneurship’. Research Policy 38 (10): 1559–70. doi:10.1016/j.respol.2009.08.002.
Doganova, Liliana, and Peter Karnøe. 2012. ‘The Innovator’s Struggle to Assemble Environmental Concerns to Economic Worth’. Grundfos New Business.
DONG Energy. 2017a. ‘DONG Energy to Stop All Use of Coal by 2023’. http://www.dongenergy.com/en/media/newsroom/news/articles/dong-energy-to-stop-all-use-of-coal-by-2023.
———. 2017b. ‘Heat Consumption’. https://www.dongenergy.dk/privat/få-en-lavere-energiregning/tjek-dit-energiforbrug/gennemsnitsforbrug/varmeforbrug.

108
Ea Energy Analysis. 2016. ‘El, Varme Og Affaldsforbrænding -Analyse Af Økonomi Ved Import Af Affald I et Langsigtet Perspektiv’.
EMD. 2016. ‘energyPRO User Guide’. http://emd.dk/energyPRO/Tutorials%20and%20How%20To%20Guides/energyPROHlpEng-4.4%20Apr.16.pdf.
Fligstein, Neil, and Ryan Calder. 2015. ‘Architecture of Markets’. In Emerging Trends in the Social and Behavioral Sciences: An Interdisciplinary, Searchable, and Linkable Resource. John Wiley & Sons.
Flyvbjerg, Bent. 2006. ‘Five Misunderstandings About Case-Study Research’. Qualitative Inquiry 12 (2): 219–45. doi:10.1177/1077800405284363.
HOFOR. 2017. Nielsen, Mia N. and Hendriksen, Niels. Interview by Nis Bertelsen and Uni R. Petersen. Semi-structured interview. Roskilde. May 10, 2017.
Høje Taastrup Fjernvarme. 2017. Schleiss, Uffe. Interview by Nis Bertelsen and Uni R. Petersen. Semi-structured interview. Roskilde. March 29, 2017.
Jensen, Jens Stissing, Matthew Cashmore, and Morten Elle. 2017. ‘Reinventing the Bicycle: How Calculative Practices Shape Urban Environmental Governance’. Environmental Politics 26 (3): 459–79. doi:10.1080/09644016.2017.1311089.
KARA/NOVEREN. 2017. Hansen, Klaus W.. Interview by Nis Bertelsen and Uni R. Petersen. Semi-structured interview. Roskilde. April 27, 2017.
Kousksou, T., P. Bruel, A. Jamil, T. El Rhafiki, and Y. Zeraouli. 2014. ‘Energy Storage: Applications and Challenges’. Solar Energy Materials and Solar Cells 120, Part A (January): 59–80. doi:10.1016/j.solmat.2013.08.015.
Kvale, Steinar, and Svend Brinkmann. 2015. Interview: det kvalitative forskningsinterview som håndværk / Steinar Kvale, Svend Brinkmann. 3. udgave. Kbh: Hans Reitzel.
LBK nr 1307. 2014. Statutory Order of Law on Heat Supply. Lee, Kun Sang. 2013. Underground Thermal Energy Storage. Green Energy and Technology. London:
Springer London. doi:10.1007/978-1-4471-4273-7. Lund, Henrik. 2005. ‘Large-Scale Integration of Wind Power into Different Energy Systems’.
Energy 30 (13): 2402–12. doi:10.1016/j.energy.2004.11.001. Lund, Henrik, Bernd Möller, Anders Dyrelund, and Brian Vad Mathiesen. 2010. ‘The Role of
District Heating in Future Renewable Energy Systems’. Energy 35 (3): 1381–90. doi:10.1016/j.energy.2009.11.023.
Lund, Henrik, Sven Werner, Robin Wiltshire, Svend Svendsen, Jan Eric Thorsen, Frede Hvelplund, and Brian Vad Mathiesen. 2014. ‘4th Generation District Heating (4GDH): Integrating Smart Thermal Grids into Future Sustainable Energy Systems’. Energy 68 (April): 1–11. doi:10.1016/j.energy.2014.02.089.
Mathiesen, Brian Vad, Henrik Lund, and David Connolly. 2014. ‘The CEESA Smart Energy Systems Approach for Denmark and Europe’. http://vbn.aau.dk/da/publications/the-ceesa-smart-energy-systems-approach-for-denmark-and-europe(07c0032e-edbe-4e8b-bdb0-263239decb90).html.
Mitchell, Timothy. 2008. ‘Rethinking Economy’. Geoforum 39 (3): 1116–21. doi:10.1016/j.geoforum.2006.11.022.
Mortensen, Henrik Bach, and Peter Karnøe. 2017. ‘Framing the Deal for Hinkley Point C in the UK: Performing Political Valuation of Economic Reality for New Nuclear Power’. Not Published at Time of Writing.
Muniesa, Fabian, Liliana Doganova, Horacio Ortiz, Alvaro Pina-Stranger, Florence Paterson, Alaric Bourgoin, Véra Ehrenstein, et al. 2017. Capitalization : A Cultural Guide. Edited by Cécile Méadel. Presses des Mines.
Nord Pool Spot. 2016. ‘Historical Market Data’. http://www.nordpoolspot.com/historical-market-data/.

109
PlanEnergi. 2016. ‘Dronninglund Fjernvarme’. PlanEnergi.dk. http://planenergi.dk/arbejdsomraader/fjernvarme/saesonvarmelagre/dronninglund-fjernvarme/.
PlanEnergi, Teknologisk Institut, GEO, and Grøn Energi. 2013. ‘Udredning Vedrørende Varmelagringsteknologier Og Store Varmepumper Til Brug I Fjernvarmesystemet’. http://fjernvarmeindustrien.dk/wp-content/uploads/2014/01/varmelagringsteknologier_og_store_varmepumper_til_brug_i_fjernvarmesystemet.pdf.
Powell, Kody M., Jong Suk Kim, Wesley J. Cole, Kriti Kapoor, Jose L. Mojica, John D. Hedengren, and Thomas F. Edgar. 2016. ‘Thermal Energy Storage to Minimize Cost and Improve Efficiency of a Polygeneration District Energy System in a Real-Time Electricity Market’. Energy 113 (October): 52–63. doi:10.1016/j.energy.2016.07.009.
PWC. 2016. ‘Afgiftsvejledning 2017 Samlet Overblik over Afregning Og Godt- Gørelse Af Afgifter’. https://www.pwc.dk/da/nyt/publikationer/afgiftsvejledning-2017.html.
Rambøll. 2015. ‘Fjernvarme Projektforslag For Overskudsvarme Med Fjernkøling I Høje Taastrup Syd’.
Sismondo, Sergio. 2010. An Introduction to Science and Technology Studies. 2nd ed. Chichester, West Sussex, U.K. ; Malden, MA: Wiley-Blackwell.
SKAT. 2016. ‘SKAT: Satsændringer Vedrørende Energiafgifter 2016.’ http://skat.dk/SKAT.aspx?oId=2186446.
Unruh, Gregory C. 2000. ‘Understanding Carbon Lock-In’. Energy Policy 28 (12): 817–30. Varmelast.dk. 2017a. ‘Fjernvarme Generelt’.
http://www.varmelast.dk/da/fjernvarmenettet/fjernvarmenettet. ———. 2017b. Folke, Peter. Interview by Nis Bertelsen and Uni R. Petersen. Semi-structured
interview. Copenhagen. May 3, 2017. ———. 2017c. ‘Varmeplaner’. Varmelast.dk.
http://www.varmelast.dk/da/varmeplaner/varmeplaner. Varmeplan Hovedstaden. 2013. ‘Notat Vedr. VPH Netmodel’.
http://www.varmeplanhovedstaden.dk/files/otherfiles/0000/0119/Notat_vedr_VPH_netmodel_-_august_2013.pdf.
———. 2014a. ‘Baggrundsrapport Om Teknologier’. http://www.varmeplanhovedstaden.dk/files/otherfiles/0000/0123/VPH3_Baggrundsrapport_om_teknologier_-_oktober_2014.pdf.
———. 2014b. ‘Hovedrapport’. http://www.varmeplanhovedstaden.dk/files/otherfiles/0000/0124/VPH3_Hovedrapport_-_oktober_2014.pdf.
———. 2014c. ‘Varmemarkedets Udvikling’. http://www.varmeplanhovedstaden.dk/files/otherfiles/0000/0117/vph3_varmemarkedets_udvikling_010514.pdf.
VEKS. 2017. Stobbe, Morten and Sørensen, Jens B.. Interview by Nis Bertelsen and Uni R. Petersen. Semi-structured interview. Høje Taastrup, February 21 2017.
Verda, Vittorio, and Francesco Colella. 2011. ‘Primary Energy Savings through Thermal Storage in District Heating Networks’. Energy 36 (7): 4278–86. doi:10.1016/j.energy.2011.04.015.
Weick, Karl E. 1995. Sensemaking in Organizations. Foundations for Organizational Science. Thousand Oaks: Sage Publications.

110
List of figures Figure 1.1 Report structure .......................................................................................................................... 5
Figure 1.1 Illustration of the relationship between valuation frames, calculative devices and businessmdels in a process of enrolling other actors within the network, such as investors. 18
Figure 4.1 Screenshot showing the EnergyPRO interface including an overview of the modelled reference scenario .............................................................................................................................. 27
Figure 5.1 Three categories of characteristics in which TES solutions may vary (Lee 2013) ......... 34
Figure 5.2 Conceptual drawing of underground TTES (DEA 2015) ................................................. 35
Figure 5.3 CPH plant with connected TTES in Viborg, Denmark (Mørch 2014) ........................... 35
Figure 5.4 PTES connected to solar thermal plant in Dronninglund, Denmark (PlanEnergi 2016) .................................................................................................................................................... 36
Figure 5.5 Conceptual drawing of PTES (DEA 2015) ......................................................................... 36
Figure 6.1 The logos of transmission companies VEKS and CTR .................................................... 39
Figure 6.2 The district heating system of Greater Copenhagen,Authers own representation after Varmelast.dk ....................................................................................................................................... 40
Figure 6.3 The process of creating daily heat plans. Figure reconstructed by the authors based on (Varmelast.dk 2017b) ........................................................................................................................ 43
Figure 7.1 Elements in the valuation frame of VEKS .......................................................................... 49
Figure 7.2 Elements in the valuation frame of Høje Taastrup DH DH ............................................ 49
Figure 7.3 Valuation frame of K/N ......................................................................................................... 50
Figure 7.4 Valuation frame of Varmelast.dk ........................................................................................... 51
Figure 7.5 Valuation frame of HOFOR .................................................................................................. 53
Figure 7.6 The valuation frames of actors in question, and the relation to a calculative device .... 56
Figure 8.1 Share of production type ........................................................................................................ 59
Figure 8.2 The reference scenario heat production profile, daily. ....................................................... 60
Figure 8.3 Duration curve for heat production, daily ........................................................................... 61
Figure 8.4 Share of fuel consumption in the reference scenario ......................................................... 61
Figure 8.5 Høje Taastrup DH heat pump production profile, with unused heat production ........ 62
Figure 8.6 The change in heat production per plant in alternative 1 and alternative 2 .................... 63

111
Figure 8.7 Change in fuel consumption from the reference scenario to alternatives 1 and 2, GWh .................................................................................................................................................... 64
Figure 8.8 Change in electricity generation from reference to alternative 1 and 2, daily ................. 65
Figure 8.9 Change in waste incineration operation from reference to alternative 1 and 2 .............. 66
Figure 8.10 Plant operation 19/06/2025 - 29/06/2025 ....................................................................... 68
Figure 8.11 Høje Taastrup DH heat demand duration curve and PTES discharge capacity .......... 69
Figure 8.12 Hourly energy stored in the proposed PTES in alternative 1 and 2. The colours in the figure are graduated, which is why there appear to be three colours. The dark-brown colour, however, represents hours that have similar storage content in both alternatives. ................. 70
Figure 8.13 TES usage in the reference scenario and alternative 1 and 2 .......................................... 71
Figure 8.14 The heat supply for VEKS transmission area, GWh ....................................................... 72
Figure 8.15 The heat supply for CTR transmission area, GWh .......................................................... 72
Figure 8.16 The heat supply for VEKS transmission area, GWh ....................................................... 73
Figure 9.1 Alternative 1 and 2 system economy compared to the reference scenario ..................... 78
Figure 9.2 Changes in revenue and expenses from reference to alternative 1 and 2 M. DKK ...... 81
Figure 9.3 Electricity and heat production ratio factor for reference scenario and alternative 1 and 2 ............................................................................................................................................................ 82
Figure 9.4 Changes in plant income in from reference scenario to the two alternatives. ................ 83
Figure A.1 Heat demand projections from VPH (Varmeplan Hovedstaden 2014c) ..................... 115
Figure A.2 Heat demand for the areas analyzed .................................................................................. 117
Figure A.3 Example of electricity price fluctuations in a selected 10-day period of February ..... 118
Figure A.4 Marginal heat production costs, selected plants. DKK/MWh ..................................... 121
Figure A.5 The assumed heat sale prices for the plants in the Greater Copenhagen District Heating System. DKK/MWh ....................................................................................................................... 122

112
List of tables Table 3.1 Two examples of the focus for a business model ................................................................ 16
Table 4.1 Overview of the interviewees, the organization they represent and their relevance regarding this report ................................................................................................................ 23
Table 5.1 Summary of characteristics of the TES technologies .......................................................... 37
Table 7.1 Valuation frames of the interviewed actors ........................................................................... 54
Table 8.1 Change in heat supply compared to reference scenario, GWh .......................................... 74
Table 9.1 System economy M.DKK ........................................................................................................ 77
Table 9.2 Impact on VEKS: revenue and expenses, M. DKK ............................................................ 79
Table 9.3 Impact on CTR: revenue and expenses, M. DKK ............................................................... 80
Table 9.4 Change in VF economy from reference to alternative 1 and 2, M. DKK ........................ 80
Table 9.5 Change in income per actor from reference to alternative 1 and 2, M. DKK ................. 82
Table 11.1 The three components of a business model for the PTES .............................................. 91
Table 11.2 PTES investment costs ........................................................................................................... 92
Table 11.3 Increase in income per actor and share of total increase in income ............................... 93
Table 11.4 Investment per actor and surplus after investment ........................................................... 93
Table 11.5 DH supply companies’ yearly investment costs in PTES ................................................. 94
Table 11.6 One common heat sale price reduction based upon heat production ............................ 94
Table 11.7 Projected investment costs based upon on common reduction in heat sale price ....... 95
Table 11.8 Individual heat sale price reductions based upon heat production ................................. 95
Table A.1 Yearly consumption for district heating areas .................................................................... 116
Table A.2 Summary of 2016 and 2025 forecasted electricity price range ........................................ 117
Table A.3 Unit characteristics ................................................................................................................. 119
Table A.4 Fuel prices ................................................................................................................................ 120
Table A.5 Overview of how fuels are taxed (PWC 2016; SKAT 2016) ........................................... 121

113

114

115
Appendix A Model Setup No calculative model is more accurate than the inputs and assumptions going into designing the it. Therefore, to be able to bring the PTES into being, the design of the model needs to represent reality as much as accurately as possible. This chapter describes the data used for building the EnergyPRO model as well as the assumptions applied in this process.
A.1 Heat Demand The heat demand forecast used in the model is developed by (Varmeplan Hovedstaden 2014c), and takes several questions regarding the future heat demand into account. Central to the heat demand forecast is the level of energy savings and expansion of district heating, as these factors will respectively decrease and increase the district heating demand. The demands are forecasted based on assumptions about additional areas connected to the established district heating systems, new building developments, as well as increasing efforts of energy savings. Most large buildings and half of the residential single-family housing are assumed connected to a DH network in 2025. The main VPH heat demand scenario has been used for the analysis, as this is based upon expectations from the individual distribution companies. The heat demand projection is presented in Figure A.1 below. It is assumed that a large share of the buildings with a potential for connecting to district heating will do so before 2025. This explains the increase in heat demand from 2015 to 2025, and that the majority of the increase is in the area of VEKS and VF as these areas currently have a smaller share of DH than the densely populated area of CTR. The decrease in heat demand after 2025 is caused by energy savings. A total reduction of 22% in 2035 is assumed (Varmeplan Hovedstaden 2014c).
Figure A.1 Heat demand projections from VPH (Varmeplan Hovedstaden 2014c)
To analyze the impact of the PTES in the distribution area of Høje Taastrup, this area is modelled independently and is the only distribution-level area included in the model. The energyPRO model
0
10000
20000
30000
40000
50000
2015 2020 2025 2030 2035
TJ
Developmentofheatdemand
CTR VEKS VF
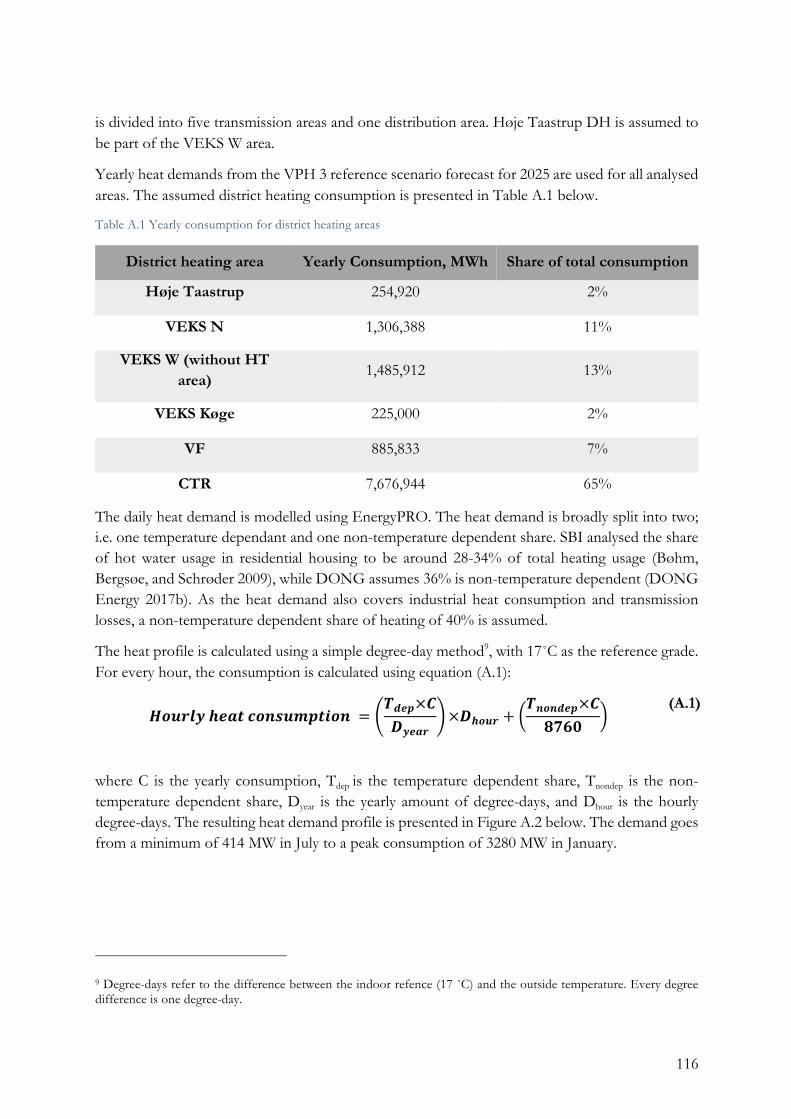
116
is divided into five transmission areas and one distribution area. Høje Taastrup DH is assumed to be part of the VEKS W area.
Yearly heat demands from the VPH 3 reference scenario forecast for 2025 are used for all analysed areas. The assumed district heating consumption is presented in Table A.1 below.
Table A.1 Yearly consumption for district heating areas
District heating area Yearly Consumption, MWh Share of total consumption
Høje Taastrup 254,920 2%
VEKS N 1,306,388 11%
VEKS W (without HT area) 1,485,912 13%
VEKS Køge 225,000 2%
VF 885,833 7%
CTR 7,676,944 65%
The daily heat demand is modelled using EnergyPRO. The heat demand is broadly split into two; i.e. one temperature dependant and one non-temperature dependent share. SBI analysed the share of hot water usage in residential housing to be around 28-34% of total heating usage (Bøhm, Bergsøe, and Schrøder 2009), while DONG assumes 36% is non-temperature dependent (DONG Energy 2017b). As the heat demand also covers industrial heat consumption and transmission losses, a non-temperature dependent share of heating of 40% is assumed.
The heat profile is calculated using a simple degree-day method9, with 17˚C as the reference grade. For every hour, the consumption is calculated using equation (A.1):
!"#$%&()*+,"-.#/0+1"- =34)0×67&)*$
×7("#$ +3-"-4)0×69:;<
(A.1)
where C is the yearly consumption, Tdep is the temperature dependent share, Tnondep is the non-temperature dependent share, Dyear is the yearly amount of degree-days, and Dhour is the hourly degree-days. The resulting heat demand profile is presented in Figure A.2 below. The demand goes from a minimum of 414 MW in July to a peak consumption of 3280 MW in January.
9 Degree-days refer to the difference between the indoor refence (17 ˚C) and the outside temperature. Every degree difference is one degree-day.

117
Figure A.2 Heat demand for the areas analyzed
A.2 Electricity price forecast The DEA’s average electricity price forecast for 2025 is used in the model. The average electricity price in 2025, A2025, is assumed to be 344.6 DKK/MWh (DEA 2016a). To simulate the hourly price variations, the 2016 price pattern (Nord Pool Spot 2016) is used. For every hour h, an electricity price P is given, and adjusted with a factor Fave of the relative difference between the 2016 and 2025 averages. As the electricity prices are assumed to have increased fluctuations in 2025 compared to 2016, the prices are adjusted with a fluctuation factor of 1.4, Fflu, resulting in an average of 40% increase in electricity price fluctuations. The hourly electricity prices of 2025 are given by equation (A.2).
!"#$%&)%),+$1,1+&0$1,)=<=> = ?(×@AB) − A=<=> ×@D%# + A=<=> (A.2)
Table A.2 below describes the price range of 2016 electricity prices and the 2025 price forecast. As shown, the expected 2025 average is higher than the 2016 average. As higher fluctuations are expected, the minimum and maximum electricity prices are expected to be more extreme in 2025.
Table A.2 Summary of 2016 and 2025 forecasted electricity price range
0
500
1000
1500
2000
2500
3000
3500
MW
Heatdemandforecast2025
VEKSNorth VEKSWest VF Køge HøjeTaastrup CTR
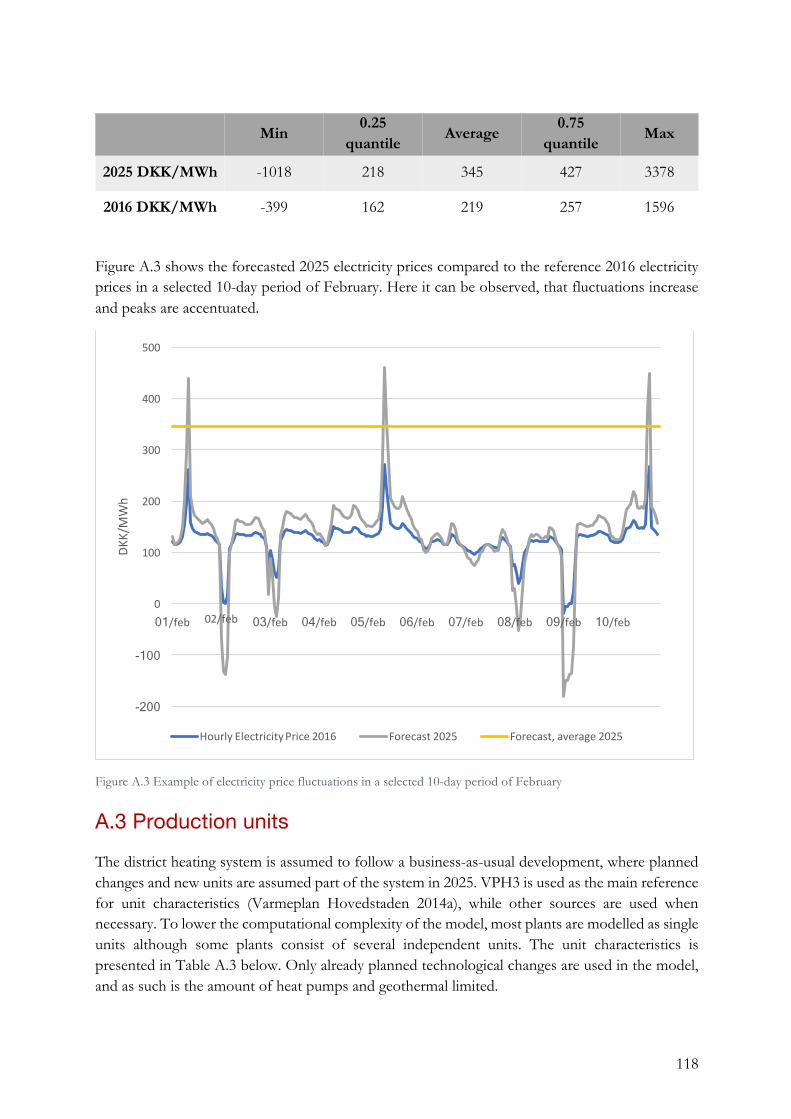
118
Min 0.25
quantile Average 0.75
quantile Max
2025 DKK/MWh -1018 218 345 427 3378
2016 DKK/MWh -399 162 219 257 1596
Figure A.3 shows the forecasted 2025 electricity prices compared to the reference 2016 electricity prices in a selected 10-day period of February. Here it can be observed, that fluctuations increase and peaks are accentuated.
Figure A.3 Example of electricity price fluctuations in a selected 10-day period of February
A.3 Production units The district heating system is assumed to follow a business-as-usual development, where planned changes and new units are assumed part of the system in 2025. VPH3 is used as the main reference for unit characteristics (Varmeplan Hovedstaden 2014a), while other sources are used when necessary. To lower the computational complexity of the model, most plants are modelled as single units although some plants consist of several independent units. The unit characteristics is presented in Table A.3 below. Only already planned technological changes are used in the model, and as such is the amount of heat pumps and geothermal limited.
-200
-100
0
100
200
300
400
500
01/feb 02/feb 03/feb 04/feb 05/feb 06/feb 07/feb 08/feb 09/feb 10/feb
DKK/M
Wh
HourlyElectricityPrice2016 Forecast2025 Forecast,average2025

119
Table A.3 Unit characteristics
Plant Unit Electric Capacity
MW
Heat Capacity
MJ/s
Energy Consumption
MW Fuel
AMV
AMV1 68 250 342 Wood Pellets AMV BIO4 150 400 591 Wood Chips AMV BIO4
Bypass 0 550 591 Wood Chips
AVV
AVV1 215 330 612 Wood Pellets AVV1
Condensing 250 0 595 Wood Pellets
AVV2 Main 280 445 815 Wood Pellets
AVV2 Gas turbines 128 92 247 Natural Gas
AVV2 Straw boiler
45 50 101 Straw
HCV 99 299 462 Natural Gas KKV 22 65 94 Wood Chips
Total CHP capacity 1.042 1.784 3.859
ARC 57 190 231 Waste K/N 32 96 131 Waste VF 39 143 186 Waste
Total Waste incineration
capacity 128 429 548
AMV is modelled as two units. The existing AMV 1 is assumed rebuilt to use wood pellets and the planned AMV 4 unit is assumed in operation in 2025 using wood chips. AMV4 has the option of bypassing the turbine, allowing for a higher heat output but with no electricity production. AVV is assumed to run only on biomass due to DONG Energy’s policy of facing out coal before 2023 (DONG Energy 2017a). AVV1 can run in condensing mode, producing only electricity and no DH. AAV 2 consist of the main unit, a wood pellet fired boiler powering a steam turbine10. The steam turbine can be boosted from the straw boiler or with excess heat from the gas turbines, while these units cannot operate without the main boiler online. Due to the constraints in the modelling software, the AVV gas turbines and straw boiler are modelled to have both heat and power outputs.
10 AVV2 is a multi-fuel plant capable of using coal or biomass. Due to political goals, AVV2 is assumed to only run on wood pellets

120
At the plant, however, the straw boiler and the excess heat from gas turbines merely boost the main steam turbine, and as such it is not these unit themselves producing heat and power.
The specific unit characteristics are presented in appendix C.
While waste incineration plants are currently prioritized in the load scheduling at Varmelast.dk, this is uncertain in the future. To analyse the potential impact of a PTES on the waste incineration plants, they are assumed to follow the same load dispatch as the remaining plants. This ensures that the potential impact on waste incineration is analysed. If, however, the waste incineration plants remain prioritized in the load dispatch, they will presumably experience no impact from the PTES implementation.
A.4 Fuel Prices Fuel prices are assumed to follow the DEA’s price projections, based on IEA scenarios (DEA 2016a), and are presented in Table A.4 below. Waste price levels are based on an analysis by Ea Energy Analysis (2016), projecting incineration plants to receive 260-300 DKK per ton of received waste in 2025. As local waste amounts are assumed to decrease, due to more recycling and efficiency, waste will become a scarcer resource towards 2025. To maintain production levels at the waste incineration plants waste must be imported from abroad to supplement local resource levels.
Table A.4 Fuel prices
Natural Gas Coal Fuel oil Gasoil Straw Wood
Chips Wood Pellets Waste
2025 DKK/GJ 50.1 22.8 86.1 116.4 46.8 54.7 70.0 -26.7
A.5 Energy taxation, subsidies and quotas Relevant taxation and subsidies are applied to analyse the district heating system from a business-economic viewpoint. Therefore, plants pay taxation from fuel consumption and will be reimbursed for the share of electricity production, as only fuel used for heat production is taxed. Plants must choose between the E and V formula for calculating the amount of fuel subject to taxation:
• E formula: 1-EP /0.65 • V formula: HP/1.25, although minimum EP/0.35
EP is electricity production and HP is heat production. All plants are assumed to use the V formula for calculation of the fuel consumption, as this is preferable for plants with high heat output.

121
Table A.5 Overview of how fuels are taxed (PWC 2016; SKAT 2016)
Fuel Energy Tax CO2 Tax Total
Natural Gas 2,175 DKK/1000Nm3 387 DKK/1000Nm3 2,562
DKK/1000Nm3
Waste 205 DKK/Ton 174 DKK/Ton 256 DKK/Ton
A.6 Scheduling of plants EnergyPRO schedules plants on an hourly basis by calculating a priority number, given their heat production cost using the inputs mentioned above. The marginal heat production cost of selected plants is presented in Figure A.4 below.
Figure A.4 Marginal heat production costs, selected plants. DKK/MWh
The model schedules the plants with the lowest heat production cost (highest priority) first, thereafter the following and so on, until all demands are met.
A.7 Calculation of the heat sale price The heat production costs and the heat sales price are not assumed to be the same. As it is difficult to determine the share of fuel and O&M between heat and electricity production, some assumptions about how to share costs are used. The same principle as used in the calculation of the amount of fuel subject to taxation is used here. The total fuel costs, O&M and energy taxation is assumed divided with a fixed ratio describing the share between heat and electricity production. For AVV and HCV owned by DONG Energy, a larger share of the production costs is assumed
-800 -600 -400 -200
0
200
400
600
800
-300
-200
-100
0
100
200
300
400
500
600
700
800
900
1000
1100
1200
1300
1400
1500
1600
1700
1800
MarginalheatproductionpriceDKK/M
Wh
ElectricityspotpriceDKK/MWh
Marginalheatproductioncostsofselectedplants
ARC AMV1 AMVBIO4 AVV2 Peakgasboiler

122
to be covered by the heat side, as DONG Energy is a commercial company compared to the district heating companies owning AMV and KKV11. The ratio assumed to divide the production costs is thus 1.1 for AVV and HCV and 1.2 for AMV and KKV. The heat price calculation is presented in equation (A.3) below.
!)*+?$1,) =@6 + EF+ G3
H+ 3A (A.3)
Where FC is the fuel costs, OM is O&M, ET is the energy taxation, R is the ratio between heat and electricity, and TA is the tax advantage biomass can include in the heat sales price. TA is zero for non-biomass plants such as HCV using natural gas.
TA is based on an average energy taxation of 272.1 DKK/MWh for coal consumption (PWC 2016). As the level included in the heat sale price is dependent on a negotiation between producer and transmission company, it is assumed that 40% of the taxation advantage is included in the heat sales price, thereby adding 108.8 DKK/MWh to the heat sale price from biomass plants.
Waste incineration plants are assumed to set their heat sale price according to the price cap of 306 DKK/MWh (Danish Energy Regulatory Authority 2016). Figure A.5 below illustrates the calculated heat sales prices.
Figure A.5 The assumed heat sale prices for the plants in the Greater Copenhagen District Heating System. DKK/MWh
11 This assumption was made with the help of Ea Energy Analysis
050100150200250300350400450
DKK/M
Wh
HeatSalePrice
FuelCostDKK/MWh VariableO&MDKK/MWh EnergyTaxKr./MWh
TaxAdvantage WastePriceCap

123
A.8 Pit thermal energy storage Based on interviews with actors in the field, and the review of existing technology presented above in chapter 5, the PTES is assumed to be 100.000 m3, with a top temperature of 90˚C and a bottom temperature of 50˚C. The charge/discharge capacity is assumed 50 MW.
According to interviews, the investment is assumed to be 70 M. DKK. The investment costs are high compared to the DEA (2015) as a 100.000 m3 has a projected investment cost of 27 M. DKK, excluding expenses for the plot. This is, however, assumed to be a mayor investment in the Greater Copenhagen area, and a main barrier according to several interviewees. Furthermore, several interviewees state that the distance from the plot to the transmission grid may lead to excessive costs for piping.

124

125
Appendix B Interview guides
B.1 Spørgsmål til Jens Brandt Sørensen og Morten Stobbe - VEKS
Generelt
Fortæl lidt om problemstillingen
• Hvorfor bygge et varmelager? o Systemoptimering? o Miljø? o Erhvervsøkonomi eller samfundsøkonomi?
• Hvorfor ikke? o Økonomiske barrierer? o Andre barrierer? o Varmelagre findes flere andre steder – er der specifikke barrierer i dette eksempel?
Hvem vil gerne have et varmelager?
• Høje Taastrup og Roskilde har været på tale? Økonomi
Hvordan bliver varme handlet? Hvilke markedsmodeller?
Hvad er værdien i lageret?
• Hvad er værdien for VEKS? • For DONG, lokale fjernvarmeselskaber m.fl.
Hvilke forhold tager i i betragtning?
• Fleksibilitet, CO2 • Forhold der er svære at værdisætte? • Hvordan værdisætter I det?
Teknisk
Hvilke enheder forestiller i jer skal levere til varmelageret?
• Høje Taastrups varmepumpe? • Hvilke Kraftværker?
Hvilket slags lager?
• Sæson/korttidslager • Begge dele? Er det muligt? • Størrelse
Hvad skal der ske med spidslastkedlerne frem mod 2025, hvor fjernvarmeproduktionen skal være CO2 neutral?
Aktører

126
Hvilke aktører samarbejder i med (omkring varmelageret)?
Hvilke skal i samarbejde med ift. levering af varme?
Forestillinger om markedsmodel
Hvordan skal varmelageret fungere på et marked?
• Variable timepriser for varme • Ny aktør der ejer lageret? • Fast tarif – varmelager som infrastruktur?
B.2 Spørgsmål til Klaus W. Jensen, KARA/NOVEREN Generelt
Kan du fortælle omkring Kara/Novoren som affaldsværk?
• Hvor meget affald håndterer i? • Hvordan justerer i driften? Hvilke forhold er bestemmende for jeres produktion
(affaldsmængder, varmebehov, elpriser andet?)
Kara/Novoren er prioriteret hos Varmelast.dk – hvad betyder det for jeres drift?
Kan du fortælle lidt om jeres tanker omkring et varmelager og den proces i har været igennem:
• Hvornår begyndte I at se på det?• Hvorfor begyndte I at se på det?
o Samarbejdet med VEKS og andre aktører – hvordan har processen været efter VEKS og andre blev involveret?
Varmelager
Hvilke fordele ser I i et lager fra jeres synspunkt?
• Ift det lager Kara/Novoren har foreslået? • Ift til det lager Høje Taastrup Fjernvarme har foreslået?
Hvordan fungerer et lager i sammenhæng med driftsprioritering fra varmelast.dk?
Hvilke forskelle er der, for jer, i et ”privat” lager og et system lager?
• Driftsmæssigt, værdimæssigt, andre?
Hvordan værdisætter I et varmelager?
• Hvis Kara/Novoren selv ejer lageret? • Hvis det er et system lager? • Økonomisk værdi – eller driftsmæssig, miljømæssig eller andre faktorer?
Forretningsmodel
Har I nogle idéer/ønsker til hvordan en forretningsmodel for lageret kan se ud?

127
• Hvilken forrentningsmodel tænkte i omkring Kara/Novoren lageret? • Har i nogle tanker om hvordan en forretningsmodel for et systemlager kan fungere?
Fremskrivninger og fremtidssyn
Hvordan forestiller I jer, at markedet for affaldsforbrænding udvikler sig?
• Varmeforbrug, elpriser m.m. • Hvordan udvikler affaldsmængderne sig?
Hvordan ser I på liberalisering af varmemarkedet?
• Forbliver affaldsværker prioriterede i lastfordelingen? • Bliver brændselsvalget frit så Kara/Novoren også kan fyre med andre brændsler?
B.3 Spørgsmål til Peter Folke, Varmelast.dk Generelt
Kan du fortælle lidt om Varmelast.dk og jeres rolle i fjernvarmesystemet?
Kan du uddybe lidt om prioriteringen af affaldsværker? Hvordan foregår dette?
- Vil affaldsværker forblive prioriteret i fremtiden, hvis der sker en liberalisering af varmemarkedet?
Kender I til de igangværende planer om at etablere varmelager i Høje Taastrup?
Varmelager
Hvordan bliver nuværende varmelagre lastfordelt?
- Er det Varmelast.dk der lastfordeler til lagerne, eller er det værkerne der må styre det strategisk ift elpris f.eks.?
Hvordan ville et nyt lager blive lastfordelt? Ville der være nogen forskel?
Er det muligt at forhindre nogen producent i at bruge lageret?
Hvilke fordele ser I i et nyt lager fra jeres synspunkt?
Hvordan værdisætter I et varmelager?
• Hvis det er et system lager? • Hvis det var et ”lokalt” sæsonlager? • Har det en økonomisk værdi? Eller driftsmæssig, miljømæssig eller andre faktorer?
Forretningsmodel
Har I nogle idéer/ønsker til hvordan en forretningsmodel for lageret kan se ud?

128
B.4 Spørgsmål til Uffe Schleiss, Høje Taastrup Forsyning Generelt
Fortæl lidt om problemstillingen
• Hvorfor bygge et varmelager? o Hvor kommer ideen fra? Varmepumpen? o Hvilken rolle har HTF i etableringen af et varmelager? o Systemoptimering? o Miljøhensyn? o Positiv økonomi – samfunds eller forretningsmæssigt?
• Hvorfor ikke / hvad er problemet? o Økonomiske eller tekniske barrierer? o Andre barrierer? o Varmelagre findes flere andre steder – er der specifikke barrierer i dette eksempel?
Placering og aktører?
• Samarbejde med VEKS? Hvem står for planlægningen? • Hvordan er samarbejdet koordineret, og hvem er ansvarlig?
Hvilket slags lager?
• Sæson eller uge-til-uge • Hvad er HTF’s grund til at få et varmelager?
Økonomi
Hvordan bliver varme handlet? Hvilke markedsmodeller?
• Kontrakter? • Kunne man forestille sig andre modeller? Timepriser f.eks.
Hvad er værdien i lageret?
• Hvad er værdien for HTF? • For DONG, VEKS m.fl.
Hvilke forhold tager i i betragtning?
• Fleksibilitet, CO2 udledning • Forhold der er svære at værdisætte? • Hvordan værdisætter I det? • Peak produktion, øget produktion på KV?
Teknisk
Hvilke enheder forestiller i jer skal levere til varmelageret?
• Kun Høje Taastrups varmepumpe? • Andre enheder? • Måske ikke et enkelt anlæg, men baseret på markedsmekanismer?
Hvilket slags lager?
• Sæson/korttidslager • Begge dele? Er det muligt?
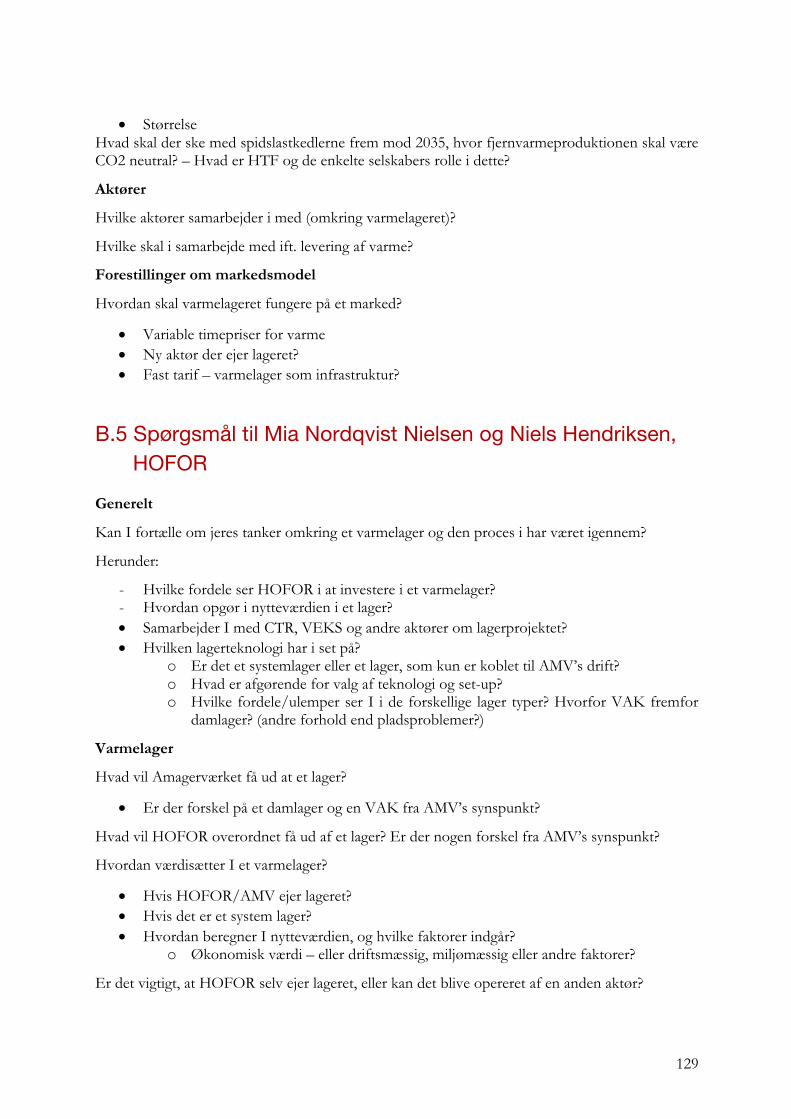
129
• Størrelse Hvad skal der ske med spidslastkedlerne frem mod 2035, hvor fjernvarmeproduktionen skal være CO2 neutral? – Hvad er HTF og de enkelte selskabers rolle i dette?
Aktører
Hvilke aktører samarbejder i med (omkring varmelageret)?
Hvilke skal i samarbejde med ift. levering af varme?
Forestillinger om markedsmodel
Hvordan skal varmelageret fungere på et marked?
• Variable timepriser for varme • Ny aktør der ejer lageret? • Fast tarif – varmelager som infrastruktur?
B.5 Spørgsmål til Mia Nordqvist Nielsen og Niels Hendriksen, HOFOR
Generelt
Kan I fortælle om jeres tanker omkring et varmelager og den proces i har været igennem?
Herunder:
- Hvilke fordele ser HOFOR i at investere i et varmelager? - Hvordan opgør i nytteværdien i et lager? • Samarbejder I med CTR, VEKS og andre aktører om lagerprojektet?• Hvilken lagerteknologi har i set på?
o Er det et systemlager eller et lager, som kun er koblet til AMV’s drift?o Hvad er afgørende for valg af teknologi og set-up?o Hvilke fordele/ulemper ser I i de forskellige lager typer? Hvorfor VAK fremfor
damlager? (andre forhold end pladsproblemer?)
Varmelager
Hvad vil Amagerværket få ud at et lager?
• Er der forskel på et damlager og en VAK fra AMV’s synspunkt?
Hvad vil HOFOR overordnet få ud af et lager? Er der nogen forskel fra AMV’s synspunkt?
Hvordan værdisætter I et varmelager?
• Hvis HOFOR/AMV ejer lageret? • Hvis det er et system lager? • Hvordan beregner I nytteværdien, og hvilke faktorer indgår?
o Økonomisk værdi – eller driftsmæssig, miljømæssig eller andre faktorer?
Er det vigtigt, at HOFOR selv ejer lageret, eller kan det blive opereret af en anden aktør?

130
Varmesalg
Kan I fortælle om varmesalget imellem værker, transmissions og distributionsfirmaer?
- Hvordan foregår varmesalg mellem AMV, HOFOR, CTR og VEKS?
Som vi har forstået varmesalget bliver det styret af individuelle fortrolige kontrakter imellem aktørerne. Kan i uddybe hvordan de generelt fungerer? (uden nødvendigvis at gå i detaljer)
Forretningsmodel
Har I nogle idéer/ønsker til hvordan en forretningsmodel for lageret kan se ud?
- Hvis det er HOFOR der ejer lageret? - Hvis det er et system lager?
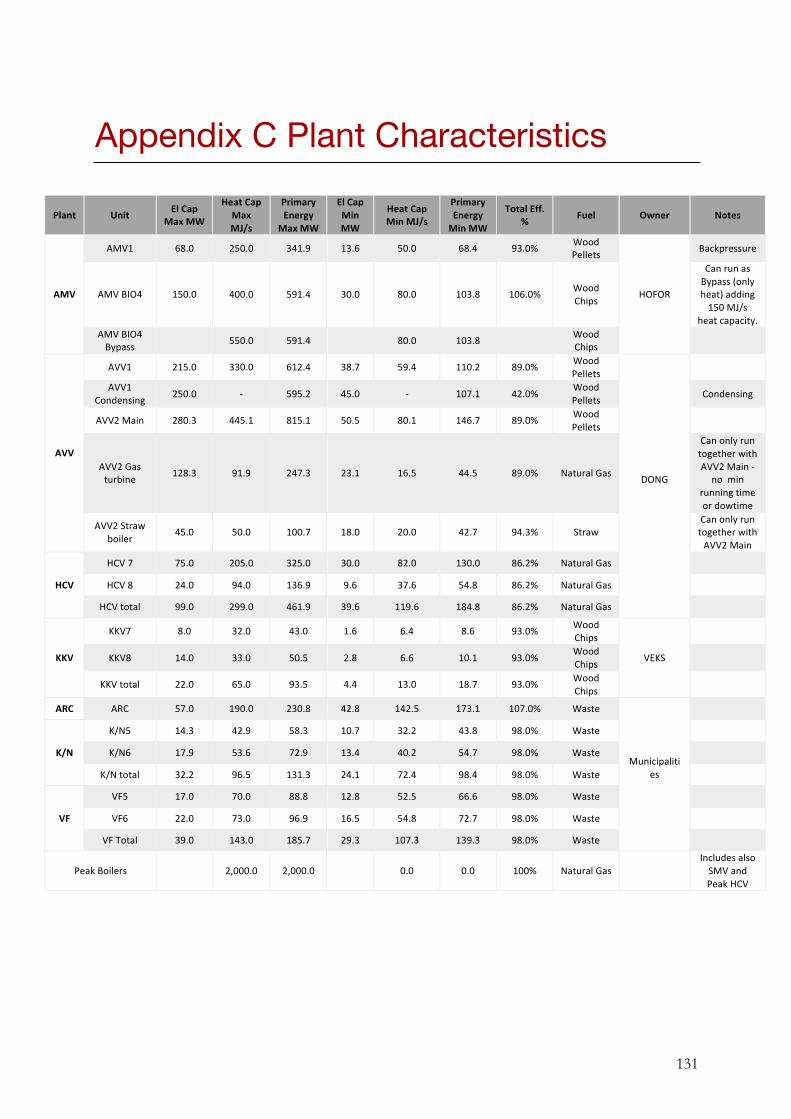
131
Appendix C Plant Characteristics
Plant Unit ElCapMaxMW
HeatCapMaxMJ/s
PrimaryEnergyMaxMW
ElCapMinMW
HeatCapMinMJ/s
PrimaryEnergyMinMW
TotalEff.% Fuel Owner Notes
AMV
AMV1 68.0 250.0 341.9 13.6 50.0 68.4 93.0%Wood
Pellets
HOFOR
Backpressure
AMVBIO4 150.0 400.0 591.4 30.0 80.0 103.8 106.0%Wood
Chips
Canrunas
Bypass(only
heat)adding
150MJ/s
heatcapacity.
AMVBIO4
Bypass 550.0 591.4 80.0 103.8
Wood
Chips
AVV
AVV1 215.0 330.0 612.4 38.7 59.4 110.2 89.0%Wood
Pellets
DONG
AVV1
Condensing250.0 - 595.2 45.0 - 107.1 42.0%
Wood
PelletsCondensing
AVV2Main 280.3 445.1 815.1 50.5 80.1 146.7 89.0%Wood
Pellets
AVV2Gas
turbine128.3 91.9 247.3 23.1 16.5 44.5 89.0% NaturalGas
Canonlyrun
togetherwith
AVV2Main-
nomin
runningtime
ordowtime
AVV2Straw
boiler45.0 50.0 100.7 18.0 20.0 42.7 94.3% Straw
Canonlyrun
togetherwith
AVV2Main
HCV
HCV7 75.0 205.0 325.0 30.0 82.0 130.0 86.2% NaturalGas
HCV8 24.0 94.0 136.9 9.6 37.6 54.8 86.2% NaturalGas
HCVtotal 99.0 299.0 461.9 39.6 119.6 184.8 86.2% NaturalGas
KKV
KKV7 8.0 32.0 43.0 1.6 6.4 8.6 93.0%Wood
Chips
VEKS
KKV8 14.0 33.0 50.5 2.8 6.6 10.1 93.0%Wood
Chips
KKVtotal 22.0 65.0 93.5 4.4 13.0 18.7 93.0%Wood
Chips
ARC ARC 57.0 190.0 230.8 42.8 142.5 173.1 107.0% Waste
Municipaliti
es
K/N
K/N5 14.3 42.9 58.3 10.7 32.2 43.8 98.0% Waste
K/N6 17.9 53.6 72.9 13.4 40.2 54.7 98.0% Waste
K/Ntotal 32.2 96.5 131.3 24.1 72.4 98.4 98.0% Waste
VF
VF5 17.0 70.0 88.8 12.8 52.5 66.6 98.0% Waste
VF6 22.0 73.0 96.9 16.5 54.8 72.7 98.0% Waste
VFTotal 39.0 143.0 185.7 29.3 107.3 139.3 98.0% Waste
PeakBoilers 2,000.0 2,000.0 0.0 0.0 100% NaturalGas
Includesalso
SMVand
PeakHCV

132
Appendix D EnergyPRO Output
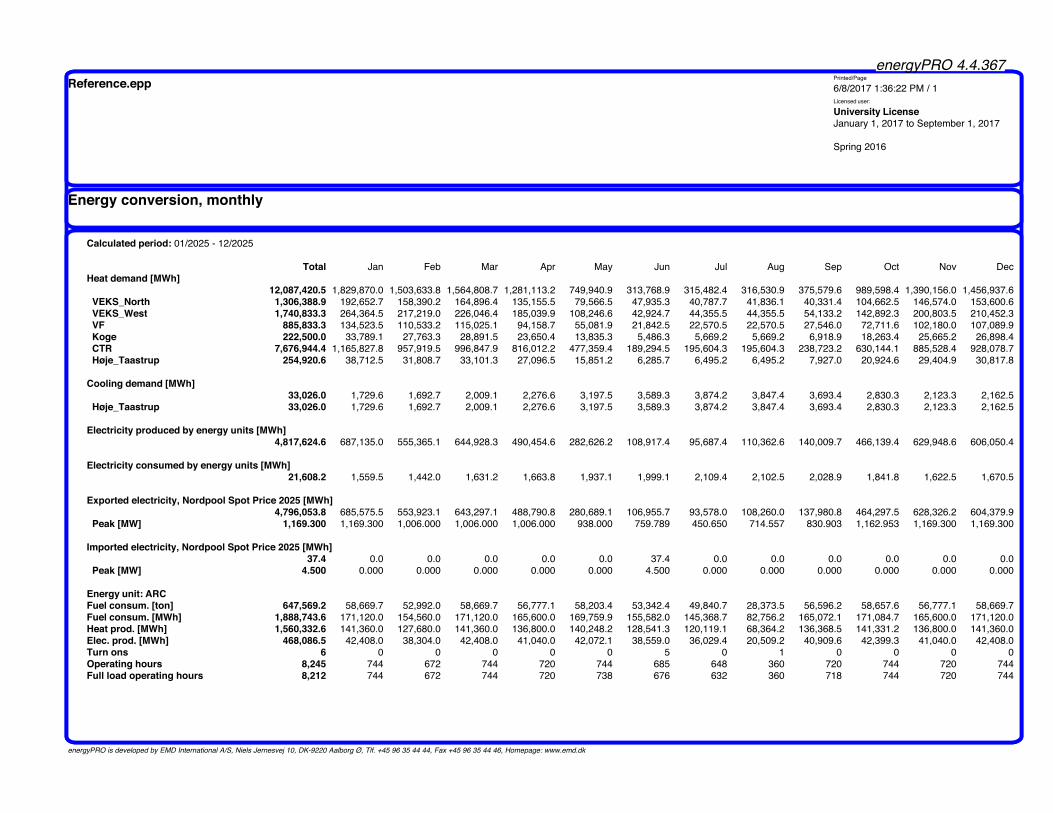
energyPRO 4.4.367
energyPRO is developed by EMD International A/S, Niels Jernesvej 10, DK-9220 Aalborg Ø, Tlf. +45 96 35 44 44, Fax +45 96 35 44 46, Homepage: www.emd.dk
Reference.epp Printed/Page
6/8/2017 1:36:22 PM / 1Licensed user:
University License January 1, 2017 to September 1, 2017 Spring 2016
Energy conversion, monthly
Calculated period: 01/2025 - 12/2025
Total Jan Feb Mar Apr May Jun Jul Aug Sep Oct Nov DecHeat demand [MWh]
12,087,420.5 1,829,870.0 1,503,633.8 1,564,808.7 1,281,113.2 749,940.9 313,768.9 315,482.4 316,530.9 375,579.6 989,598.4 1,390,156.0 1,456,937.6 V E K S _ N o r t h 1,306,388.9 192,652.7 158,390.2 164,896.4 135,155.5 79,566.5 47,935.3 40,787.7 41,836.1 40,331.4 104,662.5 146,574.0 153,600.6 V E K S _ W e s t 1,740,833.3 264,364.5 217,219.0 226,046.4 185,039.9 108,246.6 42,924.7 44,355.5 44,355.5 54,133.2 142,892.3 200,803.5 210,452.3 V F 885,833.3 134,523.5 110,533.2 115,025.1 94,158.7 55,081.9 21,842.5 22,570.5 22,570.5 27,546.0 72,711.6 102,180.0 107,089.9 K o g e 222,500.0 33,789.1 27,763.3 28,891.5 23,650.4 13,835.3 5,486.3 5,669.2 5,669.2 6,918.9 18,263.4 25,665.2 26,898.4 C T R 7,676,944.4 1,165,827.8 957,919.5 996,847.9 816,012.2 477,359.4 189,294.5 195,604.3 195,604.3 238,723.2 630,144.1 885,528.4 928,078.7 H ø j e _ T a a s t r u p 254,920.6 38,712.5 31,808.7 33,101.3 27,096.5 15,851.2 6,285.7 6,495.2 6,495.2 7,927.0 20,924.6 29,404.9 30,817.8
Cooling demand [MWh]33,026.0 1,729.6 1,692.7 2,009.1 2,276.6 3,197.5 3,589.3 3,874.2 3,847.4 3,693.4 2,830.3 2,123.3 2,162.5
H ø j e _ T a a s t r u p 33,026.0 1,729.6 1,692.7 2,009.1 2,276.6 3,197.5 3,589.3 3,874.2 3,847.4 3,693.4 2,830.3 2,123.3 2,162.5
Electricity produced by energy units [MWh]4,817,624.6 687,135.0 555,365.1 644,928.3 490,454.6 282,626.2 108,917.4 95,687.4 110,362.6 140,009.7 466,139.4 629,948.6 606,050.4
Electricity consumed by energy units [MWh]21,608.2 1,559.5 1,442.0 1,631.2 1,663.8 1,937.1 1,999.1 2,109.4 2,102.5 2,028.9 1,841.8 1,622.5 1,670.5
Exported electricity, Nordpool Spot Price 2025 [MWh]4,796,053.8 685,575.5 553,923.1 643,297.1 488,790.8 280,689.1 106,955.7 93,578.0 108,260.0 137,980.8 464,297.5 628,326.2 604,379.9
Peak [MW] 1,169.300 1,169.300 1,006.000 1,006.000 1,006.000 938.000 759.789 450.650 714.557 830.903 1,162.953 1,169.300 1,169.300
Imported electricity, Nordpool Spot Price 2025 [MWh]37.4 0.0 0.0 0.0 0.0 0.0 37.4 0.0 0.0 0.0 0.0 0.0 0.0
Peak [MW] 4.500 0.000 0.000 0.000 0.000 0.000 4.500 0.000 0.000 0.000 0.000 0.000 0.000
Energy unit: ARCFuel consum. [ton] 647,569.2 58,669.7 52,992.0 58,669.7 56,777.1 58,203.4 53,342.4 49,840.7 28,373.5 56,596.2 58,657.6 56,777.1 58,669.7Fuel consum. [MWh] 1,888,743.6 171,120.0 154,560.0 171,120.0 165,600.0 169,759.9 155,582.0 145,368.7 82,756.2 165,072.1 171,084.7 165,600.0 171,120.0Heat prod. [MWh] 1,560,332.6 141,360.0 127,680.0 141,360.0 136,800.0 140,248.2 128,541.3 120,119.1 68,364.2 136,368.5 141,331.2 136,800.0 141,360.0Elec. prod. [MWh] 468,086.5 42,408.0 38,304.0 42,408.0 41,040.0 42,072.1 38,559.0 36,029.4 20,509.2 40,909.6 42,399.3 41,040.0 42,408.0Turn ons 6 0 0 0 0 0 5 0 1 0 0 0 0Operating hours 8,245 744 672 744 720 744 685 648 360 720 744 720 744Full load operating hours 8,212 744 672 744 720 738 676 632 360 718 744 720 744

energyPRO 4.4.367
energyPRO is developed by EMD International A/S, Niels Jernesvej 10, DK-9220 Aalborg Ø, Tlf. +45 96 35 44 44, Fax +45 96 35 44 46, Homepage: www.emd.dk
Reference.epp Printed/Page
6/8/2017 1:36:22 PM / 2Licensed user:
University License January 1, 2017 to September 1, 2017 Spring 2016
Energy conversion, monthly
Energy unit: VF_WasteFuel consum. [ton] 520,172.7 47,369.4 42,785.3 47,369.4 45,841.4 47,053.9 41,945.0 44,816.5 47,250.4 15,161.2 47,369.4 45,841.4 47,369.4Fuel consum. [MWh] 1,517,170.6 138,160.8 124,790.4 138,160.8 133,704.0 137,240.7 122,339.5 130,714.9 137,813.6 44,220.3 138,160.8 133,704.0 138,160.8Heat prod. [MWh] 1,168,462.6 106,392.0 96,096.0 106,392.0 102,960.0 105,692.8 94,267.7 100,734.1 106,128.2 34,055.8 106,392.0 102,960.0 106,392.0Elec. prod. [MWh] 318,482.3 29,016.0 26,208.0 29,016.0 28,080.0 28,813.6 25,635.5 27,378.0 28,939.6 9,283.5 29,016.0 28,080.0 29,016.0Turn ons 7 0 0 0 0 0 6 0 0 1 0 0 0Operating hours 8,250 744 672 744 720 744 690 744 744 240 744 720 744Full load operating hours 8,166 744 672 744 720 739 657 702 742 238 744 720 744
Energy unit: KN_WasteFuel consum. [ton] 372,303.3 33,492.8 30,251.5 33,492.8 32,412.3 33,492.8 31,973.7 33,492.8 18,367.0 25,929.9 33,492.8 32,412.3 33,492.8Fuel consum. [MWh] 1,085,884.5 97,687.2 88,233.6 97,687.2 94,536.0 97,687.2 93,256.5 97,687.2 53,570.4 75,628.8 97,687.2 94,536.0 97,687.2Heat prod. [MWh] 798,079.6 71,796.0 64,848.0 71,796.0 69,480.0 71,796.0 68,539.6 71,796.0 39,372.0 55,584.0 71,796.0 69,480.0 71,796.0Elec. prod. [MWh] 266,302.2 23,956.8 21,638.4 23,956.8 23,184.0 23,956.8 22,870.2 23,956.8 13,137.6 18,547.2 23,956.8 23,184.0 23,956.8Turn ons 3 0 0 0 0 0 2 0 0 1 0 0 0Operating hours 8,271 744 672 744 720 744 711 744 408 576 744 720 744Full load operating hours 8,270 744 672 744 720 744 710 744 408 576 744 720 744
Energy unit: AMV1_CHPFuel consum. [ton] 324,231.1 57,054.8 51,437.6 56,888.5 55,262.3 8,151.5 0.0 0.0 0.0 38.1 5,621.6 42,719.6 47,057.1Fuel consum. [MWh] 1,576,123.5 277,350.0 250,044.0 276,541.2 268,636.2 39,625.2 0.0 0.0 0.0 185.2 27,327.4 207,664.5 228,749.8Heat prod. [MWh] 1,056,412.5 185,796.9 167,500.0 185,250.0 179,955.7 26,641.6 0.0 0.0 0.0 133.3 18,520.3 139,323.5 153,291.2Elec. prod. [MWh] 287,344.2 50,536.8 45,560.0 50,388.0 48,947.9 7,246.5 0.0 0.0 0.0 36.3 5,037.5 37,896.0 41,695.2Turn ons 80 0 1 1 0 11 0 0 0 1 28 23 15Operating hours 4,320 744 670 741 720 122 0 0 0 2 108 591 622Full load operating hours 4,226 743 670 741 720 107 0 0 0 1 74 557 613
Energy unit: AMV BIO4Fuel consum. [ton] 1,101,853.7 116,694.0 80,616.9 150,321.5 154,775.5 90,508.5 892.1 5,177.2 23,187.4 26,541.9 153,065.3 156,878.4 143,195.1Fuel consum. [MWh] 3,076,008.4 325,770.8 225,055.4 419,647.5 432,081.5 252,669.5 2,490.3 14,452.9 64,731.5 74,096.2 427,307.4 437,952.1 399,753.1Heat prod. [MWh] 1,980,737.3 209,600.0 144,800.0 270,000.0 278,000.0 162,787.3 1,631.5 9,462.5 42,388.7 48,042.4 275,042.3 281,782.6 257,200.0Elec. prod. [MWh] 742,776.5 78,600.0 54,300.0 101,250.0 104,250.0 61,045.2 611.8 3,548.4 15,895.8 18,015.9 103,140.9 105,668.5 96,450.0Turn ons 200 10 22 7 5 27 3 10 42 50 12 4 8Operating hours 5,116 524 362 675 695 429 7 40 180 157 699 705 643Full load operating hours 4,952 524 362 675 695 407 4 24 106 120 688 704 643

energyPRO 4.4.367
energyPRO is developed by EMD International A/S, Niels Jernesvej 10, DK-9220 Aalborg Ø, Tlf. +45 96 35 44 44, Fax +45 96 35 44 46, Homepage: www.emd.dk
Reference.epp Printed/Page
6/8/2017 1:36:22 PM / 3Licensed user:
University License January 1, 2017 to September 1, 2017 Spring 2016
Energy conversion, monthly
Energy unit: AVV_2_mainFuel consum. [ton] 645,597.9 113,535.4 93,468.0 113,163.8 50,198.0 10,689.3 4,544.1 0.0 1,162.2 6,639.5 58,704.6 99,433.3 94,059.9Fuel consum. [MWh] 3,138,323.4 551,908.2 454,358.4 550,101.6 244,017.9 51,962.0 22,089.3 0.0 5,649.6 32,275.3 285,369.5 483,356.1 457,235.4Heat prod. [MWh] 1,713,266.5 301,349.4 248,048.9 300,303.9 133,247.1 28,323.9 12,050.4 0.0 3,074.8 17,593.4 155,752.7 263,896.9 249,625.1Elec. prod. [MWh] 1,078,939.3 189,774.6 156,210.0 189,118.3 83,911.9 17,838.6 7,589.1 0.0 1,936.7 11,080.5 98,087.4 166,189.7 157,202.4Turn ons 173 11 17 6 3 20 6 0 4 20 46 20 20Operating hours 4,084 692 588 719 301 89 33 0 12 55 389 617 589Full load operating hours 3,849 677 557 675 299 64 27 0 7 40 350 593 561
Energy unit: AMV BIO4_bypassFuel consum. [ton] 176,340.7 48,993.7 69,036.5 15,366.2 5,567.5 10,430.3 0.0 0.0 0.0 0.0 1,558.9 2,895.1 22,492.5Fuel consum. [MWh] 492,284.3 136,774.0 192,727.0 42,897.3 15,542.5 29,117.8 0.0 0.0 0.0 0.0 4,351.9 8,082.1 62,791.7Heat prod. [MWh] 435,509.7 121,000.0 170,500.0 37,950.0 13,750.0 25,759.7 0.0 0.0 0.0 0.0 3,850.0 7,150.0 55,550.0Turn ons 66 11 21 7 5 10 0 0 0 0 1 3 8Operating hours 794 220 310 69 25 49 0 0 0 0 7 13 101Full load operating hours 792 220 310 69 25 47 0 0 0 0 7 13 101
Energy unit: AVV_1Fuel consum. [ton] 539,191.2 73,795.1 76,340.4 65,361.7 51,526.0 47,667.3 641.8 2,106.6 12,680.2 16,812.5 53,120.4 69,422.6 69,716.7Fuel consum. [MWh] 2,621,068.4 358,726.1 371,099.1 317,730.4 250,473.6 231,716.2 3,119.6 10,240.3 61,639.9 81,727.3 258,224.2 337,471.0 338,900.8Heat prod. [MWh] 1,491,809.8 204,173.2 211,215.4 180,840.0 142,560.0 131,883.4 1,775.5 5,828.4 35,082.7 46,515.9 146,970.8 192,075.5 192,889.1Elec. prod. [MWh] 971,936.7 133,021.9 137,610.0 117,820.0 92,880.0 85,924.0 1,156.8 3,797.3 22,856.9 30,305.8 95,753.7 125,140.1 125,670.2Turn ons 267 17 6 2 1 42 3 5 39 45 53 27 27Operating hours 4,608 619 641 548 432 425 7 18 123 148 466 587 594Full load operating hours 4,521 619 640 548 432 400 5 18 106 141 445 582 585
Energy unit: AVV1_CondensingFuel consum. [ton] 63,435.2 12,736.0 0.0 0.0 0.0 0.0 5,878.2 0.0 857.2 3,184.0 17,267.1 13,593.2 9,919.4Fuel consum. [MWh] 308,365.4 61,911.2 0.0 0.0 0.0 0.0 28,574.4 0.0 4,167.1 15,477.8 83,937.3 66,078.3 48,219.3Heat prod. [MWh] 51.8 10.4 0.0 0.0 0.0 0.0 4.8 0.0 0.7 2.6 14.1 11.1 8.1Elec. prod. [MWh] 129,500.0 26,000.0 0.0 0.0 0.0 0.0 12,000.0 0.0 1,750.0 6,500.0 35,250.0 27,750.0 20,250.0Turn ons 97 11 0 0 0 0 8 0 2 9 29 20 18Operating hours 518 104 0 0 0 0 48 0 7 26 141 111 81Full load operating hours 518 104 0 0 0 0 48 0 7 26 141 111 81

energyPRO 4.4.367
energyPRO is developed by EMD International A/S, Niels Jernesvej 10, DK-9220 Aalborg Ø, Tlf. +45 96 35 44 44, Fax +45 96 35 44 46, Homepage: www.emd.dk
Reference.epp Printed/Page
6/8/2017 1:36:22 PM / 4Licensed user:
University License January 1, 2017 to September 1, 2017 Spring 2016
Energy conversion, monthly
Energy unit: HCV_CHPFuel consum. [1000Nm3] 96,256.1 23,248.8 15,884.2 19,560.2 16,758.9 932.7 0.0 0.0 0.0 0.0 49.8 10,344.6 9,477.0Fuel consum. [MWh] 1,056,945.8 255,284.6 174,416.9 214,781.7 184,022.3 10,241.3 0.0 0.0 0.0 0.0 547.1 113,589.4 104,062.5Heat prod. [MWh] 685,430.7 165,354.5 113,156.5 139,357.2 119,193.9 6,686.9 0.0 0.0 0.0 0.0 358.5 73,715.4 67,607.8Elec. prod. [MWh] 225,284.4 54,612.7 37,129.0 45,708.4 39,369.8 2,137.0 0.0 0.0 0.0 0.0 112.8 24,158.2 22,056.4Turn ons 146 12 26 28 28 14 0 0 0 0 1 13 24Operating hours 2,803 595 482 599 428 46 0 0 0 0 3 323 327Full load operating hours 2,276 552 375 462 398 22 0 0 0 0 1 244 223
Energy unit: AVV_2_Gas_TFuel consum. [1000Nm3] 6,354.4 2,343.2 0.0 0.0 0.0 0.0 0.0 0.0 0.0 0.0 740.2 1,801.8 1,469.3Fuel consum. [MWh] 69,774.8 25,729.6 0.0 0.0 0.0 0.0 0.0 0.0 0.0 0.0 8,127.4 19,784.3 16,133.4Heat prod. [MWh] 25,918.6 9,557.6 0.0 0.0 0.0 0.0 0.0 0.0 0.0 0.0 3,018.9 7,349.2 5,992.9Elec. prod. [MWh] 36,184.9 13,343.2 0.0 0.0 0.0 0.0 0.0 0.0 0.0 0.0 4,214.9 10,260.0 8,366.7Turn ons 54 11 0 0 0 0 0 0 0 0 11 17 15Operating hours 287 104 0 0 0 0 0 0 0 0 36 80 67Full load operating hours 282 104 0 0 0 0 0 0 0 0 33 80 65
Energy unit: AVV_2_Straw_boilerFuel consum. [ton] 88,256.3 16,388.2 13,123.9 16,053.7 7,211.5 825.4 275.0 0.0 0.0 363.8 7,570.3 13,758.9 12,685.5Fuel consum. [MWh] 355,476.6 66,007.9 52,860.2 64,660.7 29,046.2 3,324.4 1,107.7 0.0 0.0 1,465.4 30,491.6 55,417.9 51,094.5Heat prod. [MWh] 176,502.5 32,774.5 26,246.3 32,105.6 14,422.1 1,650.6 550.0 0.0 0.0 727.6 15,139.8 27,516.3 25,369.6Elec. prod. [MWh] 158,852.3 29,497.0 23,621.7 28,895.0 12,979.9 1,485.6 495.0 0.0 0.0 654.8 13,625.8 24,764.7 22,832.7Turn ons 189 13 29 26 7 8 2 0 0 6 45 23 30Operating hours 3,545 657 531 644 289 34 11 0 0 15 304 552 508Full load operating hours 3,530 655 525 642 288 33 11 0 0 15 303 550 507
Energy unit: KKV_CHPFuel consum. [ton] 204,085.8 24,918.4 22,507.0 24,918.0 24,071.3 18,472.0 0.0 1,501.0 8,191.0 7,168.4 23,677.1 24,080.9 24,580.6Fuel consum. [MWh] 569,739.5 69,564.0 62,832.0 69,562.6 67,199.1 51,567.6 0.0 4,190.4 22,866.5 20,011.8 66,098.6 67,225.9 68,620.9Heat prod. [MWh] 396,196.0 48,360.0 43,680.0 48,359.0 46,716.5 35,875.8 0.0 2,921.6 15,939.9 13,944.4 45,959.3 46,735.1 47,704.4Elec. prod. [MWh] 133,935.3 16,368.0 14,784.0 16,367.7 15,810.9 12,106.8 0.0 977.5 5,336.8 4,676.0 15,544.2 15,817.4 16,146.1Turn ons 113 0 0 0 0 13 0 6 44 42 5 0 3Operating hours 6,353 744 672 744 720 609 0 63 338 284 725 720 734Full load operating hours 6,088 744 672 744 719 550 0 44 243 213 707 719 734

energyPRO 4.4.367
energyPRO is developed by EMD International A/S, Niels Jernesvej 10, DK-9220 Aalborg Ø, Tlf. +45 96 35 44 44, Fax +45 96 35 44 46, Homepage: www.emd.dk
Reference.epp Printed/Page
6/8/2017 1:36:22 PM / 5Licensed user:
University License January 1, 2017 to September 1, 2017 Spring 2016
Energy conversion, monthly
Energy unit: Geothermal_Elec HeatpumpHeat prod. [MWh] 27,594.0 2,343.6 2,116.8 2,343.6 2,268.0 2,343.6 2,268.0 2,343.6 2,343.6 2,268.0 2,343.6 2,268.0 2,343.6Elec. consum. [MWh] 13,140.0 1,116.0 1,008.0 1,116.0 1,080.0 1,116.0 1,080.0 1,116.0 1,116.0 1,080.0 1,116.0 1,080.0 1,116.0Turn ons 0 0 0 0 0 0 0 0 0 0 0 0 0Operating hours 8,760 744 672 744 720 744 720 744 744 720 744 720 744Full load operating hours 8,760 744 672 744 720 744 720 744 744 720 744 720 744
Energy unit: Gas boilerFuel consum. [1000Nm3] 49,167.0 21,047.4 7,737.5 4,376.9 3,607.3 341.7 80.1 0.0 0.2 1,676.9 48.9 3,349.8 6,900.2Fuel consum. [MWh] 539,881.0 231,112.0 84,961.8 48,061.2 39,610.3 3,751.7 879.8 0.0 2.3 18,413.3 537.2 36,783.0 75,768.3Heat prod. [MWh] 539,881.0 231,112.0 84,961.8 48,061.2 39,610.3 3,751.7 879.8 0.0 2.3 18,413.3 537.2 36,783.0 75,768.3Turn ons 152 5 10 23 22 20 6 0 1 1 11 21 32Operating hours 3,345 643 582 573 220 37 29 0 1 480 17 340 423Full load operating hours 270 116 42 24 20 2 0 0 0 9 0 18 38
Energy unit: HT_HeatPump_coldElec. consum. [MWh] 8,468.2 443.5 434.0 515.2 583.8 821.1 919.1 993.4 986.5 948.9 725.8 542.5 554.5Cooling prod. [MWh] 33,026.0 1,729.6 1,692.7 2,009.1 2,276.6 3,202.3 3,584.6 3,874.2 3,847.4 3,700.6 2,830.8 2,115.6 2,162.5Turn ons 887 70 70 83 65 69 70 79 77 75 82 73 74Operating hours 4,948 362 305 317 346 442 486 496 512 461 415 388 418Full load operating hours 2,823 148 145 172 195 274 306 331 329 316 242 181 185
Energy unit: HT_HeatPumpHeat prod. [MWh] 35,223.9 1,478.3 1,446.7 1,717.5 2,726.3 3,831.8 4,288.9 4,630.4 4,609.5 4,414.0 2,424.0 1,808.2 1,848.3Turn ons 888 70 70 82 65 70 70 79 77 76 82 73 74Operating hours 4,948 362 305 317 347 442 485 496 513 460 415 388 418Full load operating hours 2,753 148 145 172 195 274 306 331 329 315 173 181 185
Heat rejection: Høje_TaastrupHeat Rejection [MWh] 4,039 0 0 0 0 208 964 1,112 1,039 714 3 0 0Elec. consump [MWh] 0 0 0 0 0 0 0 0 0 0 0 0 0Transmission between Kara_Novoren and VEKS_WestFrom Kara_Novoren [MWh] 798,080 71,796 64,848 71,796 69,480 71,796 68,540 71,796 39,372 55,584 71,796 69,480 71,796Loss [MWh] 0.0 0.0 0.0 0.0 0.0 0.0 0.0 0.0 0.0 0.0 0.0 0.0 0.0
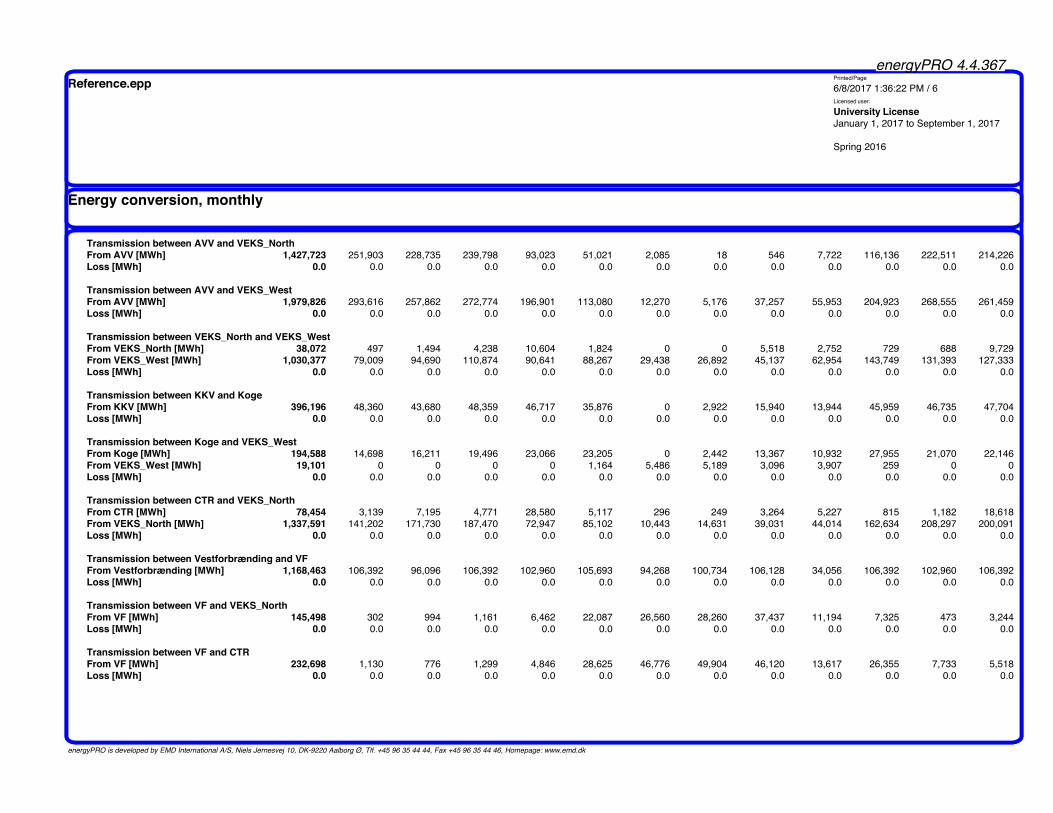
energyPRO 4.4.367
energyPRO is developed by EMD International A/S, Niels Jernesvej 10, DK-9220 Aalborg Ø, Tlf. +45 96 35 44 44, Fax +45 96 35 44 46, Homepage: www.emd.dk
Reference.epp Printed/Page
6/8/2017 1:36:22 PM / 6Licensed user:
University License January 1, 2017 to September 1, 2017 Spring 2016
Energy conversion, monthly
Transmission between AVV and VEKS_NorthFrom AVV [MWh] 1,427,723 251,903 228,735 239,798 93,023 51,021 2,085 18 546 7,722 116,136 222,511 214,226Loss [MWh] 0.0 0.0 0.0 0.0 0.0 0.0 0.0 0.0 0.0 0.0 0.0 0.0 0.0
Transmission between AVV and VEKS_WestFrom AVV [MWh] 1,979,826 293,616 257,862 272,774 196,901 113,080 12,270 5,176 37,257 55,953 204,923 268,555 261,459Loss [MWh] 0.0 0.0 0.0 0.0 0.0 0.0 0.0 0.0 0.0 0.0 0.0 0.0 0.0
Transmission between VEKS_North and VEKS_WestFrom VEKS_North [MWh] 38,072 497 1,494 4,238 10,604 1,824 0 0 5,518 2,752 729 688 9,729From VEKS_West [MWh] 1,030,377 79,009 94,690 110,874 90,641 88,267 29,438 26,892 45,137 62,954 143,749 131,393 127,333Loss [MWh] 0.0 0.0 0.0 0.0 0.0 0.0 0.0 0.0 0.0 0.0 0.0 0.0 0.0
Transmission between KKV and KogeFrom KKV [MWh] 396,196 48,360 43,680 48,359 46,717 35,876 0 2,922 15,940 13,944 45,959 46,735 47,704Loss [MWh] 0.0 0.0 0.0 0.0 0.0 0.0 0.0 0.0 0.0 0.0 0.0 0.0 0.0
Transmission between Koge and VEKS_WestFrom Koge [MWh] 194,588 14,698 16,211 19,496 23,066 23,205 0 2,442 13,367 10,932 27,955 21,070 22,146From VEKS_West [MWh] 19,101 0 0 0 0 1,164 5,486 5,189 3,096 3,907 259 0 0Loss [MWh] 0.0 0.0 0.0 0.0 0.0 0.0 0.0 0.0 0.0 0.0 0.0 0.0 0.0
Transmission between CTR and VEKS_NorthFrom CTR [MWh] 78,454 3,139 7,195 4,771 28,580 5,117 296 249 3,264 5,227 815 1,182 18,618From VEKS_North [MWh] 1,337,591 141,202 171,730 187,470 72,947 85,102 10,443 14,631 39,031 44,014 162,634 208,297 200,091Loss [MWh] 0.0 0.0 0.0 0.0 0.0 0.0 0.0 0.0 0.0 0.0 0.0 0.0 0.0
Transmission between Vestforbrænding and VFFrom Vestforbrænding [MWh] 1,168,463 106,392 96,096 106,392 102,960 105,693 94,268 100,734 106,128 34,056 106,392 102,960 106,392Loss [MWh] 0.0 0.0 0.0 0.0 0.0 0.0 0.0 0.0 0.0 0.0 0.0 0.0 0.0
Transmission between VF and VEKS_NorthFrom VF [MWh] 145,498 302 994 1,161 6,462 22,087 26,560 28,260 37,437 11,194 7,325 473 3,244Loss [MWh] 0.0 0.0 0.0 0.0 0.0 0.0 0.0 0.0 0.0 0.0 0.0 0.0 0.0
Transmission between VF and CTRFrom VF [MWh] 232,698 1,130 776 1,299 4,846 28,625 46,776 49,904 46,120 13,617 26,355 7,733 5,518Loss [MWh] 0.0 0.0 0.0 0.0 0.0 0.0 0.0 0.0 0.0 0.0 0.0 0.0 0.0

energyPRO 4.4.367
energyPRO is developed by EMD International A/S, Niels Jernesvej 10, DK-9220 Aalborg Ø, Tlf. +45 96 35 44 44, Fax +45 96 35 44 46, Homepage: www.emd.dk
Reference.epp Printed/Page
6/8/2017 1:36:22 PM / 7Licensed user:
University License January 1, 2017 to September 1, 2017 Spring 2016
Energy conversion, monthly
Transmission between AMV and CTRFrom AMV [MWh] 3,500,254 518,499 485,159 495,183 473,702 218,164 3,830 11,200 45,351 49,838 299,743 430,808 468,777Loss [MWh] 0.0 0.0 0.0 0.0 0.0 0.0 0.0 0.0 0.0 0.0 0.0 0.0 0.0
Transmission between HCV and CTRFrom HCV [MWh] 685,431 165,354 113,157 139,357 119,194 6,687 0 0 0 0 359 73,715 67,608Loss [MWh] 0.0 0.0 0.0 0.0 0.0 0.0 0.0 0.0 0.0 0.0 0.0 0.0 0.0
Transmission between ARC_Waste and CTRFrom ARC_Waste [MWh] 1,560,333 141,360 127,680 141,360 136,800 140,248 128,541 120,119 68,364 136,369 141,331 136,800 141,360Loss [MWh] 0.0 0.0 0.0 0.0 0.0 0.0 0.0 0.0 0.0 0.0 0.0 0.0 0.0
Transmission between Peak Production and VEKS_NorthFrom Peak Production [MWh] 0 0 0 0 0 0 0 0 0 0 0 0 0Loss [MWh] 0.0 0.0 0.0 0.0 0.0 0.0 0.0 0.0 0.0 0.0 0.0 0.0 0.0
Transmission between CTR and Peak ProductionFrom Peak Production [MWh] 439,092 201,421 66,613 36,950 37,104 3,650 0 0 2 113 537 29,357 63,344Loss [MWh] 0.0 0.0 0.0 0.0 0.0 0.0 0.0 0.0 0.0 0.0 0.0 0.0 0.0
Transmission between VF and Peak ProductionFrom Peak Production [MWh] 95,517 29,564 16,198 11,082 2,506 102 880 0 0 18,300 0 7,426 9,460Loss [MWh] 0.0 0.0 0.0 0.0 0.0 0.0 0.0 0.0 0.0 0.0 0.0 0.0 0.0
Transmission between VEKS_West and Peak ProductionFrom Peak Production [MWh] 3,481 0 1,856 0 0 0 0 0 0 0 0 0 1,625Loss [MWh] 0.0 0.0 0.0 0.0 0.0 0.0 0.0 0.0 0.0 0.0 0.0 0.0 0.0
Transmission between Peak Production and KogeFrom Peak Production [MWh] 1,791 128 295 29 0 0 0 0 0 0 0 0 1,340Loss [MWh] 0.0 0.0 0.0 0.0 0.0 0.0 0.0 0.0 0.0 0.0 0.0 0.0 0.0
Transmission between VEKS_West and Høje_TaastrupFrom VEKS_West [MWh] 223,736 37,234 30,362 31,384 24,370 12,227 2,961 2,977 2,925 4,227 18,503 27,597 28,969Loss [MWh] 0.0 0.0 0.0 0.0 0.0 0.0 0.0 0.0 0.0 0.0 0.0 0.0 0.0
Transmission between AMV and AMV TESFrom AMV [MWh] 151,666 2,934 4,527 5,824 11,752 21,510 2,866 6,561 22,171 25,050 24,077 13,712 10,682
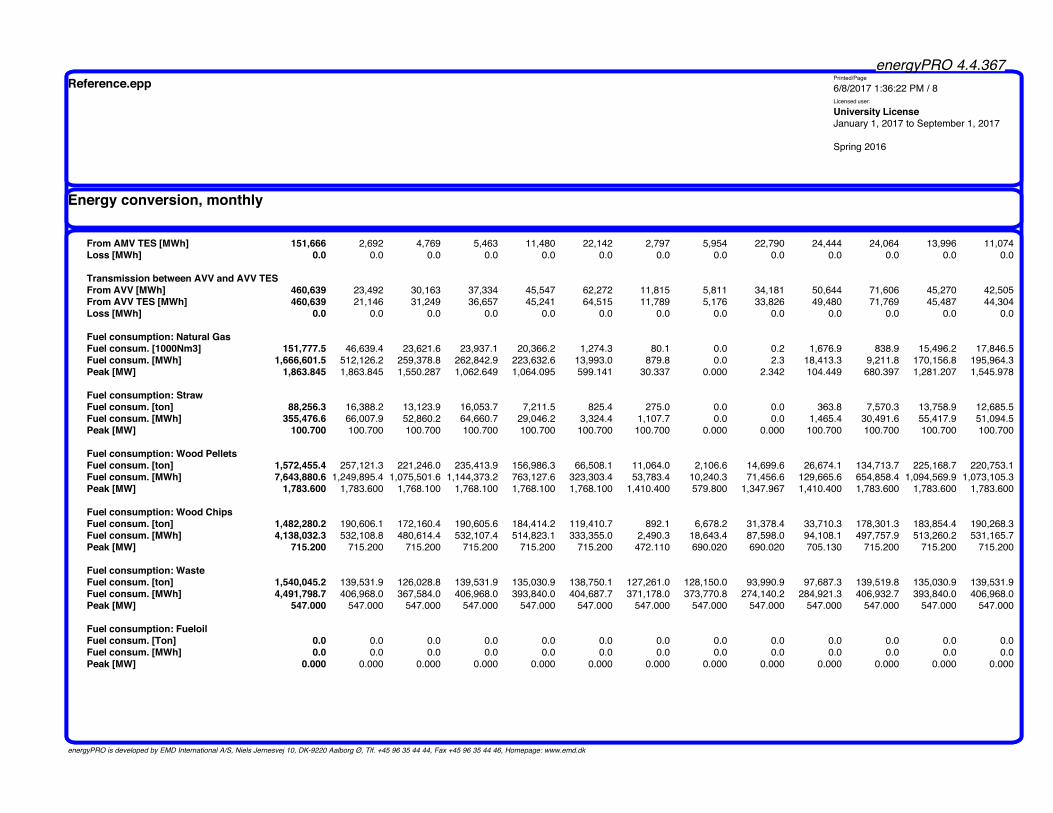
energyPRO 4.4.367
energyPRO is developed by EMD International A/S, Niels Jernesvej 10, DK-9220 Aalborg Ø, Tlf. +45 96 35 44 44, Fax +45 96 35 44 46, Homepage: www.emd.dk
Reference.epp Printed/Page
6/8/2017 1:36:22 PM / 8Licensed user:
University License January 1, 2017 to September 1, 2017 Spring 2016
Energy conversion, monthly
From AMV TES [MWh] 151,666 2,692 4,769 5,463 11,480 22,142 2,797 5,954 22,790 24,444 24,064 13,996 11,074Loss [MWh] 0.0 0.0 0.0 0.0 0.0 0.0 0.0 0.0 0.0 0.0 0.0 0.0 0.0
Transmission between AVV and AVV TESFrom AVV [MWh] 460,639 23,492 30,163 37,334 45,547 62,272 11,815 5,811 34,181 50,644 71,606 45,270 42,505From AVV TES [MWh] 460,639 21,146 31,249 36,657 45,241 64,515 11,789 5,176 33,826 49,480 71,769 45,487 44,304Loss [MWh] 0.0 0.0 0.0 0.0 0.0 0.0 0.0 0.0 0.0 0.0 0.0 0.0 0.0
Fuel consumption: Natural GasFuel consum. [1000Nm3] 151,777.5 46,639.4 23,621.6 23,937.1 20,366.2 1,274.3 80.1 0.0 0.2 1,676.9 838.9 15,496.2 17,846.5Fuel consum. [MWh] 1,666,601.5 512,126.2 259,378.8 262,842.9 223,632.6 13,993.0 879.8 0.0 2.3 18,413.3 9,211.8 170,156.8 195,964.3Peak [MW] 1,863.845 1,863.845 1,550.287 1,062.649 1,064.095 599.141 30.337 0.000 2.342 104.449 680.397 1,281.207 1,545.978
Fuel consumption: StrawFuel consum. [ton] 88,256.3 16,388.2 13,123.9 16,053.7 7,211.5 825.4 275.0 0.0 0.0 363.8 7,570.3 13,758.9 12,685.5Fuel consum. [MWh] 355,476.6 66,007.9 52,860.2 64,660.7 29,046.2 3,324.4 1,107.7 0.0 0.0 1,465.4 30,491.6 55,417.9 51,094.5Peak [MW] 100.700 100.700 100.700 100.700 100.700 100.700 100.700 0.000 0.000 100.700 100.700 100.700 100.700
Fuel consumption: Wood PelletsFuel consum. [ton] 1,572,455.4 257,121.3 221,246.0 235,413.9 156,986.3 66,508.1 11,064.0 2,106.6 14,699.6 26,674.1 134,713.7 225,168.7 220,753.1Fuel consum. [MWh] 7,643,880.6 1,249,895.4 1,075,501.6 1,144,373.2 763,127.6 323,303.4 53,783.4 10,240.3 71,456.6 129,665.6 654,858.4 1,094,569.9 1,073,105.3Peak [MW] 1,783.600 1,783.600 1,768.100 1,768.100 1,768.100 1,768.100 1,410.400 579.800 1,347.967 1,410.400 1,783.600 1,783.600 1,783.600
Fuel consumption: Wood ChipsFuel consum. [ton] 1,482,280.2 190,606.1 172,160.4 190,605.6 184,414.2 119,410.7 892.1 6,678.2 31,378.4 33,710.3 178,301.3 183,854.4 190,268.3Fuel consum. [MWh] 4,138,032.3 532,108.8 480,614.4 532,107.4 514,823.1 333,355.0 2,490.3 18,643.4 87,598.0 94,108.1 497,757.9 513,260.2 531,165.7Peak [MW] 715.200 715.200 715.200 715.200 715.200 715.200 472.110 690.020 690.020 705.130 715.200 715.200 715.200
Fuel consumption: WasteFuel consum. [ton] 1,540,045.2 139,531.9 126,028.8 139,531.9 135,030.9 138,750.1 127,261.0 128,150.0 93,990.9 97,687.3 139,519.8 135,030.9 139,531.9Fuel consum. [MWh] 4,491,798.7 406,968.0 367,584.0 406,968.0 393,840.0 404,687.7 371,178.0 373,770.8 274,140.2 284,921.3 406,932.7 393,840.0 406,968.0Peak [MW] 547.000 547.000 547.000 547.000 547.000 547.000 547.000 547.000 547.000 547.000 547.000 547.000 547.000
Fuel consumption: FueloilFuel consum. [Ton] 0.0 0.0 0.0 0.0 0.0 0.0 0.0 0.0 0.0 0.0 0.0 0.0 0.0Fuel consum. [MWh] 0.0 0.0 0.0 0.0 0.0 0.0 0.0 0.0 0.0 0.0 0.0 0.0 0.0Peak [MW] 0.000 0.000 0.000 0.000 0.000 0.000 0.000 0.000 0.000 0.000 0.000 0.000 0.000

energyPRO 4.4.367
energyPRO is developed by EMD International A/S, Niels Jernesvej 10, DK-9220 Aalborg Ø, Tlf. +45 96 35 44 44, Fax +45 96 35 44 46, Homepage: www.emd.dk
ALT1.epp Printed/Page
6/8/2017 1:37:44 PM / 1Licensed user:
University License January 1, 2017 to September 1, 2017 Spring 2016
Energy conversion, monthly
Calculated period: 01/2025 - 12/2025
Total Jan Feb Mar Apr May Jun Jul Aug Sep Oct Nov DecHeat demand [MWh]
12,087,420.5 1,829,870.0 1,503,633.8 1,564,808.7 1,281,113.2 749,940.9 313,768.9 315,482.4 316,530.9 375,579.6 989,598.4 1,390,156.0 1,456,937.6 V E K S _ N o r t h 1,306,388.9 192,652.7 158,390.2 164,896.4 135,155.5 79,566.5 47,935.3 40,787.7 41,836.1 40,331.4 104,662.5 146,574.0 153,600.6 V E K S _ W e s t 1,740,833.3 264,364.5 217,219.0 226,046.4 185,039.9 108,246.6 42,924.7 44,355.5 44,355.5 54,133.2 142,892.3 200,803.5 210,452.3 V F 885,833.3 134,523.5 110,533.2 115,025.1 94,158.7 55,081.9 21,842.5 22,570.5 22,570.5 27,546.0 72,711.6 102,180.0 107,089.9 K o g e 222,500.0 33,789.1 27,763.3 28,891.5 23,650.4 13,835.3 5,486.3 5,669.2 5,669.2 6,918.9 18,263.4 25,665.2 26,898.4 C T R 7,676,944.4 1,165,827.8 957,919.5 996,847.9 816,012.2 477,359.4 189,294.5 195,604.3 195,604.3 238,723.2 630,144.1 885,528.4 928,078.7 H ø j e _ T a a s t r u p 254,920.6 38,712.5 31,808.7 33,101.3 27,096.5 15,851.2 6,285.7 6,495.2 6,495.2 7,927.0 20,924.6 29,404.9 30,817.8
Cooling demand [MWh]33,026.0 1,729.6 1,692.7 2,009.1 2,276.6 3,197.5 3,589.3 3,874.2 3,847.4 3,693.4 2,830.3 2,123.3 2,162.5
H ø j e _ T a a s t r u p 33,026.0 1,729.6 1,692.7 2,009.1 2,276.6 3,197.5 3,589.3 3,874.2 3,847.4 3,693.4 2,830.3 2,123.3 2,162.5
Electricity produced by energy units [MWh]4,831,982.2 688,284.6 559,537.3 645,396.9 490,329.8 280,571.1 110,234.4 96,560.5 112,437.2 142,709.9 465,782.4 632,021.4 608,116.7
Electricity consumed by energy units [MWh]21,608.2 1,559.5 1,442.0 1,631.2 1,663.8 1,937.1 1,999.1 2,109.4 2,102.5 2,028.9 1,841.8 1,622.5 1,670.5
Exported electricity, Nordpool Spot Price 2025 [MWh]4,810,403.3 686,725.1 558,095.3 643,765.7 488,666.1 278,634.0 108,264.6 94,451.1 110,334.7 140,681.1 463,940.5 630,398.9 606,446.2
Peak [MW] 1,169.300 1,169.300 1,006.000 1,006.000 957.184 866.648 768.855 453.019 742.026 830.903 1,094.552 1,169.300 1,169.300
Imported electricity, Nordpool Spot Price 2025 [MWh]29.4 0.0 0.0 0.0 0.0 0.0 29.4 0.0 0.0 0.0 0.0 0.0 0.0
Peak [MW] 4.500 0.000 0.000 0.000 0.000 0.000 4.500 0.000 0.000 0.000 0.000 0.000 0.000
Energy unit: ARCFuel consum. [ton] 646,569.2 58,669.7 52,992.0 58,669.7 56,777.1 58,474.1 52,562.9 49,141.2 28,388.6 56,777.1 58,669.7 56,777.1 58,669.7Fuel consum. [MWh] 1,885,826.8 171,120.0 154,560.0 171,120.0 165,600.0 170,549.5 153,308.6 143,328.6 82,800.0 165,600.0 171,120.0 165,600.0 171,120.0Heat prod. [MWh] 1,557,940.4 141,360.0 127,680.0 141,360.0 136,800.0 140,893.7 126,679.1 118,447.6 68,400.0 136,800.0 141,360.0 136,800.0 141,360.0Elec. prod. [MWh] 467,365.4 42,408.0 38,304.0 42,408.0 41,040.0 42,267.1 37,997.2 35,525.1 20,520.0 41,040.0 42,408.0 41,040.0 42,408.0Turn ons 11 0 0 0 0 0 9 1 1 0 0 0 0Operating hours 8,241 744 672 744 720 744 683 646 360 720 744 720 744Full load operating hours 8,199 744 672 744 720 742 667 623 360 720 744 720 744
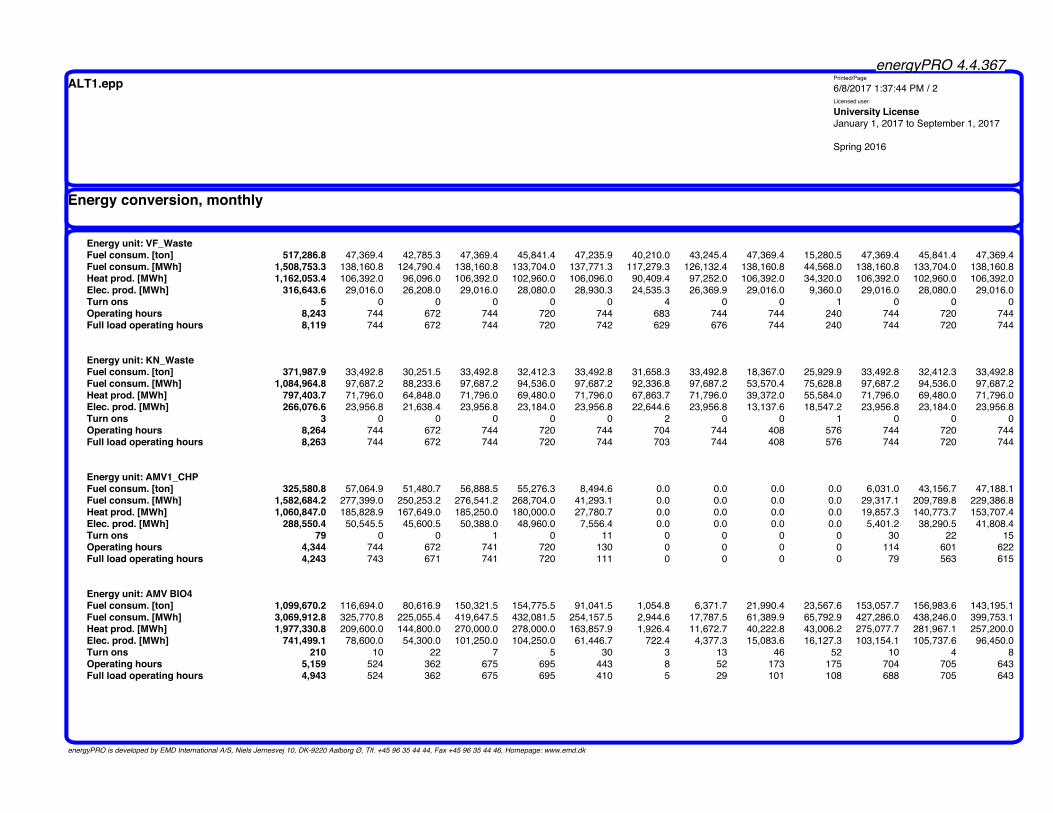
energyPRO 4.4.367
energyPRO is developed by EMD International A/S, Niels Jernesvej 10, DK-9220 Aalborg Ø, Tlf. +45 96 35 44 44, Fax +45 96 35 44 46, Homepage: www.emd.dk
ALT1.epp Printed/Page
6/8/2017 1:37:44 PM / 2Licensed user:
University License January 1, 2017 to September 1, 2017 Spring 2016
Energy conversion, monthly
Energy unit: VF_WasteFuel consum. [ton] 517,286.8 47,369.4 42,785.3 47,369.4 45,841.4 47,235.9 40,210.0 43,245.4 47,369.4 15,280.5 47,369.4 45,841.4 47,369.4Fuel consum. [MWh] 1,508,753.3 138,160.8 124,790.4 138,160.8 133,704.0 137,771.3 117,279.3 126,132.4 138,160.8 44,568.0 138,160.8 133,704.0 138,160.8Heat prod. [MWh] 1,162,053.4 106,392.0 96,096.0 106,392.0 102,960.0 106,096.0 90,409.4 97,252.0 106,392.0 34,320.0 106,392.0 102,960.0 106,392.0Elec. prod. [MWh] 316,643.6 29,016.0 26,208.0 29,016.0 28,080.0 28,930.3 24,535.3 26,369.9 29,016.0 9,360.0 29,016.0 28,080.0 29,016.0Turn ons 5 0 0 0 0 0 4 0 0 1 0 0 0Operating hours 8,243 744 672 744 720 744 683 744 744 240 744 720 744Full load operating hours 8,119 744 672 744 720 742 629 676 744 240 744 720 744
Energy unit: KN_WasteFuel consum. [ton] 371,987.9 33,492.8 30,251.5 33,492.8 32,412.3 33,492.8 31,658.3 33,492.8 18,367.0 25,929.9 33,492.8 32,412.3 33,492.8Fuel consum. [MWh] 1,084,964.8 97,687.2 88,233.6 97,687.2 94,536.0 97,687.2 92,336.8 97,687.2 53,570.4 75,628.8 97,687.2 94,536.0 97,687.2Heat prod. [MWh] 797,403.7 71,796.0 64,848.0 71,796.0 69,480.0 71,796.0 67,863.7 71,796.0 39,372.0 55,584.0 71,796.0 69,480.0 71,796.0Elec. prod. [MWh] 266,076.6 23,956.8 21,638.4 23,956.8 23,184.0 23,956.8 22,644.6 23,956.8 13,137.6 18,547.2 23,956.8 23,184.0 23,956.8Turn ons 3 0 0 0 0 0 2 0 0 1 0 0 0Operating hours 8,264 744 672 744 720 744 704 744 408 576 744 720 744Full load operating hours 8,263 744 672 744 720 744 703 744 408 576 744 720 744
Energy unit: AMV1_CHPFuel consum. [ton] 325,580.8 57,064.9 51,480.7 56,888.5 55,276.3 8,494.6 0.0 0.0 0.0 0.0 6,031.0 43,156.7 47,188.1Fuel consum. [MWh] 1,582,684.2 277,399.0 250,253.2 276,541.2 268,704.0 41,293.1 0.0 0.0 0.0 0.0 29,317.1 209,789.8 229,386.8Heat prod. [MWh] 1,060,847.0 185,828.9 167,649.0 185,250.0 180,000.0 27,780.7 0.0 0.0 0.0 0.0 19,857.3 140,773.7 153,707.4Elec. prod. [MWh] 288,550.4 50,545.5 45,600.5 50,388.0 48,960.0 7,556.4 0.0 0.0 0.0 0.0 5,401.2 38,290.5 41,808.4Turn ons 79 0 0 1 0 11 0 0 0 0 30 22 15Operating hours 4,344 744 672 741 720 130 0 0 0 0 114 601 622Full load operating hours 4,243 743 671 741 720 111 0 0 0 0 79 563 615
Energy unit: AMV BIO4Fuel consum. [ton] 1,099,670.2 116,694.0 80,616.9 150,321.5 154,775.5 91,041.5 1,054.8 6,371.7 21,990.4 23,567.6 153,057.7 156,983.6 143,195.1Fuel consum. [MWh] 3,069,912.8 325,770.8 225,055.4 419,647.5 432,081.5 254,157.5 2,944.6 17,787.5 61,389.9 65,792.9 427,286.0 438,246.0 399,753.1Heat prod. [MWh] 1,977,330.8 209,600.0 144,800.0 270,000.0 278,000.0 163,857.9 1,926.4 11,672.7 40,222.8 43,006.2 275,077.7 281,967.1 257,200.0Elec. prod. [MWh] 741,499.1 78,600.0 54,300.0 101,250.0 104,250.0 61,446.7 722.4 4,377.3 15,083.6 16,127.3 103,154.1 105,737.6 96,450.0Turn ons 210 10 22 7 5 30 3 13 46 52 10 4 8Operating hours 5,159 524 362 675 695 443 8 52 173 175 704 705 643Full load operating hours 4,943 524 362 675 695 410 5 29 101 108 688 705 643

energyPRO 4.4.367
energyPRO is developed by EMD International A/S, Niels Jernesvej 10, DK-9220 Aalborg Ø, Tlf. +45 96 35 44 44, Fax +45 96 35 44 46, Homepage: www.emd.dk
ALT1.epp Printed/Page
6/8/2017 1:37:44 PM / 3Licensed user:
University License January 1, 2017 to September 1, 2017 Spring 2016
Energy conversion, monthly
Energy unit: AVV_2_mainFuel consum. [ton] 647,581.6 113,698.3 93,843.1 113,328.3 50,282.7 9,964.0 5,139.4 0.0 1,852.5 8,026.7 58,004.5 99,566.4 93,875.6Fuel consum. [MWh] 3,147,966.1 552,699.9 456,181.9 550,901.6 244,429.8 48,436.2 24,983.2 0.0 9,005.3 39,018.6 281,966.5 484,003.4 456,339.7Heat prod. [MWh] 1,718,535.8 301,785.7 249,049.2 300,746.8 133,473.0 26,401.9 13,623.7 0.0 4,895.4 21,238.0 153,914.2 264,264.1 249,143.8Elec. prod. [MWh] 1,082,257.5 190,049.3 156,839.7 189,397.0 84,054.2 16,628.2 8,580.1 0.0 3,083.6 13,376.9 96,928.9 166,420.5 156,899.0Turn ons 186 11 17 7 3 19 7 0 6 28 46 21 21Operating hours 4,094 691 588 717 301 83 40 0 22 82 375 611 584Full load operating hours 3,861 678 560 676 300 59 31 0 11 48 346 594 560
Energy unit: AMV BIO4_bypassFuel consum. [ton] 176,534.3 48,993.7 69,036.5 15,366.2 5,567.5 10,408.3 0.0 0.0 0.0 0.0 1,774.6 2,895.1 22,492.5Fuel consum. [MWh] 492,825.0 136,774.0 192,727.0 42,897.3 15,542.5 29,056.4 0.0 0.0 0.0 0.0 4,954.1 8,082.1 62,791.7Heat prod. [MWh] 435,988.1 121,000.0 170,500.0 37,950.0 13,750.0 25,705.4 0.0 0.0 0.0 0.0 4,382.7 7,150.0 55,550.0Turn ons 67 11 21 7 5 10 0 0 0 0 2 3 8Operating hours 798 220 310 69 25 51 0 0 0 0 9 13 101Full load operating hours 793 220 310 69 25 47 0 0 0 0 8 13 101
Energy unit: AVV_1Fuel consum. [ton] 544,843.8 73,824.0 76,340.4 65,361.7 51,526.0 46,757.0 1,751.2 3,143.8 15,014.5 19,016.9 53,394.5 69,056.5 69,657.4Fuel consum. [MWh] 2,648,546.4 358,866.9 371,099.1 317,730.4 250,473.6 227,291.1 8,512.8 15,282.2 72,987.1 92,443.2 259,556.5 335,691.2 338,612.3Heat prod. [MWh] 1,507,448.5 204,253.3 211,215.4 180,840.0 142,560.0 129,364.5 4,845.0 8,698.0 41,541.1 52,614.9 147,728.9 191,062.4 192,724.9Elec. prod. [MWh] 982,125.6 133,074.1 137,610.0 117,820.0 92,880.0 84,282.9 3,156.6 5,666.8 27,064.7 34,279.4 96,247.6 124,480.1 125,563.2Turn ons 277 17 6 2 1 41 7 9 41 49 50 27 27Operating hours 4,683 619 641 548 432 427 19 29 141 170 478 585 594Full load operating hours 4,568 619 640 548 432 392 15 26 126 159 448 579 584
Energy unit: AVV1_CondensingFuel consum. [ton] 63,435.2 12,736.0 0.0 0.0 0.0 0.0 5,878.2 0.0 857.2 3,184.0 17,267.1 13,593.2 9,919.4Fuel consum. [MWh] 308,365.4 61,911.2 0.0 0.0 0.0 0.0 28,574.4 0.0 4,167.1 15,477.8 83,937.3 66,078.3 48,219.3Heat prod. [MWh] 51.8 10.4 0.0 0.0 0.0 0.0 4.8 0.0 0.7 2.6 14.1 11.1 8.1Elec. prod. [MWh] 129,500.0 26,000.0 0.0 0.0 0.0 0.0 12,000.0 0.0 1,750.0 6,500.0 35,250.0 27,750.0 20,250.0Turn ons 97 11 0 0 0 0 8 0 2 9 29 20 18Operating hours 518 104 0 0 0 0 48 0 7 26 141 111 81Full load operating hours 518 104 0 0 0 0 48 0 7 26 141 111 81

energyPRO 4.4.367
energyPRO is developed by EMD International A/S, Niels Jernesvej 10, DK-9220 Aalborg Ø, Tlf. +45 96 35 44 44, Fax +45 96 35 44 46, Homepage: www.emd.dk
ALT1.epp Printed/Page
6/8/2017 1:37:44 PM / 4Licensed user:
University License January 1, 2017 to September 1, 2017 Spring 2016
Energy conversion, monthly
Energy unit: HCV_CHPFuel consum. [1000Nm3] 99,844.6 23,612.6 17,363.7 19,623.8 16,544.0 1,092.7 0.0 0.0 0.0 0.0 30.8 11,082.9 10,494.1Fuel consum. [MWh] 1,096,349.1 259,279.6 190,662.6 215,480.2 181,662.7 11,998.5 0.0 0.0 0.0 0.0 337.7 121,696.6 115,231.3Heat prod. [MWh] 711,436.3 167,982.4 123,701.3 139,846.7 117,734.3 7,846.6 0.0 0.0 0.0 0.0 226.5 79,065.8 75,032.6Elec. prod. [MWh] 233,226.7 55,426.7 40,582.2 45,820.4 38,795.7 2,491.3 0.0 0.0 0.0 0.0 64.4 25,792.5 24,253.5Turn ons 141 13 18 21 29 13 0 0 0 0 2 17 28Operating hours 3,095 621 529 616 451 59 0 0 0 0 4 383 432Full load operating hours 2,356 560 410 463 392 25 0 0 0 0 1 261 245
Energy unit: AVV_2_Gas_TFuel consum. [1000Nm3] 6,461.1 2,343.2 0.0 0.0 0.0 0.0 10.2 0.0 0.0 8.3 763.9 1,843.6 1,491.9Fuel consum. [MWh] 70,946.0 25,729.6 0.0 0.0 0.0 0.0 112.1 0.0 0.0 90.9 8,388.2 20,243.6 16,381.5Heat prod. [MWh] 26,353.4 9,557.6 0.0 0.0 0.0 0.0 41.6 0.0 0.0 33.7 3,115.8 7,519.7 6,085.0Elec. prod. [MWh] 36,792.4 13,343.2 0.0 0.0 0.0 0.0 58.2 0.0 0.0 47.2 4,350.2 10,498.3 8,495.4Turn ons 61 11 0 0 0 0 1 0 0 1 11 18 19Operating hours 298 104 0 0 0 0 1 0 0 1 38 84 70Full load operating hours 287 104 0 0 0 0 0 0 0 0 34 82 66
Energy unit: AVV_2_Straw_boilerFuel consum. [ton] 88,512.8 16,388.2 13,151.0 16,097.0 7,375.4 639.1 300.0 0.0 0.0 508.6 7,496.0 13,851.1 12,706.4Fuel consum. [MWh] 356,509.9 66,007.9 52,969.2 64,835.1 29,706.5 2,574.3 1,208.4 0.0 0.0 2,048.6 30,192.2 55,789.0 51,178.7Heat prod. [MWh] 177,015.5 32,774.5 26,300.4 32,192.2 14,750.0 1,278.1 600.0 0.0 0.0 1,017.1 14,991.1 27,700.6 25,411.4Elec. prod. [MWh] 159,313.9 29,497.0 23,670.3 28,973.0 13,275.0 1,150.3 540.0 0.0 0.0 915.4 13,492.0 24,930.5 22,870.3Turn ons 185 13 29 26 5 8 2 0 0 7 43 23 29Operating hours 3,564 657 533 646 295 29 12 0 0 23 302 557 510Full load operating hours 3,540 655 526 644 295 26 12 0 0 20 300 554 508
Energy unit: KKV_CHPFuel consum. [ton] 195,954.3 24,918.4 22,507.0 24,918.0 24,071.3 18,097.4 0.0 1,019.8 4,269.3 3,860.1 23,631.5 24,080.9 24,580.6Fuel consum. [MWh] 547,039.2 69,564.0 62,832.0 69,562.6 67,199.1 50,522.0 0.0 2,846.8 11,918.5 10,776.1 65,971.2 67,225.9 68,620.9Heat prod. [MWh] 380,378.3 48,360.0 43,680.0 48,359.0 46,716.5 35,148.6 0.0 1,984.4 8,308.1 7,510.3 45,871.8 46,735.1 47,704.4Elec. prod. [MWh] 128,631.0 16,368.0 14,784.0 16,367.7 15,810.9 11,861.1 0.0 664.5 2,781.7 2,516.5 15,513.1 15,817.4 16,146.1Turn ons 86 0 0 0 0 12 0 5 26 35 5 0 3Operating hours 6,031 744 672 744 720 597 0 42 176 156 726 720 734Full load operating hours 5,847 744 672 744 719 539 0 30 126 114 705 719 734

energyPRO 4.4.367
energyPRO is developed by EMD International A/S, Niels Jernesvej 10, DK-9220 Aalborg Ø, Tlf. +45 96 35 44 44, Fax +45 96 35 44 46, Homepage: www.emd.dk
ALT1.epp Printed/Page
6/8/2017 1:37:44 PM / 5Licensed user:
University License January 1, 2017 to September 1, 2017 Spring 2016
Energy conversion, monthly
Energy unit: Geothermal_Elec HeatpumpHeat prod. [MWh] 27,594.0 2,343.6 2,116.8 2,343.6 2,268.0 2,343.6 2,268.0 2,343.6 2,343.6 2,268.0 2,343.6 2,268.0 2,343.6Elec. consum. [MWh] 13,140.0 1,116.0 1,008.0 1,116.0 1,080.0 1,116.0 1,080.0 1,116.0 1,116.0 1,080.0 1,116.0 1,080.0 1,116.0Turn ons 0 0 0 0 0 0 0 0 0 0 0 0 0Operating hours 8,760 744 672 744 720 744 720 744 744 720 744 720 744Full load operating hours 8,760 744 672 744 720 744 720 744 744 720 744 720 744
Energy unit: Gas boilerFuel consum. [1000Nm3] 46,610.7 20,775.1 6,744.3 4,071.7 3,755.2 502.3 102.2 2.5 0.0 1,677.1 40.2 2,706.8 6,233.3Fuel consum. [MWh] 511,811.1 228,121.6 74,056.2 44,709.4 41,234.4 5,515.6 1,122.5 27.3 0.0 18,415.6 441.0 29,722.3 68,445.3Heat prod. [MWh] 511,811.1 228,121.6 74,056.2 44,709.4 41,234.4 5,515.6 1,122.5 27.3 0.0 18,415.6 441.0 29,722.3 68,445.3Turn ons 181 5 8 25 33 42 4 2 2 2 14 17 27Operating hours 3,407 644 580 577 249 66 37 2 2 482 18 336 414Full load operating hours 256 114 37 22 21 3 1 0 0 9 0 15 34
Energy unit: HT_HeatPump_coldElec. consum. [MWh] 8,468.2 443.5 434.0 515.2 583.8 821.1 919.1 993.4 986.5 948.9 725.8 542.5 554.5Cooling prod. [MWh] 33,026.0 1,729.6 1,692.7 2,009.1 2,276.6 3,202.3 3,584.6 3,874.2 3,847.4 3,700.6 2,830.8 2,115.6 2,162.5Turn ons 887 70 70 83 65 69 70 79 77 75 82 73 74Operating hours 4,948 362 305 317 346 442 486 496 512 461 415 388 418Full load operating hours 2,823 148 145 172 195 274 306 331 329 316 242 181 185
Energy unit: HT_HeatPumpHeat prod. [MWh] 35,223.9 1,478.3 1,446.7 1,717.5 2,726.3 3,831.8 4,288.9 4,630.4 4,609.5 4,414.0 2,424.0 1,808.2 1,848.3Turn ons 888 70 70 82 65 70 70 79 77 76 82 73 74Operating hours 4,948 362 305 317 347 442 485 496 513 460 415 388 418Full load operating hours 2,753 148 145 172 195 274 306 331 329 315 173 181 185
Transmission between Kara_Novoren and VEKS_WestFrom Kara_Novoren [MWh] 797,404 71,796 64,848 71,796 69,480 71,796 67,864 71,796 39,372 55,584 71,796 69,480 71,796Loss [MWh] 0.0 0.0 0.0 0.0 0.0 0.0 0.0 0.0 0.0 0.0 0.0 0.0 0.0
Transmission between AVV and VEKS_NorthFrom AVV [MWh] 1,397,522 250,943 228,606 231,015 75,270 49,852 1,922 6 672 8,279 114,143 222,794 214,019

energyPRO 4.4.367
energyPRO is developed by EMD International A/S, Niels Jernesvej 10, DK-9220 Aalborg Ø, Tlf. +45 96 35 44 44, Fax +45 96 35 44 46, Homepage: www.emd.dk
ALT1.epp Printed/Page
6/8/2017 1:37:44 PM / 6Licensed user:
University License January 1, 2017 to September 1, 2017 Spring 2016
Energy conversion, monthly
Loss [MWh] 0.0 0.0 0.0 0.0 0.0 0.0 0.0 0.0 0.0 0.0 0.0 0.0 0.0
Transmission between AVV and VEKS_WestFrom AVV [MWh] 2,031,883 295,092 259,202 283,335 214,096 108,958 17,297 7,996 45,580 65,732 205,582 267,967 261,047Loss [MWh] 0.0 0.0 0.0 0.0 0.0 0.0 0.0 0.0 0.0 0.0 0.0 0.0 0.0
Transmission between VEKS_North and VEKS_WestFrom VEKS_North [MWh] 36,983 646 1,576 2,618 9,350 3,425 0 0 5,766 2,437 1,298 842 9,026From VEKS_West [MWh] 1,067,709 80,205 95,011 120,547 106,707 85,485 34,751 29,883 47,164 66,489 144,634 131,380 125,452Loss [MWh] 0.0 0.0 0.0 0.0 0.0 0.0 0.0 0.0 0.0 0.0 0.0 0.0 0.0
Transmission between KKV and KogeFrom KKV [MWh] 380,378 48,360 43,680 48,359 46,717 35,149 0 1,984 8,308 7,510 45,872 46,735 47,704Loss [MWh] 0.0 0.0 0.0 0.0 0.0 0.0 0.0 0.0 0.0 0.0 0.0 0.0 0.0
Transmission between Koge and VEKS_WestFrom Koge [MWh] 181,736 14,698 16,224 19,494 23,066 22,724 0 1,664 6,967 5,850 27,960 21,070 22,019From VEKS_West [MWh] 22,184 0 0 0 0 1,410 5,486 5,349 4,328 5,258 352 0 0Loss [MWh] 0.0 0.0 0.0 0.0 0.0 0.0 0.0 0.0 0.0 0.0 0.0 0.0 0.0
Transmission between CTR and VEKS_NorthFrom CTR [MWh] 76,530 2,832 6,536 4,621 25,618 7,392 369 411 3,740 4,830 1,019 978 18,184From VEKS_North [MWh] 1,338,847 141,246 171,574 189,772 68,652 82,399 13,085 15,272 39,721 47,580 160,712 209,852 198,982Loss [MWh] 0.0 0.0 0.0 0.0 0.0 0.0 0.0 0.0 0.0 0.0 0.0 0.0 0.0
Transmission between Vestforbrænding and VFFrom Vestforbrænding [MWh] 1,162,053 106,392 96,096 106,392 102,960 106,096 90,409 97,252 106,392 34,320 106,392 102,960 106,392Loss [MWh] 0.0 0.0 0.0 0.0 0.0 0.0 0.0 0.0 0.0 0.0 0.0 0.0 0.0
Transmission between VF and VEKS_NorthFrom VF [MWh] 140,459 564 1,388 1,103 5,562 22,661 23,978 25,760 35,747 10,750 6,877 2,116 3,954Loss [MWh] 0.0 0.0 0.0 0.0 0.0 0.0 0.0 0.0 0.0 0.0 0.0 0.0 0.0
Transmission between VF and CTRFrom VF [MWh] 230,442 868 350 1,278 5,745 28,454 45,712 48,922 48,075 14,325 26,804 6,089 3,820Loss [MWh] 0.0 0.0 0.0 0.0 0.0 0.0 0.0 0.0 0.0 0.0 0.0 0.0 0.0
Transmission between AMV and CTRFrom AMV [MWh] 3,501,760 518,773 485,066 495,544 473,961 219,744 4,188 13,347 43,148 44,734 301,620 432,402 469,233

energyPRO 4.4.367
energyPRO is developed by EMD International A/S, Niels Jernesvej 10, DK-9220 Aalborg Ø, Tlf. +45 96 35 44 44, Fax +45 96 35 44 46, Homepage: www.emd.dk
ALT1.epp Printed/Page
6/8/2017 1:37:44 PM / 7Licensed user:
University License January 1, 2017 to September 1, 2017 Spring 2016
Energy conversion, monthly
Loss [MWh] 0.0 0.0 0.0 0.0 0.0 0.0 0.0 0.0 0.0 0.0 0.0 0.0 0.0
Transmission between HCV and CTRFrom HCV [MWh] 711,436 167,982 123,701 139,847 117,734 7,847 0 0 0 0 226 79,066 75,033Loss [MWh] 0.0 0.0 0.0 0.0 0.0 0.0 0.0 0.0 0.0 0.0 0.0 0.0 0.0
Transmission between ARC_Waste and CTRFrom ARC_Waste [MWh] 1,557,940 141,360 127,680 141,360 136,800 140,894 126,679 118,448 68,400 136,800 141,360 136,800 141,360Loss [MWh] 0.0 0.0 0.0 0.0 0.0 0.0 0.0 0.0 0.0 0.0 0.0 0.0 0.0
Transmission between Peak Production and VEKS_NorthFrom Peak Production [MWh] 0 0 0 0 0 0 0 0 0 0 0 0 0Loss [MWh] 0.0 0.0 0.0 0.0 0.0 0.0 0.0 0.0 0.0 0.0 0.0 0.0 0.0
Transmission between CTR and Peak ProductionFrom Peak Production [MWh] 413,048 198,430 56,084 33,668 38,737 5,414 0 27 0 115 441 22,297 57,835Loss [MWh] 0.0 0.0 0.0 0.0 0.0 0.0 0.0 0.0 0.0 0.0 0.0 0.0 0.0
Transmission between VF and Peak ProductionFrom Peak Production [MWh] 94,672 29,564 16,175 11,015 2,498 102 1,122 0 0 18,300 0 7,426 8,471Loss [MWh] 0.0 0.0 0.0 0.0 0.0 0.0 0.0 0.0 0.0 0.0 0.0 0.0 0.0
Transmission between VEKS_West and Peak ProductionFrom Peak Production [MWh] 2,417 0 1,490 0 0 0 0 0 0 0 0 0 927Loss [MWh] 0.0 0.0 0.0 0.0 0.0 0.0 0.0 0.0 0.0 0.0 0.0 0.0 0.0
Transmission between Peak Production and KogeFrom Peak Production [MWh] 1,673 128 307 26 0 0 0 0 0 0 0 0 1,213Loss [MWh] 0.0 0.0 0.0 0.0 0.0 0.0 0.0 0.0 0.0 0.0 0.0 0.0 0.0
Transmission between VEKS_West and Høje_TaastrupFrom VEKS_West [MWh] 219,697 37,662 31,109 30,649 24,244 11,761 1,999 1,869 1,837 3,722 18,758 27,176 28,910Loss [MWh] 0.0 0.0 0.0 0.0 0.0 0.0 0.0 0.0 0.0 0.0 0.0 0.0 0.0
Transmission between AMV and AMV TESFrom AMV [MWh] 146,911 2,250 4,990 2,911 10,293 20,870 2,641 8,431 23,335 24,160 23,159 13,365 10,507From AMV TES [MWh] 146,911 2,250 4,990 2,911 10,237 20,926 2,635 7,761 23,917 23,619 23,117 13,609 10,939Loss [MWh] 0.0 0.0 0.0 0.0 0.0 0.0 0.0 0.0 0.0 0.0 0.0 0.0 0.0

energyPRO 4.4.367
energyPRO is developed by EMD International A/S, Niels Jernesvej 10, DK-9220 Aalborg Ø, Tlf. +45 96 35 44 44, Fax +45 96 35 44 46, Homepage: www.emd.dk
ALT1.epp Printed/Page
6/8/2017 1:37:44 PM / 8Licensed user:
University License January 1, 2017 to September 1, 2017 Spring 2016
Energy conversion, monthly
Transmission between AVV and AVV TESFrom AVV [MWh] 448,789 22,514 28,931 30,977 36,229 63,227 14,837 8,014 35,533 51,541 69,914 44,893 42,179From AVV TES [MWh] 448,789 20,167 30,173 31,548 34,812 64,993 14,941 7,318 35,348 50,646 69,875 45,097 43,871Loss [MWh] 0.0 0.0 0.0 0.0 0.0 0.0 0.0 0.0 0.0 0.0 0.0 0.0 0.0
Transmission between Høje_Taastrup and HT_storeFrom Høje_Taastrup [MWh] 92,849 5,071 12,100 12,199 12,022 8,345 2,394 2,385 2,549 3,769 10,823 9,509 11,684From HT_store [MWh] 92,849 4,643 11,353 12,933 12,148 8,604 2,392 2,380 2,598 3,559 10,566 9,930 11,743Loss [MWh] 0.0 0.0 0.0 0.0 0.0 0.0 0.0 0.0 0.0 0.0 0.0 0.0 0.0
Fuel consumption: Natural GasFuel consum. [1000Nm3] 152,916.3 46,730.9 24,108.0 23,695.5 20,299.3 1,595.0 112.4 2.5 0.0 1,685.4 834.8 15,633.3 18,219.3Fuel consum. [MWh] 1,679,106.3 513,130.8 264,718.9 260,189.6 222,897.1 17,514.1 1,234.6 27.3 0.0 18,506.5 9,166.9 171,662.6 200,058.1Peak [MW] 1,863.845 1,863.845 1,500.287 1,012.649 1,027.474 895.377 142.477 27.318 0.000 127.628 368.920 1,231.207 1,499.292
Fuel consumption: StrawFuel consum. [ton] 88,512.8 16,388.2 13,151.0 16,097.0 7,375.4 639.1 300.0 0.0 0.0 508.6 7,496.0 13,851.1 12,706.4Fuel consum. [MWh] 356,509.9 66,007.9 52,969.2 64,835.1 29,706.5 2,574.3 1,208.4 0.0 0.0 2,048.6 30,192.2 55,789.0 51,178.7Peak [MW] 100.700 100.700 100.700 100.700 100.700 100.700 100.700 0.000 0.000 100.700 100.700 100.700 100.700
Fuel consumption: Wood PelletsFuel consum. [ton] 1,581,441.3 257,323.3 221,664.2 235,578.5 157,084.9 65,215.6 12,768.8 3,143.8 17,724.2 30,227.6 134,697.1 225,372.9 220,640.5Fuel consum. [MWh] 7,687,562.1 1,250,877.0 1,077,534.3 1,145,173.2 763,607.4 317,020.4 62,070.4 15,282.2 86,159.5 146,939.7 654,777.4 1,095,562.7 1,072,558.1Peak [MW] 1,783.600 1,783.600 1,768.100 1,768.100 1,768.100 1,768.100 1,410.400 579.800 1,410.400 1,410.400 1,783.600 1,783.600 1,783.600
Fuel consumption: Wood ChipsFuel consum. [ton] 1,472,158.9 190,606.1 172,160.4 190,605.6 184,414.2 119,547.2 1,054.8 7,391.4 26,259.7 27,427.7 178,463.7 183,959.7 190,268.3Fuel consum. [MWh] 4,109,777.0 532,108.8 480,614.4 532,107.4 514,823.1 333,735.9 2,944.6 20,634.4 73,308.4 76,569.0 498,211.2 513,554.0 531,165.7Peak [MW] 715.200 715.200 715.200 715.200 715.200 715.200 462.388 690.020 690.020 705.790 715.200 715.200 715.200
Fuel consumption: WasteFuel consum. [ton] 1,535,843.9 139,531.9 126,028.8 139,531.9 135,030.9 139,202.7 124,431.3 125,879.4 94,125.0 97,987.5 139,531.9 135,030.9 139,531.9Fuel consum. [MWh] 4,479,544.9 406,968.0 367,584.0 406,968.0 393,840.0 406,008.0 362,924.7 367,148.2 274,531.2 285,796.8 406,968.0 393,840.0 406,968.0Peak [MW] 547.000 547.000 547.000 547.000 547.000 547.000 547.000 547.000 547.000 547.000 547.000 547.000 547.000
Fuel consumption: FueloilFuel consum. [Ton] 0.0 0.0 0.0 0.0 0.0 0.0 0.0 0.0 0.0 0.0 0.0 0.0 0.0Fuel consum. [MWh] 0.0 0.0 0.0 0.0 0.0 0.0 0.0 0.0 0.0 0.0 0.0 0.0 0.0Peak [MW] 0.000 0.000 0.000 0.000 0.000 0.000 0.000 0.000 0.000 0.000 0.000 0.000 0.000

energyPRO 4.4.367
energyPRO is developed by EMD International A/S, Niels Jernesvej 10, DK-9220 Aalborg Ø, Tlf. +45 96 35 44 44, Fax +45 96 35 44 46, Homepage: www.emd.dk
ALT2.epp Printed/Page
6/8/2017 1:38:14 PM / 1Licensed user:
University License January 1, 2017 to September 1, 2017 Spring 2016
Energy conversion, monthly
Calculated period: 01/2025 - 12/2025
Total Jan Feb Mar Apr May Jun Jul Aug Sep Oct Nov DecHeat demand [MWh]
12,087,420.5 1,829,870.0 1,503,633.8 1,564,808.7 1,281,113.2 749,940.9 313,768.9 315,482.4 316,530.9 375,579.6 989,598.4 1,390,156.0 1,456,937.6 V E K S _ N o r t h 1,306,388.9 192,652.7 158,390.2 164,896.4 135,155.5 79,566.5 47,935.3 40,787.7 41,836.1 40,331.4 104,662.5 146,574.0 153,600.6 V E K S _ W e s t 1,740,833.3 264,364.5 217,219.0 226,046.4 185,039.9 108,246.6 42,924.7 44,355.5 44,355.5 54,133.2 142,892.3 200,803.5 210,452.3 V F 885,833.3 134,523.5 110,533.2 115,025.1 94,158.7 55,081.9 21,842.5 22,570.5 22,570.5 27,546.0 72,711.6 102,180.0 107,089.9 K o g e 222,500.0 33,789.1 27,763.3 28,891.5 23,650.4 13,835.3 5,486.3 5,669.2 5,669.2 6,918.9 18,263.4 25,665.2 26,898.4 C T R 7,676,944.4 1,165,827.8 957,919.5 996,847.9 816,012.2 477,359.4 189,294.5 195,604.3 195,604.3 238,723.2 630,144.1 885,528.4 928,078.7 H ø j e _ T a a s t r u p 254,920.6 38,712.5 31,808.7 33,101.3 27,096.5 15,851.2 6,285.7 6,495.2 6,495.2 7,927.0 20,924.6 29,404.9 30,817.8
Cooling demand [MWh]33,026.0 1,729.6 1,692.7 2,009.1 2,276.6 3,197.5 3,589.3 3,874.2 3,847.4 3,693.4 2,830.3 2,123.3 2,162.5
H ø j e _ T a a s t r u p 33,026.0 1,729.6 1,692.7 2,009.1 2,276.6 3,197.5 3,589.3 3,874.2 3,847.4 3,693.4 2,830.3 2,123.3 2,162.5
Electricity produced by energy units [MWh]4,825,785.3 688,421.5 559,595.1 645,905.3 491,027.4 282,008.3 108,766.4 95,731.6 108,902.4 139,783.9 465,541.0 631,847.4 608,255.2
Electricity consumed by energy units [MWh]21,608.2 1,559.5 1,442.0 1,631.2 1,663.8 1,937.1 1,999.1 2,109.4 2,102.5 2,028.9 1,841.8 1,622.5 1,670.5
Exported electricity, Nordpool Spot Price 2025 [MWh]4,804,180.8 686,862.0 558,153.1 644,274.1 489,363.6 280,071.2 106,771.1 93,622.2 106,799.9 137,755.0 463,699.2 630,224.9 606,584.7
Peak [MW] 1,169.300 1,169.300 1,006.000 1,006.000 954.427 937.072 768.855 455.328 742.026 830.903 1,094.552 1,169.300 1,169.300
Imported electricity, Nordpool Spot Price 2025 [MWh]3.8 0.0 0.0 0.0 0.0 0.0 3.8 0.0 0.0 0.0 0.0 0.0 0.0
Peak [MW] 3.750 0.000 0.000 0.000 0.000 0.000 3.750 0.000 0.000 0.000 0.000 0.000 0.000
Energy unit: ARCFuel consum. [ton] 641,173.1 58,669.7 52,992.0 58,669.7 56,777.1 58,669.7 50,348.1 45,764.4 28,388.6 56,777.1 58,669.7 56,777.1 58,669.7Fuel consum. [MWh] 1,870,088.2 171,120.0 154,560.0 171,120.0 165,600.0 171,120.0 146,848.5 133,479.6 82,800.0 165,600.0 171,120.0 165,600.0 171,120.0Heat prod. [MWh] 1,544,879.8 141,360.0 127,680.0 141,360.0 136,800.0 141,360.0 121,320.7 110,279.1 68,400.0 136,800.0 141,360.0 136,800.0 141,360.0Elec. prod. [MWh] 463,459.1 42,408.0 38,304.0 42,408.0 41,040.0 42,408.0 36,394.0 33,081.1 20,520.0 41,040.0 42,408.0 41,040.0 42,408.0Turn ons 30 0 0 0 0 0 12 17 1 0 0 0 0Operating hours 8,143 744 672 744 720 744 644 587 360 720 744 720 744Full load operating hours 8,131 744 672 744 720 744 638 580 360 720 744 720 744

energyPRO 4.4.367
energyPRO is developed by EMD International A/S, Niels Jernesvej 10, DK-9220 Aalborg Ø, Tlf. +45 96 35 44 44, Fax +45 96 35 44 46, Homepage: www.emd.dk
ALT2.epp Printed/Page
6/8/2017 1:38:14 PM / 2Licensed user:
University License January 1, 2017 to September 1, 2017 Spring 2016
Energy conversion, monthly
Energy unit: VF_WasteFuel consum. [ton] 524,502.1 47,369.4 42,785.3 47,369.4 45,841.4 47,369.4 43,456.2 47,080.9 47,369.4 15,280.5 47,369.4 45,841.4 47,369.4Fuel consum. [MWh] 1,529,797.9 138,160.8 124,790.4 138,160.8 133,704.0 138,160.8 126,747.3 137,319.4 138,160.8 44,568.0 138,160.8 133,704.0 138,160.8Heat prod. [MWh] 1,178,040.7 106,392.0 96,096.0 106,392.0 102,960.0 106,392.0 97,607.6 105,745.1 106,392.0 34,320.0 106,392.0 102,960.0 106,392.0Elec. prod. [MWh] 321,276.7 29,016.0 26,208.0 29,016.0 28,080.0 29,016.0 26,614.4 28,838.3 29,016.0 9,360.0 29,016.0 28,080.0 29,016.0Turn ons 8 0 0 0 0 0 5 2 0 1 0 0 0Operating hours 8,241 744 672 744 720 744 685 740 744 240 744 720 744Full load operating hours 8,238 744 672 744 720 744 682 739 744 240 744 720 744
Energy unit: KN_WasteFuel consum. [ton] 372,630.2 33,492.8 30,251.5 33,492.8 32,412.3 33,492.8 32,300.6 33,492.8 18,367.0 25,929.9 33,492.8 32,412.3 33,492.8Fuel consum. [MWh] 1,086,838.1 97,687.2 88,233.6 97,687.2 94,536.0 97,687.2 94,210.1 97,687.2 53,570.4 75,628.8 97,687.2 94,536.0 97,687.2Heat prod. [MWh] 798,780.5 71,796.0 64,848.0 71,796.0 69,480.0 71,796.0 69,240.5 71,796.0 39,372.0 55,584.0 71,796.0 69,480.0 71,796.0Elec. prod. [MWh] 266,536.1 23,956.8 21,638.4 23,956.8 23,184.0 23,956.8 23,104.1 23,956.8 13,137.6 18,547.2 23,956.8 23,184.0 23,956.8Turn ons 2 0 0 0 0 0 1 0 0 1 0 0 0Operating hours 8,278 744 672 744 720 744 718 744 408 576 744 720 744Full load operating hours 8,278 744 672 744 720 744 718 744 408 576 744 720 744
Energy unit: AMV1_CHPFuel consum. [ton] 325,142.4 57,064.9 51,480.7 56,888.5 55,276.3 8,402.0 0.0 0.0 0.0 0.0 5,924.6 42,878.5 47,227.0Fuel consum. [MWh] 1,580,553.5 277,399.0 250,253.2 276,541.2 268,704.0 40,842.9 0.0 0.0 0.0 0.0 28,800.3 208,437.0 229,575.9Heat prod. [MWh] 1,059,374.8 185,828.9 167,649.0 185,250.0 180,000.0 27,449.6 0.0 0.0 0.0 0.0 19,501.1 139,846.8 153,849.4Elec. prod. [MWh] 288,150.0 50,545.5 45,600.5 50,388.0 48,960.0 7,466.3 0.0 0.0 0.0 0.0 5,304.3 38,038.3 41,847.0Turn ons 76 0 0 1 0 10 0 0 0 0 29 22 14Operating hours 4,331 744 672 741 720 124 0 0 0 0 111 594 625Full load operating hours 4,237 743 671 741 720 110 0 0 0 0 78 559 615
Energy unit: AMV BIO4Fuel consum. [ton] 1,103,197.0 116,694.0 80,616.9 150,321.5 154,775.5 92,010.0 2,332.1 5,387.5 23,025.6 24,837.1 153,103.1 156,898.7 143,195.1Fuel consum. [MWh] 3,079,758.5 325,770.8 225,055.4 419,647.5 432,081.5 256,861.2 6,510.5 15,040.1 64,279.7 69,336.9 427,412.9 438,008.9 399,753.1Heat prod. [MWh] 1,983,218.1 209,600.0 144,800.0 270,000.0 278,000.0 165,535.5 4,320.8 9,879.9 41,949.0 45,006.2 275,108.5 281,818.2 257,200.0Elec. prod. [MWh] 743,706.8 78,600.0 54,300.0 101,250.0 104,250.0 62,075.8 1,620.3 3,705.0 15,730.9 16,877.3 103,165.7 105,681.8 96,450.0Turn ons 207 10 22 7 5 27 11 14 41 46 12 4 8Operating hours 5,129 524 362 675 695 441 24 45 164 152 699 705 643Full load operating hours 4,958 524 362 675 695 414 11 25 105 113 688 705 643

energyPRO 4.4.367
energyPRO is developed by EMD International A/S, Niels Jernesvej 10, DK-9220 Aalborg Ø, Tlf. +45 96 35 44 44, Fax +45 96 35 44 46, Homepage: www.emd.dk
ALT2.epp Printed/Page
6/8/2017 1:38:14 PM / 3Licensed user:
University License January 1, 2017 to September 1, 2017 Spring 2016
Energy conversion, monthly
Energy unit: AVV_2_mainFuel consum. [ton] 647,096.4 113,696.3 93,819.9 113,363.7 50,246.3 10,528.5 3,915.0 0.0 1,268.6 7,382.6 59,271.4 99,689.2 93,914.9Fuel consum. [MWh] 3,145,607.7 552,690.1 456,069.1 551,073.7 244,252.9 51,180.3 19,031.3 0.0 6,166.7 35,887.6 288,124.9 484,600.3 456,530.8Heat prod. [MWh] 1,717,304.6 301,780.3 248,989.3 300,841.2 133,376.0 27,903.2 10,383.0 0.0 3,358.5 19,556.8 157,280.3 264,589.5 249,246.6Elec. prod. [MWh] 1,081,480.2 190,045.9 156,802.0 189,456.4 83,993.1 17,573.5 6,539.0 0.0 2,115.3 12,317.2 99,048.6 166,625.4 156,963.8Turn ons 181 11 18 7 3 22 6 0 4 23 45 21 21Operating hours 4,063 691 587 717 301 85 28 0 12 64 381 612 585Full load operating hours 3,858 678 559 676 300 63 23 0 8 44 353 594 560
Energy unit: AMV BIO4_bypassFuel consum. [ton] 176,037.2 48,993.7 69,036.5 15,366.2 5,567.5 9,983.2 0.0 0.0 0.0 0.0 1,702.5 2,895.1 22,492.5Fuel consum. [MWh] 491,437.1 136,774.0 192,727.0 42,897.3 15,542.5 27,869.7 0.0 0.0 0.0 0.0 4,752.8 8,082.1 62,791.7Heat prod. [MWh] 434,760.2 121,000.0 170,500.0 37,950.0 13,750.0 24,655.5 0.0 0.0 0.0 0.0 4,204.7 7,150.0 55,550.0Turn ons 67 11 21 7 5 10 0 0 0 0 2 3 8Operating hours 797 220 310 69 25 50 0 0 0 0 9 13 101Full load operating hours 790 220 310 69 25 45 0 0 0 0 8 13 101
Energy unit: AVV_1Fuel consum. [ton] 534,742.1 73,802.5 76,340.4 65,361.7 51,526.0 46,111.6 996.2 2,960.0 11,479.7 16,008.1 51,852.1 68,913.1 69,390.7Fuel consum. [MWh] 2,599,440.8 358,762.3 371,099.1 317,730.4 250,473.6 224,153.4 4,842.8 14,388.7 55,804.1 77,817.2 252,059.0 334,994.2 337,316.1Heat prod. [MWh] 1,479,500.0 204,193.8 211,215.4 180,840.0 142,560.0 127,578.6 2,756.3 8,189.4 31,761.3 44,290.3 143,461.9 190,665.8 191,987.2Elec. prod. [MWh] 963,916.6 133,035.3 137,610.0 117,820.0 92,880.0 83,119.4 1,795.8 5,335.5 20,693.0 28,855.8 93,467.6 124,221.6 125,082.6Turn ons 261 17 6 2 1 38 4 9 31 45 54 27 27Operating hours 4,581 619 641 548 432 425 9 28 105 144 454 584 592Full load operating hours 4,483 619 640 548 432 387 8 25 96 134 435 578 582
Energy unit: AVV1_CondensingFuel consum. [ton] 63,435.2 12,736.0 0.0 0.0 0.0 0.0 5,878.2 0.0 857.2 3,184.0 17,267.1 13,593.2 9,919.4Fuel consum. [MWh] 308,365.4 61,911.2 0.0 0.0 0.0 0.0 28,574.4 0.0 4,167.1 15,477.8 83,937.3 66,078.3 48,219.3Heat prod. [MWh] 51.8 10.4 0.0 0.0 0.0 0.0 4.8 0.0 0.7 2.6 14.1 11.1 8.1Elec. prod. [MWh] 129,500.0 26,000.0 0.0 0.0 0.0 0.0 12,000.0 0.0 1,750.0 6,500.0 35,250.0 27,750.0 20,250.0Turn ons 97 11 0 0 0 0 8 0 2 9 29 20 18Operating hours 518 104 0 0 0 0 48 0 7 26 141 111 81Full load operating hours 518 104 0 0 0 0 48 0 7 26 141 111 81

energyPRO 4.4.367
energyPRO is developed by EMD International A/S, Niels Jernesvej 10, DK-9220 Aalborg Ø, Tlf. +45 96 35 44 44, Fax +45 96 35 44 46, Homepage: www.emd.dk
ALT2.epp Printed/Page
6/8/2017 1:38:14 PM / 4Licensed user:
University License January 1, 2017 to September 1, 2017 Spring 2016
Energy conversion, monthly
Energy unit: HCV_CHPFuel consum. [1000Nm3] 100,795.0 23,687.9 17,415.9 19,799.0 16,876.2 1,082.3 0.0 0.0 0.0 0.0 18.6 11,184.1 10,731.0Fuel consum. [MWh] 1,106,785.5 260,106.0 191,236.5 217,403.7 185,309.8 11,884.3 0.0 0.0 0.0 0.0 204.6 122,808.0 117,832.4Heat prod. [MWh] 718,205.0 168,515.5 124,074.7 141,089.0 120,083.3 7,766.0 0.0 0.0 0.0 0.0 136.2 79,810.8 76,729.4Elec. prod. [MWh] 235,450.4 55,605.8 40,703.4 46,235.5 39,589.3 2,473.5 0.0 0.0 0.0 0.0 40.1 26,005.0 24,797.9Turn ons 145 13 19 22 29 15 0 0 0 0 1 19 27Operating hours 3,123 622 531 619 454 56 0 0 0 0 2 396 443Full load operating hours 2,378 562 411 467 400 25 0 0 0 0 0 263 250
Energy unit: AVV_2_Gas_TFuel consum. [1000Nm3] 6,389.7 2,343.2 0.0 0.0 0.0 0.0 0.0 0.0 0.0 0.0 721.3 1,835.5 1,489.6Fuel consum. [MWh] 70,162.3 25,729.6 0.0 0.0 0.0 0.0 0.0 0.0 0.0 0.0 7,920.7 20,154.9 16,357.1Heat prod. [MWh] 26,062.4 9,557.6 0.0 0.0 0.0 0.0 0.0 0.0 0.0 0.0 2,942.1 7,486.8 6,076.0Elec. prod. [MWh] 36,385.9 13,343.2 0.0 0.0 0.0 0.0 0.0 0.0 0.0 0.0 4,107.7 10,452.3 8,482.8Turn ons 59 11 0 0 0 0 0 0 0 0 11 18 19Operating hours 292 104 0 0 0 0 0 0 0 0 36 83 69Full load operating hours 284 104 0 0 0 0 0 0 0 0 32 81 66
Energy unit: AVV_2_Straw_boilerFuel consum. [ton] 88,854.7 16,388.2 13,136.7 16,115.8 7,356.0 625.0 281.9 0.0 0.0 542.8 7,847.8 13,862.8 12,697.5Fuel consum. [MWh] 357,886.9 66,007.9 52,911.9 64,910.9 29,628.3 2,517.5 1,135.6 0.0 0.0 2,186.4 31,609.4 55,836.3 51,142.7Heat prod. [MWh] 177,699.2 32,774.5 26,271.9 32,229.8 14,711.2 1,250.0 563.8 0.0 0.0 1,085.6 15,694.8 27,724.0 25,393.6Elec. prod. [MWh] 159,929.3 29,497.0 23,644.7 29,006.8 13,240.1 1,125.0 507.4 0.0 0.0 977.0 14,125.3 24,951.6 22,854.2Turn ons 186 13 29 26 5 6 2 0 0 8 45 23 29Operating hours 3,574 657 532 647 295 25 12 0 0 24 315 557 510Full load operating hours 3,554 655 525 645 294 25 11 0 0 22 314 554 508
Energy unit: KKV_CHPFuel consum. [ton] 207,273.5 24,918.4 22,507.0 24,918.0 24,071.3 19,539.7 293.7 1,251.7 9,121.0 8,149.3 23,841.8 24,080.9 24,580.6Fuel consum. [MWh] 578,638.4 69,564.0 62,832.0 69,562.6 67,199.1 54,548.3 819.8 3,494.4 25,462.8 22,750.1 66,558.4 67,225.9 68,620.9Heat prod. [MWh] 402,417.2 48,360.0 43,680.0 48,359.0 46,716.5 37,961.9 571.4 2,436.5 17,752.8 15,859.1 46,280.4 46,735.1 47,704.4Elec. prod. [MWh] 135,994.3 16,368.0 14,784.0 16,367.7 15,810.9 12,794.0 191.4 814.9 5,939.6 5,309.3 15,650.9 15,817.4 16,146.1Turn ons 108 0 0 0 0 7 1 6 40 49 2 0 3Operating hours 6,523 744 672 744 720 671 12 53 383 337 733 720 734Full load operating hours 6,182 744 672 744 719 582 9 37 270 241 711 719 734
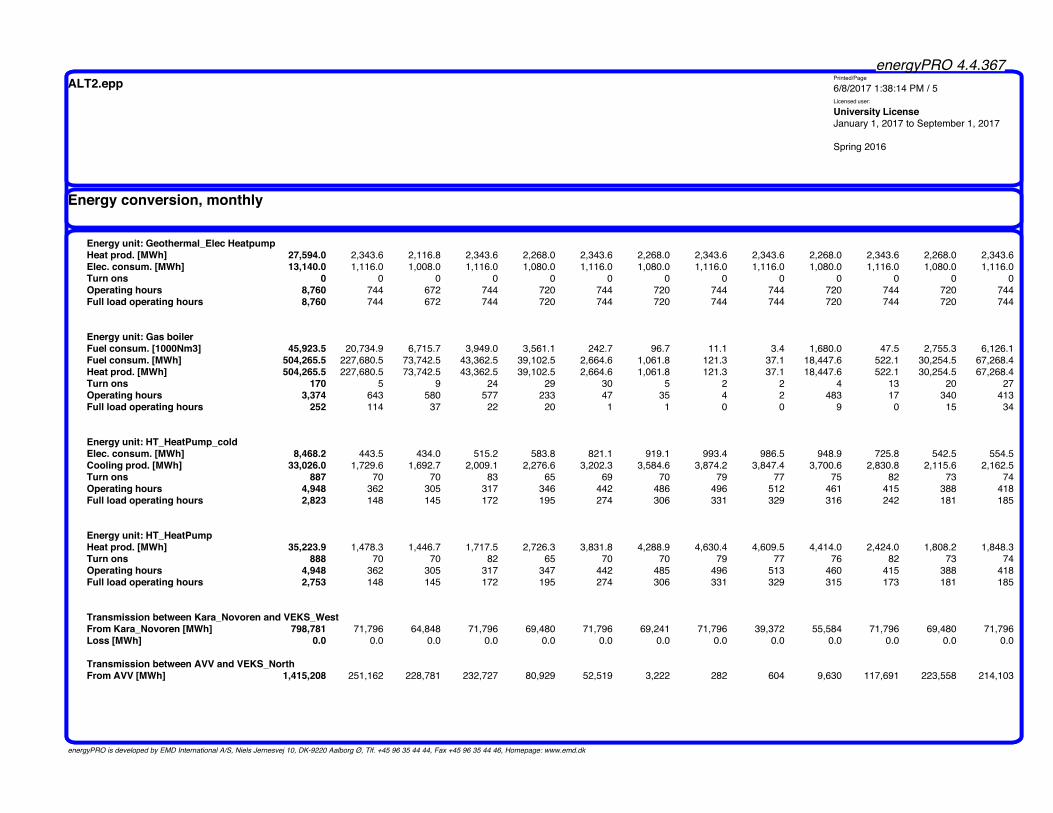
energyPRO 4.4.367
energyPRO is developed by EMD International A/S, Niels Jernesvej 10, DK-9220 Aalborg Ø, Tlf. +45 96 35 44 44, Fax +45 96 35 44 46, Homepage: www.emd.dk
ALT2.epp Printed/Page
6/8/2017 1:38:14 PM / 5Licensed user:
University License January 1, 2017 to September 1, 2017 Spring 2016
Energy conversion, monthly
Energy unit: Geothermal_Elec HeatpumpHeat prod. [MWh] 27,594.0 2,343.6 2,116.8 2,343.6 2,268.0 2,343.6 2,268.0 2,343.6 2,343.6 2,268.0 2,343.6 2,268.0 2,343.6Elec. consum. [MWh] 13,140.0 1,116.0 1,008.0 1,116.0 1,080.0 1,116.0 1,080.0 1,116.0 1,116.0 1,080.0 1,116.0 1,080.0 1,116.0Turn ons 0 0 0 0 0 0 0 0 0 0 0 0 0Operating hours 8,760 744 672 744 720 744 720 744 744 720 744 720 744Full load operating hours 8,760 744 672 744 720 744 720 744 744 720 744 720 744
Energy unit: Gas boilerFuel consum. [1000Nm3] 45,923.5 20,734.9 6,715.7 3,949.0 3,561.1 242.7 96.7 11.1 3.4 1,680.0 47.5 2,755.3 6,126.1Fuel consum. [MWh] 504,265.5 227,680.5 73,742.5 43,362.5 39,102.5 2,664.6 1,061.8 121.3 37.1 18,447.6 522.1 30,254.5 67,268.4Heat prod. [MWh] 504,265.5 227,680.5 73,742.5 43,362.5 39,102.5 2,664.6 1,061.8 121.3 37.1 18,447.6 522.1 30,254.5 67,268.4Turn ons 170 5 9 24 29 30 5 2 2 4 13 20 27Operating hours 3,374 643 580 577 233 47 35 4 2 483 17 340 413Full load operating hours 252 114 37 22 20 1 1 0 0 9 0 15 34
Energy unit: HT_HeatPump_coldElec. consum. [MWh] 8,468.2 443.5 434.0 515.2 583.8 821.1 919.1 993.4 986.5 948.9 725.8 542.5 554.5Cooling prod. [MWh] 33,026.0 1,729.6 1,692.7 2,009.1 2,276.6 3,202.3 3,584.6 3,874.2 3,847.4 3,700.6 2,830.8 2,115.6 2,162.5Turn ons 887 70 70 83 65 69 70 79 77 75 82 73 74Operating hours 4,948 362 305 317 346 442 486 496 512 461 415 388 418Full load operating hours 2,823 148 145 172 195 274 306 331 329 316 242 181 185
Energy unit: HT_HeatPumpHeat prod. [MWh] 35,223.9 1,478.3 1,446.7 1,717.5 2,726.3 3,831.8 4,288.9 4,630.4 4,609.5 4,414.0 2,424.0 1,808.2 1,848.3Turn ons 888 70 70 82 65 70 70 79 77 76 82 73 74Operating hours 4,948 362 305 317 347 442 485 496 513 460 415 388 418Full load operating hours 2,753 148 145 172 195 274 306 331 329 315 173 181 185
Transmission between Kara_Novoren and VEKS_WestFrom Kara_Novoren [MWh] 798,781 71,796 64,848 71,796 69,480 71,796 69,241 71,796 39,372 55,584 71,796 69,480 71,796Loss [MWh] 0.0 0.0 0.0 0.0 0.0 0.0 0.0 0.0 0.0 0.0 0.0 0.0 0.0
Transmission between AVV and VEKS_NorthFrom AVV [MWh] 1,415,208 251,162 228,781 232,727 80,929 52,519 3,222 282 604 9,630 117,691 223,558 214,103

energyPRO 4.4.367
energyPRO is developed by EMD International A/S, Niels Jernesvej 10, DK-9220 Aalborg Ø, Tlf. +45 96 35 44 44, Fax +45 96 35 44 46, Homepage: www.emd.dk
ALT2.epp Printed/Page
6/8/2017 1:38:14 PM / 6Licensed user:
University License January 1, 2017 to September 1, 2017 Spring 2016
Energy conversion, monthly
Loss [MWh] 0.0 0.0 0.0 0.0 0.0 0.0 0.0 0.0 0.0 0.0 0.0 0.0 0.0
Transmission between AVV and VEKS_WestFrom AVV [MWh] 1,985,410 294,808 258,938 281,749 208,350 105,316 10,630 8,124 34,345 53,805 201,892 267,150 260,301Loss [MWh] 0.0 0.0 0.0 0.0 0.0 0.0 0.0 0.0 0.0 0.0 0.0 0.0 0.0
Transmission between VEKS_North and VEKS_WestFrom VEKS_North [MWh] 40,389 708 1,576 2,725 10,522 3,826 763 644 5,301 3,198 1,581 820 8,726From VEKS_West [MWh] 1,047,872 79,957 94,743 119,028 102,010 85,091 30,494 31,171 44,910 63,881 141,837 130,517 124,232Loss [MWh] 0.0 0.0 0.0 0.0 0.0 0.0 0.0 0.0 0.0 0.0 0.0 0.0 0.0
Transmission between KKV and KogeFrom KKV [MWh] 402,417 48,360 43,680 48,359 46,717 37,962 571 2,437 17,753 15,859 46,280 46,735 47,704Loss [MWh] 0.0 0.0 0.0 0.0 0.0 0.0 0.0 0.0 0.0 0.0 0.0 0.0 0.0
Transmission between Koge and VEKS_WestFrom Koge [MWh] 199,562 14,698 16,224 19,490 23,066 24,839 480 2,033 14,837 12,667 28,262 21,070 21,896From VEKS_West [MWh] 18,113 0 0 0 0 713 5,395 5,265 2,753 3,727 245 0 14Loss [MWh] 0.0 0.0 0.0 0.0 0.0 0.0 0.0 0.0 0.0 0.0 0.0 0.0 0.0
Transmission between CTR and VEKS_NorthFrom CTR [MWh] 75,745 2,697 6,363 4,485 26,303 6,331 393 202 3,056 5,745 1,248 892 18,030From VEKS_North [MWh] 1,358,396 141,013 171,283 189,912 69,998 85,439 17,822 26,147 39,021 46,999 162,882 209,973 197,906Loss [MWh] 0.0 0.0 0.0 0.0 0.0 0.0 0.0 0.0 0.0 0.0 0.0 0.0 0.0
Transmission between Vestforbrænding and VFFrom Vestforbrænding [MWh] 1,178,041 106,392 96,096 106,392 102,960 106,392 97,608 105,745 106,392 34,320 106,392 102,960 106,392Loss [MWh] 0.0 0.0 0.0 0.0 0.0 0.0 0.0 0.0 0.0 0.0 0.0 0.0 0.0
Transmission between VF and VEKS_NorthFrom VF [MWh] 166,349 558 1,363 1,293 6,433 24,890 32,411 35,923 37,588 11,272 8,350 2,400 3,868Loss [MWh] 0.0 0.0 0.0 0.0 0.0 0.0 0.0 0.0 0.0 0.0 0.0 0.0 0.0
Transmission between VF and CTRFrom VF [MWh] 220,319 874 375 1,066 4,874 26,521 44,416 47,373 46,234 13,802 25,331 5,806 3,647Loss [MWh] 0.0 0.0 0.0 0.0 0.0 0.0 0.0 0.0 0.0 0.0 0.0 0.0 0.0
Transmission between AMV and CTRFrom AMV [MWh] 3,504,947 518,773 485,066 495,544 473,961 220,041 6,129 12,008 44,968 46,720 301,161 431,202 469,375

energyPRO 4.4.367
energyPRO is developed by EMD International A/S, Niels Jernesvej 10, DK-9220 Aalborg Ø, Tlf. +45 96 35 44 44, Fax +45 96 35 44 46, Homepage: www.emd.dk
ALT2.epp Printed/Page
6/8/2017 1:38:14 PM / 7Licensed user:
University License January 1, 2017 to September 1, 2017 Spring 2016
Energy conversion, monthly
Loss [MWh] 0.0 0.0 0.0 0.0 0.0 0.0 0.0 0.0 0.0 0.0 0.0 0.0 0.0
Transmission between HCV and CTRFrom HCV [MWh] 718,205 168,516 124,075 141,089 120,083 7,766 0 0 0 0 136 79,811 76,729Loss [MWh] 0.0 0.0 0.0 0.0 0.0 0.0 0.0 0.0 0.0 0.0 0.0 0.0 0.0
Transmission between ARC_Waste and CTRFrom ARC_Waste [MWh] 1,544,880 141,360 127,680 141,360 136,800 141,360 121,321 110,279 68,400 136,800 141,360 136,800 141,360Loss [MWh] 0.0 0.0 0.0 0.0 0.0 0.0 0.0 0.0 0.0 0.0 0.0 0.0 0.0
Transmission between Peak Production and VEKS_NorthFrom Peak Production [MWh] 0 0 0 0 0 0 0 0 0 0 0 0 0Loss [MWh] 0.0 0.0 0.0 0.0 0.0 0.0 0.0 0.0 0.0 0.0 0.0 0.0 0.0
Transmission between CTR and Peak ProductionFrom Peak Production [MWh] 405,943 197,989 55,804 32,361 36,598 2,563 0 0 37 147 522 22,829 57,091Loss [MWh] 0.0 0.0 0.0 0.0 0.0 0.0 0.0 0.0 0.0 0.0 0.0 0.0 0.0
Transmission between VF and Peak ProductionFrom Peak Production [MWh] 94,418 29,564 16,149 10,978 2,504 102 1,062 121 0 18,300 0 7,426 8,212Loss [MWh] 0.0 0.0 0.0 0.0 0.0 0.0 0.0 0.0 0.0 0.0 0.0 0.0 0.0
Transmission between VEKS_West and Peak ProductionFrom Peak Production [MWh] 2,372 0 1,483 0 0 0 0 0 0 0 0 0 890Loss [MWh] 0.0 0.0 0.0 0.0 0.0 0.0 0.0 0.0 0.0 0.0 0.0 0.0 0.0
Transmission between Peak Production and KogeFrom Peak Production [MWh] 1,533 128 307 23 0 0 0 0 0 0 0 0 1,075Loss [MWh] 0.0 0.0 0.0 0.0 0.0 0.0 0.0 0.0 0.0 0.0 0.0 0.0 0.0
Transmission between VEKS_West and Høje_TaastrupFrom VEKS_West [MWh] 284,537 38,029 31,635 32,192 27,823 20,565 10,413 11,388 13,146 14,962 24,671 28,712 31,001From Høje_Taastrup [MWh] 64,840 340 528 1,506 3,455 8,838 8,114 9,583 11,310 11,449 6,114 1,512 2,092Loss [MWh] 0.0 0.0 0.0 0.0 0.0 0.0 0.0 0.0 0.0 0.0 0.0 0.0 0.0
Transmission between AMV and AMV TESFrom AMV [MWh] 143,025 2,248 5,049 3,498 10,166 20,822 4,772 8,176 19,763 21,563 22,862 13,477 10,630From AMV TES [MWh] 143,025 2,248 5,049 3,498 10,109 20,878 4,312 7,960 20,438 21,009 22,865 13,596 11,062
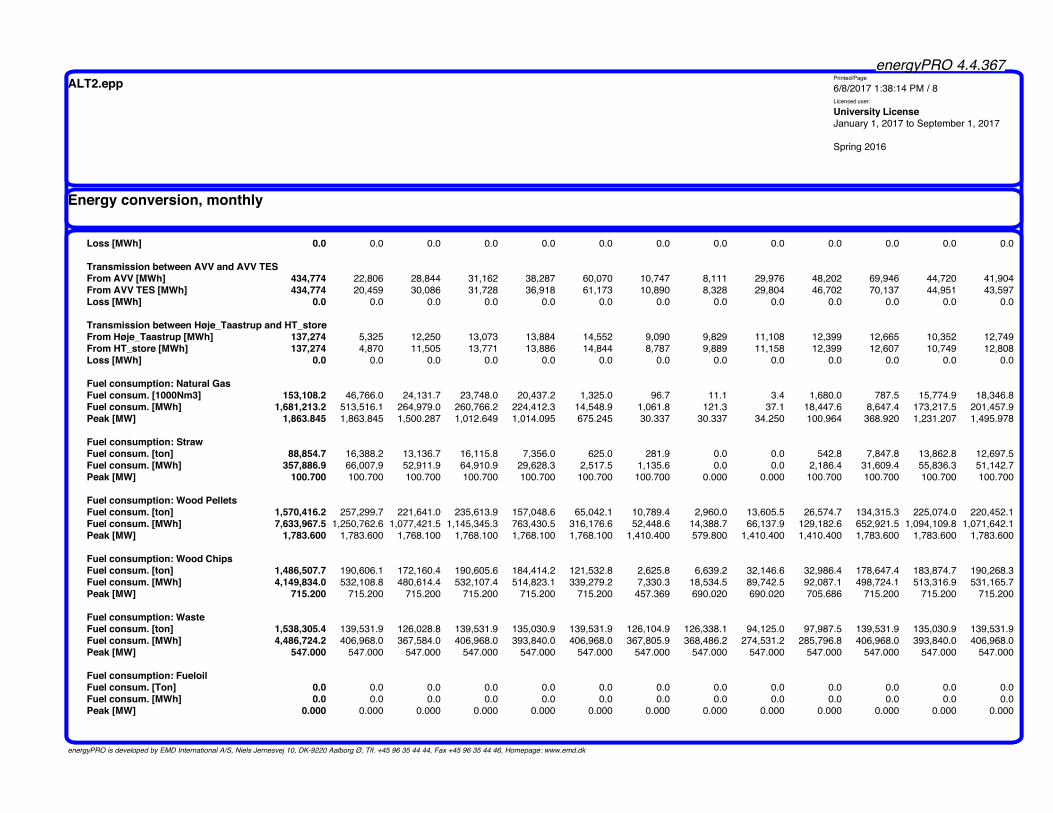
energyPRO 4.4.367
energyPRO is developed by EMD International A/S, Niels Jernesvej 10, DK-9220 Aalborg Ø, Tlf. +45 96 35 44 44, Fax +45 96 35 44 46, Homepage: www.emd.dk
ALT2.epp Printed/Page
6/8/2017 1:38:14 PM / 8Licensed user:
University License January 1, 2017 to September 1, 2017 Spring 2016
Energy conversion, monthly
Loss [MWh] 0.0 0.0 0.0 0.0 0.0 0.0 0.0 0.0 0.0 0.0 0.0 0.0 0.0
Transmission between AVV and AVV TESFrom AVV [MWh] 434,774 22,806 28,844 31,162 38,287 60,070 10,747 8,111 29,976 48,202 69,946 44,720 41,904From AVV TES [MWh] 434,774 20,459 30,086 31,728 36,918 61,173 10,890 8,328 29,804 46,702 70,137 44,951 43,597Loss [MWh] 0.0 0.0 0.0 0.0 0.0 0.0 0.0 0.0 0.0 0.0 0.0 0.0 0.0
Transmission between Høje_Taastrup and HT_storeFrom Høje_Taastrup [MWh] 137,274 5,325 12,250 13,073 13,884 14,552 9,090 9,829 11,108 12,399 12,665 10,352 12,749From HT_store [MWh] 137,274 4,870 11,505 13,771 13,886 14,844 8,787 9,889 11,158 12,399 12,607 10,749 12,808Loss [MWh] 0.0 0.0 0.0 0.0 0.0 0.0 0.0 0.0 0.0 0.0 0.0 0.0 0.0
Fuel consumption: Natural GasFuel consum. [1000Nm3] 153,108.2 46,766.0 24,131.7 23,748.0 20,437.2 1,325.0 96.7 11.1 3.4 1,680.0 787.5 15,774.9 18,346.8Fuel consum. [MWh] 1,681,213.2 513,516.1 264,979.0 260,766.2 224,412.3 14,548.9 1,061.8 121.3 37.1 18,447.6 8,647.4 173,217.5 201,457.9Peak [MW] 1,863.845 1,863.845 1,500.287 1,012.649 1,014.095 675.245 30.337 30.337 34.250 100.964 368.920 1,231.207 1,495.978
Fuel consumption: StrawFuel consum. [ton] 88,854.7 16,388.2 13,136.7 16,115.8 7,356.0 625.0 281.9 0.0 0.0 542.8 7,847.8 13,862.8 12,697.5Fuel consum. [MWh] 357,886.9 66,007.9 52,911.9 64,910.9 29,628.3 2,517.5 1,135.6 0.0 0.0 2,186.4 31,609.4 55,836.3 51,142.7Peak [MW] 100.700 100.700 100.700 100.700 100.700 100.700 100.700 0.000 0.000 100.700 100.700 100.700 100.700
Fuel consumption: Wood PelletsFuel consum. [ton] 1,570,416.2 257,299.7 221,641.0 235,613.9 157,048.6 65,042.1 10,789.4 2,960.0 13,605.5 26,574.7 134,315.3 225,074.0 220,452.1Fuel consum. [MWh] 7,633,967.5 1,250,762.6 1,077,421.5 1,145,345.3 763,430.5 316,176.6 52,448.6 14,388.7 66,137.9 129,182.6 652,921.5 1,094,109.8 1,071,642.1Peak [MW] 1,783.600 1,783.600 1,768.100 1,768.100 1,768.100 1,768.100 1,410.400 579.800 1,410.400 1,410.400 1,783.600 1,783.600 1,783.600
Fuel consumption: Wood ChipsFuel consum. [ton] 1,486,507.7 190,606.1 172,160.4 190,605.6 184,414.2 121,532.8 2,625.8 6,639.2 32,146.6 32,986.4 178,647.4 183,874.7 190,268.3Fuel consum. [MWh] 4,149,834.0 532,108.8 480,614.4 532,107.4 514,823.1 339,279.2 7,330.3 18,534.5 89,742.5 92,087.1 498,724.1 513,316.9 531,165.7Peak [MW] 715.200 715.200 715.200 715.200 715.200 715.200 457.369 690.020 690.020 705.686 715.200 715.200 715.200
Fuel consumption: WasteFuel consum. [ton] 1,538,305.4 139,531.9 126,028.8 139,531.9 135,030.9 139,531.9 126,104.9 126,338.1 94,125.0 97,987.5 139,531.9 135,030.9 139,531.9Fuel consum. [MWh] 4,486,724.2 406,968.0 367,584.0 406,968.0 393,840.0 406,968.0 367,805.9 368,486.2 274,531.2 285,796.8 406,968.0 393,840.0 406,968.0Peak [MW] 547.000 547.000 547.000 547.000 547.000 547.000 547.000 547.000 547.000 547.000 547.000 547.000 547.000
Fuel consumption: FueloilFuel consum. [Ton] 0.0 0.0 0.0 0.0 0.0 0.0 0.0 0.0 0.0 0.0 0.0 0.0 0.0Fuel consum. [MWh] 0.0 0.0 0.0 0.0 0.0 0.0 0.0 0.0 0.0 0.0 0.0 0.0 0.0Peak [MW] 0.000 0.000 0.000 0.000 0.000 0.000 0.000 0.000 0.000 0.000 0.000 0.000 0.000


![Aalborg University Copenhagenprojekter.aau.dk/projekter/files/202015903/Breath_Pacing...The centre figure contracts and expands to guide breathing. Im-agefrom[5] (c) Screen image,](https://static.fdocuments.us/doc/165x107/6045d25750aee7264c0d3e2e/aalborg-university-the-centre-igure-contracts-and-expands-to-guide-breathing.jpg)