THERMAL DIGITAL TERRAIN MODEL OF A COAL SPOIL TIP – A …
10
170 INTRODUCTION Spoil tips are anthropomorphic terrain struc- tures built out of leftover materials from under- ground or open pit mining [Yun-jia et al., 2008]. Usually the term spoil tips refers to those build out of unusable particles from coal exploration. As such, they consist mostly of slate and vari- ous types of sandstone or mudstone. The process of obtaining coal is never 100% effective. That is why they also have some amount of coal and, what is more important, coal dust. Coal dust is highly explosive, and flammable, if mixed with oxygen. Creating right conditions that would al- low for this reaction to take place takes time and usually happens in inner layers of the tip, this is why they usually burn from inside out. Due to that it may take up to a few years before flames become visible on the surface. When monitoring is done properly, the oxygen can be cut off and the fire can be stopped before it reaches the surface. The proper monitoring is crucial in diagnos- ing the state of the tip. In Poland it is often done still with traditional methods. They include walk- THERMAL DIGITAL TERRAIN MODEL OF A COAL SPOIL TIP – A WAY OF IMPROVING MONITORING AND EARLY DIAGNOSTICS OF POTENTIAL SPONTANEOUS COMBUSTION AREAS Paulina Lewińska 1 , Artur Dyczko 2 1 AGH University of Science and Technology, Mickiewicza 30 Str., 30-059 Kraków, Poland, e-mail: lewinska. [email protected] 2 The Mineral and Energy Economy Research Institute of the Polish Academy of Sciences, Wybickiego 7 Str., 31-261 Kraków, Poland Journal of Ecological Engineering Volume 17, Issue 4, Sept. 2016, pages 170–179 DOI: 10.12911/22998993/64605 Research Article ABSTRACT Spoil tips are anthropomorphic terrain structures built out of leftover materials from underground or open pit mining. Usually the term spoil tips refers to those build out of unusable particles from coal exploration. As such they consist mostly of slate and various types of sandstone or mudstone. But also include some amount of coal and, what is more important, coal dust. Fires of spoil tips are dangerous to the environ- ment and humans. They can cause degradation of air, and water qualities. Sometimes degradation to the environment can be irreversible. The presented survey was done in two stages. the first included creating a general terrain model. This was done with the use of long range laser scanner. The second step was a more detailed analysis of spatial and temperature conditions. Two measuring seasons ware performed. The first included a survey made with a short range laser scanner and a hand-held inferred cam- era. The obtained point cloud was supplemented with temperature value with the use of software and hardware provided by the authors. The visualization of 3D discreet thermal model was done in Bentley MicrioStation. The second included a usage of Z+F IMAGER 5010 laser scanner equipped with T-Cam Rev 1.0 thermal camera in- sole. A new and unique device that connects laser scanner with infrared camera. This season also provide a point cloud with attached temperature value of measured points. This article provides the description of those two methods including a comparison of their effectiveness and costs. It also describes the heat conditions occurring on spoil tip of Lubelski Węgiel „Bogdanka” S.A coal mine surveyed in December 2015. Keywords: spoil tips, infrared, spontaneous combustion, monitoring, thermal DTM. Received: 2016.07.01 Accepted: 2016.08.09 Published: 2016.09.30
Transcript of THERMAL DIGITAL TERRAIN MODEL OF A COAL SPOIL TIP – A …

170
INTRODUCTION
Spoil tips are anthropomorphic terrain struc-tures built out of leftover materials from under-ground or open pit mining [Yun-jia et al., 2008]. Usually the term spoil tips refers to those build out of unusable particles from coal exploration. As such, they consist mostly of slate and vari-ous types of sandstone or mudstone. The process of obtaining coal is never 100% effective. That is why they also have some amount of coal and, what is more important, coal dust. Coal dust is
highly explosive, and flammable, if mixed with oxygen. Creating right conditions that would al-low for this reaction to take place takes time and usually happens in inner layers of the tip, this is why they usually burn from inside out. Due to that it may take up to a few years before flames become visible on the surface. When monitoring is done properly, the oxygen can be cut off and the fire can be stopped before it reaches the surface.
The proper monitoring is crucial in diagnos-ing the state of the tip. In Poland it is often done still with traditional methods. They include walk-
THERMAL DIGITAL TERRAIN MODEL OF A COAL SPOIL TIP – A WAY OF IMPROVING MONITORING AND EARLY DIAGNOSTICS OF POTENTIAL SPONTANEOUS COMBUSTION AREAS
Paulina Lewińska1, Artur Dyczko2
1 AGH University of Science and Technology, Mickiewicza 30 Str., 30-059 Kraków, Poland, e-mail: lewinska. [email protected] The Mineral and Energy Economy Research Institute of the Polish Academy of Sciences, Wybickiego 7 Str.,
31-261 Kraków, Poland
Journal of Ecological EngineeringVolume 17, Issue 4, Sept. 2016, pages 170–179DOI: 10.12911/22998993/64605 Research Article
ABSTRACTSpoil tips are anthropomorphic terrain structures built out of leftover materials from underground or open pit mining. Usually the term spoil tips refers to those build out of unusable particles from coal exploration. As such they consist mostly of slate and various types of sandstone or mudstone. But also include some amount of coal and, what is more important, coal dust. Fires of spoil tips are dangerous to the environ-ment and humans. They can cause degradation of air, and water qualities. Sometimes degradation to the environment can be irreversible. The presented survey was done in two stages. the first included creating a general terrain model. This was done with the use of long range laser scanner. The second step was a more detailed analysis of spatial and temperature conditions. Two measuring seasons ware performed. The first included a survey made with a short range laser scanner and a hand-held inferred cam-era. The obtained point cloud was supplemented with temperature value with the use of software and hardware provided by the authors. The visualization of 3D discreet thermal model was done in Bentley MicrioStation. The second included a usage of Z+F IMAGER 5010 laser scanner equipped with T-Cam Rev 1.0 thermal camera in-sole. A new and unique device that connects laser scanner with infrared camera. This season also provide a point cloud with attached temperature value of measured points. This article provides the description of those two methods including a comparison of their effectiveness and costs. It also describes the heat conditions occurring on spoil tip of Lubelski Węgiel „Bogdanka” S.A coal mine surveyed in December 2015.
Keywords: spoil tips, infrared, spontaneous combustion, monitoring, thermal DTM.
Received: 2016.07.01Accepted: 2016.08.09Published: 2016.09.30
171
Journal of Ecological Engineering Vol. 17(4), 2016
ing on the tip and observing the difference in the growth of vegetation and in winter, the difference in speed of snow cover melting process. During inspections the crew is looking for voids that can indicate that either water have reached bottom layer or a fire has burned flammable elements off. Modern methods include measuring temperature of the object with proper probe at one meter be-low the surface. Those measurements are being done in spaces that is determined by the size of the object. A measuring session should be done at least in monthly periods. During that measure-ment chemical components of gases inside the tip are also being determined. The amount of oxy-gen, carbon monoxide or dioxide and changes in its percentage are a good indicator of physical and chemical processes that can happen inside the tip. This method is expensive and involves a person-nel dwell on an unsafe object without proper in-formation on its stability.
Other ways of monitoring include remote sensing. Since the differences of temperature are most important infrared thermography can be used. Usually there are two approaches used for this kind of objects. Either pictures are done from the air or from the ground. If the object is clear, there are no, or young trees airborne ther-mography is more useful. It allows for covering vast amounts of land fast and with the usage of new software gives detail information almost instantaneously. This method is also very useful if the fire is near to the surfaces or reaches high temperatures in comparison to surrounding rocks. In this case even small plant life on top of the tip should not be an obstacle in proper diagnosing fire hazard. Terrestrial thermography can be used for smaller or more complicated objects. Also if it is needed to do a more detailed survey or the con-trast of temperatures is lower this method can be used. What is more it can be done almost without any preparation, it does not require good flying conditions just access to the tips surroundings.
Up until recently infrared pictures were hard to calibrate and georeferenced. Nowadays, soft-ware has changed so much that it is no longer time-consumingand demanding, provided some extra conditions are fulfilled. It has become easier to create a thermal orthophoto with correct coor-dinates. Such a map allows for better planning of all fire extinguish actions since now it can be determinate with high accuracy where the center of such hazard is. Also now it is much easier to create a 3D discrete spatial model of the object.
This can be done either by terrestrial or airborne laser scanners. It is also possible to get point cloud from correctly done pictures. Covering this model with colors from infrared pictures allows for creating a 3D thermal terrain model so called thermal Digital Terrain Modell. Again, this can be done in various airborne and terrestrial methods or a combination of those two. This article shows some of terrestrial methods in monitoring of spoil tip of Bogdanka coal mine.
COAL SPOIL TIP AT LW BOGDANKA
Lubelski Węgiel „Bogdanka” S.A. is one of the hard coal mines in Poland. It is located in Lubelskie Coal Basin (LZW) in the east part of Poland near Ukrainian border. The deposit has a seemingly simple structure with almost horizon-tal coal beds and rock layers with lack of signifi-cant faults. Also there is almost no methane in the ore or surrounding rocks. The biggest issue that Bogdanka coal mine is facing is maintenance of quality (the calorific value of the produce) and the thickness of the seams. In recent years bet-ter ways of conducting geological profiling and more efficient blending procedures have been implemented. The second issue was addressed by changing the excavation procedures. The thick-ness of the deposit varies from 2.25 m to even 1.20 m or less. This is why since late 2000s not only longwall shearers but also plows are used. Those actions have had a great impact on the quality and quantity of material being stored in the spoil tip belonging to LW Bogdanka [Stopa and Kurek 2016].
Bogdanka coal mine produces two kinds of waste material. One comes directly from ex-cavation process (waste rock appearing during longwall excavation), and drilling new corridors or drafts. Other comes from coal handling and preparation plant. Table 1. Shows the incise of amount of waste material between 2005 and 2012 [Kicki and Sobczyk 2016] .
Not all of this material is stored on the spoil tip. However, as it can be seen in Table 2. The quantity of material has been growing fast be-tween 2005 and 2012. Since the mine is bordering various ecologically protected areas a great em-phasis has been put in to using waste rock in en-vironmental friendly ways. This is why it is used

Journal of Ecological Engineering Vol. 17(4), 2016
172
as a landfill material. Also in order to stay in good relation with local authorities the material has been used for rebuilding roads and building sport venues for local schools. One of more innovative ways of utilising waits material was „Ekoklinki-er” clinker brick factory [Stopa and Kurek 2016].
The rest of the material is stored on a spoil tip located in the area belonging to Bogdanka coal mine. The stored material consists of claystone and mudstone. This includes 35% of claystone of non or minimum cleavage with little organic mat-ter, 20% of dark grey shale and claystone with clear cleavage with higher content of organic matter, 20% of grey mudstone with no cleavage, 10% of siderite. 15% of mudstone and sandstone. The average grainsize is as follows 40–50% of coarse gravel (200÷20 mm), 30–40% of sand (20–0.5 mm) and slit (less than 0.5 mm) [Kicki and Sobczyk 2016].
Spoil tip is located in municipality of Pu-chaczów and currently occupies 88.56 ha of area. The actual tip covers 76 ha the rest is being used for access roads and drainage ditch. The current height of the object is between 16 and 29 metres. South-West part of the tip is plated with various
kinds of trees in order to ensure slopes stability. The trees age various from 12 to 20 years. Also a small reservoir occupies middle of the tip, how-ever is being slowly covered with waste material. Most of bulking is currently done in the East part where two stackers are being placed. Material is transported to the bottom of the tip by trucks. It is stocked initially in containers connected with conveyor that transports it to the stackers. The material is then distributed and solidified by spe-cial crawler bulldozers.
There have been some plans made for bring-ing the tip to public use after the storing is done. Plans done 2012 assume that the tip is going to be used in 3 ways. When the tip reaches the planned height of 80 metres, part of it is going to be con-verted in to a piste and a proper ski lift and luge track will be build. The part that reaches the height of 60 metres will be converted in to an open-air museum consisting of translocated historical building and huts of this region. The last part with planned height of 90 metres is going to be trans-formed into a park or a forest. In order to reach those goals a soil cover is going to placed and proper plants provided [Stopa and Kurek 2016].
Table 2. Amount of waste material utilised between 2005 and 2012 [Kicki and Sobczyk 2016]
Year Waste material Total number (Mg)
Waste material utilised on the surface (Mg)
Waste material stored on a spoil tip (Mg)
2005 2,619,039.44 2,524,396.34 138,499.14
2006 3,074,492.22 2,532,923.72 541,568.50
2007 3,337,444.14 2,872,958.64 464,485.50
2008 3,047,322.68 2,432,345.48 614,977.20
2009 3,788,149.68 1,496,494.28 1,750,000.00
2010 3,288,947.88 2,403,274.28 1,427,329.00
2011 4,050,084.64 2,092,779.68 1,750,000.00
2012 4,742,458.25 2,554,470.50 2,395,292.71
Table 1. The number of waste material between 2005 and 2012 [Kicki and Sobczyk 2016]
YearWaste material Total number
(Mg)
Waste material Coal handling and preparation
plant (Mg)
Waste material Excavation Process
(Mg)2005 2,619,039.44 2,168,834.89 450,204.55
2006 3,074,492.22 2,610,271.40 464,220.82
2007 3,337,444.14 2,926,536.82 410,907.32
2008 3,047,322.68 2,568,598.02 478,724.66
2009 3,788,149.68 3,200,198.08 587,951.60
2010 3,288,947.88 2,547,738.98 741,208.90
2011 4,050,084.64 3,362,872.34 687,212.30
2012 4,742,458.25 4,096,022.05 646,436.20
173
Journal of Ecological Engineering Vol. 17(4), 2016
REMOTE WAYS OF ESTABLISHING TEMPERATURE
There are numerous ways of obtaining the temperature of an object. The methods differ to contact and remote. The biggest disadvantage of contact methods, in regard to large object, is that the result of such measurement is a discreet tem-perature model. It is important to choose an ap-propriate number of places where the temperature can be taken and also to make the measurements in the same weather conditions. This can prove to be difficult since the temperature is unknown before it is measured. The other problem might be placing the thermometer on the object. It might be too steep or there might not be access due to safe-ty reasons. This is why usually in order to obtain temperature of lager areas it is necessary to use remote methods, namely infrared thermography [Madura 2004].
Remote thermography does not require direct contact or access of the survey team to the mea-sured object. Inferred cameras detect and mea-sure the radiation in the long-infrared range of the electromagnetic spectrum. The detector registers the heat radiation. Then the equations that bound the heat emitted from the object with its tempera-ture are being used. Usually Stefan-Boltzmann or Planks law is applied [Madura 2004].
The cameras used in thermography mea-sure the strength of emission of electromagnetic waves (that come from a certain direction) that fall on to detector in the long-infrared range of the spectrum. The temperature, its value, depends on the strength of received signal. This is called radi-ation flux. All objects emit a certain electromag-netic strength of long-infrared wave. This means that if ground, buildings, cars or even clouds get in the way that the cameras detector is aiming at, it will get additional inferred radiation from them. This can make the measured temperature less reliable. What is more, also the atmosphere in which the object undergoing survey is placed has its temperature, ergo it emits a wave that is also added to the measured spectrum. One of the prop-erties that the atmosphere is known for is empha-sizing and, or filtering some part of the spectrum that goes thru it. This can be best described by the following equation:
𝑠𝑠 = 𝐴𝐴[𝜀𝜀𝜀𝜀𝑀𝑀𝑜𝑜𝑜𝑜 + (1 − 𝜀𝜀)𝜀𝜀𝑀𝑀𝑎𝑎 + (1 − 𝜀𝜀)𝑀𝑀𝑎𝑎𝑎𝑎𝑎𝑎] (1)where: ɛ – emissivity of the surveyed object (var-
ies from 0 to 1), τ – earths atmospheric transition,
Mob, Ma, Matm – radiation flux respec-tively measured object, surroundings and atmosphere,
A – cameras constants representing the cameras ability of converting the signal in the detector and straighten it in optical reading part [Więcek and De Mey 2010].
Emissivity is usually being described as ratio of radiant exitance of measured surface to radiant exitance of a black body assuming that they are bought in the same temperature.
Planck’s law describes the electromagnetic radiation emitted by a black body at a defined temperature with wavelength between λ and λ + Δλ (with Δλ → 0). It is given by
𝑀𝑀𝑜𝑜𝑜𝑜(𝜆𝜆, 𝑇𝑇) = ɛ 2𝑐𝑐2ℎ𝜋𝜋
𝜆𝜆5 [𝑒𝑒ℎ𝑐𝑐
𝜆𝜆𝜆𝜆𝜆𝜆 − 1] (2)
where: h – Planck constant, T – objects temperature given in Kelvins, c – speed of light in vacuum, k – Boltzmann constant [10].
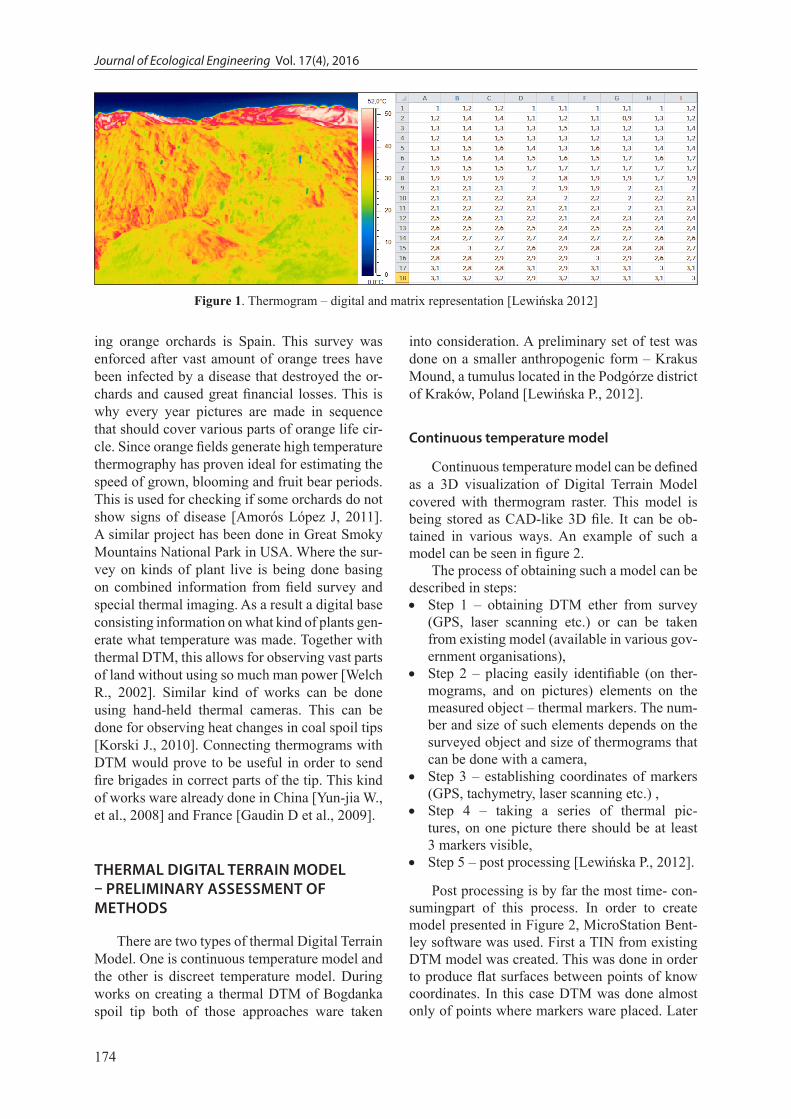
Infrared cameras allow to create thermograms digitally, picture version but also as an array or matrix (Fig. 1). The matrix dimensions relate to the number of pixels in the thermogram, columns and rows. The cells of the matrix relate to the pix-els of thermograms. The coordinate system in the matrix is the same as in the thermal picture and it is being represented by the row, column number X, Y coordinate respectively. The matrix version of the theramogram can be easily manipulated and converted [Lewińska 2012].
Before making any thermal survey the camera needs to be appropriately prepared by implement-ing into it information on surroundings tempera-ture, emissivity of the measured object, humidity and also a distance between camera and the object [Madura 2004].
THERMAL DIGITAL TERRAIN MODEL
Digital Terrain Model (DTM) is a 3D rep-resentation of a terrain’s surface. It is usually defined as a discreet representation of terrains height and includes and interpolation algorithm that would allow to recreate its shape [Wilson et al. 2000]. Usually, adding temperature to DTM is done from airborne or satellite survey. This is the case for vast parts of land. One of the most interesting examples of this process is monitor-
Journal of Ecological Engineering Vol. 17(4), 2016
174
ing orange orchards is Spain. This survey was enforced after vast amount of orange trees have been infected by a disease that destroyed the or-chards and caused great financial losses. This is why every year pictures are made in sequence that should cover various parts of orange life cir-cle. Since orange fields generate high temperature thermography has proven ideal for estimating the speed of grown, blooming and fruit bear periods. This is used for checking if some orchards do not show signs of disease [Amorós López J, 2011]. A similar project has been done in Great Smoky Mountains National Park in USA. Where the sur-vey on kinds of plant live is being done basing on combined information from field survey and special thermal imaging. As a result a digital base consisting information on what kind of plants gen-erate what temperature was made. Together with thermal DTM, this allows for observing vast parts of land without using so much man power [Welch R., 2002]. Similar kind of works can be done using hand-held thermal cameras. This can be done for observing heat changes in coal spoil tips [Korski J., 2010]. Connecting thermograms with DTM would prove to be useful in order to send fire brigades in correct parts of the tip. This kind of works ware already done in China [Yun-jia W., et al., 2008] and France [Gaudin D et al., 2009].
THERMAL DIGITAL TERRAIN MODEL – PRELIMINARY ASSESSMENT OF METHODS
There are two types of thermal Digital Terrain Model. One is continuous temperature model and the other is discreet temperature model. During works on creating a thermal DTM of Bogdanka spoil tip both of those approaches ware taken
into consideration. A preliminary set of test was done on a smaller anthropogenic form – Krakus Mound, a tumulus located in the Podgórze district of Kraków, Poland [Lewińska P., 2012].
Continuous temperature model
Continuous temperature model can be defined as a 3D visualization of Digital Terrain Model covered with thermogram raster. This model is being stored as CAD-like 3D file. It can be ob-tained in various ways. An example of such a model can be seen in figure 2.
The process of obtaining such a model can be described in steps: • Step 1 – obtaining DTM ether from survey
(GPS, laser scanning etc.) or can be taken from existing model (available in various gov-ernment organisations),
• Step 2 – placing easily identifiable (on ther-mograms, and on pictures) elements on the measured object – thermal markers. The num-ber and size of such elements depends on the surveyed object and size of thermograms that can be done with a camera,
• Step 3 – establishing coordinates of markers (GPS, tachymetry, laser scanning etc.) ,
• Step 4 – taking a series of thermal pic-tures, on one picture there should be at least 3 markers visible,
• Step 5 – post processing [Lewińska P., 2012].
Post processing is by far the most time- con-sumingpart of this process. In order to create model presented in Figure 2, MicroStation Bent-ley software was used. First a TIN from existing DTM model was created. This was done in order to produce flat surfaces between points of know coordinates. In this case DTM was done almost only of points where markers ware placed. Later
Figure 1. Thermogram – digital and matrix representation [Lewińska 2012]

175
Journal of Ecological Engineering Vol. 17(4), 2016
on, triangles ware cut from original thermograms and placed in triangles from TIN.
This type of thermal DTM has a very good special representation that allows to get instant visual estimation of existing temperature condi-tions. However it has some disadvantages. If the user needs to obtain temperature they need to read coordinates of the point manually and then look at the scale attached to the model in order to read the valie. What is more there is no matrix ver-sion of this model. Visualisation must be done in a proper 3D graphic software. Also the software must be able to read raster files along with spacial files. Time of post processing is relatively long since every single triangle must be cut manually [Lewińska P., 2012]. His model could be used to see changes in spoil tips surface in long term observations. In can be georeferenced, moved and rotated. Also 2 or 3 such models can be seen at the same time and if set correct transparency is set a growth of potential heat sources is vis-ible. What is more, it is possible to calculate a volume of the tip and also measure the differ-ence in volume. This can be useful if some part of the land would subside.
Discreet temperature model
Discreet temperature model can be described as a matrix of X, Y, Z spatial coordinates and T temperature value. This model is stored as a .txt type file thus making this version more diverse. This model can be obtained automatically or semi-automatically by two methods:
Method 1
Feld survey consist of similar steps as de-scribed in section 5.1. The only difference be-ing the way of taking infrared pictures. Digital photogrammetry method is used, however, some
properties that diverse infrared images from real light pictures need to be taken in to consideration. First, and most troublesome attribute is the num-ber of pixels. Camera used for this project had 240x360 resolution of image, such devices do not have high pictures size as a rule. The price of creating an inferred detector determines the cost of the camera, and thus there is little market for those with bigger pixel size. What is more, the lens usually has only digital zoom options, not allowing for creating sharp pictures from large distance. It forces the user to take may images in order to get full coverage of surveyed object. Adding wide-angle lens allows for taking a small-er number or inferred images but gives a large fish-eye effect. Reducing this effect with pictures with such a small number of pixels produces blur-ry image, whose edges are ruled to be unusable and need to be cut off.
Photogrammetry methods allow for con-verting field coordinates of elements visible on a single picture to image coordinate system. In other words, if a certain object is visible in the image, and its 3D (X,Y,Z) coordinates know it is possible to calculate its coordinates in a 2D im-age coordinate system (x,y). In case of infrared pictures if (x,y) coordinate is known, it means that a specific cell within temperature matrix is known and the numerical value of the tempera-ture can be read.
However, in order to recalculate the (X,Y,Z) coordinates of every point visible on an image a specific equation needs to be provided. In order to get this equation a photogrammetry method has to be chosen and some initial data provided. Usu-ally this term stands for a number of points on the picture that can be identified in the field and on the picture. The accuracy of determination of the coordinates of those points determinates the ac-
Figure 2. Thermogram – digital and matrix representation [Lewińska 2012]
Journal of Ecological Engineering Vol. 17(4), 2016
176
curacy of the equation. This is easy in visible light pictures but infrareds do not have sharp edges so the image appears blurry, thus creating ambiguity with choosing points. What is more, when pic-turing topographical objects there are almost no naturally occurring elements with radically dif-ferent temperature. It was necessary to construct and place on the object elements that would hold a constant temperature, could be seen on thermo-grams and there field coordinates easy to deter-mine. Such points ware called thermal markers.
In order to recalculate the field coordinates in to image coordinates a number of such points must be visible on the thermogram. In case of this study an algorithm called Direct Liner Transfor-mation (DLT) was used but other approaches or more advanced versions of DLT are possible to use. It would be also possible to lessen a number of those points if camera was calibrated properly and its coordinates know. This option was ruled out because of problems with calibration and measuring the height and coordinates of cam-era during taking images. Described conditions would limit the localisation of camera stations and prolong the measurement [Abdel-Aziz Y.I., Karara H.M., 1971].
In order to avoid manually looking thru ther-mograms for thermal markers a Matlab script was written that allows the user to identify points on the object that represent temperatures observed on the markers surfaces. The software then estimates the location of the middle point of the marker in the image (by average of x and y coordinate of neighbouring pixels with the same temperature) and this coordinate along with point’s number is then placed in the separate file. Then those points and there (x,y) and (X,Y,Z) coordinates are be-ing used to provide transformation equation. This
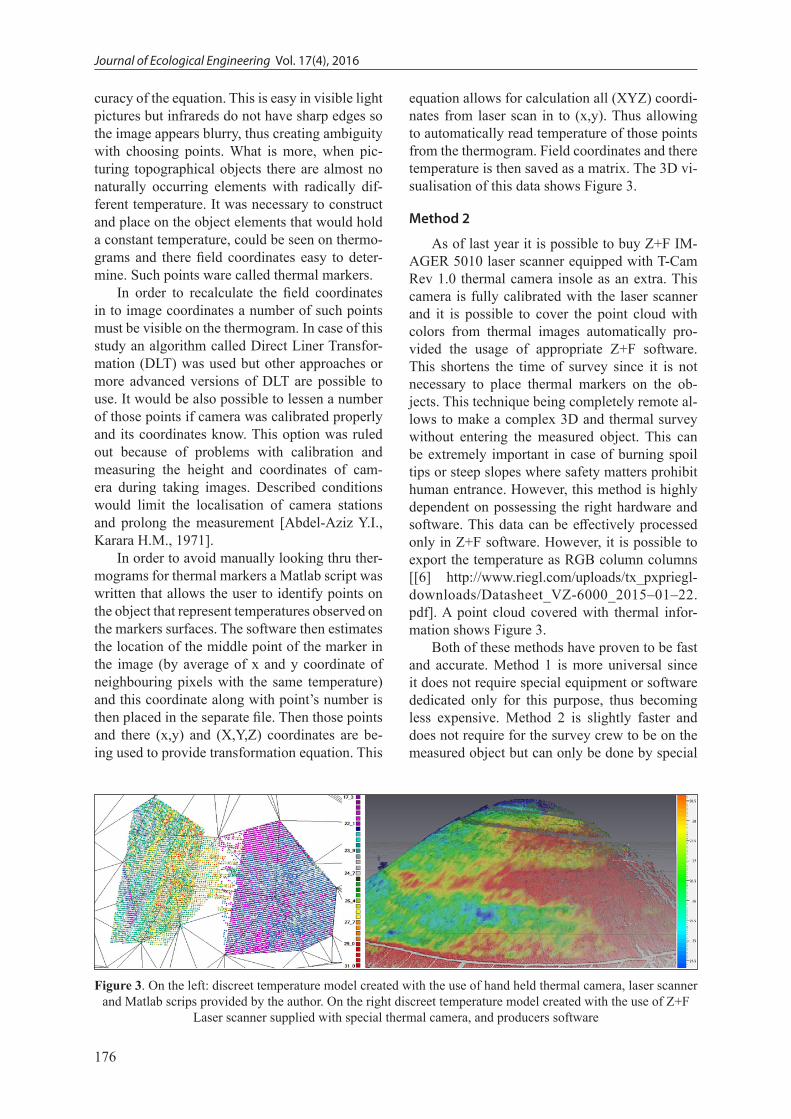
equation allows for calculation all (XYZ) coordi-nates from laser scan in to (x,y). Thus allowing to automatically read temperature of those points from the thermogram. Field coordinates and there temperature is then saved as a matrix. The 3D vi-sualisation of this data shows Figure 3.
Method 2
As of last year it is possible to buy Z+F IM-AGER 5010 laser scanner equipped with T-Cam Rev 1.0 thermal camera insole as an extra. This camera is fully calibrated with the laser scanner and it is possible to cover the point cloud with colors from thermal images automatically pro-vided the usage of appropriate Z+F software. This shortens the time of survey since it is not necessary to place thermal markers on the ob-jects. This technique being completely remote al-lows to make a complex 3D and thermal survey without entering the measured object. This can be extremely important in case of burning spoil tips or steep slopes where safety matters prohibit human entrance. However, this method is highly dependent on possessing the right hardware and software. This data can be effectively processed only in Z+F software. However, it is possible to export the temperature as RGB column columns [[6] http://www.riegl.com/uploads/tx_pxpriegl-downloads/Datasheet_VZ-6000_2015–01–22.pdf]. A point cloud covered with thermal infor-mation shows Figure 3.
Both of these methods have proven to be fast and accurate. Method 1 is more universal since it does not require special equipment or software dedicated only for this purpose, thus becoming less expensive. Method 2 is slightly faster and does not require for the survey crew to be on the measured object but can only be done by special
Figure 3. On the left: discreet temperature model created with the use of hand held thermal camera, laser scanner and Matlab scrips provided by the author. On the right discreet temperature model created with the use of Z+F
Laser scanner supplied with special thermal camera, and producers software

177
Journal of Ecological Engineering Vol. 17(4), 2016
equipment and requires software provided by the maker of the hardware.
Table 3 shows 3 described methods from a practical point of view. Creating discreet tem-perature model has proven to be much faster and more accurate than creating a continuous model. What is more it is more mobile, easy to open and edit in differed types of software. Also the 3D visualisation is almost as good as in continuous model (Figures 2, 3).
3D THERMAL INVENTORY OF COAL SPOIL TIP AT LW BOGDANKA
Thermal inventory of Bogdanka spoil tip was done in December 2015. It was supposed to pro-vide first real estimation of temperature and 3D condition of the object. The study was done in stages.
Firsts stage was a traditional thermal inven-tory on side. It consisted of a walk through the ob-ject and creating a series of infrared images. This was particular important in parts of the tip that was undergoing tree planting in order to provide stability of the slopes. The plants that already grow there are young, up to 12 years old and are almost only leaf trees. Since it was winter they were not a big obstacle for taking images when standing on a tip, however laser scanning would consist of many scan station and take a lot of time. Those slopes ware stable and thermal imag-ing did not show any places that could be viewed as dangerous. This part of the tip was ruled to be safe by the owners of the object and was not taken in to any further consideration.
Middle part of the tip is occupied by a small water reservoir that need to be inspected care-fully due to a small fire that appeared there a few years back. The inferred pictures of his object
ware performed. Also, due to the fact that on side conditions did not allow to place laser scanners there a series of real light pictures ware also done. Those pictures ware connected in to a points cloud and 3D thermal model was performed. This models accuracy was low, it was about 10 – 15 cm, however, it was enough for this particular part of the tip.
The second step consisted of using two methods described in chapter 5. The geometri-cal information was obtained by the use of 3 laser scanners. First of all a 3D spatial discreet model was done with the use of RIEGL VZ-600 laser scanner [http://www.laser-3d.pl/skanery/skanery-riegl/skanowanie-naziemne-riegl/riegl-vz-400]. This particular instrument can measure up to 6 km distance with accuracy of 15 mm. Cowering the tip took four scans and about 4 hours. It gave a general information on geom-etry of the object and its placement in relation to the surroundings. It was also used as a refer-ence scan for point clouds done from pictures and those obtained from other scanners.
After general geometry model was done a de-tailed point cloud was provided with other scan-ners. FARO Focus was used to scan part of the slopes where first method of doing a 3D thermal was used. The maximum distance that this par-ticular unit can measure was about 50 m. It was obtained with a day long season during with 6 markers ware placed on the object, the coordi-nates measured and a season of thermal images, and visible light pictures ware done. There was only one person on the object, responsible for moving the markers. The rest of the crew was kept at a safe distance. the data was implemented in to Matlab scrips created by one of the authors of this article. Matrix of measured coordinates with their temperature was provided. Later in this matrix was imported in to MicroStation, a 3D
Table 3. Comparison of 3 methods of creating a thermal Digital Terrain Model
Type of model ContinuousDiscreet
Method 1 Method 2
Time of measurement 4 h 4h 4h
Time of post processing 40h 3h 1h
Type of matrix data NONE .txt, . xlsx, .xls, etc. .txt, . xlsx, .xls, etcType of 3D visualisation formats .dwg, .dxf .dwg, .dxf, .pts, .pod, etc. .dwg, .dxf, .pts, .pod, etc
Software for post processingDedicated – NONEUniversal – 3D graphic CAD like applications-
Dedicated – NONEUniversal – programming software, 3D graphic CAD like applications
Dedicated ( provided of the maker of the laser scanner)Universal (3D graphic CAD like applications)
Journal of Ecological Engineering Vol. 17(4), 2016
178
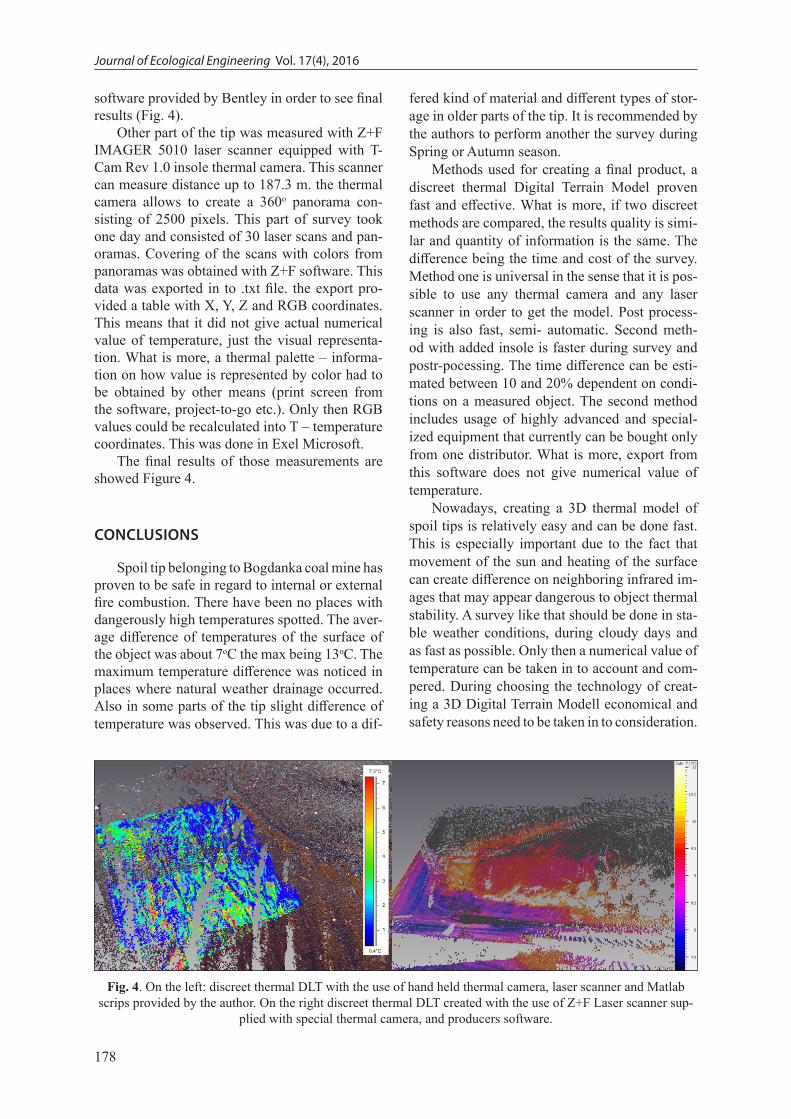
software provided by Bentley in order to see final results (Fig. 4).
Other part of the tip was measured with Z+F IMAGER 5010 laser scanner equipped with T-Cam Rev 1.0 insole thermal camera. This scanner can measure distance up to 187.3 m. the thermal camera allows to create a 360o panorama con-sisting of 2500 pixels. This part of survey took one day and consisted of 30 laser scans and pan-oramas. Covering of the scans with colors from panoramas was obtained with Z+F software. This data was exported in to .txt file. the export pro-vided a table with X, Y, Z and RGB coordinates. This means that it did not give actual numerical value of temperature, just the visual representa-tion. What is more, a thermal palette – informa-tion on how value is represented by color had to be obtained by other means (print screen from the software, project-to-go etc.). Only then RGB values could be recalculated into T – temperature coordinates. This was done in Exel Microsoft.
The final results of those measurements are showed Figure 4.
CONCLUSIONS
Spoil tip belonging to Bogdanka coal mine has proven to be safe in regard to internal or external fire combustion. There have been no places with dangerously high temperatures spotted. The aver-age difference of temperatures of the surface of the object was about 7oC the max being 13oC. The maximum temperature difference was noticed in places where natural weather drainage occurred. Also in some parts of the tip slight difference of temperature was observed. This was due to a dif-
fered kind of material and different types of stor-age in older parts of the tip. It is recommended by the authors to perform another the survey during Spring or Autumn season.
Methods used for creating a final product, a discreet thermal Digital Terrain Model proven fast and effective. What is more, if two discreet methods are compared, the results quality is simi-lar and quantity of information is the same. The difference being the time and cost of the survey. Method one is universal in the sense that it is pos-sible to use any thermal camera and any laser scanner in order to get the model. Post process-ing is also fast, semi- automatic. Second meth-od with added insole is faster during survey and postr-pocessing. The time difference can be esti-mated between 10 and 20% dependent on condi-tions on a measured object. The second method includes usage of highly advanced and special-ized equipment that currently can be bought only from one distributor. What is more, export from this software does not give numerical value of temperature.
Nowadays, creating a 3D thermal model of spoil tips is relatively easy and can be done fast. This is especially important due to the fact that movement of the sun and heating of the surface can create difference on neighboring infrared im-ages that may appear dangerous to object thermal stability. A survey like that should be done in sta-ble weather conditions, during cloudy days and as fast as possible. Only then a numerical value of temperature can be taken in to account and com-pered. During choosing the technology of creat-ing a 3D Digital Terrain Modell economical and safety reasons need to be taken in to consideration.
Fig. 4. On the left: discreet thermal DLT with the use of hand held thermal camera, laser scanner and Matlab scrips provided by the author. On the right discreet thermal DLT created with the use of Z+F Laser scanner sup-
plied with special thermal camera, and producers software.

179
Journal of Ecological Engineering Vol. 17(4), 2016
Acknoledgements
The project was funded by statutory funds of AGH nr 11.11.150.005.
REFERENCES
1. Abdel-Aziz Y.I., Karara H.M., 1971. Direct Linear Transformation from Comparator Coordinates into Object Space Coordinates in Close-range Photo-grammetry. [In:] Proceedings of the Symposium on Close-Range Photogrammetry, American Soci-ety of Photogrammetry, Falls Church.
2. Amorós López J., Izquierdo Verdiguier E., Gó-mez Chova L., Muńoz Marí J., Rodríguez Barreiro J.Z., Camps Valls G., Calpe Maravilla J., 2011. Land cover classification of VHR airborne images for citrus grove identification, 2011, ISPRS Jour-nal of Photogrammetry and Remote Sensing 66, 115–123.
3. Carpentier O., Defer D., Antczak E., 2004. Infrared Thermography Applied to Spontaneous Combus-tion Monitoring of Coal Tips, QIRT Archives.
4. Gaudin D., Delacourt Ch., Allemand P., Jaud M., Ammann J., Tisseau Ch., Cuq V., 2009. High Reso-lution DEM Derived from Thermal Infrared Imag-es: Example of Aber Benoitt (France), Geoscience and Remote Sensing Symposium, IEEE Interna-tional, Vol. 4, Cape Town.
5. Kicki J., Sobczyk E.J. (Eds) Prawne, techniczne, ekonomiczne i środowiskowe aspekty gospodarki skałą płonną w kopalniach węgla kamiennego. Wydawnictwo Instytutu Gospodarki Surowcami Mineralnymi i Energią Polskiej Akademii Nauk zeszyty z serii „Studia, Rozprawy, Monografie’.
6. Korski J., 2010. Termowizja w monitoringu i zwal-czaniu pożarów składowisk odpadów pogórnic-zych, Katowice.
7. Lewińska P., 2012. Zastosowanie termowizji w ciągłym monitoringu składowisk odpadów pogór-niczych. Wiadomości Górnicze.
8. Lewińska P., 2012. Use of Thermography for Envi-ronmental Monitoring. Sankt-Petersburg.
9. Madura H., 2004. Pomiary termowizyjne w prak-tyce. Agenda Wydawnicza PAKu, Warszawa.
10. Roy Welch R., Madden M., Jordan T., 2002. Pho-togrammetric and GIS techniques for the develop-ment of vegetation databases of mountainous ar-eas: Great Smoky Mountains National Park. PRS Journal of Photogrammetry & Remote Sensing, 57, 53–68.
11. Stopa Z., Kurek S., 2016. LW „Bogdanka” S.A. – 40 lat działania na drodze postępu i innowacji. Miesięcznik Wyższego Urzędu Górniczego, Katowice, nr 1.
12. Więcek B., De Mey G., 2010. Termowizja w pod-czerwieni. Podstawy i zastosowania. Politechnika Łódzka, Łódz.
13. Wilson J.P.; Gallant J.C. 2000. Chapter 1. In: Wil-son J.P. and Gallant J.C. (Eds.). Terrain Analysis: Principles and Applications. New York: Wiley, 1–27 (Retrieved 2007–02–16).
14. Wróbel A., Mularz St., 2003. Badanie rozkładu temperatury powierzchni terenu z wykorzystaniem zobrazowań termowizyjnych. Archiwum Foto-grametrii, Kartografii i Teledetekcji, Wrocław.
15. Wasilewski S., Chrobak T., 2011. Zdalne pomi-ary temperatury w ocenie aktywności termicznej składowisk odpadów węglowych. Górnictwo i Geologia.
16. Yun-jia W., Yao-bin S., Qiang G., Yue-yue S., Xiu-jun W., Zhi-jie Z., 2008. Infrared Thermography Monitoring and Early Warning of the Spontane-ous Combustion of Coal Gangue Pile. PSPRS Ar-chives, Vol. 37B.
17. http://www.riegl.com/uploads/tx_pxpriegldown-loads/Datasheet_VZ-6000_2015–01–22.pdf
18. http://www.laser-3d.pl/skanery/skanery-riegl/skanowanie-naziemne-riegl/riegl-vz-400
19. http://www.faro.com/pl-pl/produkty/geodezja-3d/skaner-laserowy-faro-focus-3d/przeglad
Pracę dofinansowano ze środków Wojewódzkiego Funduszu Ochrony Środowiska i Gospodarki Wodnej w Lublinie.