Thermal conductivity of MoS2 monolayers from molecular...
7
AIP Advances 9, 035042 (2019); https://doi.org/10.1063/1.5085336 9, 035042 © 2019 Author(s). Thermal conductivity of MoS 2 monolayers from molecular dynamics simulations Cite as: AIP Advances 9, 035042 (2019); https://doi.org/10.1063/1.5085336 Submitted: 11 December 2018 . Accepted: 07 March 2019 . Published Online: 25 March 2019 Aravind Krishnamoorthy, Pankaj Rajak, Payam Norouzzadeh, David J. Singh , Rajiv K. Kalia, Aiichiro Nakano , and Priya Vashishta ARTICLES YOU MAY BE INTERESTED IN Development of a water level sensor using magnetostrictive materials AIP Advances 9, 035119 (2019); https://doi.org/10.1063/1.5079508 Sliding friction between two silicon-carbide surfaces Journal of Applied Physics 125, 124301 (2019); https://doi.org/10.1063/1.5086185
Transcript of Thermal conductivity of MoS2 monolayers from molecular...
AIP Advances 9, 035042 (2019); https://doi.org/10.1063/1.5085336 9, 035042
© 2019 Author(s).
Thermal conductivity of MoS2 monolayersfrom molecular dynamics simulationsCite as: AIP Advances 9, 035042 (2019); https://doi.org/10.1063/1.5085336Submitted: 11 December 2018 . Accepted: 07 March 2019 . Published Online: 25 March 2019
Aravind Krishnamoorthy, Pankaj Rajak, Payam Norouzzadeh, David J. Singh , Rajiv K. Kalia, Aiichiro
Nakano , and Priya Vashishta
ARTICLES YOU MAY BE INTERESTED IN
Development of a water level sensor using magnetostrictive materialsAIP Advances 9, 035119 (2019); https://doi.org/10.1063/1.5079508
Sliding friction between two silicon-carbide surfacesJournal of Applied Physics 125, 124301 (2019); https://doi.org/10.1063/1.5086185

AIP Advances ARTICLE scitation.org/journal/adv
Thermal conductivity of MoS2 monolayersfrom molecular dynamics simulations
Cite as: AIP Advances 9, 035042 (2019); doi: 10.1063/1.5085336Submitted: 11 December 2018 • Accepted: 7 March 2019 •Published Online: 25 March 2019
Aravind Krishnamoorthy,1,a) Pankaj Rajak,1,a) Payam Norouzzadeh,2 David J. Singh,2 Rajiv K. Kalia,1Aiichiro Nakano,1 and Priya Vashishta1,b)
AFFILIATIONS1Collaboratory for Advanced Computing and Simulations, University of Southern California, Los Angeles, California 90089, USA2Department of Physics and Astronomy, University of Missouri-Columbia, Columbia, Missouri 65211-7010, USA
a)Contributions: Authors contributed equallyb)Corresponding author, [email protected]
ABSTRACTQuantification of lattice thermal conductivity of two-dimensional semiconductors like MoS2 is necessary for the design of electronic andthermoelectric devices, but direct experimental measurements on free-standing samples is challenging. Molecular dynamics simulations, withappropriate corrections, can provide a reference value for thermal conductivity for these material systems. Here, we construct a new empiricalforcefield of the Stillinger-Weber form, parameterized to phonon dispersion relations, lattice constants and elastic moduli and we use it tocompute a material-intrinsic thermal conductivity of 38.1 W/m-K at room temperature and estimate a maximum thermal conductivity of 85.4W/m-K at T = 200 K. We also identify that phonon scattering by the large isotopic mass distribution of Mo and S contributes a significantcorrection (>45%) to the thermal conductivity at low temperatures.
© 2019 Author(s). All article content, except where otherwise noted, is licensed under a Creative Commons Attribution (CC BY) license(http://creativecommons.org/licenses/by/4.0/). https://doi.org/10.1063/1.5085336
In-plane thermal transport is an important consideration forthe design of nanoelectronic and thermoelectric devices made fromlayered and two-dimensional (2D) materials which possess some ofthe lowest out-of-plane thermal boundary conductance for solid-solid interfaces.1 Lattice thermal conductivity also determines thethermal profile of growing two-dimensional crystals in exothermicsynthesis techniques like chemical vapor deposition and is an impor-tant metric for the fabrication of energy harvesting devices basedon the thermoelectric effect.2–4 Despite this importance, defini-tive experimental measurements of fundamental thermal proper-ties of these materials like lattice thermal conductivity have notbeen conclusive. The primary experimental challenges, as detailedin recent reviews,2,5 stem from difficulties in accurately measur-ing temperature gradients on atomic length scales in suspendedmonolayer samples. Further, thermal conductivity of suspendedmonolayers and sub-nm-thin materials is greatly quenched (by upto 85%) when these monolayers are supported on a substrate orare investigated using contact-probes.6,7 Even state-of-the art non-contact techniques for thermal conductivity measurement like opto-thermal Raman are undermined by several implicit assumptions
about optical absorption and equilibrium of phonon modes8 andare affected by heat losses to the environment9 leading to largeerrors in reported values of thermal conductivity.10–12 Further, suchtechniques involving localized laser heating can only be used toinvestigate room-temperature and high-temperature thermal con-ductivity and cannot readily access low-temperature regimes.13 Incontrast, atomistic MD simulations are an attractive method for esti-mating temperature-dependent thermal conductivity of suspendedmonolayer systems directly from nm-scale temperature gradients.Specifically, classical non-equilibrium molecular dynamics (NEMD)provides a computationally inexpensive way of computing latticethermal conductivity for monolayer materials, which includes thefull anharmonicity of interatomic forces within a steady-state (i.e.dynamic and non-equilibrium) simulation. Classical NEMD simu-lations offers several advantages over the calculation of lattice ther-mal conductivity by ab initio atomistic simulations. Solutions tothe phonon Boltzmann transport equation from ab initio simu-lations involve strong assumptions about phonon scattering ratesand lifetimes as well as boundary conditions for phonon scatter-ing.14–19 These assumptions are reflected in the large scatter in the
AIP Advances 9, 035042 (2019); doi: 10.1063/1.5085336 9, 035042-1
© Author(s) 2019

AIP Advances ARTICLE scitation.org/journal/adv
reported values of calculated thermal conductivity for 2D materi-als like MoS216,19–25 (Table S1). Further, thermal conductivity val-ues from classical NEMD simulations are consistent with valuesextracted from classical equilibrium MD (EMD) simulations usingGreen-Kubo techniques,26 but have a smaller magnitude of system-atic errors25 (Table S2). However, classical MD simulations ignorethe quantization of vibrational energy levels, which is responsiblefor sub-classical specific heat at low temperatures and correspond-ingly suppressed thermal conductivity. MD simulations in literaturealso fail to account for additional phonon scattering introduced bythe naturally-occurring distribution of isotopic masses. Here, wereport quantum-corrected and isotope-corrected thermal conduc-tivity values for a representative two-dimensional crystal, MoS2,calculated from NEMD simulations using a new forcefield param-eterized to reproduce experimental lattice constants, elastic mod-uli and ab initio calculated phonon dispersion curves. MoS2 is anideal material for thermal conductivity calculations since despiteits widespread use in nano-electronic applications, there is a largescatter in reported values of experimentally determined thermalconductivity ranging from 34 W/m-K to 84 W/m-K at 300 K.27–30
PARAMETERIZATION OF STILLINGER WEBERFORCEFIELD (SWFF)
MD simulations for thermal conductivity require the useof empirical forcefields that can reproduce phonon populations,phonon and sound velocities and phonon mean free paths accu-rately. Similar to previous studies,24,25,31,32 we parameterize aSWFF,33 which models covalent interatomic interactions in theMoS2 2H crystal structure using 2-body and 3-body terms thatmimic energy profiles for bond-stretching and bond-bending (i.e.bond-angle distortion) interactions. The total potential energy of thegiven system of N atoms located at [r1, r2, . . ., rN] in the SWFF canbe written as
E(r1, r2, . . . rN) =∑i<j
V2(rij) + ∑i<j<k
V3(rij, rjk, θijk)
where rij = |rj−ri|. The 2-body term, V2, is defined as
V2(rij) = A⎛
⎝
Brpij− 1
⎞
⎠exp(
γrij − rcut
)
The two-body term is defined by 3 optimizable parameters, A, B andγ. The 3-body term, V3 around a central atom i is given by
V3(rij, rik, θijk) = λ exp(γ1
rij − r1−
γ2
rik − r2)(cos θ − cos θ0)
2
where λ, γ1 and γ2 are optimizable parameters. The exponentialdecay of interatomic energies and the explicitly-defined cutoff dis-tance for interatomic interactions makes the forcefield short-rangedand local, which makes for easier numerical implementation forlarge-scale MD simulations.
All SWFF parameters (A, B, γ, K, γ1 and γ2) are optimized forthe MoS2 crystal structure using the GULP program.34 The remain-ing geometric parameters, namely, the three cutoff distances, rcut ,r1 and r2 and θ0 are obtained directly from ab initio simulations(See Section V of supplementary material). θ0 is the included anglebetween Mo-S-Mo and S-Mo-S triplets and rcut for each pair of
atoms is set equal to 1.5 times the nearest-neighbor distance betweenthose types of atoms in the ideal 2H MoS2 crystal structure. 2-bodyterms are parameterized for all type of atom-pairs: Mo-Mo, Mo-Sand S-S. 3-body terms are parameterized only for the Mo-S-Moand S-Mo-S. Other non-bonded triplets do not contribute to thepotential energy of the crystal. The SWFF is optimized to reproducethree quantities, namely the lattice constant, in-plane elastic con-stants and phonon dispersion curves. During optimization, GULPuses the BFGS scheme to minimize the weighted residuals for thesethree observables.
Residual(x) =Nobs
∑iwi(f DFTi − f SWi (x))
2
where i loops over the lattice constant, the elastic constant andphonon dispersion and f DFT is the DFT-calculated value for observ-able i and f SW(x) is the value obtained from the Stillinger Weberforcefield with the parameter set x.
For the purpose of residual evolution and forcefield optimiza-tion, the phonon dispersion is discretized at 21 points for each bandalong the Γ-M-K-Γ direction. Further, for an accurate calculationof thermal conductivity, it is desirable that the empirical forcefieldaccurately reproduces the behavior of low-energy acoustic phononmodes which are responsible for the bulk of heat conduction at tem-peratures relevant to this study (T = 100 K – 400 K).17 Therefore, inour optimization scheme, the three acoustic branches have a largerweighting factor, wi = 30 for the residual evaluation, compared towi = 1 for the high energy optical modes, which have negligiblecontributions to thermal transport.17
Non-equilibrium molecular dynamics simulations
NEMD simulations are performed with the new SWFF(Tables I and II) using the LAMMPS molecular dynamics pro-gram.35 The simulations are performed on a rectangular monolayerMoS2 single-crystal of dimensions L × 2L with periodic boundary
TABLE I. Two-body terms of the Stillinger-Weber forcefield. The two-body
interaction term has the form V2 = A( Brpij− 1)exp( γ
rij−rcut ).
Interacting Atoms A ρ B rmin rmax
S-S 1.117 0.369 38.564 0.00 4.3463Mo-S 7.098 0.680 9.971 0.00 3.2033Mo-Mo 3.777 0.653 26.272 0.00 4.3463
TABLE II. Three-body angle bending terms in the Stillinger-Weberforcefield. The three-body interaction term has the form V3 =
λ exp( γ1rij−r1
−γ2
rik−r2)(cos θ − cos θ0)
2.
Triplet λ θ0 γ1 = γ2 r12max r13
max r23max
S-Mo-S 7.663 82.4795 0.870 3.2034 3.2034 4.3463Mo-S-Mo 30.230 82.4795 3.482 3.2034 3.2034 4.3463
AIP Advances 9, 035042 (2019); doi: 10.1063/1.5085336 9, 035042-2
© Author(s) 2019

AIP Advances ARTICLE scitation.org/journal/adv
conditions along the x- and y-directions. Atomic positions and sim-ulation cell parameters of the MoS2 monolayer are initially relaxedusing the SWFF until there no net forces on the atoms and no resid-ual stress on the simulation cell. The system is then heated underthe NPT ensemble to the desired target temperature where thermalconductivity is to be measured. Next, as defined in Figure 1, two thin(20Å wide) regions denoted ‘Hot’ and ‘Cold’, which span the entirewidth, L, of the simulation cell are defined at x = 3L/2 and x = L/2. Toestablish a thermal steady state, a fixed energy flux, Q̇, is added to thekinetic energy of atoms in the ‘Hot’ region and an identical energyflux is removed the kinetic energy of atoms in the ‘Cold’ region. Thismethod36,37 allows us to impose arbitrarily small thermal fluxes,in contrast to the momentum-swapping method of reverse non-equilibrium molecular dynamics,38 which can lead to large tempera-ture gradients spanning ∼100 K and non-linear temperature profilesnear the heat source and sink.
At steady state, this technique establishes a gradient in localtemperature between L/2 and 3L/2 with an approximate and smalltemperature gradient of 10-2 K/Å, which falls within the linearregime for Fourier law of heat conduction.24 In these simulations,local (i.e. per-atom) temperature is defined in a classical sense basedon the equation ⟨ 1
2mv2i ⟩ = 3
2kBTi, where the brackets denote aver-ages over time. Alternative definitions of local temperature based onquantification of phonon populations are infeasible due to the largephonon mean free path of MoS2, which is larger than the size of thesimulation cells used in this study.39
NEMD simulations are performed for 24 ns within the NVEensemble, and the temperature profile in the system is obtained fromthe last 12 ns of the simulation, which ensures that a steady statehas been established. Thermal conductivity of the simulation cell isobtained from the Fourier law for heat conduction
κ = −1
2∇T[
Q̇L × t
]
where κ is the thermal conductivity of the MoS2 monolayer and ∇Tis the temperature gradient in the steady-state from the source to thesink due to the energy flux Q̇. L and t are respectively the width andeffective thickness of the MoS2 monolayer and their product is thecross-sectional area through which heat conduction occurs. The fac-tor 1/2 comes from the geometry of the simulation system, whereheat conduction from the ‘Hot’ to ‘Cold’ region occurs along the+x and -x directions. It is important to note that thermal conduc-tivity calculated from Fourier’s law of heat conduction requires an
estimation of the effective thickness, t, through which the heat flux,Q̇, is transported. There are several competing definitions for whatconstitutes the thickness of a two-dimensional crystal.40 In thisstudy, we have chosen the effective thickness of the MoS2 mono-layer to be equal to 6.16 Å, the experimentally calculated interlayerdistance in bulk and multilayer MoS2 samples,41 consistent withprevious studies.17,25
System size dependence in NEMD simulations
Thermal transport in NEMD occurs over two square regionsof size L×L. The dimensions of this artificial system prevent theparticipation of larger mean-free-path phonons in the heat conduc-tion process. Therefore, thermal conductivity values obtained fromNEMD simulations show a strong dependence on the size of thesimulated system, with larger systems resulting in larger calculatedvalues of κ due to the participation of a larger subset of phonons inheat transfer. All NEMD simulations in this study are performed inthe Casimir limit,42 i.e. in the regime where the system size is smallerthan the mean free path, Λ, of acoustic phonons (estimated to bebetween 17.2 nm and 2200 nm for MoS216,17). Therefore, to obtainthe material-intrinsic (i.e. size-independent) thermal conductivity ofthe system, we follow the scaling scheme used by Oligschleger andSchon,43 which invokes Matthiessen’s rule of independent scatter-ing events,44 to extrapolate κ to a (hypothetical) system of infinitesize using the relation below.
1κ=
l0κ0
(1l
+1l0)
where 1/l is the inverse scattering length due to the source-sink dis-tance and 1/l0 is the material-intrinsic inverse scattering length dueto phonon-phonon scattering. The intrinsic size-independent ther-mal conductivity κ0 of the material can be obtained at the limit1/l→ 0. It is important to note that such linear extrapolation schemesin the Casimir regime are extremely sensitive to the size of thesystems used for extrapolation.45
System size dependence of thermal conductivity is evaluated bycalculating thermal conductivity values from NEMD simulations oncrystals of size L×2L where L is one of 19, 30, 40, 60, 144, 200 and300 nm. Figure 2(a) shows the dependence of the computed thermalconductivity at 300 K on simulation cell sizes, reflecting increas-ing thermal conductivity values for larger system sizes. Figure 2(b)demonstrates the system size scaling method based on Matthiessen’s
FIG. 1. Schematic of NEMD simula-tions for thermal conductivity calcu-lation. Thermal energy is added to andremoved from the ‘Hot’ (x = 3L/2) and‘Cold’ (x = L/2) regions respectively in amonolayer MoS2 single crystal of dimen-sions 2L × L which leads to a steady-state thermal profile in the +x and -xdirections.
AIP Advances 9, 035042 (2019); doi: 10.1063/1.5085336 9, 035042-3
© Author(s) 2019

AIP Advances ARTICLE scitation.org/journal/adv
FIG. 2. System size dependence of NEMD thermal conductivity. (a) Calcu-lated thermal conductivity shows a strong dependence on system size with largersimulation cells yielding larger thermal conductivity at 300K. (b) Material intrinsicthermal conductivity of MoS2 can be obtained from the intercept of the inversethermal conductivity against inverse system size.
rule and extracts an intercept value of 1/κMD(300K) = 0.019( WmK )
−1.The large system sizes used in this study up to 300 nm ensure thatlinear extrapolation leads to bulk thermal conductivity predictionsthat lie within 20% of those predicted by lattice dynamics.
Temperature dependence of calculatedthermal conductivity
This procedure is repeated at different temperatures, 100 K,200 K, 300 K and 400 K to obtain κMD(T) (Figure 3(a)). TheseNEMD-calculated thermal conductivity values show a monotonicdecrease with increasing temperatures due to greater phonon popu-lation and correspondingly greater phonon-phonon scattering rates(Figure 3(b)). This trend of decreasing thermal conductivity withincreasing temperature is consistent with experimental measure-ments only at high temperatures above the Debye temperature, θD.One of the most significant drawbacks of NEMD-based calculationsof thermal conductivity is the completely classical nature of the sim-ulation, which is applicable only to solids above θD.39 Therefore,calculated κMD values for T > θD ∼ 263 K46 are realistic, but extrap-olations of this method to low temperatures (∼100 K)24 are notjustified.
FIG. 3. Temperature Scaling. (a) System size scaling of thermal conductivity sim-ulations performed on MoS2 monolayers at four temperatures. Open circles rep-resent the intercept of the linear extrapolation scheme of Oligschleger and Schonfor each temperature. (b) Size-independent thermal conductivity values show amonotonic decrease with increasing temperature due to increased phonon-phononscattering.
Below θD, the quantization of vibrational energy becomes themajor source of error in NEMD-calculated thermal conductivity.Specifically, lattice thermal conductivity of crystals is linearly pro-portional to the lattice specific heat, Cv.
κ =13CvvΛ
where v and Λ are the group velocity and mean free path of phononsrespectively. The specific heat in classical NEMD simulations is con-stant at CMD
v = 3NkB, at all temperatures, which corresponds to thehigh temperature limit of experimental specific heat values, Cq
v(T).Therefore, the non-classical system-level correction to the MD ther-mal conductivity, κMD(T), can be obtained by substituting the classi-cal value of specific heat in κMD(T) with the experimentally realisticvalue of Cq
v(T).
κcorr(T) = κMD(T) ×Cqv(T)CMDv
This empirical system-level correction accounts for the relativeoccupation of different vibrational energy levels and provides agood approximation of κMD at temperatures T < θD. More rig-orous, phonon-mode-specific corrections have been proposed forcrystalline systems, which additionally correct for different relax-ation times and phonon line-widths at different temperatures,47,48
but these corrections are not attempted in our work.
Non-classical specific heat calculations
The quantized vibrational energy of the crystal is given by theequation
⟨E⟩ = ∫ h̵ωBE(ω,T)G(ω)dω
where G(ω) is the phonon density of states and BE(ω, T) isthe temperature-dependent Bose-Einstein distribution given by
BE(ω,T) = (exp( h̵ωkBT
) − 1)−1
. The lattice specific heat is then givenby the equation
Cv =d⟨E⟩dT
= kB ∫ (h̵ωkBT
)
2 exp h̵ωkBT
(exp h̵ωkBT
− 1)2 G(ω)dω
Figure 4(a) shows the computed Cv, which approaches the classicalvalue of 3kB at high temperatures. Figure 4(b) compares κMD(T) withthe quantum-corrected κcorr(T) showing significantly reduced valuesbelow θD.
Phonon scattering by isotopes
Phonon scattering in experimental MoS2 samples come fromfour sources.
a. Phonon-phonon scattering, which controls the temperature-dependence of thermal conductivity
b. Scattering by isotopesc. Scattering by point defects, primarily sulfur vacancies49
d. Scattering by crystal edges, boundaries and terminationsFor the case of material-intrinsic thermal conductivity (i.e. for
a defect-free, infinitely large crystal), the last two terms vanish, leav-ing phonon-phonon and phonon-isotope scattering as the primary
AIP Advances 9, 035042 (2019); doi: 10.1063/1.5085336 9, 035042-4
© Author(s) 2019
AIP Advances ARTICLE scitation.org/journal/adv
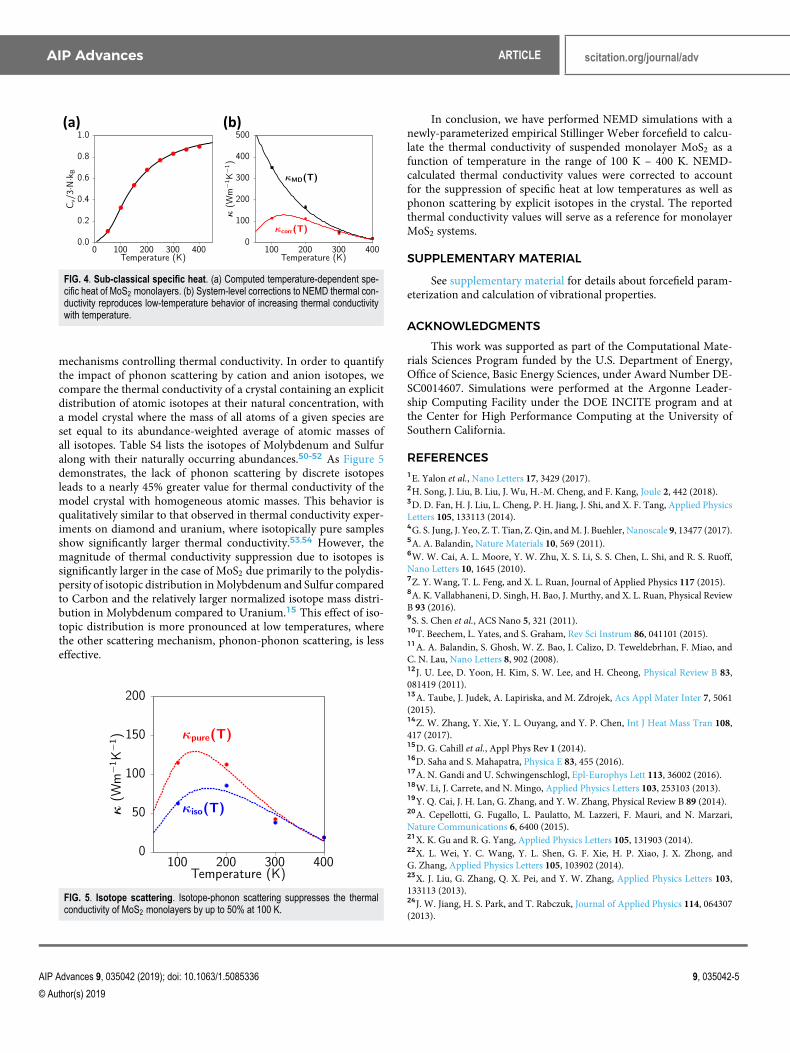
FIG. 4. Sub-classical specific heat. (a) Computed temperature-dependent spe-cific heat of MoS2 monolayers. (b) System-level corrections to NEMD thermal con-ductivity reproduces low-temperature behavior of increasing thermal conductivitywith temperature.
mechanisms controlling thermal conductivity. In order to quantifythe impact of phonon scattering by cation and anion isotopes, wecompare the thermal conductivity of a crystal containing an explicitdistribution of atomic isotopes at their natural concentration, witha model crystal where the mass of all atoms of a given species areset equal to its abundance-weighted average of atomic masses ofall isotopes. Table S4 lists the isotopes of Molybdenum and Sulfuralong with their naturally occurring abundances.50–52 As Figure 5demonstrates, the lack of phonon scattering by discrete isotopesleads to a nearly 45% greater value for thermal conductivity of themodel crystal with homogeneous atomic masses. This behavior isqualitatively similar to that observed in thermal conductivity exper-iments on diamond and uranium, where isotopically pure samplesshow significantly larger thermal conductivity.53,54 However, themagnitude of thermal conductivity suppression due to isotopes issignificantly larger in the case of MoS2 due primarily to the polydis-persity of isotopic distribution in Molybdenum and Sulfur comparedto Carbon and the relatively larger normalized isotope mass distri-bution in Molybdenum compared to Uranium.15 This effect of iso-topic distribution is more pronounced at low temperatures, wherethe other scattering mechanism, phonon-phonon scattering, is lesseffective.
FIG. 5. Isotope scattering. Isotope-phonon scattering suppresses the thermalconductivity of MoS2 monolayers by up to 50% at 100 K.
In conclusion, we have performed NEMD simulations with anewly-parameterized empirical Stillinger Weber forcefield to calcu-late the thermal conductivity of suspended monolayer MoS2 as afunction of temperature in the range of 100 K – 400 K. NEMD-calculated thermal conductivity values were corrected to accountfor the suppression of specific heat at low temperatures as well asphonon scattering by explicit isotopes in the crystal. The reportedthermal conductivity values will serve as a reference for monolayerMoS2 systems.
SUPPLEMENTARY MATERIAL
See supplementary material for details about forcefield param-eterization and calculation of vibrational properties.
ACKNOWLEDGMENTSThis work was supported as part of the Computational Mate-
rials Sciences Program funded by the U.S. Department of Energy,Office of Science, Basic Energy Sciences, under Award Number DE-SC0014607. Simulations were performed at the Argonne Leader-ship Computing Facility under the DOE INCITE program and atthe Center for High Performance Computing at the University ofSouthern California.
REFERENCES1E. Yalon et al., Nano Letters 17, 3429 (2017).2H. Song, J. Liu, B. Liu, J. Wu, H.-M. Cheng, and F. Kang, Joule 2, 442 (2018).3D. D. Fan, H. J. Liu, L. Cheng, P. H. Jiang, J. Shi, and X. F. Tang, Applied PhysicsLetters 105, 133113 (2014).4G. S. Jung, J. Yeo, Z. T. Tian, Z. Qin, and M. J. Buehler, Nanoscale 9, 13477 (2017).5A. A. Balandin, Nature Materials 10, 569 (2011).6W. W. Cai, A. L. Moore, Y. W. Zhu, X. S. Li, S. S. Chen, L. Shi, and R. S. Ruoff,Nano Letters 10, 1645 (2010).7Z. Y. Wang, T. L. Feng, and X. L. Ruan, Journal of Applied Physics 117 (2015).8A. K. Vallabhaneni, D. Singh, H. Bao, J. Murthy, and X. L. Ruan, Physical ReviewB 93 (2016).9S. S. Chen et al., ACS Nano 5, 321 (2011).10T. Beechem, L. Yates, and S. Graham, Rev Sci Instrum 86, 041101 (2015).11A. A. Balandin, S. Ghosh, W. Z. Bao, I. Calizo, D. Teweldebrhan, F. Miao, andC. N. Lau, Nano Letters 8, 902 (2008).12J. U. Lee, D. Yoon, H. Kim, S. W. Lee, and H. Cheong, Physical Review B 83,081419 (2011).13A. Taube, J. Judek, A. Lapiriska, and M. Zdrojek, Acs Appl Mater Inter 7, 5061(2015).14Z. W. Zhang, Y. Xie, Y. L. Ouyang, and Y. P. Chen, Int J Heat Mass Tran 108,417 (2017).15D. G. Cahill et al., Appl Phys Rev 1 (2014).16D. Saha and S. Mahapatra, Physica E 83, 455 (2016).17A. N. Gandi and U. Schwingenschlogl, Epl-Europhys Lett 113, 36002 (2016).18W. Li, J. Carrete, and N. Mingo, Applied Physics Letters 103, 253103 (2013).19Y. Q. Cai, J. H. Lan, G. Zhang, and Y. W. Zhang, Physical Review B 89 (2014).20A. Cepellotti, G. Fugallo, L. Paulatto, M. Lazzeri, F. Mauri, and N. Marzari,Nature Communications 6, 6400 (2015).21X. K. Gu and R. G. Yang, Applied Physics Letters 105, 131903 (2014).22X. L. Wei, Y. C. Wang, Y. L. Shen, G. F. Xie, H. P. Xiao, J. X. Zhong, andG. Zhang, Applied Physics Letters 105, 103902 (2014).23X. J. Liu, G. Zhang, Q. X. Pei, and Y. W. Zhang, Applied Physics Letters 103,133113 (2013).24J. W. Jiang, H. S. Park, and T. Rabczuk, Journal of Applied Physics 114, 064307(2013).
AIP Advances 9, 035042 (2019); doi: 10.1063/1.5085336 9, 035042-5
© Author(s) 2019
AIP Advances ARTICLE scitation.org/journal/adv
25Y. Hong, J. C. Zhang, and X. C. Zeng, Journal of Physical Chemistry C 120,26067 (2016).26P. K. Schelling, S. R. Phillpot, and P. Keblinski, Physical Review B 65, 144306(2002).27R. S. Yan et al., ACS Nano 8, 986 (2014).28S. Sahoo, A. P. S. Gaur, M. Ahmadi, M. J. F. Guinel, and R. S. Katiyar, Journal ofPhysical Chemistry C 117, 9042 (2013).29X. Zhang, D. Z. Sun, Y. L. Li, G. H. Lee, X. Cui, D. Chenet, Y. M. You,T. F. Heinz, and J. C. Hone, Acs Appl Mater Inter 7, 25923 (2015).30T. Kim, D. Ding, J. H. Yim, Y. D. Jho, and A. J. Minnich, Apl Mater 5 (2017).31N. Payam and J. S. David, Nanotechnology 28, 075708 (2017).32V. Varshney, S. S. Patnaik, C. Muratore, A. K. Roy, A. A. Voevodin, andB. L. Farmer, Comp Mater Sci 48, 101 (2010).33F. H. Stillinger and T. A. Weber, Physical Review B 31, 5262 (1985).34J. D. Gale, J Chem Soc Faraday T 93, 629 (1997).35S. Plimpton, J Comput Phys 117, 1 (1995).36T. Ikeshoji and B. Hafskjold, Molecular Physics 81, 251 (1994).37P. Wirnsberger, D. Frenkel, and C. Dellago, Journal of Chemical Physics 143,124104 (2015).38F. Muller-Plathe, Phys Rev E 59, 4894 (1999).39D. G. Cahill, W. K. Ford, K. E. Goodson, G. D. Mahan, A. Majumdar, H.J. Maris, R. Merlin, and P. Sr, Journal of Applied Physics 93, 793 (2003).
40X. F. Wu, V. Varshney, J. Lee, Y. S. Pang, A. K. Roy, and T. F. Luo, Chem PhysLett 669, 233 (2017).41A. A. A. Hilli and B. L. Evans, J Cryst Growth 15, 93 (1972).42H. B. G. Casimir, Physica 5, 495 (1938).43C. Oligschleger and J. C. Schon, Physical Review B 59, 4125 (1999).44P. G. Klemens, Solid State Phys 7, 1 (1958).45D. P. Sellan, E. S. Landry, J. E. Turney, A. J. H. McGaughey, and C. H. Amon,Physical Review B 81 (2010).46B. Peng, H. Zhang, H. Z. Shao, Y. C. Xu, X. C. Zhang, and H. Y. Zhu, Rsc Adv6, 5767 (2016).47J. E. Turney, A. J. H. McGaughey, and C. H. Amon, Physical Review B 79 (2009).48O. N. Bedoya-Martinez, J. L. Barrat, and D. Rodney, Physical Review B 89(2014).49D. Le, T. B. Rawal, and T. S. Rahman, Journal of Physical Chemistry C 118, 5346(2014).50G. Audi and A. H. Wapstra, Nucl Phys A 565, 1 (1993).51G. Audi and A. H. Wapstra, Nucl Phys A 595, 409 (1995).52M. Berglund and M. E. Wieser, Pure Appl Chem 83, 397 (2011).53L. H. Wei, P. K. Kuo, R. L. Thomas, T. R. Anthony, and W. F. Banholzer,Physical Review Letters 70, 3764 (1993).54T. Watanabe, S. G. Srivilliputhur, P. K. Schelling, J. S. Tulenko, S. B. Sinnott,and S. R. Phillpot, J Am Ceram Soc 92, 850 (2009).
AIP Advances 9, 035042 (2019); doi: 10.1063/1.5085336 9, 035042-6
© Author(s) 2019