Thermal Conductivity of Copper-Nickel Alloys at 4.2°K .82-0333 0 BING SCIENTI FIC"R ES EARCHBOE...
26
D1 .82-0333 0 SCIENTI FIC BING "R ES EARCH BOE INLABORATORIES Thermal Conductivity of Copper-Nickel Alloys at 4.2°K Joachim C. Erdmrnnn James A. Jahoda Solid State Physics Laboratory April, 1964
Transcript of Thermal Conductivity of Copper-Nickel Alloys at 4.2°K .82-0333 0 BING SCIENTI FIC"R ES EARCHBOE...

D1 .82-0333
0
SCIENTI FICBING "R ES EARCHBOE INLABORATORIES
Thermal Conductivity
of Copper-Nickel Alloys at 4.2°K
Joachim C. Erdmrnnn
James A. Jahoda
Solid State Physics Laboratory
April, 1964

D1-82-0333
TKEM4AL CONDUCTIVITY OF COPPER-NICKEL ALLOYS AT 4.2 0 K
by
Joachim C. Erdmann
and
James A. Jahoda
April, 1964
Boeing Soientifio Research Laboratories
Seattle, Washington

ABSTRACT
The lattice thermal conductivity of the complete
Cu-Ni alloy series at 4,2• * s been derived from the measure-
ment of the total thermal conductivity and the electrical resi-
dual resistivity of annealed specimens. It 4fr found that -*r-
decTre metAn-the copper-rich alloys~with increasing content .fnickel. F'o uct-cf the • itiou ru ,-•u•
proportional tothe s-
minimu of n 9 vs. composition is observed at Cu 92- Ni 08, and
akeo a maximum at appr. Cu-55 -iNi 45. The 'e t is mneist
ent-VlM-t&rren theores 0o•r'amesm-- - For the most
nickel-rich alloy (Cu 02 - Ni 98) indications of additional
phonon scattering processes, perhaps by spin-dlsorder, are
found. The influence of plastic deformation V has been meas-
ured and is briefly discussed.,.-
/ I

-1-N
I, Introduction
The lattice thermal conductivity of alloys has been
investigated by many authors. The theoretical work of special
interest for our purpose is listed as Refs. (1) to (12). Some
of the experimental investigations (20)-(22) were carried out
with annealed dilute alloys having low electrical resistivity,
particularly alloys based on copper and silver. In those cases
it war found that, at helium temperatures, the Wiedemann-Franz
law holds well and also that the lattice conductivity varies
proportional +o the sqiare of the absolute temperature, indicat-
ing scattering of phonons by electrons in substantial agreement
with theories of Sommerfeld and Bethe, (1) and Makison.(2) Chari(24)
found a maximum in the lattice conductivity of dilute silver-mang-
anese alloys at 40 K and a 9 3 dependence below that temperature.
He attributed this deviation from the ordinary behavior to scat-
tering of phonons by magnetic domain walls.
In other investigations,(13) to (19) the effect of
plastic deformation on the lattice conductivity has been studied.
The additional thermal resistance due to dislocations vas found-2
to depend on the temperatur.- as T so that electron soattering
and dislocation scattering of phonons cannot be separated merely
on the basis of the temperature dependence. For a time, this
methodical disadvantage led to uncertainties about the possible
influence of dislooations on the composition dependence of the

-2-
lattice conductivity in dilute alloys. Observations of Kemp
and Klemens(18) showed that the lattice conductivity in dilute
alloys decreases with solute content, and it was concluded that
dislocation locking, increasing with the number of solute atoms,
is responsible for these observations. Later work by Tainsh and
White, (21) Klemens, White and Tainsh,(22) Lindenfeld and Penne-
baker(2 6 ) led to a different interpretation by Klemens et al. 22)
who assumed that the inelastic scattering of electrons by thermal-
ly vibrating solute atoms, investigated by Kosihino, (27) lowers the
lattice conductivity.
In alloys with high electrical resistivity, it wasfound by Zimrerman (25) and Lindenfeld and Pennebaker (26) that a
term proportional to the temperature and the electrical resist-
ivity arises in the expression for the lattice conductivity in
addition to the quadratic term. The effect had been predicted
by Pippard, (28) and in fact the investigators of Refs. (25)and
(26) were able to interpret their results in terms of the Pippard
theory. The experiments were done using dilute silver-antimony
and dilute copper alloys containing a few percent germanium,
aluminum, gallium, or indiuw, respectively.
In this work we report about the thermal conductivity
of the complete Cu-Ni series at .,20K. The results show the
sirf•Iltaneous presence of the composition effect of the type sug-
gested by KILemens et ai!(22) aad of the high-resistance effect
predicted by Pippard.(28) It is further shown that in annealed

-3-
Alloy No Composition (Weight Peroent) Resistivity 1johms =m]at 4.20K
868 1,96 Ni, Bal, Cu 2,17
664 4.74 Ni, 0.043 Al, <0.1 Mn, Mg, Fe, Bal.G. 7, 004
666 9.3 Ni, 0,025 Al, Bal, Cu 10.94
667 27.96 Ni, 0,023 A)., <1.0 Fe, Mg, Bal. Cu 32.3
Ko •40.0 Ni, Bal. Cu, Impurities unknown 42."
669 64.87 Ni, 0.051 Al, 0.013 C, <0.01 Fe,Bal. Cu 27.8
670 84.7 Ni, 0.054 il, 0.02C, <0.1 Fe, Mn,Bal. Cu 10.64
131 2.03 Cu, Bal. Ni 1,65
TABLE I, Composition and residual resistivity of the investigatedCu-Ni alloys.
Fi. 1.
Fig. 1, Micrograph of alloy 664 (•5% Ni).

-4-
nickel-rich alloys the lattice conductivity cannot be limited
merely by electron-phon~n processes. The influence of plastio
deform•tion also i8 discussed.
II, Fxperiments
A, Sample Preparation.
Poly .•ystalline Cu-Ni alloys in the form of wires, to-
gether with their chemical analysis and spectrographic surveys
were provided by the courtesy of the International Nickel Company,
Inc. The vacuum cast ingots were hammer forged, hot rolled to
18.5 mm didmeter and rough turned. The rough turned bars were
cold rolled to 6 mm diameter and drawn to 1.5 mm diameter wire.
Intermediate annealing was performed at 930 C when necessary.
The wires were afterwards cut into pieces of 130 mm lengths, an-
nealed in an argon atmosphere for 24 hours at 10000 C, and slowly
cooled in the furnace over a period of 6 hours. They were then
electropolished, having final diameters of 1.35 to 1,45 mm.
The reference numbers of the alloys, together with
the composition and residual resistivity, are listed in Table I.
A typical micrograph of the etched surface of an alloy
specimen after the final heat treatment is shown in Fig. 1. The
grain size has a value between 50 and 250 11.
For the experiments the wires were finally cut to a
length of 125 mm. Each of the two ends of each wire was put
through the axial hole drilled through a brass cylinder of 7.5 mm

-5-
diameter and 12 mm length, and brazed to the brass cylinder
with a small flame, "Easy Flow 45" solder having a melting
point of 620 0 C was used. To the center of the emaining free
piece of wire (length 100 mm) and to a point 35 mm off the cen-
ter, small soft copper clamps of approximately 0.75 mm thick-
ness were soldered, in order to provide thermal leads for the
thermometers,
B. Measurements.
All measurements were performed in the tensile cryo-
stat that has been previously descriLbed.(29) The brass end-
pieces of the specimen were soft soldered into the mechanical
grips which also serve as heat sinks. Two helium gas thermom-
eter bulbs were soldered to the thermal leads. The thermometer
system also has been described already. If an electrical cur-
rent I passes through the sample, a voltage drop U arises
between the thermometer bulbs. Since the thermometer tubing
and the sample itself are electrically insulated, I and U can be
measured. This is done by means of a six-stage Diesselhorst po-
tentiometer. Becaise Joule heat is dissipated in the specimen,
a temperature difference AT is set up between the thermometers.
The thermal conductivity K is then given by
I1 (d/') AT-'
where d and F are the distance between the thermometers and

EXTERNAL INTEGRATING BINARY BINARY DEVOLTAGE DIGITAL VOLTS DECIMAL V(
INPUT VOLTMETER DATA REGISTER REC
(DYMEC 2401A) (DYMEC2530A)
VARIABLESYNCHRO-NIZATION
CONTROL AND INTERIC
BINARY BINARY DECTIMER TIME DECIMAL TI_
DATA REGISTER DA
STANDARD
FREQUENCYINPUT (DYMEC
(100 kc) 2530A)
Fig. 2, Automatic digital data
Data of the -Iifferentiý
are recorded on IBM ca:tion of thermal transi

DECIMALVOLTS
REGISTER PRINTING
SUMMARYPUNCH
(IBM 526)PROGRAM,PUNCH
CONTROL
rERLOCK AND
AUTOMATIC,MANUAL
DATA
DATA AND CONTROLDECIMAL
TIMEIDATA
AUTOMAT;CEXTERNALCONTROL
ata acquisitcn system.ntial temperature AT (see Eq. 1)cards, eritting machine evalua-
nsients. 29
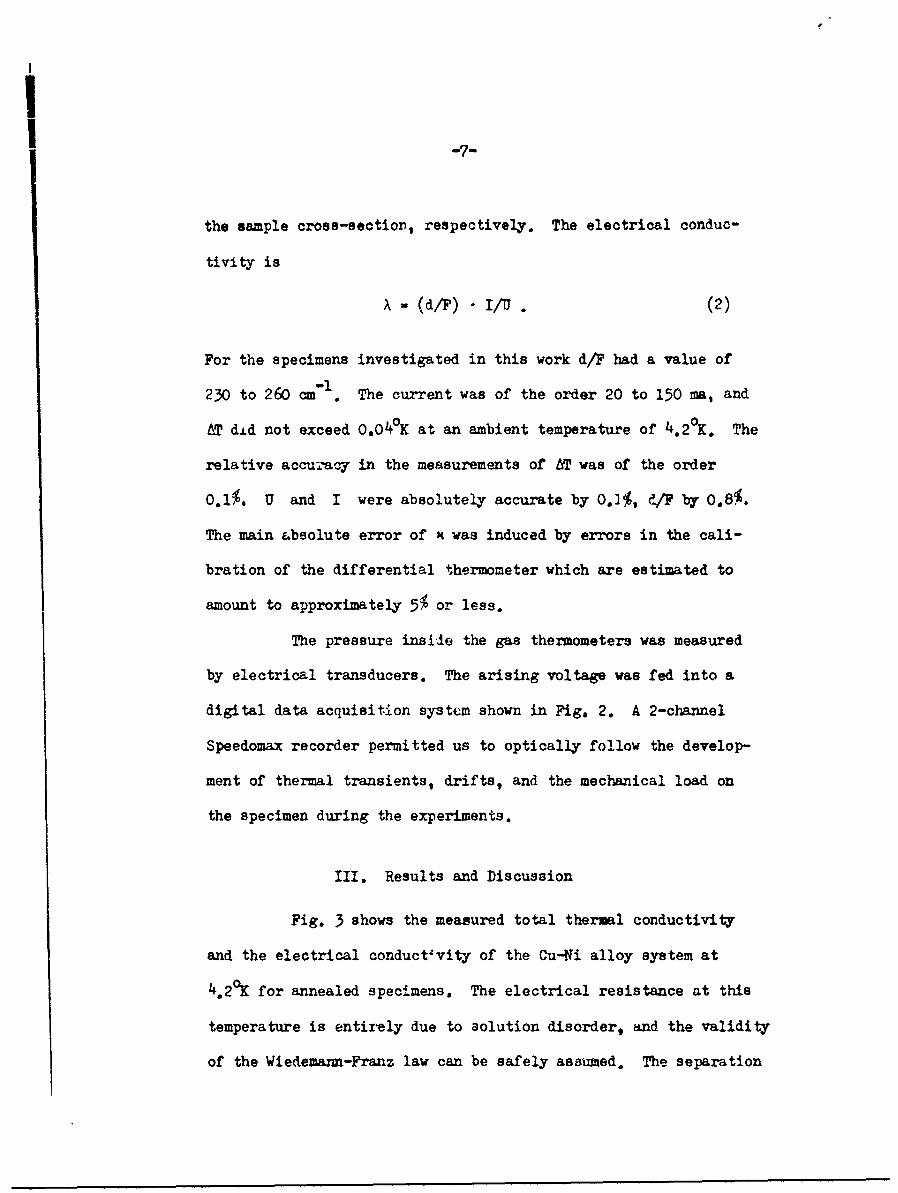
the aample cross-section, respectively. The electrical conduc-
tivity is
X - (d/F) 1/9. (2)
For the specimens investigated in this work d/F had a value of
230 to 260 cm"I. The current was of the order 20 to 150 ma, and
AT did not exceed 0.049K at an ambient temperature of 4.2 0 K. The
relative accur-acy in the measurements of AT was of the order
0.1%. U and I were absolutely accurate by 0.]%, d/F by 0.8%.
The main absolute error of x was induced by errors in the cali-
bration of the differential thermometer which are estimated to
amount to approximately 5% or less.
The pressure inside the gas thermometers was measured
by electrical transducers. The arising voltage was fed into a
digital data acquisition system shown in Fig. 2. A 2-channel
Speedomax recorder permitted us to optically follow the develop-
ment of thermal transients, drifts, and the mechanical load on
the specimen during the experiments.
III. Results and Discussion
Fig. 3 shows the measured total thermal conductivity
and the electrical conductivity of the Cu-Ni alloy system at
4.2 0 K for annealed specimens. The electrical resistance at this
temperature is entirely due to aolution disorder, and the validity
of the Wiedemann-Franz law can be safely assumed. The separation

Cu-Ni, ANNEALEDEUE
0.066E OU 0
THERM. COND.S-- ELECTR. COND.
,0.04 4 D
0 zz 00 Uu
S0.02 - 2I--"' LU
I i I I
0 20 40 60 80 100WEIGHT PERCENT Ni
Fig. 3. Thermal and electrical conductivity at 4.2 0 K of annealedCu-Ni alloy specimens.

-. j-
12
EU
0.010-
5_ 8-g8
z 61U ]U 41 Cu-Ni, ANNEALED
I..
0.002-
0 20 40 60 80 100WEIGHT PERCENT Ni
Fig, 4. Lattice thermal conductivity at 4.2 0 K of annealed Cu-Nialloy specimens.

of the electronic and the lattice part of the total thermal
conductivity can then "-s obtained from the relations
Ke - LTX (electronic part)
(3)it i.- t (lattice part)
where L is the Wiedemann-Franz number with the value 2.45. 10"w
ohms oK-2•
The values of the lattice conductivity of the invest-
igated alloys are plotted in Fig. 4. The value for pure copper
has been determined by Klemens and amounts to ,?pproximately
0.025 W cma" OK'I at 4.20K. The value of xt for pure nickel isg
not known.
The decrease of the lattice conductivity in Fig, 4
with increasing content of solute in the copper rich alloys,
thas often been found and has been discussed by Klemens, Tainsh
and w1hite. (21)(22) It is assumed that the scattering of elec-
tron~s by the thermal motion of impurity ions, as it has been dis-
cussed by Koshino, (27) enhances the lattice resistance of metals
containing small amounts of solute atoms. The thermal motion of
the a,,lute atos adds an extra imelastic scattering contribution
that is proportioral to the impuriicy content.
On the nickel rich side of the diagram in Fig. 4, we
dc not observe a decrease of th+ lattice conductivity with solute

5.0
Cu-Ni, ANNEALEDNICKEL-CONTENT
(WEIGHT PERCENT)
4.0 85
Q.
3.0 2
.98
L=2.45 x 10⁸
2.01 2 3 4
TEMPERATURE [°K]
Fig. 5. Characteristic temperature dependence of three Cu-Nialloys at helium temperatures. The alloy containing98 weight percent nickel leads to a curve with a neg-ative slope. See text.

-12-
content. Either we have to go to very dilute alloys on the
nickel-rich side in order to detect the effect or, more likely,
the effect is negligibly small in nickel containing small amounts
of copper. It should be noticed that the lattice conductivity
of the most nickel-rich alloy in Fig. 4 is only half the value
of the corresponding copper-rich alloy on the left side of the
diagram. The scattering process that limits x on the nickel-g
rich side seems to be not merely scattering of phonons by elec-
tron. In order to check this possibility, we have performed a
few measurements of the temperature dependence of the total ther-
mal conductivity in the helium range. If scattering of phonons
by electrons is the dominant process limiting xg, the lattice
2conductivity should be proportional to T . If we then plot x/T
vs. T, we should obtain a straight line with a positive slope,
since, according to Eq. (3),
K/T - LX + BT , (4)
where L, X, and B are temperature independent.
In Fig. 5 plots of xp/T vs. T are shown for the alloys
868, 70, and 131, containing 2, 85 and 98 percent nickel, respec-
tively. The plots for the alloys 868 and 70 have a positive slope.
For alloy 131 however, a negative slope is obtained. Obviously
Eq. (4) has to be modified in order to include an extra scattering
process only important for the nickel-rich alloys.

-13-
Since nickel is a transition metal and ferromagnetic,
we may expect additional scattering of phonon by spin-disorder.
No theoretical work seems to be available on this subject. Btck-
lund(30) has found similar indications in his work on iron alloys,
however, in a higher temperature range.
Thus, certain anomalies occur on the nickel-rich side
of the x - composition diagram, which cannot be erplained atg
present, but which may also bury the "Koshino-effect".
None of the plots in Fig. 5 follows Eq. (4) exactly.
Otherwise, all cu±'ves would go througn the point xp/T = 2.34, 10-8
for T 0 0. The deviations, which are smallest for the sample con-
taining only 2 percent copper, are of the type observed origin-
ally by Zimmerman. The effec' has been predicted by Pippard and
occurs when the product of the electron mean free pe~th A and thee
predominant phonon wave number q becomes smaller than unity,
that is for an alloy with high electrical resistance. In that
case the adiabatic approxim.ation fails to be valid, since no prop-
er interference conditions between phonons and electrons are est-
ablished.(31) As a result, the lattice thermal resistance is
smaller than it should be if there were enough interaction possible.
Pippard's theory has been used ly Zimmerman(25) and Lindenfeld
and Pennebaker(26) to explain the observed anomalies of the lat-
tice conductivity in high-resistive alloys. It was found that
in addition to the quadratic temperature term in the lattice con-
ductivity a new term arises proportional to the temperature and

10 3 2Cu-Ni, ANNEALED
'E XAc oe 98
N NICKEL-CONTENT0 WEIGHT PERCENT ,,
, I , I I I I10E 106
TI9 [0K ohm1 cml]
Fig, 6. The data of Fig. 4 replotted as Kg/PT vs. T/p.

-15-
the electrical resistivity. In fact, the results for x showng
in Fig. 4, obtained for a constant temperature T . 4.2 0 K, show
the proportionality of K and p over a large range of composi-g
tion. The breakdown of the interference condition pAe>l, lead-
ing to an increase in the lattice conductivity, opposes the op-
posite effect of the inelastic impurity scattering on the left
side of the diagram, leading to a minimum of x * Similar effectsg"
showing an increase of x with incret2.sing solute content, afterg
an initial decrease, have been found by Lindenfeld and Pennebaker
in copper alloys containing a few percent germanium at tempera-
tures around 2oK.(2 6 )
The lattice conductivity for arbitary values of pA e has
been calculated by Zimmerman(25) and Lindenfeld and Pennebaker(2 6 )
The results can be compared with experimental values, if the ob-
served ratio Kg/pT is plotted vs. T/p. A universal curve has
been obtained by the invcstig..tors in the comparison of their
theory with experiments performed with high-resistive, but rather
dilute silver and copper alloys. In Fig. 6 it is shown that
even in the present case, where we are dealing with a complete
system of binary alloys, most of the measured values of Kg/pT
fall on a smooth curve. Fig. 6 was obtained using the x -g
values of Fig. 4, the p - values of Table I and putting T equal
to 4.23K.

0
E NICKEL-CONTENT Cu-Ni ALLOYS ,DEFORMED3: (WEIGHT PERCENT) AT
EO 1 0 6 5 o 4.20K0 ROOM TEMP
CN
81
UD
0U
U
2a
2 4 6 8PERCENT STRAIN
Fig. 7. The effect of plastic strain, applied at 4 62 0K or 2950K,on the lattice thermal conductivity at p4.2 K of previouslyannealed Cu-Ni alloy specimens.

IThe point in Fig. 6 obtained for the most nickel-
rich alloy 131 does not fall on the curve that connects all
other points. This deviation is caused by two reasons: First,
,he variables of Fig. 6 actually have to be further reduced in
order to account fnr the variation of the average sound velocity
with the ccaposition. The adjustment can be achieved approximate-
ly, if T is reduced to T/8, where e is the Debye characteristic
temperature. If we chose 80 = 339, 9 * 456IKn the points forCu ,i-1 0
the two most dilute alloys, where this procedure may be permiss-
ible, fall closer together than in Fig. 6.
The second reason for the observed deviation of alloy
131 in Fig. 6 is suggested by the discrepancies already discussed
in connection with Fig. 5. Scattering processes in addition to
electron scattering might help to lower the lattice conductivity
in the most nickel-rich alloys, arising perhaps from spin-disorder.
If plastic deformation is applied, the lattice conduc-
tivity is reduced considerably even for small strains. Fig. 7
shows some experimental results, which also show that room temp-
erature deforma.tion and deformation at 4.2 0 K have about the same
effect. The reduction of x is due to the scattering of phononsg
by dislocations, investirated theoretically by Klemens53)-'(7and"
Bross et al.(9)-(II) Although in some instances good agreement
between theory and experiment was found,(1 6 ) there is certainly
a tendency in the available theories to underestimate the thermal
resistance of a dislocation. As a consequence, dislocation densities

-18-
6,
u5
z
Z 30
2I
0/ -0 0.05 0.10 0.15 0.20
STRAIN -
Fig. 8, Dislocation density of a Cu 60 - Ni 40 alloy specimen(Ko in Table I), deformed at 4o2 0 K, as derived frommeasurements of tie thermal oonduotivity. See text.

-19-
derived from experiments according to the current theories,
have higher values than plausible. One example is shown in
Fig. 8, where we have evaluated the dislocation density of a
Cu 60 Ni 40 alloy after deformation at 4,.20K, using the theory
of Klemens, which relates the additional lattice resistance WD
to the dislocation density N by
WD -0.17 (vh 2/k 3 ) Nb2. T2 , (5)
where v is the phonon velocity, h Planck's constant, k
Boltzmann's constant and b the Burgers vector. For copper,
v 2.27- 105cm/s, b2= 6.6. 10"16 cm2, for nickel v = 3.000 05
2 -16 2cm/s, b= 6.210 cm . For Cu 60 - Ni 40 we thus obtain
WD = 5.5 l0-9 NT (cm0 W ) (5a)
Bross et al have remarked that part of the discrepancy
between the derived dislocittion density as in Fig. 8 and the
actual densities, which may be an order of magnitude lower, can
perhaps be explained by the fact that actual dislocation patterns
are piles rather than random distributions, Piles of dislocations
have a stronger scattering power for phonons than an equal
number of randomly distributed dislocations. All theories, how-
ever, have been based thus far on the assumption of random dis-
tribution and orientation.
Thus, we cannot place much significance on the obtained

-20-
values of the dislocation density. However, it seems that rela-
tive changes during deformation can be followed. In particular,
Fig. 7 suggests that dislocation arrangements obtained after
room temperature deformation and after deformation at 4,2°K can-
not be very different in the case of the investigat-d alloys.
A CK N ML DG ;IMNTS
We wish to thank the International Nickel Company Inc.,
Research Laboratory, Bayonne, New Jersey for providing copper-
nickel alloys together with their analysis. We also gratefully
acknowledge the active help of Dr. R. M. N, Pelloux, Mrs. A.
Raisanen and Miss Ursula Stark, who performed the micrographic
analysis.

References
(1) A. Sommerfeld and H. Bethe, in Handbuch der Physik
(Springer-Verlag, Berlin, 1934), 2nd edition, Vol.
24/?, p. 545.
(2) R. E. B. Makinson, Proc. Camb, Phil. Soc, L, 474 (1938).
(3) P. G. Klemens, Proc, Roy, Soc, (London) A208, 108 (1951).
(4) G. Leibfried, in Handbuch der Physik, edited by S. FlUgge
(Springer-Verlag, Berlin, 1955), Vol. 7, Part 1, p. 290.
(5) P. G. Klemens, Proc. Phys, Soo. (London) L68, 1113 (1955).
(6) P. G. Klemens, in Handbuch der Physik, edited by S. Flgge
(Springer-Verlag, Berlin, 1956), Vol. 14, p. 198.
(7) P. G. Klemens, in Solid State Physics, edited by F. Seitz
and D. Turnbull (Academic Press Inc., New York, 1958),
Vol. 7, p.l.
(8) J. Callaway, Phys. Rev. 113, 1046 (1959).
(9) H. Bross, Phys. Stat. Sol. 2, 481 (1962).
(10) H. Bross, A, Seeger, and R. Haberkorn, Phys. Stat. Sol.
2, 1126 (1963).
(11) H. Bross, A. Seeger, and P. Gruner, Anm.Phys. (Leipzig)
?7/ll, 230 (1963).
(12) R. E. Nettleton, Phys. Rev. 132, 2032 (1963).
(13) K. R. Wilkinson and J. Wilks, J. Sci. Instr, 26, 19 (1949).
(14) J. K, Hulon, Proc. Phys. Soc. (London) 64, 207 (1951).
(15) I. Estermann and J. E. Zimiermaa, J. Appl. Phys. 23, 578
(1952).

-22-
(16) J. N. Lomer and H. M. Rosenberg, Phil. Mag. 4, 467 (1959).
(17) W. R. G. Kemp, P. G. Klemens, and R. J, Tainsh, Phil. Mag.
4, 845 (1959).
(18) W. R, G. Kemp and P. G. Klemens, Austr, J. Phys. i,
247 (1960).
(19) R. J, Tainsh, G. K. White, and P. G. Klemens, Acta.
Met. 9. 966 (1961).
(20) T. Olsen, J. Phys. Chem. Solids 12, 167 (1959).
(21) R. J. Tainsh and G. K. White, J. Phys. Chem. Solids
23, 1329 (1962).
(22) P. G. Klemens, G. K. White, and R. J. Tainsh Phil. Mag.
7, 1323 (1962).
(23) D. Probert, Nature 201, 283 (1964).
(24) M. S. R. Chari, Proc. Phys. Soc. D, 1216 (1962).
(25) J. E. Zimmermar, J. Phys. Chem. Solids 11, 299 (1959).
(26) P. Lindenfeld and W. B. Pennebaker, Phys. Rev, 127, 1881
(1960).
(27) S. Koshino, Progr. Theor. Phys. 24, 484 (1960).
(28) A. B. Pippard, J. Phys. Chem, Solids 3, 175 (1957).
(29) J. C. Erdmarni and J. A. Jahoda, Rev. Sci. Instr. 4,
172 (1963).
(30) N. G. Backlund, J. Phys. Chem. Solids 20, 1 (1961).
(31) J. M. Ziman, Electrons and Phonons ( Clarendon Press,
Oxford, 1960) p. 212.