Thermal Comfort in India...Thermal Comfort in India R.V.Simha Airtron Consulting Engineers Pvt Ltd...
61
Thermal Comfort in India R.V.Simha Airtron Consulting Engineers Pvt Ltd Bangalore 11/12/12 3rd Regional Conference & Exhibition, "Innovations in Sustainable Habitats – The GRIHA Approach”
Transcript of Thermal Comfort in India...Thermal Comfort in India R.V.Simha Airtron Consulting Engineers Pvt Ltd...
Thermal Comfort in India
R.V.Simha
Airtron Consulting Engineers Pvt Ltd
Bangalore
11/12/12
3rd Regional Conference & Exhibition, "Innovations in Sustainable Habitats – The GRIHA Approach”

Warm & Hot and Chilly & Freezing
Although both pictures represent extreme climate types that are almost poles apart, our focus will be – expectedly on the picture on the left
Fig. 1 Fig. 2
11/12/12

• Fox and Bear – Born with built-in fur
• Open Fire
• Natural and rock-cut caves as shelter and for pilgrims in ancient India – Buddhist monasteries, Chaitya and Karla caves in India
• Hand-held fans, remotely operated fans . . . in China and India
• Hearths
• Romans and central heating
• Transparent windows – again by Romans first
• Wood and Coal for heating, oil and candles for lighting
• South facing houses in Europe – beginning of solar heating ?
• James Watt in the industrial revolution – 1770
• The first ammonia absorption refrigeration system (Ferdinand Carre -1851), refrigeration cycle to produce ice and refrigerated air (Dr. John Gorrie), ice making plant (Alexander Twining – 1853) followed.
• David Boyle comes out with his ice making machine with ammonia
The History Behind the Current Scenario
11/12/12 Contd. . .

• The first recip compressor shows up in the market (David Boyle - 1872)
• The Psychometric chart – 1904, Dr. Carrier’s historic paper the “Rational Psychometric formulae”, 1911 followed as a end-result of on-going developments in the understanding of the science and engineering of air conditioning.
• The culmination of this happy turn of events viz., the manufacturing infrastructure – the absorption machine, the ammonia (reciprocating) compressor) and the engineering & science, thermodynamics and psychrometry, resulted in the birth of Modern Air Conditioning.
• Historically providing heating has never been much of a problem. Open fires or hearths and use of steam served well enough. Cooling on the other hand – in large quantities and at sufficiently low temperatures was just nowhere for the taking.
• Towards the end of the 19th century, the picture had changed. Getting Refrigerants and equally importantly, chilled water and brine were now there for the taking.
The History Behind the Current Scenario
11/12/12 Contd. . .

• The Industrial Revolution offered energy (power) as much as anybody wanted and air conditioning could provide any temperature, however high or low the demand could be and in whatever capacities the applications is called for. This meant that any temperature could be provided in any building big or small to meet the demands of comfort.
• Up to this point, buildings were being built keeping in mind the climate and the environment. The advent of modern air conditioning changed all that. Buildings could be created in any fanciful manner and there was air conditioning to take care of the adverse affects resulting from deviations and architectural requirements imposed on the buildings. The concept that we should adapt to stay in harmony with climate and environment - in contrast to attempts to approaches resulting in conflict with them - faded away.
• The Adaptive Approach that characterized building creation and created life styles is not a new concept. That was in fact the concept that ruled before the advent of modern air conditioning.
• Everyone is aware today of what conditions are at the present time. The Adaptive Approach we are talking about has merely staged a revival starting from around the 30s - and more emphatically intensified around the 70s - of the last century and is now apparently a concept that has found its time.
The History Behind the Current Scenario
11/12/12

Preliminary Comparison - Fixed Temperature Approach Vs Variable Temperature Approach The Fixed Temperature Approach
• The Fixed Temperature Approach (FTA-23°C) represents a well-entrenched school of thought. The other is the Adaptive Comfort Approach – called also the Variable Temperature Approach in this context. FTA school dates around 1970
• FTA is more than a century old. Adaptive Comfort is developing over the last 30 years. Focus in this presentation is on Adaptive Comfort. FTA serves as a benchmark – for comparative study of Adaptive Comfort vis-à-vis FTA.
a) Note : FTA is also called HB (Heat Balance). Likewise; the Adaptive Comfort (AC) Approach is called the Variable Temperature Standard (VTS).
• We shall first commence with a brief review of HBA – brief, because HVAC engineers are familiar with it and secondly because it will furnish benchmarks for ACA to keep touching it now & then.
• Comfort Range (tolerance), Comfort Zone (for FTA) 23±1°C, ±5% RH, 23°C to 25°C - all the time, anywhere and everywhere
11/12/12 Contd. . .

• Experience and studies show Air conditioned Buildings are either too hot or too cold – most of the time. And that translates in to energy penalties.
• Energy consumption - high
• Expensive to run
• The laboratory approach
• Climate Chamber — a very particular environment where conditions and occupant action are closely controlled by the researcher for the period of an experiment.
– Theory of heat transfer + physiology of thermo regulation range of comfort temperature for comfort. PMV (Predicted Mean Vote)
– Measurement of physiological changes – sweating, skin-wettedness in laboratories/climate chambers; sometimes using manakins
Preliminary Comparison - Fixed Temperature Approach Vs Variable Temperature Approach The Fixed Temperature Approach
11/12/12 Contd. . .

• Based on steady state
• Differing comfort requirements/preferences cannot be met.
• Fixed work station and seating position.
• No individual controlling devices – operable windows, facility to draw blinds open and close them, adjustable speed desk fans, ceiling fans . . . .
• Negligible air movement
• Monotony of fixed temperature – Thermal Monotony so to speak !
Preliminary Comparison - Fixed Temperature Approach Vs Variable Temperature Approach The Fixed Temperature Approach
Three Compliance Paths in 55-2010 :
a) Graphic Comfort Zone Method (GCZM) — for Typical Indoor Environments
b) Computer Model Method (CMM) — for General Indoor Application
c) Optional Method of Determining Acceptable Thermal Conditions in Naturally Conditioned Spaces – Adaptive Comfort Standard (ACS)
11/12/12 Contd. . .

Preliminary Comparison - Fixed Temperature Approach Vs Variable Temperature Approach
The Variable Temperature Approach
• A single Fixed Temperature is not necessary for comfort. • People react to changes of surrounding Thermal Environment. • Changes can be
– Activity level (M) – Heat loss – H (from the body)
• Change of thermal environment
– Clothing
Events, functions, season, time of the day, judgment on what the day/evening will be like/what it was like the preceding hours and preceding 2-3 days
– Posture – Windows, blinds, doors – Change of Position – fans
– Thermo-stat adjustments
There will no doubt be other changes; similarly some of the listed changes may not be practicable/feasible.
11/12/12 Contd. . .

Preliminary Comparison - Fixed Temperature Approach Vs Variable Temperature Approach
The Variable Temperature Approach
• Comfort can be found over a “wide” range of temperatures
• With ability for the occupant to meddle with the adaptive variables themselves, the wide range of temperature can be even “Wider Range of Temperatures”
• Every time a change in Thermal Environment is made, the occupant will find himself/herself in the position to accept a higher position for comfort.
• When the occupants have the Adaptive Variables under their control, they are more forgiving. “Forgiveness” for one’s own deficiencies is part of one’s character & nature
• Occupants should feel “at home”. When “at home” and with “Adaptive Variables” under their own control, they are less sensitive to environment and find it more conducive to comfort.
11/12/12 Contd. . .

Preliminary Comparison - Fixed Temperature Approach Vs Variable Temperature Approach
The Variable Temperature Approach
• The comfort temperature becomes a bargain (interaction) between the occupant and the environment.
• Note that it is again Variable Temperature Approach or Adaptive Comfort Approach in action.
• Some proponents of FT approach feel that when those who favour adaptive
approach say, they are comfortable even at warm temperatures classified as
“severe” (according to FT approach), the possibility that they may, in fact, be
comfortable is ignored; they (FT proponents) tend to find the explanation
that their expectations of comfort level are low. This could be probably be
attributed to the fact that those who are used to living in fixed temperature
environments, lose the ability to find comfort in variable temperature
ambient. In other words, they are adopted to a fixed temperature. The
possibility that advocates of variable temperature are in fact feeling
comfortable never crosses their mind.
11/12/12 Contd. . .

Preliminary Comparison - Fixed Temperature Approach Vs Variable Temperature Approach
The Variable Temperature Approach
• Departures from comfort level are sometimes acceptable and enjoyable.
Occupants can thus choose to avoid thermal monotony.
• Recall that the comfort temperature is the result of a bargain between
the occupant and the environment.
• Are we heading for Thermal Standards for building without specifying
“inside design conditions” ? Instead, factor building characteristics to
suit climate viz., materials, orientation, fenestration, adjustable shading,
cooling systems and adequate controls . . . Once that is done the
occupants will be able to make themselves comfortable in such
buildings – like adding fans, cooling (but not Refrigeration) devices,
window blinds . . . !
• We shall now see result of some of the concepts discussed in graphics.
11/12/12

ASHRAE Comfort Chart Pre 2004 — The Fixed Temperature Standard
• DB - 24°C
• RH – 50%
• Humidity
Ratio – 9 g/kg
• Dew Point – 12.5°C
• WB – 17.05°C
• Air movement –
0.1 – 0.2 m/s
(still air)
• Clo - 0.5
• PMV limits – ± 0.5
• DB - 24°C
• RH – 55%
• Humidity
Ratio – 10.245 g/kg
• Dew Point – 14.4°C
• WB – 17.83°C
• Air movement – 0.1 – 0.2 m/s (still air)
• Clo - 0.5
• PMV limits – ± 0.5
23±1 ℃, ±55% RH,
24℃ to 28℃
The Predicted Percent Dissatisfied (PPD) of 10% corresponds the PMV range of ± 0.5 and even with PMV equal to ‘0’, about 5% of the people are dissatisfied. The PMV range of ± 0.5 represents the Neutral Zone. The location of the ASHRAE comfort point is in the middle of the Neutral Zone. Predicted Mean Vote (PMV) index predicts the mean response of a large group of people according to ASHRAE Thermal Sensation Scale.
Fig.3 ASHRAE Comfort Chart
11/12/12

14
PMV AND PPD
The PMV index predicts the mean response of a large group of people according to
ASHRAE Thermal Sensation Scale. PMV related to the imbalance between the actual
heat flow from the body in a given environment and the heat flow required for
optimum comfort at the specified activity.
Fig. 4
11/12/12

Updated Graphical Comfort Zone Method - Acceptable Range of Thermal Conditions
Effective Temperature is the temperature of a still, saturated atmosphere, which would, in the absence of radiation, produce the same effect as the atmosphere in question. It thus combines the effect of DBT and RH. Widely used index for 50 years.
Corrected Effective Temperature (CET) includes air velocity effects in addition to DBT, radiation effects & RH.
Fig. 5
All figure nos. in the presentation are in Blue. Other fig, references are taken from Std. 55-2010
NEW
11/12/12

Elevated Air Speeds
New Effective Temperature (ET*) is the temperature (DBT) of a uniform enclosure at 50% relative humidity, which would produce the same net heat exchange by radiation, convection and evaporation as the environment in question. ET* lines coincide with DBT values at the 50% RH curve. Radiation is taken into account by using OT on the horizontal scale instead of DBT.
Fig. 6
Temperature Rise - 3℃ at
V=0.8 m/s
tr-ta=5℃
11/12/12
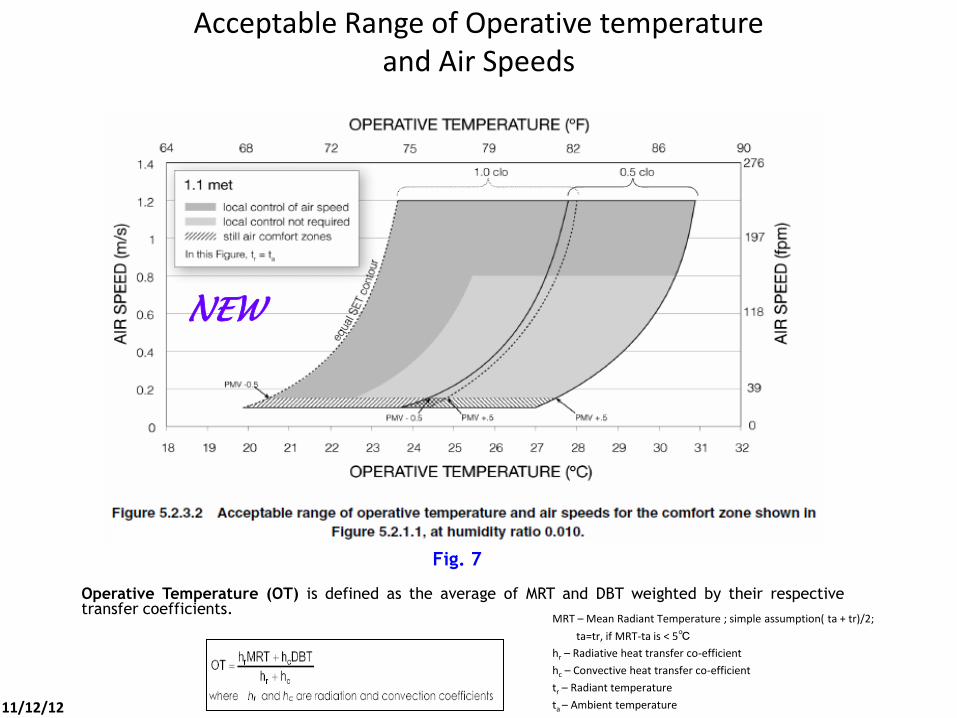
Acceptable Range of Operative temperature and Air Speeds
Operative Temperature (OT) is defined as the average of MRT and DBT weighted by their respective transfer coefficients.
MRT – Mean Radiant Temperature ; simple assumption( ta + tr)/2;
ta=tr, if MRT-ta is < 5℃
hr – Radiative heat transfer co-efficient
hc – Convective heat transfer co-efficient
tr – Radiant temperature
ta – Ambient temperature
Fig. 7
NEW
11/12/12

Adaptive Comfort
• 21,000 sets of raw data compiled from field surveys in 160 buildings.
– Buildings located in 4 continents in a variety of climatic zones
– Buildings include both (centralized) HVACR buildings and NV (Naturally Ventilated) buildings
• Measurements of temperature and humidity are made but none like skin temperature, body temperature etc. No Restrictions on dress, movement, positions. . . researcher intervention minimum In other words, it is measurements in real life situations.
• Comfort temperature is no longer fixed temperature; It is now a result of a bargain (interaction) between the occupant and the environment. It is a Variable Temperature Approach.
11/12/12

Six Climate Zones in India
Fig. 8
11/12/12

Adaptive Comfort Characteristics of Climate
Climate Mean Monthly
Temp. (°C)
Relative Humidity (%)
Representative City
Hot and Dry 30 < 55 Jodhpur
Warm and Humid 30 55 Mumbai
Moderate 25 – 30 < 75 Bangalore
Cold and Cloudy < 25 55 Simla
Cold and Sunny < 25 < 55 Leh
Composite This applies, when six months or more do not fall within any of the above categories
New Delhi
11/12/12

The Many Impacts on Sense of Comfort – Other than temperature
• We said ‘23±1°C, ±5% RH, 23°C to 25°C - all the time, anywhere and everywhere’ neither the climate nor the weather is “fixed” or constant.
• The trademark of Climate and weather is ultimately the temperature. Humidity is also a factor but it usually gets in to our mind even though indirectly and most perceived path is temperature itself.
• The outdoor temperature is the single most important factor which influences comfort. Other parameters are
– Humidity
– Dew Point
– Rainfall
– Wind
• All these – many others - have a bearing on the comfort indoors. Most of all the temperature in FTA does not factor even the (outside) temperature. 23°C indoors stays fixed – no matter what. It is interesting to see how the climate and weather impact the appreciation of indoor comfort level in the slides that follow. The “Many others” include acclimatization, race, culture, lifestyles . . . They account for a significantly large part of the difference between observed Field-based adaptive model and predicted lab-based PMV model.
11/12/12

Adaptive Comfort- Comfort Temperature Related to Mean Indoor Temperature
Fig. 9 - Pakistan: the proportion of office workers who were comfortable at different indoor temperatures. It will be noticed that on many occasions the subjects recorded no discomfort. With a continually changing indoor temperature and comfort temperature Pakistani buildings were found comfortable at temperatures ranging between 20 and 30oC with no cooling apart from fans (from Nicol et al 1999).
11/12/12

Adaptive Comfort- Tolerance to Temperature Variations – HVACR Buildings Vs NV Buildings
Fig. 10 -HVACR
buildings - more
fine, narrow,
constant
conditions
typically provided
by mechanical
conditioning
Fig – 11 NV
buildings, a
wider range
of conditions
reflecting
outdoor
climate
patterns
11/12/12

Adaptive Comfort Mean Interior Temperature Vs
Comfort Temperature
Fig. 12 – Mean interior temperature (°C) vs comfort temperature (°C)
11/12/12

Adaptive Comfort Comfort Temperatures for Islamabad
Fig. 13 –Comfort Temperature of Islamabad, Pakistan Note that Tc=30°C for To max = 38°C
(in June – peak summer)
11/12/12

Adaptive Comfort The Trade Mark Chart for ACS
Fig. 14 11/12/12

Adaptive Comfort Finding the Temperature of Neutrality and Comfort
Temperature • Calculate tn (temperature corresponding to Thermal Neutrality) from
tn = 17.8 + 0.31.tm
where tm = Outdoor mean temperature
• Calculate for at least 2 months in the year viz., summer and monsoon
• Note that for a mean temperature of 33°C , the 80% tn value is 31.5°C (Vr=0.2 m/s). This is tallying with the calculated result from the above equation.
• Next, arrive at the band-widths of Tcomf (calculated from the above equation) for 90% and 80% acceptability. These turnouts to be 5°C and 7°C respectively.
Note : tn with addition of adjustments for a) tolerrance & b) air movement stands for Tcomf
• By applying the same equation for a mean temperature of 29.58°C for the month of September tn is found to be 30.5°C
• Tn = 31.5°C (Vr=0.2) + 2.5°C (tolerance) = Tcomf Upper limit – 34°C (summer)
• Tn = 30.5°C (Vr=0.2) + 2.5°C (tolerance) = Tcomf Upper limit – 33°C (monsoon)
Net right-ward movement of the comfort zone - 2.5°C
11/12/12

Adaptive Comfort Finding the Temperature of Neutrality and Comfort Temperature
Stations Months Mean Monthly
DB tn at Vr-0.2 m/s
Max. Permissible
Tcomf at 80%
acceptability at Vr – 0.8 m/s
Supply Air
Temp.
Bangalore June 23.6 28.5 31.524 18.44 13
September 22.4 28.0 31.024 23.11 7.9
Kolkatta June 28.5 30.2 33.224 28.43 4.8
September 27.1 29.5 32.524 30.20 2.3
New Delhi June 33.0 31.5 34.524 22.28 12.3
September 29.6 30.5 33.524 28.21 5.3
Mumbai June 30.1 30.5 33.524 22.65 10.9
September 27.4 30.1 33.124 27.93 5.2
Note : 1) The input data requires monthly mean DB. No maximum , mean maximum, highest in month . . . In
fact the data required for Adaptive Comfort approach are different from those demanded by Main stream Air Conditioning.
2) The shaded cell indicates that the no. with in is too small. Chilled water (dehumidification) is indicated (It will be appreciated that the situation arises due to hours of high WB). Alternately, the WB data should be analyzed to find out how many hours this situation will prevail. If it is too small, dehumidification may well be avoided - perhaps with the involvement of the customer also.
3) The plant may well be sized for monsoon conditions, if practicable. 11/12/12

Compliance Paths and Comfort Temperatures/Zones – GCZM, CMM & ACS
See also Slide-3
ACS Trademark Chart
NEW
NEW
11/12/12

Magic of Air Movement
• How air movement (velocity) is perceived ?
– < 0.25 m/s unnoticed (stationery air)
– 0.25-0.50 pleasant – 0.50-1.00 awareness of air movement – 1.00-1.50 draughty – > 1.50 annoyingly draughty
Perceptions shown apply to cooling situation The perceptions “droughty and annoyingly draughty” are subjective. Those who are acclimatized to warmer ambient will accept higher limits
for these perceptions of acceptability and annoyance.
11/12/12

Magic of Air Movement (contd . . .)
• Air movement has a big say. Here is a relation between subjective reactions to various velocities
< 0.25 m/s unnoticed
0.25-0.50 pleasant
0.50-1.00 awareness of air movement
1.00-1.50 draughty
> 1.50 annoyingly draughty
• In cold weather and heated rooms, reactions will be different
• Cooling effect is due to both Convection and Evaporation; it is called physiological cooling effect.
• Air movement removes the “saturated air envelope” of sweat over the body and exposes bare body surface and facilitates heat exchange. Improvement is 2-fold – larger area and heat transfer rate.
11/12/12
Magic of Air Movement
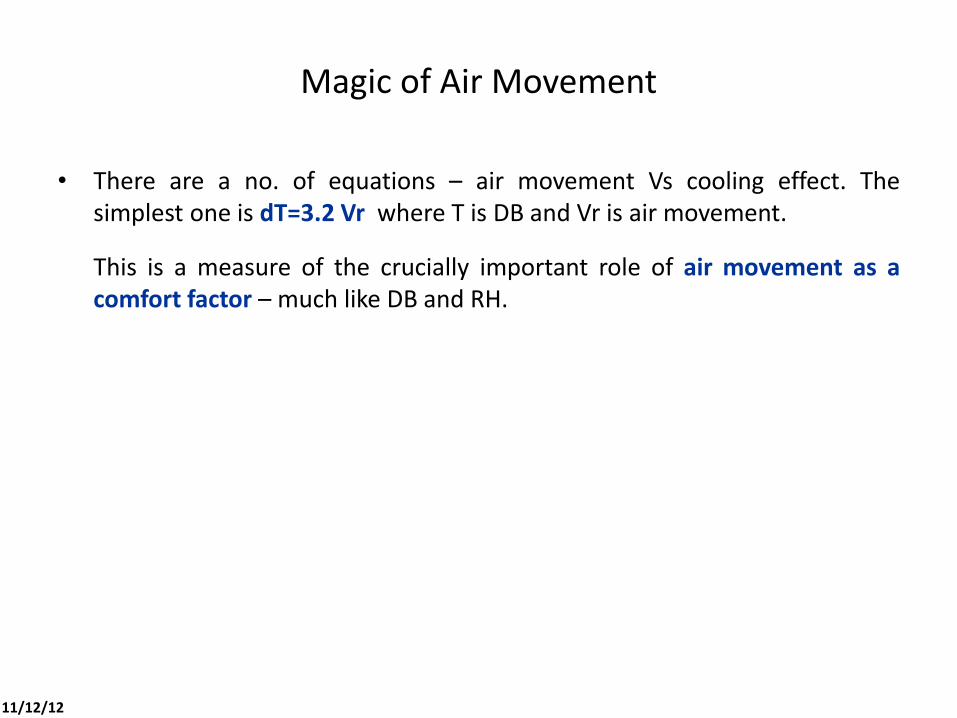
• There are a no. of equations – air movement Vs cooling effect. The simplest one is dT=3.2 Vr where T is DB and Vr is air movement.
This is a measure of the crucially important role of air movement as a comfort factor – much like DB and RH.
11/12/12

Adaptive Comfort SET Introduced for Calculation of Cooling Effect of Air Movement
Fig. 15 – Comfort Temperature on Psychrometric Chart with SET lines Superimposed
Standard Effective Temperature (SET) is a sub-set of ET* under standardized conditions: clothing standardized for given activities (thus the effective heat transfer coefficients h’s and h’es). Then the process of standardization was continued in terms of metabolic rate and clothing and establish that an inverse change of clo can compensate for an increase of met.
Expansion of
Comfort Zone
(in cooling
season) by
increasing air
movement
11/12/12

Adaptive Comfort “The Design Solutions” that Benefit from the
Third Compliance Path (ACS)
Fig. 16 – Availability of Passive Cooling Systems 11/12/12

Adaptive Comfort Comfort Vs Energy
Fig. 17– Comparison of recommended indoor comfort temperatures, upper limits of ACS Vs. ASHRAE Std,. 55. Darker areas indicate larger differences between
set point temperatures and therefore larger energy savings
Energy savings when used in MMS Mode –
11/12/12

Adaptive Comfort Energy Saved over 65% with IDEC+DEC compared to HVAC
Sl.No Description DEC IDEC AC
1 Connected Power 225 252 554.5
2 Consumed Power 178.2 240 514
3 Cooling Energy - KWHc 2877501 2890726 4770756
4 Consumed Electrical Energy - KWHe 248786 311731 1187902
5 Electrical Energy/Sqm/year 26.81 33.59 128.01
5.1 DEC/AC 0.203 ― ―
5.2 IDEC/AC 0.262
6 COP 11.57 9.27 4.02
6.1 DEC/AC 2.87 ― ―
6.2 IDEC/AC ― 2.3 ―
Energy Saving between AC & IDEC 876171
Over 65%
These figures are based on detailed heat gain calculations made for 2 hour time segments, the day chosen being the 21st day of each month. Energy calculations have been made for each 2-hour segment. The design incorporates variable speed motors to supply cool air just in order to meet the cooling requirements based on heat gains. It should be kept in mind that conventional air cooling plants do not incorporate such sophisticated approach. On the other hand, the fact that such large savings are possible should alert us to the need for giving the state-of-art sophistication to an air cooling plant as are bestowed on main stream air conditioning plants.
11/12/12

Adaptive Comfort Constraints to ACS
• Applicable only for whole building comfort. Suitable for offices and residential buildings. But there is no reason why many other kinds of buildings (not all) cannot take advantage of the approach, provided they are designed and built with Adaptive Comfort Approach.
• Not suitable for industrial application, manufacturing, process application, precision work . . . DOES NOT REPLACE AIR CONDITIONING
• Windows should be openable and accessible.
• Activity levels to be within 1 to 1.3 met.
• Freedom to wear clothing to indoor /or outdoor thermal conditions.
• 80% acceptability for typical application is recommended.
• 90% for higher comfort levels
• Standard 55-2010 includes Adaptive Comfort Approach as one of the three paths for compliance
11/12/12

Adaptive Comfort Uses of ACS
• As a design solution for compliance to ASHRAE Standard 55-2010 through Compliance Path-3 with 80% to 90% acceptability
• Use simulation tool and check with ACS whether thermal conditions achievable are acceptable. If no, make design modifications and try. Repeat process.
• Application to Mixed Mode buildings. Apply ACS as an operating guideline. Benefits could be down sizing the plant, first cost reduction, energy saving . . .
• Apply ACS to Task/Ambient Conditioning (TAC) systems. A buildings ambient can be allowed to float within border limits of ACS with individual controls to elevate local comfort levels.
• Use for regional climate analysis to identify feasibility of using natural
ventilation.
11/12/12

Adaptive Comfort Psychrometric Chart with SET
For day-to-day use and for A to Z calculations for design, the Comfort
Temperatures (tn) need to be converted to SETs (Standard Effective
Temperature). Psychrometric charts incorporating SETs are not usually available
on a practitioner’s desk, but they are available. tn is linked to SET on such a
chart. See next slide for a copy of the SET chart. The worked example in the
article illustrates the procedure. According to an expert “. . . for general
everyday work the SET scale is the most appropriate . . .”
11/12/12

Adaptive Comfort Psychrometric Chart with SET and WB Lines Super-imposed
Fig. 18 11/12/12

Adaptive Comfort SET Chart – Focus on RH
• Although DB may comply with Standard 55-2010, the Ws is higher at 12 g/kg. Whether this will be acceptable or if the -----
limit should be adhered to, should be a matter for debate. Possibly, comfort laboratories, within the country and with
Indians as subjects revision can be considered on this and such other issues.
• WB in this country are often mainly in the 20-25°C band. Whether this entire band or a smaller band could also be
included with in the ambit of discussions.
Fig. 19
11/12/12
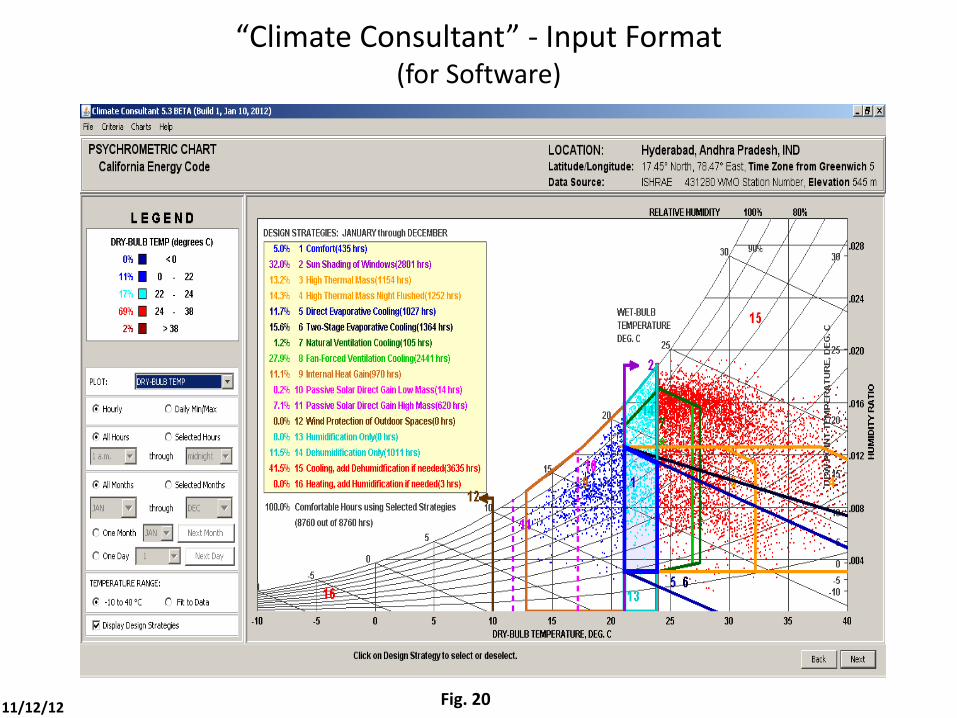
“Climate Consultant” - Input Format (for Software)
Fig. 20 11/12/12

Study of Three Compliance Paths Revisited
Application
Graphic Computer Zone
Method (GCZM)
Computer Model
Method (CMM)
Adaptive Comfort
Standard (ACS)
Air Conditioning for
Typical Areas
Air Conditioning
for General Areas
For Naturally
Conditioned Spaces
met 1.0 - 1.3 1.0 - 2.0 No limitations
clo 0.5 - 1.0 upto 1.5 clo No limitations
Acceptability 80% 0.5<PMV<+0.5 and
PPD < 10
80% for typical
applications
90% for higher comfort
levels
Dissatisfaction
10% for general (whole body)
thermal discomfort
+
10% for local thermal
discomfort
Table No. 5.2.1.2
not shown. See text
See the trademark fig.
5.3 of ACS
(for NC spaces)
for acceptable
temperatures.
Air speed
> 0.2 m/s (40 fpm) > 0.2 m/s
No air speed limits
Limit is 0.8 m/s but with clo
value between 0.5 & 0.7 and
MET values between 1.0 &
1.3 speed can be even higher
when using SET method
For using higher
speeds,
use fig. 5.2.3.1
Humidity –
Upper Limits HR<0.012 kg/kg No limits No limits
11/12/12

ASHRAE Std. 55-2010 Comfort Model
• Software program to determine compliance with ASHRAE Standard 55-2010.
• Inputs required :
DB,
Mean Radiant Temperature
Air Velocity (Speed Velocity)
Relative Humidity (RH)
Metabolic rates (METs)
Clothing Insulation.
• Location of the subject (defined by view factors)
• Output – See slide # 51
• Besides indicating compliance with ASHRAE Standard 55-2010, the Comfort Model calculates SETs also simultaneously. This can help arriving at acceptable comfort temperature as a result of interaction with users. The several input parameters noted can be changed to see the effect of such changes and the SET and also work towards achieving accuracy compliance with Standard 55-2010.
11/12/12

ASHRAE Std. 55-2010 Comfort Model
Fig. 21 11/12/12

Adaptive Comfort Big Names in Comfort
T.Bedford Pioneer in field studies on acceptable temperature for factory workers, worked in 1930s.
Baruch Givoni BSc(Architect) MSc (Hygiene) PhD, USA Department of Architecture and Urban Design , School of Arts and
Architecture University of California , UCLA , Los Angeles, USA
(Reverend) Michael A Humphreys BSc (Dunelm), MA(Oxon), Dip Ed(Dunelm)
Physicist, Architect, Oxford Brookes University, UK
Victor Olgyay Principal Architect on Rocky Mountain Insitute’s, USA, Built Environment Team, Associate Professor and Director of Research at the University of Hawaii School of Architecture
J.Fergus Nicol BSc in Physics, Architect, University of North London & Oxford Brookes University, UK
Andris Auliciems Prof.in Geography, University of Queensland, Brisbane
Nick Baker Physicist, Joint Director of the Martin Centre, lecturer in the Dept. of Architecture, University of Cambridge, Director of Cambridge Architectural Research Ltd.
11/12/12

Big Names in Comfort
Steven V.Szokolay Honorary Associate Professor, Diploma in Architecture, Masters in Architecture (L’pool), PhD (Qld). Architect, University of Queensland, Brisbane, Director of the Architectural Science Unit, later the Head of Department of Architecture. Consultant for several UN organizations
Prof. P.O.Fanger Director, Professor, D.Sc. International Centre for Indoor Environment and Energy Technical University of Denmark,
de Dear, R. BA, PhD in Applied Climatology, University of Queensland, Australia, Head of Architectural Design Science, The University of Sydney
Gail S Brager B.S., University of California, Santa Barbara, M.S. Mechanical Engineering, University of California, Berkeley, Ph.D. Mechanical Engineering, University of California, Berkeley, Professor of Architecture; Associate Director, Center for Environmental Design Research
11/12/12

Striking Ways of Projecting Adaptive Approach
. . . The environmental costs of maintaining conditions of comfort are high, not least because: “the conventional application of fixed comfort standards, as described by ASHRAE, CIBSE and other regulating institutions would preclude passive cooling as an alternative to air conditioning and commit our future to a lifetime of high energy use”) . . . .
- Baker 1993
. . . If the great “paradox” of modern approaches to building design is to be avoided: “that the same mechanical systems which give us clean, conditioned air inside the building are simultaneously polluting the outside environment”. . . .
- Fitch 1972
. . . Socially and culturally distinct ways of achieving “thermal delight” (e.g. promenading, sitting in a shaded courtyard, moving to foothills in summer) and the immense variety of heating and cooling systems involved (e.g. fires, saunas, gardens). Such strategies and systems of thermal regulation, should not be designed out of existence in the name of a thermally neutral world. . . .
- Heschong 1979
11/12/12

Wrap-up
• No Indian voice in evolution of Adaptive Comfort Approach. Some South East Asian countries like Singapore, Malaysia, Thailand . . . have taken due care to involve themselves.
• Urgent need to establish Comfort Labs in India – develop our own Comfort Temperatures.
• Need to debate issues either in advance or as they pop-up.
• Developing a proactive approach and an unshakable engineering will.
______________
Stop Press !
• Work on producing comfort temperature for Indian stations are being framed based on principles of Adaptive Approach. CEPT and TERI are involved in this exercise. The CEPT is also setting up two labs in their organization. Sooner they go on stream, the better.
11/12/12

Bibliography For Adaptive Comfort
• Climate, Comfort, & Natural Ventilation: A new adaptive comfort standard for ASHRAE Standard 55, UC Berkeley: Center for the Built Environment - April 2001 - Brager, G, S., de Dear, R.(2011).
• “Adaptive Thermal Comfort and Sustainable Thermal Standards for Building” – J.Fergus Nicol and Michael A Humphreys – Oxford Centre for Sustainable Development, School of Architecture, Oxford Brookes University, Gipsy Lane, Oxford OX3 0BP, UK
• “Thermal Comfort” – Fergus Nicol, LEARN, School of Architecture, University o f North London, UK.
Thermal Comfort
• “Thermal Comfort” – Andris Auliciems and Steven V.Szokolay – in association with the University of Queensland Dept. of Architecture – PLEA NOTES
Evaporative Cooling (Indirect) & Alternates to Air Conditioning Systems
• “Alternative to Air Conditioning Systems - as a response to Challenges to Sustainability” - Paper presented by R.V. Simha at ACRECONF, New Delhi, 2007
• “A Fresh Approach to Evaporative Cooling” - Published in the Oct-Dec 2008 issue of Air Conditioning and Refrigeration Journal (ISHRAE)
A Fresh Approach to an Evaporative Cooling plant systems embracing selection of outside design conditions, design approach & methodologies, comfort temperature, plant sizing, annual energy calculations – all calculations made in spreadsheet is presented in this article.
Applying Adaptive Comfort
• “A Survey of The Adaptive Comfort Approach & Its Impact On Alternates-to-Air Conditioning” - Paper presented by R.V. Simha at NCRAC – 2011, Indian Institute of Technology, Chennai
This article covers the selection of the comfort temperature by ACS, designing of the suitable system thereafter – psychrometric and other calculations required by the HVACRR engineer for his day-to-day work. All calculations made in spreadsheet. The methodology is explained in detail with an illustrative example.
Further Reading
• “Comfort – A review of philosophies and paradigms” – Heather Chappells, Elizabeth Shove
• “Thermal Comfort” - Sarah Darby and Rebecca White, Environmental Change Institute, University of Oxford 11/12/12

Thank You !

STORE

From 500 BC to 1700 AD
• The punkah fan was used in the India in the early 500 BC. It had a canvas covered frame that was suspended from the ceiling. Servants, known as punkawallahs, pulled a rope connected to the frame to move the fan back and forth.
• A Chinese inventor Ding Huan invented a rotary fan in the 2nd-century BC. He belonged to the Han Dynasty. It seems his fans had seven wheels about 3 m in dia each. It was operated manually. Later in the middle of the 8th century, an emperor Liang Tian built an imperial palace which boasted of an air conditioning which was run by a water turbine. Hand operated bellows also were in use by manual workers.
• In the 17th century, Cornelis Drebbel demonstrated "turning Summer into Winter" for James of England by adding salt to water

The Industrial Revolution
• Then came the Industrial Revolution (19th century). With it fans were belt-driven with factory made water wheels. The metal fan blades were added. Other developments like over-head shaft
What came to be called centrifugal fans became available. They were put to use in Factories, coal-mines etc
• American fans came around 1890 to the early 20’s.
• Robust constructions, glittering and gleaming brass blades & cages made them attractive.
• Advent of steam engines (1815), advent of electricity (1900), . . . electric motors (to drive machines) follow

First Scientifically Designed Air Conditioning Plant
• Air conditioning in the early1800s
• Early workers – John Gorrie, Practicing Doctor: Stuart W Cramer, Textile Engg: W.H.Carrier, Father of Air conditioning . . .
• The birth of the psychrometric chart - 1904
• First scientifically designed air conditioning plant - Sackett-Wilhelms Lithography and Publishing Company of Brooklyn, New York - 1906

Magic of Air Movement
• Air movement increases
– Sensible cooling power of air (by raising Sensible Heat Transfer Co-efficient
– Latent cooling (by raising Evaporative Heat Transfer Co-efficient)
• Apart from latent cooling due to higher values of Evaporative Heat Transfer Co-efficient attained, air movement achieves further cooling by removing the film of saturated air that would otherwise blanket the body surface. Thus, the escape path (larger surface) for further evaporation becomes available.

Adaptive Principle, Variable Temperature Standard
• The Adaptive Principle is ― if a change occurs such as to produce discomfort, people react in ways which tend to restore their comfort.
• The restored comfort temperature will not be the same as its value before the change
• The comfort temperature is thus a result of interaction between the subjects and the building or the other environment they are occupying.
• Note the comfort zone for summer - 24°C to 35°C = 11°C (28.3+3.5+3.2). Compare this with 24°C to 28°C = 4°C.
• Proportions of subjects comfortable depends on mean indoor temperature. This in turn depends on the outdoor temperature

• There has been some dissatisfaction (more later about why) with this Fixed Temperature Approach. It has given raise to a Variable Temperature Approach which is leveraged essentially on putting the Adaptive characteristics of humans to work – the Adaptive Comfort Approach. In this approach the comfort temperature targeted could vary from 24°C to 35°C. A few paragraphs about the Adaptive Temperature Approach made their debut in ASHRAE Standard 2004. It didn’t look particularly different in 2007 version. It was in the 2010 version that the Adaptive Comfort Standard made its presence felt. It made a telling difference as it covered Naturally Conditioned (NC) spaces i.e., those spaces which could be kept comfortably cool without being served by Mainstream Air Conditioning involving mechanical refrigeration. Adaptive Approach, in this context, is essentially about low energy comfort cooling which would provide a meaningful alternative for realizing comfort in tropical regions of the world. That is why we have chosen the title “Thermal Comfort in India” in this presentation.

Only just a few years ago there were no such things as Thermal Comfort for “India” or for that matter, for any other country in the world. For long, comfort meant only one figure – a Fixed Temperature 23°C or 24°C with a range of 1 or 2 degree on either side. All conventional air conditioning, lately called “Mainstream Air Conditioning” – meant only Fixed Temperature Standard. RH would be mentioned, say 50 to 60 % but not normally no precision is implied – (sometimes it is just 50 to 60% Rh or not more than 60% Rh or even for that matter an unspecified floating Rh) is specified for just comfort air conditioning. The situation has not changed so far as comfort and main stream air conditioning are concerned. It is familiar territory and it will not be covered in any considerable detail.

Mainstream Air Conditioning Vs Adaptive Comfort Approach
All about Low Energy Comfort Cooling. Each one of these terms “low”, “energy”, “cooling”, “comfort” systems are need to be emphasized. “low energy is its USP. Mainstream HVAC is not a low energy system. In fact, low energy system do not contain any mechanical refrigeration. The systems “Cools”: they do not “chill”. “Chill” areas are required in projects, board rooms, computer rooms . . . are a part of large corporate buildings and the likely choice of such areas will continue to be Mainstream Air Conditioning. Adaptive Approach systems do not apply for labs, large areas in hospital & health care applications – software centers, data centers, labs . . . Although some areas even in these applications (circulation spaces, recreation, lobbies are examples) there will be many areas which benefit hugely by application of Adaptive Approach. Adaptive Approach systems are widely applied in mixed module systems in which the emphasis is in AC and accordingly will form the centre of mainstream HVAC approach.

Beating the Heat – 500 BC The Punkha Fan