Thermal and climatic zoning for construction in the … K. Verichev et al.: Thermal and climatic...
7
Adv. Sci. Res., 15, 63–69, 2018 https://doi.org/10.5194/asr-15-63-2018 © Author(s) 2018. This work is distributed under the Creative Commons Attribution 4.0 License. 17th EMS Annual Meeting: European Conference for Applied Meteorology and Climatology 2017 Thermal and climatic zoning for construction in the southern part of Chile Konstantin Verichev 1,2 , Alisa Salimova 3 , and Manuel Carpio 4 1 Institute of Civil Engineering, Faculty of Engineering Sciences, Universidad Austral de Chile, Valdivia, Chile 2 Department of Civil Engineering, Universidad de Granada, Granada, Spain 3 School of Environment, Tsinghua University, Beijing, China 4 Department of Construction Engineering and Management, School of Engineering, Pontificia Universidad Católica de Chile, Santiago, Chile Correspondence: Manuel Carpio ([email protected]) Received: 9 January 2018 – Revised: 15 April 2018 – Accepted: 23 April 2018 – Published: 4 May 2018 Abstract. This paper presents the results of the updated boundaries of thermal zones in the tree southern regions of Chile, based on the method of heating degrees-days according to hourly temperature measurements at meteo- rological stations in the last decade. The Ministry of Housing and Urban Planning of Chile has not updated these boundaries since 1999. Using the Climatic Severity index method, the relative energy consumption of dwellings was analyzed for cooling and heating in summer and winter periods, respectively. The analysis revealed that, within the limits of a single thermal zone, the energy costs for cooling in the summer period of the same house may differ by 50 %. 1 Introduction The correct definition of climatic zones for building con- struction allows building materials to be adequately selected for different geographic regions, thus minimizing energy costs for heating and cooling (Carpio et al., 2014, 2015). Chile is the longest country in the world from north to south and is characterized by the presence of multiple climatic zones (from tropical climates in the north to the Antarctic in the far south) (Kottek et al., 2006). With the additional effect of the altitude zonation of the Andes, Chile’s climates exhibit not only meridional variability, but also latitudinal variability (Sarricolea et al., 2016). Therefore, from the point of view of building climatology, Chile is a very interesting country for studying and developing this field of applied meteorology. Chile maintains an official document to regulate construc- tion norms and materials that should be used in different geo- graphical parts of the country, known as Thermal Regulation (TR) of the General Ordinance of Urban Planning and Con- structions of the Ministry of Housing and Urban Planning of Chile (MINVU) (Ministry of Housing and Urban Planning of Chile, 2009). In TR document, construction recommen- dations have been developed for seven thermal zones, which in turn were determined in 1999 by the heating degree-days (HDD) method with base temperature of 15 ◦ C (HDD15 ◦ C) (Ministry of Housing and Urban Planning of Chile, 2006). The degree-days method is widely used in the world and is used to determine climatic zones in more than 55 coun- tries. Nonetheless, thermal zoning in Chile on the basis of the degree-days method has been criticized, firstly for taking into account only the energy costs of buildings for heating in winter (which makes this zoning uncommon and almost unused in northern Chile) (Bustamante, 2009; Bustamante et al., 2009; Ossio et al., 2012), and secondly for the reliance on meteorological data from 1999 made obsolete by the con- ditions of climate change (IPCC, 2013). Three regions in the south of Chile were selected for our study. The La Araucania, Los Rios and Los Lagos regions are characterized by Mediterranean and temperate oceanic climate types, with relatively warm and rainy winters and rel- atively cool and dry summers. The construction of houses in these regions is mostly based on minimizing energy costs for heating buildings. In winter, these regions consume the most firewood for stove heating, which yields a high level of at- Published by Copernicus Publications.
Transcript of Thermal and climatic zoning for construction in the … K. Verichev et al.: Thermal and climatic...
Adv. Sci. Res., 15, 63–69, 2018https://doi.org/10.5194/asr-15-63-2018© Author(s) 2018. This work is distributed underthe Creative Commons Attribution 4.0 License.
17thE
MS
AnnualM
eeting:European
Conference
forApplied
Meteorology
andC
limatology
2017
Thermal and climatic zoning for constructionin the southern part of Chile
Konstantin Verichev1,2, Alisa Salimova3, and Manuel Carpio4
1Institute of Civil Engineering, Faculty of Engineering Sciences, Universidad Austral de Chile, Valdivia, Chile2Department of Civil Engineering, Universidad de Granada, Granada, Spain
3School of Environment, Tsinghua University, Beijing, China4Department of Construction Engineering and Management, School ofEngineering, Pontificia Universidad Católica de Chile, Santiago, Chile
Correspondence: Manuel Carpio ([email protected])
Received: 9 January 2018 – Revised: 15 April 2018 – Accepted: 23 April 2018 – Published: 4 May 2018
Abstract. This paper presents the results of the updated boundaries of thermal zones in the tree southern regionsof Chile, based on the method of heating degrees-days according to hourly temperature measurements at meteo-rological stations in the last decade. The Ministry of Housing and Urban Planning of Chile has not updated theseboundaries since 1999. Using the Climatic Severity index method, the relative energy consumption of dwellingswas analyzed for cooling and heating in summer and winter periods, respectively. The analysis revealed that,within the limits of a single thermal zone, the energy costs for cooling in the summer period of the same housemay differ by 50 %.
1 Introduction
The correct definition of climatic zones for building con-struction allows building materials to be adequately selectedfor different geographic regions, thus minimizing energycosts for heating and cooling (Carpio et al., 2014, 2015).Chile is the longest country in the world from north to southand is characterized by the presence of multiple climaticzones (from tropical climates in the north to the Antarctic inthe far south) (Kottek et al., 2006). With the additional effectof the altitude zonation of the Andes, Chile’s climates exhibitnot only meridional variability, but also latitudinal variability(Sarricolea et al., 2016). Therefore, from the point of view ofbuilding climatology, Chile is a very interesting country forstudying and developing this field of applied meteorology.
Chile maintains an official document to regulate construc-tion norms and materials that should be used in different geo-graphical parts of the country, known as Thermal Regulation(TR) of the General Ordinance of Urban Planning and Con-structions of the Ministry of Housing and Urban Planning ofChile (MINVU) (Ministry of Housing and Urban Planningof Chile, 2009). In TR document, construction recommen-dations have been developed for seven thermal zones, which
in turn were determined in 1999 by the heating degree-days(HDD) method with base temperature of 15 ◦C (HDD15 ◦C)(Ministry of Housing and Urban Planning of Chile, 2006).The degree-days method is widely used in the world andis used to determine climatic zones in more than 55 coun-tries. Nonetheless, thermal zoning in Chile on the basis ofthe degree-days method has been criticized, firstly for takinginto account only the energy costs of buildings for heatingin winter (which makes this zoning uncommon and almostunused in northern Chile) (Bustamante, 2009; Bustamante etal., 2009; Ossio et al., 2012), and secondly for the relianceon meteorological data from 1999 made obsolete by the con-ditions of climate change (IPCC, 2013).
Three regions in the south of Chile were selected for ourstudy. The La Araucania, Los Rios and Los Lagos regionsare characterized by Mediterranean and temperate oceanicclimate types, with relatively warm and rainy winters and rel-atively cool and dry summers. The construction of houses inthese regions is mostly based on minimizing energy costs forheating buildings. In winter, these regions consume the mostfirewood for stove heating, which yields a high level of at-
Published by Copernicus Publications.
64 K. Verichev et al.: Thermal and climatic zoning for construction in the southern part of Chile
mospheric pollution (Hernández and Arroyo, 2014; Ministryof the Environment of Chile, 2014).
Therefore, the main purpose of this work is to update thethermal zones based on meteorological station measurementsover the past decade in the three southern regions of Chile;to analyze the feasibility of applying the Climate SeverityIndex method (de la Flor et al., 2006; Markus, 1982) for cli-matic zoning in construction for the studied regions; and toanalyze the relative energy consumption of heating and cool-ing buildings in various thermal zones.
2 Materials and methods
2.1 Method of degree-days
A widely used method of estimating the energy costs ofbuildings for heating and cooling. The annual number ofHDD is calculated as the sum of the daily average positivedifferences between the comfort temperature inside the roomand the outside temperature:
HDDa =
365∑d=1
[24∑h=1
(Tc− Th)+]
124; (1)
where Th is the hourly measured temperature value, the (+)sign indicates the necessity to sum only the positive differ-ences between Tc and Th. In the case of cooling degree-days(CDD), it is necessary to sum only the positive differencebetween Th and Tc:
CDDa =
365∑d=1
[24∑h=1
(Th − Tc)+]
124; (2)
According to document TR MINVU, the comfort indoortemperature Tc in Chile is determined to be 15 ◦C, for com-parison in the USA and Spain this temperature is 18 and20 ◦C, respectively (Government of Spain, 2006; Owen,2013). In Chile, thermal zoning for construction is based onlyon the annual values of HDD15 ◦C and defines 7 thermalzones (Table 1). The higher the value of HDD15 ◦C, the moreenergy is needed to heat and maintain a comfortable indoortemperature.
The wide application of the method of degree-days in con-struction climatology also imposes limitations. This methodis based only on the thermal regime of a certain geographicarea, and this method is optimally applicable in regionswhere solar radiation and wind speed have a negligible con-tribution to the thermal balance of the building. On the otherhand, the use of this method is not entirely suitable for com-mercial buildings (Makhmalbaf et al., 2013), therefore in thiswork we consider residential buildings.
2.2 Climatic Severity Index method
This method was developed based on modeling the energyconsumption of houses in 50 cities of Spain under differ-ent climatic conditions (Government of Spain, 2006; de la
Table 1. Thermals zones of Chile according to TR MINVU.
Thermal Value of annualzone HDD15 ◦C
1 ≤ 5002 > 500≤ 7503 > 750≤ 10004 > 1000≤ 12505 > 1250≤ 15006 > 1500≤ 20007 > 2000
Flor et al., 2006). For this model, absolute values of energyconsumption for heating and cooling of premises in eachcity were translated into relative indices (Summer ClimaticSeverity Index – SCSI and Winter Climatic Severity Index –WCSI) and normalized for energy consumption in the city ofMadrid. The index of relative energy consumption for cool-ing and heating buildings was associated with the climaticvalues of meteorological indicators by the equation:
SCSI= as×R4m+ bs×CDD4m+ cs×R4m×CDD4m
+ ds×R24m+ es×CDD2
4m+ fs; (3)
where R4m is the average monthly value of total solarradiation for the three summer and first autumn months[kWh m−2] and CDD4m is the average monthly value ofcooling degree-days for 4 months calculated at indoor tem-perature of 20 ◦C.
WCSI= aw×R3m+ bw×HDD3m+ cw×R×HDD3m
+ dw×R23m+ ew×HDD2
3m+ fw; (4)
where R3m is the average monthly value of total solar radia-tion for the three winter months [kWh m−2], HDD3m is theaverage monthly value of heating degree-days for 3 monthscalculated at indoor temperature of 20 ◦C. The values of theletter coefficients for the two Eqs. (3) and (4) are presentedin the paper de la Flor et al. (2006). Calculated indices at anygeographical point allow the determination of the buildingclimatic zones (Table 2). For Madrid, SCSI = 1.0 and WCSI= 1.0 and corresponds to the climatic zone D3 (Governmentof Spain, 2006; de la Flor et al., 2006).
2.3 Database
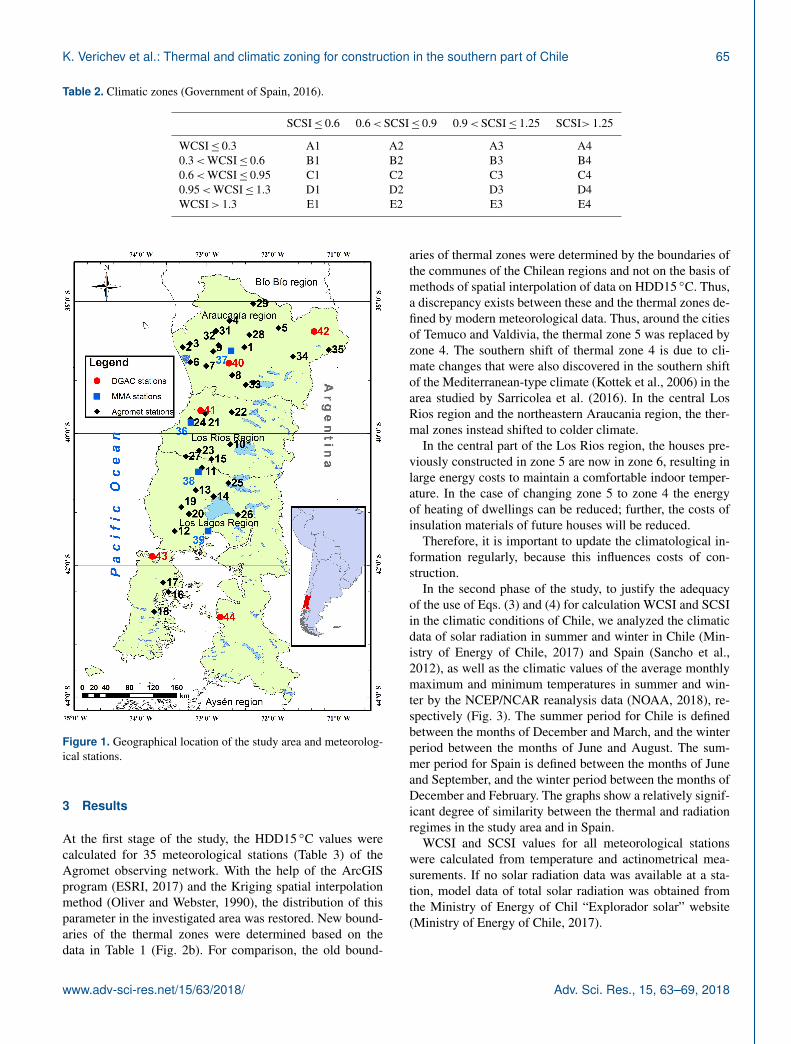
In this paper, we used the temperature and total solar ra-diation data obtained from the meteorological stations inthe studied area of the Ministry of Agriculture of Chile(Agromet), the Ministry of Environment (MMA) and the Di-rectorate General of Civil Aviation (DGAC), a total of 44stations. Their spatial-geographical locations are shown inFig. 1.
Adv. Sci. Res., 15, 63–69, 2018 www.adv-sci-res.net/15/63/2018/
K. Verichev et al.: Thermal and climatic zoning for construction in the southern part of Chile 65
Table 2. Climatic zones (Government of Spain, 2016).
SCSI≤ 0.6 0.6<SCSI≤ 0.9 0.9<SCSI≤ 1.25 SCSI> 1.25
WCSI≤ 0.3 A1 A2 A3 A40.3<WCSI≤ 0.6 B1 B2 B3 B40.6<WCSI≤ 0.95 C1 C2 C3 C40.95<WCSI≤ 1.3 D1 D2 D3 D4WCSI> 1.3 E1 E2 E3 E4
Figure 1. Geographical location of the study area and meteorolog-ical stations.
3 Results
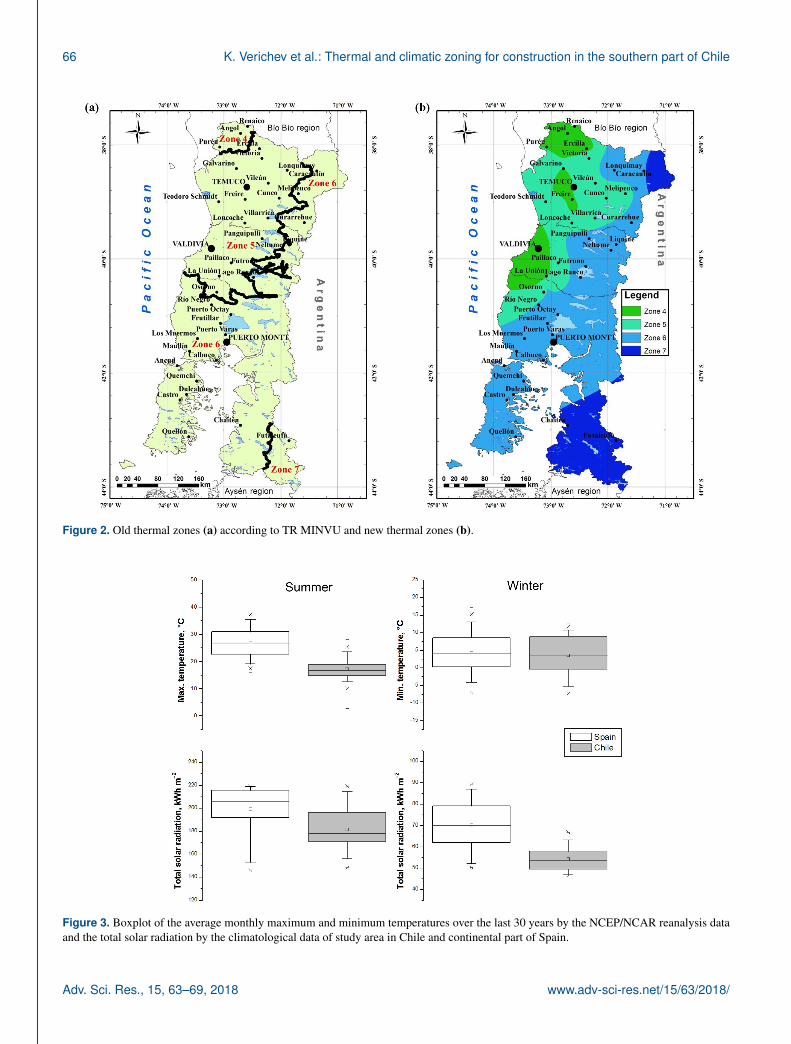
At the first stage of the study, the HDD15 ◦C values werecalculated for 35 meteorological stations (Table 3) of theAgromet observing network. With the help of the ArcGISprogram (ESRI, 2017) and the Kriging spatial interpolationmethod (Oliver and Webster, 1990), the distribution of thisparameter in the investigated area was restored. New bound-aries of the thermal zones were determined based on thedata in Table 1 (Fig. 2b). For comparison, the old bound-
aries of thermal zones were determined by the boundaries ofthe communes of the Chilean regions and not on the basis ofmethods of spatial interpolation of data on HDD15 ◦C. Thus,a discrepancy exists between these and the thermal zones de-fined by modern meteorological data. Thus, around the citiesof Temuco and Valdivia, the thermal zone 5 was replaced byzone 4. The southern shift of thermal zone 4 is due to cli-mate changes that were also discovered in the southern shiftof the Mediterranean-type climate (Kottek et al., 2006) in thearea studied by Sarricolea et al. (2016). In the central LosRios region and the northeastern Araucania region, the ther-mal zones instead shifted to colder climate.
In the central part of the Los Rios region, the houses pre-viously constructed in zone 5 are now in zone 6, resulting inlarge energy costs to maintain a comfortable indoor temper-ature. In the case of changing zone 5 to zone 4 the energyof heating of dwellings can be reduced; further, the costs ofinsulation materials of future houses will be reduced.
Therefore, it is important to update the climatological in-formation regularly, because this influences costs of con-struction.
In the second phase of the study, to justify the adequacyof the use of Eqs. (3) and (4) for calculation WCSI and SCSIin the climatic conditions of Chile, we analyzed the climaticdata of solar radiation in summer and winter in Chile (Min-istry of Energy of Chile, 2017) and Spain (Sancho et al.,2012), as well as the climatic values of the average monthlymaximum and minimum temperatures in summer and win-ter by the NCEP/NCAR reanalysis data (NOAA, 2018), re-spectively (Fig. 3). The summer period for Chile is definedbetween the months of December and March, and the winterperiod between the months of June and August. The sum-mer period for Spain is defined between the months of Juneand September, and the winter period between the months ofDecember and February. The graphs show a relatively signif-icant degree of similarity between the thermal and radiationregimes in the study area and in Spain.
WCSI and SCSI values for all meteorological stationswere calculated from temperature and actinometrical mea-surements. If no solar radiation data was available at a sta-tion, model data of total solar radiation was obtained fromthe Ministry of Energy of Chil “Explorador solar” website(Ministry of Energy of Chile, 2017).
www.adv-sci-res.net/15/63/2018/ Adv. Sci. Res., 15, 63–69, 2018
66 K. Verichev et al.: Thermal and climatic zoning for construction in the southern part of Chile
Figure 2. Old thermal zones (a) according to TR MINVU and new thermal zones (b).
Figure 3. Boxplot of the average monthly maximum and minimum temperatures over the last 30 years by the NCEP/NCAR reanalysis dataand the total solar radiation by the climatological data of study area in Chile and continental part of Spain.
Adv. Sci. Res., 15, 63–69, 2018 www.adv-sci-res.net/15/63/2018/
K. Verichev et al.: Thermal and climatic zoning for construction in the southern part of Chile 67
Tabl
e3.
Cal
cula
ted
valu
esof
HD
D15◦C
(σca
lcul
ated
for
thre
eor
mor
ean
nual
aver
ages
),W
CSI
and
SCSI
for
met
eoro
logi
cals
tatio
ns(9
5%
CI
calc
ulat
edfo
rfiv
eor
mor
ean
nual
aver
ages
)(N
o.of
stat
ion
acco
rdin
gto
Fig.
1).
No.
ofH
DD
15◦C
WC
SISC
SIN
o.of
HD
D15◦C
WC
SISC
SIN
o.of
HD
D15◦C
WC
SISC
SIN
o.of
HD
D15◦C
WC
SISC
SIst
atio
n(σ
)(9
5%
C.I.
)(9
5%
C.I.
)st
atio
n(σ
)(9
5%
C.I.
)(9
5%
C.I.
)st
atio
n(σ
)(9
5%
C.I.
)(9
5%
C.I.
)st
atio
n(σ
)(9
5%
C.I.
)(9
5%
C.I.
)
113
65(1
14)
1.02
(0.0
7)0.
29(0
.07)
1216
65(1
02)
1.03
(0.0
3)0.
05(0
.01)
2312
06(4
6)1.
000.
3134
1254
0.96
0.48
213
69(1
69)
0.85
(0.0
6)0.
10(0
.01)
1315
64(1
46)
1.14
(0.0
7)0.
04(0
.05)
2411
230.
910.
3235
2315
1.30
0.45
315
07(2
05)
0.96
(0.0
7)0.
11(0
.01)
1414
96(8
9)1.
03(0
.06)
0.11
2516
36(1
37)
1.08
0.13
36–
1.03
0.28
412
70(9
7)1.
03(0
.11)
0.38
(0.0
7)15
1325
(70)
1.02
(0.0
5)0.
2526
1556
(118
)1.
090.
1537
–0.
820.
205
1773
(162
)1.
11(0
.07)
0.31
(0.0
6)16
1904
(265
)1.
14(0
.10)
0.01
(0.0
1)27
1107
(94)
0.96
0.36
38–
1.01
0.23
612
99(1
18)
0.84
(0.0
4)0.
11(0
.01)
1718
97(1
34)
1.10
(0.0
4)0.
05(0
.03)
2813
840.
990.
3939
–0.
700.
157
1396
(100
)0.
96(0
.05)
0.19
(0.0
3)18
1814
(85)
1.13
(0.0
5)0.
06(0
.03)
2912
170.
980.
5340
–0.
990.
338
1225
(164
)1.
01(0
.06)
0.32
(0.0
7)19
1579
(38)
1.06
(0.0
4)0.
1930
1400
1.03
0.48
41–
1.04
0.33
911
67(5
2)0.
95(0
.06)
0.32
(0.0
4)20
1746
(55)
1.09
(0.0
5)0.
1031
1251
0.97
0.35
42–
1.44
0.53
1015
25(1
01)
1.04
(0.0
5)0.
1921
1260
(70)
1.05
0.36
3211
810.
970.
2743
–0.
970.
0311
1501
(102
)1.
08(0
.04)
0.21
(0.0
4)22
1622
(92)
1.14
0.19
3313
171.
010.
3544
–1.
16−
0.05
Table 4. Average values of HDD, WCSI and CSCI for thermalzones of Chile of the study area.
HDD15 ◦C WCSI SCSI(σ ) (σ ) (σ )
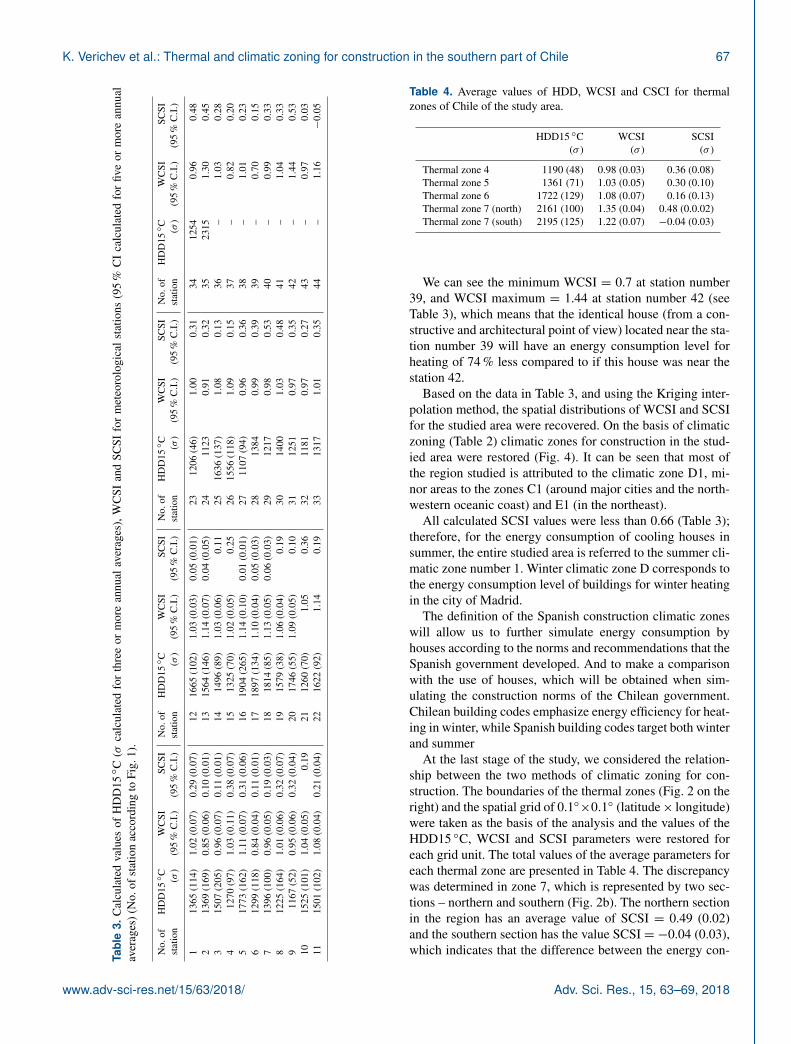
Thermal zone 4 1190 (48) 0.98 (0.03) 0.36 (0.08)Thermal zone 5 1361 (71) 1.03 (0.05) 0.30 (0.10)Thermal zone 6 1722 (129) 1.08 (0.07) 0.16 (0.13)Thermal zone 7 (north) 2161 (100) 1.35 (0.04) 0.48 (0.0.02)Thermal zone 7 (south) 2195 (125) 1.22 (0.07) −0.04 (0.03)
We can see the minimum WCSI = 0.7 at station number39, and WCSI maximum = 1.44 at station number 42 (seeTable 3), which means that the identical house (from a con-structive and architectural point of view) located near the sta-tion number 39 will have an energy consumption level forheating of 74 % less compared to if this house was near thestation 42.
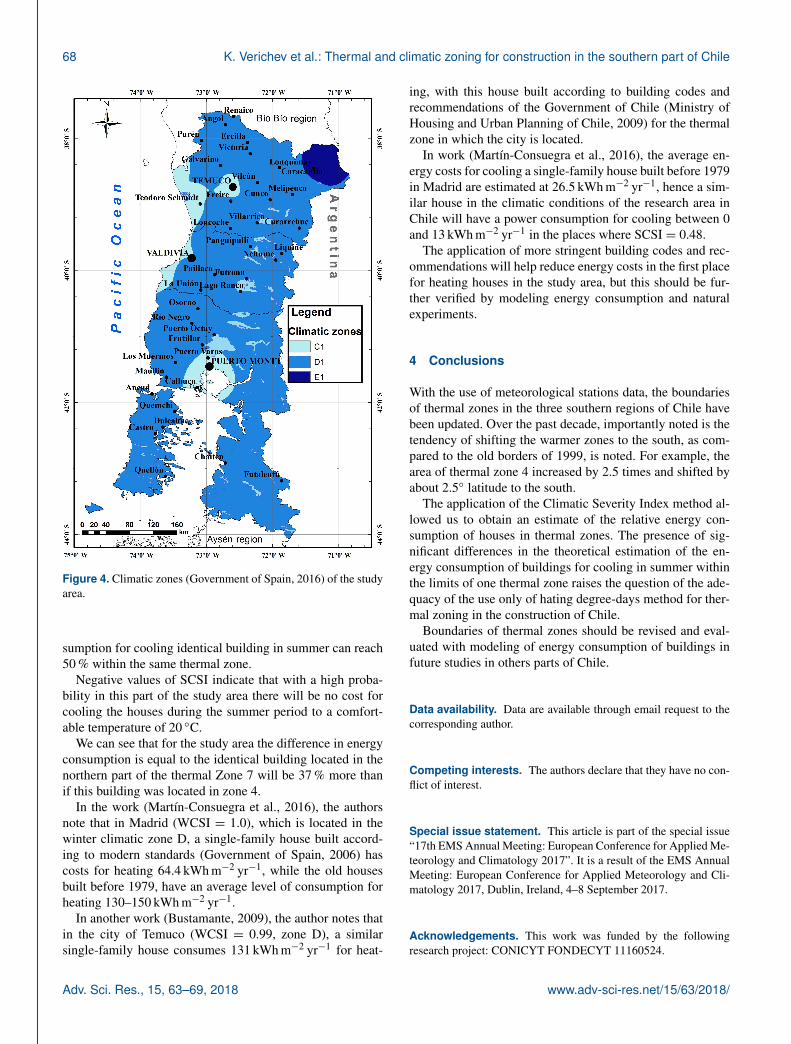
Based on the data in Table 3, and using the Kriging inter-polation method, the spatial distributions of WCSI and SCSIfor the studied area were recovered. On the basis of climaticzoning (Table 2) climatic zones for construction in the stud-ied area were restored (Fig. 4). It can be seen that most ofthe region studied is attributed to the climatic zone D1, mi-nor areas to the zones C1 (around major cities and the north-western oceanic coast) and E1 (in the northeast).
All calculated SCSI values were less than 0.66 (Table 3);therefore, for the energy consumption of cooling houses insummer, the entire studied area is referred to the summer cli-matic zone number 1. Winter climatic zone D corresponds tothe energy consumption level of buildings for winter heatingin the city of Madrid.
The definition of the Spanish construction climatic zoneswill allow us to further simulate energy consumption byhouses according to the norms and recommendations that theSpanish government developed. And to make a comparisonwith the use of houses, which will be obtained when sim-ulating the construction norms of the Chilean government.Chilean building codes emphasize energy efficiency for heat-ing in winter, while Spanish building codes target both winterand summer
At the last stage of the study, we considered the relation-ship between the two methods of climatic zoning for con-struction. The boundaries of the thermal zones (Fig. 2 on theright) and the spatial grid of 0.1◦×0.1◦ (latitude× longitude)were taken as the basis of the analysis and the values of theHDD15 ◦C, WCSI and SCSI parameters were restored foreach grid unit. The total values of the average parameters foreach thermal zone are presented in Table 4. The discrepancywas determined in zone 7, which is represented by two sec-tions – northern and southern (Fig. 2b). The northern sectionin the region has an average value of SCSI = 0.49 (0.02)and the southern section has the value SCSI = −0.04 (0.03),which indicates that the difference between the energy con-
www.adv-sci-res.net/15/63/2018/ Adv. Sci. Res., 15, 63–69, 2018
68 K. Verichev et al.: Thermal and climatic zoning for construction in the southern part of Chile
Figure 4. Climatic zones (Government of Spain, 2016) of the studyarea.
sumption for cooling identical building in summer can reach50 % within the same thermal zone.
Negative values of SCSI indicate that with a high proba-bility in this part of the study area there will be no cost forcooling the houses during the summer period to a comfort-able temperature of 20 ◦C.
We can see that for the study area the difference in energyconsumption is equal to the identical building located in thenorthern part of the thermal Zone 7 will be 37 % more thanif this building was located in zone 4.
In the work (Martín-Consuegra et al., 2016), the authorsnote that in Madrid (WCSI = 1.0), which is located in thewinter climatic zone D, a single-family house built accord-ing to modern standards (Government of Spain, 2006) hascosts for heating 64.4 kWh m−2 yr−1, while the old housesbuilt before 1979, have an average level of consumption forheating 130–150 kWh m−2 yr−1.
In another work (Bustamante, 2009), the author notes thatin the city of Temuco (WCSI = 0.99, zone D), a similarsingle-family house consumes 131 kWh m−2 yr−1 for heat-
ing, with this house built according to building codes andrecommendations of the Government of Chile (Ministry ofHousing and Urban Planning of Chile, 2009) for the thermalzone in which the city is located.
In work (Martín-Consuegra et al., 2016), the average en-ergy costs for cooling a single-family house built before 1979in Madrid are estimated at 26.5 kWh m−2 yr−1, hence a sim-ilar house in the climatic conditions of the research area inChile will have a power consumption for cooling between 0and 13 kWh m−2 yr−1 in the places where SCSI = 0.48.
The application of more stringent building codes and rec-ommendations will help reduce energy costs in the first placefor heating houses in the study area, but this should be fur-ther verified by modeling energy consumption and naturalexperiments.
4 Conclusions
With the use of meteorological stations data, the boundariesof thermal zones in the three southern regions of Chile havebeen updated. Over the past decade, importantly noted is thetendency of shifting the warmer zones to the south, as com-pared to the old borders of 1999, is noted. For example, thearea of thermal zone 4 increased by 2.5 times and shifted byabout 2.5◦ latitude to the south.
The application of the Climatic Severity Index method al-lowed us to obtain an estimate of the relative energy con-sumption of houses in thermal zones. The presence of sig-nificant differences in the theoretical estimation of the en-ergy consumption of buildings for cooling in summer withinthe limits of one thermal zone raises the question of the ade-quacy of the use only of hating degree-days method for ther-mal zoning in the construction of Chile.
Boundaries of thermal zones should be revised and eval-uated with modeling of energy consumption of buildings infuture studies in others parts of Chile.
Data availability. Data are available through email request to thecorresponding author.
Competing interests. The authors declare that they have no con-flict of interest.
Special issue statement. This article is part of the special issue“17th EMS Annual Meeting: European Conference for Applied Me-teorology and Climatology 2017”. It is a result of the EMS AnnualMeeting: European Conference for Applied Meteorology and Cli-matology 2017, Dublin, Ireland, 4–8 September 2017.
Acknowledgements. This work was funded by the followingresearch project: CONICYT FONDECYT 11160524.
Adv. Sci. Res., 15, 63–69, 2018 www.adv-sci-res.net/15/63/2018/
K. Verichev et al.: Thermal and climatic zoning for construction in the southern part of Chile 69
Edited by: Lucien WaldReviewed by: three anonymous referees
References
Bustamante, W.: Guia de Diseño para la Eficiencia Energética en laVivienda Social, edited by Ministerio de Vivienda y Urbanismo,Pontificia Universidad Católica de Chile, Santiago, Chile,203 pp., available at: http://www.minvu.cl/incjs/download.aspx?glb_cod_nodo=20070402125030&hdd_nom_archivo=Guíadedise~noparalaEficienciaEnergéticaenlaviviendasocial.pdf(last access: 14 April 2018), 2009.
Bustamante, W., Cepeda, R., Martínez, P. and Santa María, H.:Eficiencia energética en vivienda social: un desafío posible, in:Camino al Bicentenario – Propuestas para Chile, Pontificia Uni-versidad Católica de Chile, 253–282, ISBN 978-956-14-1035-0,2009.
Carpio, M., Garcia-Maraver, A., Ruiz, D. P., Martinez, A.,and Zamorano, M.: Energy rating for green buildingsin Europe, WIT Trans. Ecol. Environ., 190 381–394,https://doi.org/10.2495/EQ140371, 2014.
Carpio, M., Jódar, J., Rodíguez, M. L., and Zamorano, M.: A pro-posed method based on approximation and interpolation for de-termining climatic zones and its effect on energy demand andCO2 emissions from buildings, Energ. Buildings, 87, 253–264,2015.
de la Flor, F. J. S., Lissén, J. M. S., and Domínguez, S. Á.: A newmethodology towards determining building performance undermodified outdoor conditions, Build. Environ., 41, 1231–1238,https://doi.org/10.1016/j.buildenv.2005.05.035, 2006.
ESRI: ArcGIS, available at: http://www.esri.com/arcgis/about-arcgis, last access: 18 April 2017.
Government of Spain: Código Técnico de la Edificación (CTE),Ministerio de la Vivienda, Government of Spain, Real Decreto314/2006 de 17 de marzo, BOE 74 (2006), 11816–11831, 2006.
Hernández, Y. and Arroyo, R.: Estudio de episodios de altas concen-traciones de MP10 en Temuco y configuraciones sinópticas aso-ciadas, Strat. Rev. la Dir. Meteorológica Chile, 24, 1–24, 2014.
IPCC: Climate Change 2013: The Physical Science Basis. Contri-bution of Working Group I to the Fifth Assessment Report of theIntergovernmental Panel on Climate Change, Cambridge Univer-sity Press, UK and New York, NY, USA, 2013.
Kottek, M., Grieser, J., Beck, C., Rudolf, B., and Rubel, F.:World map of the Köppen-Geiger climate classification up-dated, Meteorol. Z., 15, 259–263, https://doi.org/10.1127/0941-2948/2006/0130, 2006.
Makhmalbaf, A., Srivastava, V., and Wang, N.: Simulation-based weather normalization approach to study the impact ofweather on energy use of buildings in the U.S, 13th Con-ference of international building performance simulation as-sociation 2013, 1436–1444, available at: http://www.ibpsa.org/proceedings/BS2013/p_2453.pdf (last access: 23 April 2018),2013.
Markus, T. A.: Development of a cold climate severity in-dex, Energ. Buildings, 4, 277–283, https://doi.org/10.1016/0378-7788(82)90057-3, 1982.
Martín-Consuegra, F., Aja, A. H., José, I. O. S., and Alonso, C.: En-ergy needs and vulnerability estimation at an urban scale for res-idential neighbourhoods heating in Madrid (Spain), Proc. PLEA2016 Los Angeles – 32th Int. Conf. Passiv. Low Energy Ar-chit. Cities, Build. People Towar. Regen. Environ., 3, 1413–1418,available at: http://oa.upm.es/44264/ (last access: 14 April 2018),2016.
Ministry of Energy of Chile: Explorador de Energía Solar paraAutoconsumo. Ministerio de Energía, Gobierno de Chile, Fac-ultad de Ciencias Físicas y matemáticas Universidad de Chile,available at: http://walker.dgf.uchile.cl/Explorador/Solar3/, lastaccess: 18 April 2017.
Ministry of Housing and Urban Planning of Chile: Manual deAplicación, Reglamentación Térmica, Ordenanza General de Ur-banismo y Construcciones (art. 4.1.10), par. I-IV, Ministerio deVivienda y Urbanismo de Chile, 2006.
Ministry of Housing and Urban Planning of Chile: Ordenanza gen-eral de urbanismo y construcciones, Ministerio de Vivienda y Ur-banismo de Chile, Decreto Supremo 47 de 1992, 2009.
Ministry of the Environment of Chile: Planes de Descontami-nacion Atmosferica, 34, available at: http://portal.mma.gob.cl/wp-content/uploads/2014/08/articles-56174_Plan_Descont_Atmosferica_2014_2018.pdf (last access: 14 April 2018), 2014.
NOAA: National Oceanic & Atmospheric AdministrationNCEP/NCAR Reanalysis, available at: https://www.esrl.noaa.gov/psd/data/gridded/data.ncep.reanalysis.html, last access: 5February 2018.
Oliver, M. A. and Webster, R.: Kriging: a method of interpolationfor geographical information systems, Int. J. Geogr. Inf. Syst., 4,313–332, https://doi.org/10.1080/02693799008941549, 1990.
Ossio, F., Veas, L., and De Herde, A.: Constructive Standardsfor Adapted Thermal Performance of Educational Buildings inChile, PLEA2012 – 28th Conf. Oppor. Limits Needs Towar. anEnviron. responsible Archit., 2012.
Owen, M. S. (Ed.): ASHRAE Handbook – Fundamentals,ASHRAE, 2013.
Sancho, J., Riesco, J., and Jiménez, C.: Atlas de Radiación Solaren España utilizando datos del SAF de Clima de EUMET-SAT, Minist. Agric., 162 available at: https://www.aemet.es/documentos/es/serviciosclimaticos/datosclimatologicos/atlas_radiacion_solar/atlas_de_radiacion_24042012.pdf (last access:14 April 2018), 2012.
Sarricolea, P., Herrera-Ossandon, M., and Meseguer-Ruiz, Ó.: Cli-matic regionalisation of continental Chile, J. Maps, 5647, 1–8,https://doi.org/10.1080/17445647.2016.1259592, 2016.
www.adv-sci-res.net/15/63/2018/ Adv. Sci. Res., 15, 63–69, 2018