There and Back Again: A Stock’s Tale - University of Arizonalamfin.arizona.edu/rsrch/TABA.pdf ·...
40
Current draft: March 27, 2017 First draft: February 1, 2012 There and Back Again: A Stock’s Tale Christopher G. Lamoureux * The October 2, 2007 delisting of Maxim Integrated Products (MXIM), a $9 billion S&P 500 company affords a singular perspective on delisting and the determinants of market quality. Since investors expect MXIM to relist after expensing (improperly backdated) executive options, its return dynamics are largely unaffected by delisting–despite trading on the Pink Sheets and the delisting of its options. 3.5 months after delisting management warns that compliance with SEC requirements will be delayed. Following this announcement the stock’s market quality declines significantly. The stock and options are relisted in October 2008 and market quality largely returns to pre-listing norms. Key Words: Investor attention; price pressure; Pink Sheets * Department of Finance, The University of Arizona, Eller College of Management, Tucson, 85721, 520–621– 7488, [email protected]. I am grateful to Alice Bonaim´ e, David Brown, Scott Cederburg, Lauren Cohen, Luke DeVault, Terry Hendershott, George Jiang, Eric Kelley, Juhani Linnainmaa, Gary Sanger, Rick Sias, Neal Stoughton, Subra Subrahmanyam, and Darren Tait of the Options Clearing Corporation for productive discussions. The current version of this paper can be downloaded from lamfin.arizona.edu/rsch.html .
Transcript of There and Back Again: A Stock’s Tale - University of Arizonalamfin.arizona.edu/rsrch/TABA.pdf ·...

Current draft: March 27, 2017First draft: February 1, 2012
There and Back Again: A Stock’s Tale
Christopher G. Lamoureux∗
The October 2, 2007 delisting of Maxim Integrated Products (MXIM), a $9 billion S&P 500 companyaffords a singular perspective on delisting and the determinants of market quality. Since investors expectMXIM to relist after expensing (improperly backdated) executive options, its return dynamics are largelyunaffected by delisting–despite trading on the Pink Sheets and the delisting of its options. 3.5 monthsafter delisting management warns that compliance with SEC requirements will be delayed. Followingthis announcement the stock’s market quality declines significantly. The stock and options are relisted inOctober 2008 and market quality largely returns to pre-listing norms.
Key Words: Investor attention; price pressure; Pink Sheets
∗Department of Finance, The University of Arizona, Eller College of Management, Tucson, 85721, 520–621–7488, [email protected]. I am grateful to Alice Bonaime, David Brown, Scott Cederburg, Lauren Cohen,Luke DeVault, Terry Hendershott, George Jiang, Eric Kelley, Juhani Linnainmaa, Gary Sanger, Rick Sias, NealStoughton, Subra Subrahmanyam, and Darren Tait of the Options Clearing Corporation for productive discussions.The current version of this paper can be downloaded from lamfin.arizona.edu/rsch.html .

1. Introduction
A stock’s market quality broadly refers to trading costs in that stock. Measures of market
quality include: the size of the bid-ask spread, the presence of price reversals, squared stock
return scaled by trading volume, and the speed of information assimilation. Market quality varies
across stocks, and recent research in finance focuses on institutional differences and constraints
on investor attention as drivers of these cross-sectional differences. Both institutional differences
and limited investor attention are related to research on the limits of arbitrage which recognizes
that (dealer) risk capital is in limited supply and slow moving.
While many studies have identified variables that are correlated with measures of market
quality, determining causality is elusive because most of these variables are determined simulta-
neously. Roll, Schwartz, and Subrahmaniam (2009) and Kumar, Sarin, and Shastri (1998) show
that stocks with traded options react more quickly to information than those without. Hong,
Lim, and Stein (2000) show that analyst coverage is related to the speed of information assim-
ilation. Hou and Moskowitz (2005) show that analyst coverage, percentage of shares owned by
institutions, number of shareholders, number of employees, and advertising expenses are all re-
lated to the speed of information assimilation.1 In this paper I consider a case study that affords
insights into the relationships between institutional structures, trading dynamics, and investor
inattention.
On October 2, 2007, Nasdaq delisted the stock of Maxim Integrated Products (MXIM) and
the options exchanges followed suit because the company was out of compliance with the Secu-
rities and Exchange Commission’s (SEC) timely filing and proxy requirements, as a result of the
backdating of executive stock options.2 Consequently the stock traded on the lowest tier of the
Pink Sheets (OTC PINK) for over a year before relisting on Nasdaq and the options exchanges
on October 8, 2008.3 At the time of delisting MXIM was an S&P 500 company with a market
capitalization of $9.4 billion. The company was sound financially: the book value of its assets
was $3.6 billion, it had no long-term debt, and the book value of its current liabilities was $0.4
billion. While its stock traded on the Pink Sheets MXIM’s senior management: continued to hold
quarterly conference calls which were attended by many buy-side analysts following the industry;1Hirshleifer and Teoh (2003) and Peng and Xiong (2006) discuss how limited attention can affect return dynam-
ics. Hou and Moskowitz (2005) show that there is significant cross-sectional variation in the speed at which stockprices react to information. They find that firms that react slower have higher rates of return. Additional studiesthat document a gradual diffusion of information in some stocks relative to others include: Hou (2007), Cohen andLou (2012), Menzly and Ozbas (2010), and Chordia, Sarkar, and Subrahmanyam (2011). Boguth, Carlson, Fisher,and Simutin (2015) show that cross-sectional differences in the speed with which information becomes impoundedin price are important for measuring risk and return in asset pricing studies. Even the timing of informationreleases is endogenous. In a study on the limits of investor attention, Dellavigna and Pollet (2009) show that themarket takes longer to assimilate news releases on Fridays than on the other days of the week. They also showthat companies that release earnings news on Fridays are smaller than other firms.
2Appendix A contains a timeline of events around MXIM’s delisting.3Appendix B contains details on the organization of the Pink Sheets.
1

engaged in several acquisitions; and continued to pay its $60.3 million quarterly dividend–even
raising this by 6%. Furthermore, all of the executives involved in the backdating scandal had
been dismissed from the company more than a year before delisting. In sum, the reasons for the
delisting had nothing to do with the current or future prospects of the company. As such this
regulatory intervention is a unique exogenous shock to the trading institutions.
Three and one-half months after delisting, on January 17, 2008, MXIM announced that its
restatements and resultant SEC compliance would be delayed an expected three months, possibly
longer. This is news to the market as the stock lost 27% of its value over the next three days
and 49% of outstanding shares are traded over the 16 days following this announcement. MXIM
continues to trade on the Pink Sheets through October 8, 2008, when it is relisted on Nasdaq,
and its options are also relisted.
I analyze the effects of these events on MXIM’s share ownership, measures of market quality
and trading dynamics. The time frame for my analysis is January 3, 2006 through December 31,
2009. This is divided into five subperiods: (1) Pre-delisting, January 3, 2006 - August 31, 2007,
(419 trading days); (2) Phase 1 on the Pink Sheets (PS1), October 2, 2007 - January 16, 2008,
(74 trading days); (3) Adjustment phase on the Pink Sheets, January 17, 2008 - February 8, 2008,
(16 trading days); (4) Phase 2 on the Pink Sheets (PS2), February 11, 2008 - October 7, 2008,
(168 trading days); and (5) Post-delisting, November 3, 2008 - December 31, 2009, (293 trading
days). I use differences-in-differences to evaluate the effect of the two “treatments:” delisting
per se in Phase 1 of Pink Sheets trading; and reduced clarity about future relisting in Phase 2
of Pink Sheets trading, on MXIM’s trading dynamics.
I find that most measures of market quality, including the speed and efficiency of information
assimilation, are not affected by delisting per se. This means that having listed options does not
cause a measurable increase in market quality. Similarly, moving from an organized exchange
to an electronic bulletin board requiring phone-based transactions does not cause a measurable
decrease in market quality.4 Contrary to perceptions that the Pink Sheets is dominated by retail
traders, mutual fund ownership does not decline after delisting. A likely reason for these results
is that market participants expected that the company would relist in a timely manner. There
is no evidence of a drop in investor attention or a reduction in dealer risk capital dedicated to
market making in MXIM pursuant to its delisting.
Supporting the hypothesis that investor attention–not the institutional setting–is a first-order
driver of market quality, I document a significant decline in market quality in Phase 2 of Pink
Sheets trading, as there is a significant two-day price reversal pattern. Furthermore, it also takes
4Bollen and Christie (2009); Harris, Panchapagesan and Werner (2008); and Macy, O’Hara, and Pompilio (2008)document that trading on the Pink Sheets is quite orderly.
2

two days for MXIM’s price to fully react to market and industry information in this period.
The link between these results and a drop in investor attention is provided by Hirshleifer, Lim,
and Teoh (2009, p. 2290): “a comparative statics prediction of limited attention models is that
when the amount of attention investors direct toward a firm decreases, there should be more
severe underreaction to news about the firm.” Further evidence of a drop in investor attention
is provided by media following. I find that there is no change in media and analyst coverage
in Phase 1 of Pink Sheets trading, but both of these measures drop significantly in Phase 2 of
Pink Sheets trading.5 Limits of arbitrage and disagreement models (following the taxonomy of
Hong and Stein 2007) are well suited to evaluate this situation because they have implications
for trading volume and media coverage in addition to return dynamics, and we see changes in all
three dimensions during MXIM’s second phase of Pink Sheets trading.
Hendershott, Li, Menkveld, and Seasholes (2013) note that there are two channels through
which investor inattention can impact market outcomes. First, is a misinformation channel. The
storied cases studies by Rashes (2001) and Huberman and Regev (2001) provide examples of the
misinformation channel.6 The MXIM case provides an example of the second channel–reduced
risk sharing. Investor attention drops, and correspondingly trading volume, media coverage, and
analyst following decline. In Hendershott, Li, Menkveld, and Seasholes a drop in retail traders’
attention means that institutional investors (those whose attention is not diminished) are forced
to trade with dealers. Dealer capital is slow moving and dealers are risk-averse. This gives rise
to the heightened price pressure and reversals. Corwin and Coughenour (2008) provide a link be-
tween dealer capital allocation and attention. They examine New York Stock Exchange specialist
behavior in three months of 2002, and find that when trading activity in one of the specialist’s
assigned stocks spikes that specialist lowers liquidity provision in his other stocks. They infer
that, “limited attention influences the provision of liquidity in financial markets,” (p. 3064).
Further evidence in support of this channel is provided by analyzing trading throughout the day.
The underreaction to news and price reversal both occur only during the traditional trading
session. Neither occurs in close-to-open returns, when all Pink Sheets trading is institutional,
(as shown by Ang, Shtauber, and Tetlock 2013).
I find that the bid-ask spread does not increase following delisting or the subsequent drop in
5Peress (2014) notes, it is difficult to establish a causal link between media coverage and trading activity.Journalists may be disinclined to follow a stock because it trades less actively. On the other hand traders maytrade less because there are fewer news stories. Studies which document a correlation between media coverageand trading activity include: Klibanoff Lamont, and Wizman (1998), Tetlock (2007), Fang and Peress (2009),Engelberg and Parsons (2011), and Dougal, Engelberg, Garcia, and Parsons (2012).
6Huberman and Regev (2001) show that there is a large market reaction in Entremed stock when the New YorkTimes published a favorable story about a new drug. There was nothing new in this story in light of an article inNature six months earlier. Rashes (2001) shows that shares of the closed-end fund Massmutual Corporate Investorsreact to news about MCI corporation. He attributes this to confusion about the two stocks’ ticker symbols.
3

investor attention. This is consistent with Grossman and Miller’s (1988) and Hendershott and
Menkveld’s (2014) models that treat the spread and price pressure as distinct components of
liquidity. For example, in Hendershott and Menkveld, a drop in dealer risk capital allocated to
market making in the stock can result in increased price pressure, but unchanged spread.
At the time its shares and options were delisted, MXIM was also removed from the S&P
500 Index, the Nasdaq 100 Index, and the Philadelphia Semiconductor Index (SOX). As a result
the number of institutions that own the stock drops. Nevertheless, the percentage of shares
owned by institutions rises through the time that MXIM trades on the Pink Sheets. This belies
the notion that the Pink Sheets are primarily for retail traders. Immediately upon delisting
there is a statistically significant drop in MXIM’s short interest. This result is anticipated
by D’Avolio (2002) who finds that passive indexed investors are more likely to participate in
securities lending than other types of institutions. Another possible cause for the drop in short
interest is options delisting, which might reduce the demand for shorting. Hou (2009) shows that
binding short selling constraints give rise to an asymmetry in the market’s reaction to information,
with more delays following negative news.7 However I show that the underreaction in MXIM’s
price following the drop in investor attention is symmetric with respect to good and bad news,
suggesting that short selling constraints are not the reason for the reduced speed of information
flow. This is also supported by the fact that the drop in short interest occurs immediately after
delisting and there is no delay in information assimilation or persistent reversals in Phase 1 of
Pink Sheets trading.
The paper is organized as follows. I describe the data and institutional settings in Section 2.
I summarize the results, including the differences-in-differences analysis, in Section 3. Section 4
concludes the paper. Appendix A contains a timeline of the relevant events in MXIM’s history.
I provide additional technical aspects of the Pink Sheets in Appendix B. Appendix C contains
MXIM’s January 17, 2008 press release on the delay in SEC compliance. Appendix D contains
additional technical details about my data.
2. Data and Institutional Setting
2.1 Data
The control group for the differences-in-differences analysis consists of the stocks of six compa-
nies in MXIM’s niche within the semiconductor industry. In addition to MXIM, this subindus-
try comprises the following six companies that develop and manufacture linear (analog) and
7Nagel (2005), Boehmer and Kelley (2009), and Boehmer and Wu (2010) argue that institutional ownershipfacilitates securities lending and short selling. Chen, Hong, and Stein (2002) use the number of mutual funds thatown a stock–as a percentage of all mutual funds, as their breadth variable, which they argue proxies for short sellingconstraints. Ang, Shtauber, and Tetlock (2013) conjecture that limits on short sales of Pink Sheets stocks maygive rise to temporary overpricing.
4

mixed-signal integrated circuits: Analog Devices, Fairchild Semiconductor, Linear Technologies,
National Semiconductor, ON Semiconductor, and Texas Instruments. Table 1 contains sum-
mary information about these seven stocks on two dates: the quarter-end just prior to MXIM’s
delisting (September 2017), and the first quarter-end following relisting (December 2008). This
table shows all seven companies’ market capitalization: Texas Instruments is the largest, with
equity market capitalization of $49.6 billion on September 14, 2007. MXIM’s equity value is $9.3
billion–between Analog Devices whose market capitalization is $10.9 billion and Linear Tech-
nologies with a market capitalization of $7.8 billion. The table also reports the percentage of
shares owned by 13(f) institutions on the two dates. Texas Instruments has the lowest percentage
of institutional holdings of the six benchmark stocks during the period. Institutions own only
74% of Texas Instruments’ outstanding shares on September 30, 2008. The average institutional
ownership rate for the benchmark stocks is 95% on September 30, 2007 and 89% on December
31, 2008.8
I collect open and closing prices, trading volume, and dividend information on all seven
companies from CRSP. I collect intraday data on trading activity after market close and during
trading hours from TAQ. While MXIM trades on the Pink Sheets there is no data available on
either TAQ or CRSP, so I collect price and volume data from Bloomberg. Appendix D provides
a discussion of this data. I obtain daily option trading volume and open interest for all seven
stocks from Bloomberg.
The SEC removed MXIM from its 13(f) list as soon as the stock was delisted. Therefore
these reports cannot be used to measure institutional holdings on MXIM while it is delisted. By
contrast, mutual funds are required to file their holdings on a quarterly basis (Form N-Q) and
are not affected by the 13(f) list. However (and unlike the 13(f) reports), there is flexibility as
to when (within the quarter) this report is filed. To identify quarterly mutual fund holdings, I
start with the Thompson Reuters Spectrum 1-2 Master File and remove all records from a single
fund with the same report date. Next, I eliminate multiple report dates from a single fund in the
same calendar quarter–keeping the latest. Then I aggregate across all funds with a report date
in that calendar quarter.8A curiosity in Table 3 is that several of the reported percentages owned by 13(f) institutions exceed 100%.
There are several possible explanations for this. First, institutions do not report short positions, and the totalshares owned equals the shares outstanding plus the short interest. Even this number is a lower bound in lightof dealer trading facilitation (i.e., naked shorting). In the case of ON Semiconductor, for example, some 12% ofits shares are sold short so its 1.12 ratio on September 30, 2007, is technically possible. A second possibility isreporting error. The employee filling out the 13(f) report may be looking at a portfolio report that is not up-to-date, and may make a clerical error. In fact, a review by the SEC’s Office of Inspector General, Office of Auditsof the SEC’s Section 13(f) reporting requirements, presented on September 27, 2010, explicitly states, “There isno mechanism by which the SEC scans for obvious errors in Forms 13F, resulting in these forms being uploadedin EDGAR with errors.” The report is available on the Internet: www.sec.gov/oig/reportspubs/480.pdf. A finalpossibility is that the Thompson Reuters database, which does not report options holdings although these arereported on 13(f) reports, incorrectly includes some option positions as shares.
5

Institutions that file 13(f) forms include long positions in put and call options, although this
data is not reported in the Thompson Reuters Spectrum database. The only meaningful number
in this report is the number of contracts, since (curiously) the value of the position is reported
as the stock price times the number of contracts, and no other information about the options is
provided. I obtain this data from the 13(f) filing via Bloomberg.
Exchanges and the Pink Sheets must file short interest reports with FINRA (the Finan-
cial Industry Regulatory Authority, the US exchanges’ self-regulatory organization). Prior to
September 2007 these reports were filed on a monthly basis–showing short interest as of the 15th
day of the month along with average daily trading volume in the month preceding that date.
Beginning in September 2007, reports are made twice monthly–on the 15th and last day of the
month. These reports contain average daily trading volume for the period since the preceding
report.
Either as a result of its failure to file with the SEC or not being listed on an exchange for much
of the period, MXIM is not covered by the IBES database while it trades on the Pink Sheets.
The financial blog SeekingAlpha has warehoused the transcripts and participants of the quarterly
conference calls between management and analysts. I collect information about conference calls
from all seven stocks from IBES, and use SeekingAlpha for MXIM while it is delisted. I measure
media coverage by the number of stories that include the company in Bloomberg News, from all
sources in English. Appendix D lists some of the news services included in the Bloomberg news
feed.
2.2 Institutional setting
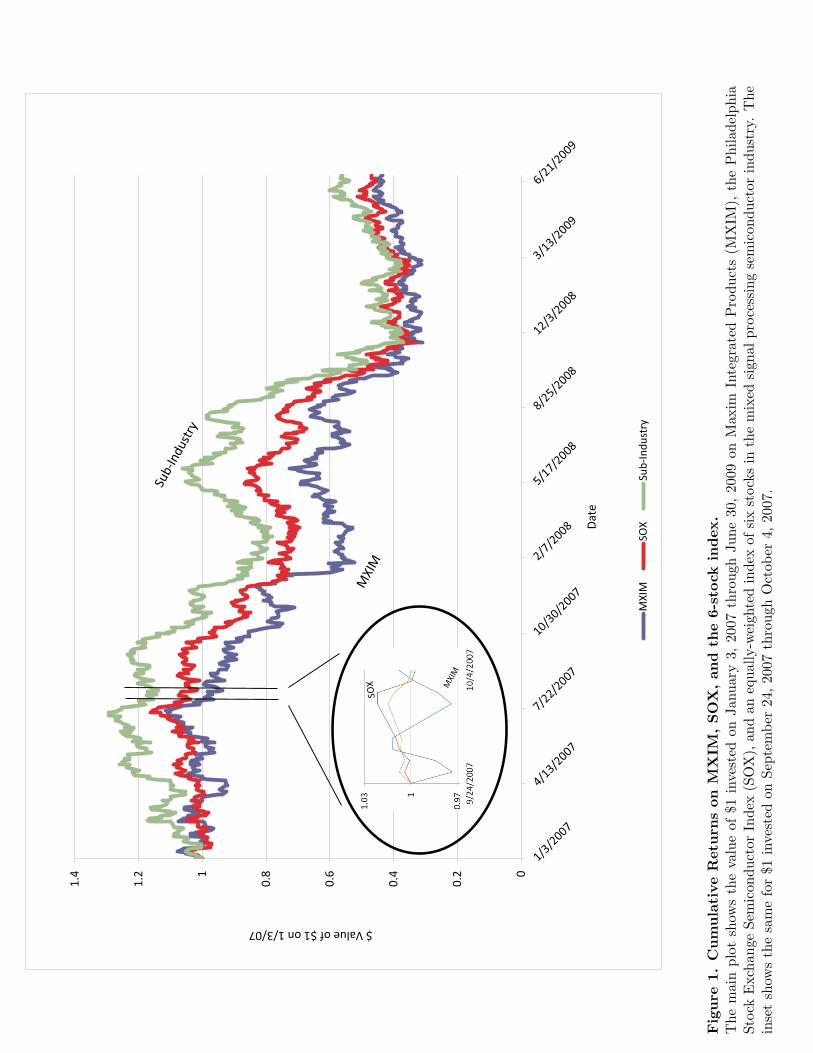
Figure 1 shows the cumulative returns for MXIM, the Philadelphia Exchange Semiconductor
Index (SOX), and the benchmark (subindustry) portfolio. Appendix A provides a timeline of
events that are material to MXIM’s delisting from, and subsequent relisting on Nasdaq. As
noted in the introduction, unlike most cases of delisting from Nasdaq to the Pink Sheets, MXIM’s
business proceeds apace while it trades on the Pink Sheets. In a Wall Street Journal MarketWatch
report from September 25, 2007, reporter Matt Andrejczak notes: “Delisting issues aside, most
Wall Street analysts are confident about MXIM’s business. The company makes analog chips used
in cars, computers, portable electronics and mobile phones. MXIM, according to Bear Stearns,
should benefit from ongoing growth trends in laptop computers, high-end mobile phones and
other portable digital electronics.”
The inset of Figure 1 shows MXIM’s returns along with the two benchmarks, over the 9-
(trading) day period September 25 through October 4, 2007. The -3% return on September 25,
when Standard & Poor’s announced that MXIM was to be deleted from the S&P 500 Index
6

on September 26, was fully reversed by September 27. Similarly, the -3% return on October
1, was fully reversed by October 4. The inset shows that both of these negative returns were
idiosyncratic, and the reversals went against the industry trends on those days. These two
V-shaped return patterns in the inset are consistent with Duffie’s (2010) discussion of price
reversals resulting from slow-moving capital. He uses index deletion as a motivating example of
this phenomenon. MXIM is much larger and more actively-traded than most index deletions,
and both of these reversals are complete within two days–the first on Nasdaq and the second on
the Pink Sheets. By contrast the reversals that Duffie describes span 30 trading days, and only
recover 95% of the loss.
In its “Options Scorecard,” last updated on September 4, 2007, The Wall Street Journal lists
142 publicly traded companies, including Apple, Microsoft, and MXIM, which were involved in
the options backdating scandals of that time. Many of these companies were under investigation
by the SEC and/or the US Justice Department. Many experienced departures of corporate
executives and/or directors, and many restated earnings and took charges as a result of the
practice of strategically choosing measurement dates for option grants. Bickley and Shorter
(2008) provide a comprehensive review of the context and the legal and regulatory actions in
this episode. While Apple and many other companies were threatened with delisting by Nasdaq,
actual delisting was rare. Mercury Interactive was delisted on January 4, 2006, and acquired
by Hewlett-Packard on July 25, 2006. Nyfix was delisted on November 1, 2005, and Power
Integrations was delisted twice, on August 2, 2006 (relisted on October 28, 2006) and December
9, 2006. MXIM is the largest company to be delisted as a result of options backdating.
Bernile and Jarrell (2009) note that the revelation of stock options backdating has virtually
no direct effect on future cash flows. However various plaintiffs brought law suits against MXIM
and its officers. One such example is Case 5:08-cv-00832-JW (2009), which serves as a useful
source of historical information on this episode.9 MXIM and its officers were involved in two
settlements. The first settlement on January 2, 2009 was for $28.5 million, of which MXIM’s
insurers paid $21 million with the rest paid by individuals who no longer worked at MXIM. The
second settlement was on May 5, 2010, under which MXIM paid $173 million, representing a
$110 million after-tax cash impact.10
Figure 1 also shows that over the entire 2.5 year period, $1 invested in MXIM, SOX, and
the benchmark fell to $0.4335, $0.4695, and $0.5612, respectively. Appendix A shows that on
9Case 5:08-cv-00832-JW, 2009, United States District Court for the Northern District of California, San JoseDivision, filed July 16.
10This represents the third highest out-of-court settlement of the options backdating episode, behind UnitedHealthcare, which paid $900 million on December 6, 2007, and Comverse Technology, which paid $225 million onDecember 17, 2009. LaCroix (2014) maintains a comprehensive website of the settlements, dismissals, and denialsof option backdating related lawsuits.
7

January 17, 2008, MXIM announced that its restatements and resultant SEC compliance would
be delayed an expected three months, possibly longer. Figure 1 reveals the large negative market
reaction to this announcement. On January 16, MXIM closed at $23.63, its closing prices over
the next three trading days were: $20.80, $19.33, and $18.07, respectively (for a cumulative
three-day loss of 27%).11 Appendix C contains MXIM’s January 17, 2008 press release.
Prior to its delisting from Nasdaq, MXIM’s last ordinary filing with the SEC was on May 3,
2006–a 10-Q form for the quarter ending March 25, 2006 (18 months prior to delisting). Between
this date and September 30, 2008, MXIM did not file financial reports with the SEC. Nevertheless,
during this period the company continued to hold quarterly conference calls, and release financial
information on the same schedule as required by the SEC. These releases included the following
caveat (from MXIM’s January 31, 2008 conference call):
I want to remind you of the contents of our January 31, 2007 press release, whichreported that due to stock option accounting matters, Maxim expects to restateits financial statements. Since the Company has not yet issued restated financialstatements, we are unable to provide detailed GAAP or non-GAAP financials forthe quarter ended December 29, 2007. As a result, all numbers contained in ourpress release and discussed on this call exclude all stock-based compensation. Thesenumbers should be treated as estimates only and are subject to change.
Table 2 contains information from these conference calls before, during, and after MXIM’s
banishment to the Pink Sheets. Panel A shows the dates of the quarterly conference calls and
the number of analysts participating in each call for MXIM and its six industry peers. The first
tabulated call for each company occurs between July 19, and September 25, 2007, when the
number of analysts ranges from a minimum of nine for Fairchild Semiconductor to a maximum
of 17 for both Linear Technologies and MXIM. Panel B shows the firms for which participating
analysts work in all six of MXIM’s calls over this period. Of the 17 firms following MXIM prior
to delisting, only one (Morgan Stanley) stops following the company immediately after delisting.
Indeed, the number of analysts at MXIM’s first conference call after delisting is one more than
at the previous call, as RBC Capital Markets and William Blair analysts participate. There is
a significant drop in analyst participation from the November 1 call to the Jan 31, 2008 call, at
which only ten analysts participate. None of the benchmark firms experience a sequential drop
of this magnitude over the period.
There are a number of analyst recommendations on MXIM in both phases of its Pink Sheets
exile. For example, AmTech Research, whose analyst, Doug Freedman, participated in both
the August and November 2007 conference calls, started MXIM with a buy recommendation on11While not the focus of this paper, this represents a $1.8 billion drop in MXIM’s value. Bernile and Jarrell
(2009) suggest that one explanation for the large market effect of options backdating revelations is fear of delistingcosts. These fears do not apply in this case as the company had been delisted for almost four months at thispoint. Adding the tax savings to the settlement, the total cash flow consequences of this episode are a net inflowof approximately $90 million.
8

November 2, 2007, the day after the November conference call. Zacks.com listed MXIM as a buy
opportunity on May 8, 2008. SeekingAlpha surveyed analysts immediately after the August 7,
2008 call, and reports that J.P. Morgan and Thomas Weisel’s analysts have overweight ratings,
while William Blair and Canaccord Adams’ analysts have market perform (hold) ratings on
MXIM.
3. Results
3.1 Institutional ownership
Table 3 provides information on institutional owners of MXIM shares before, during, and after
its delisting. Table 1 shows that in September 2007 – immediately prior to delisting – MXIM has
over 320 million shares outstanding, and 336 institutions own 88.5% of its outstanding shares.
Three institutions, Capital Research and Management, Fidelity, and Wellington own more than
25 million shares each. Although 13(f) filers are not required to report their holdings in MXIM
while it is delisted, some funds continue to do so. Table 3 shows a hedge fund, Kensico Capital
Management that buys almost 7 million MXIM shares while it trades on the Pink Sheets. Since
we cannot observe all 13(f) holdings while MXIM is delisted I focus on mutual fund holdings.
Table 3 shows that several funds that hold large positions prior to delisting increase their holdings
after MXIM is delisted, and maintain these holdings through MXIM’s exile on the Pink Sheets.
Examples of funds following this pattern include Growth Fund of America, which owns over 15
millions shares prior to delisting, buys 2 million shares after delisting and holds over 17 million
shares through the next year. Dodge & Cox has no position in MXIM in the three quarters prior
to delisting, buys over 12 million shares in the quarter following delisting, and another 7 million
shares in the following quarter. The largest position reduction in MXIM while it is delisted, in
Table 3, is by Columbia Seligman Communications and Information Fund which adds 1.2 million
shares immediately after delisting, and then sells its entire position of over 4 million shares in
the second quarter of delisting.
Table 4 shows the percentage of outstanding shares owned by mutual funds and the number
of funds that own at least one share of the seven firms in MXIM’s industry over the study period.
There is no evidence that in aggregate mutual funds are averse to owning a stock that trades
(only) on the Pink Sheets. In fact, mutual fund holdings increase by over 36%, or 31 million
shares during the year that MXIM trades on the Pink Sheets. Also, mutual funds do not reduce
their holdings following management’s January 17 announcement. Mutual funds increase their
holdings relative to other institutions significantly from the quarter immediately before delisting
to the quarter immediately following relisting. In the quarter prior to delisting, mutual funds
hold 42% of total institutional holdings. One quarter after relisting mutual funds’ share of the
9

institutional holdings is 59%.
Although the percentage of shares owned by mutual funds rises while MXIM trades on the
Pink Sheets, Table 4 also shows that the number of institutional owners is much smaller in De-
cember 2008 (at 210)–after MXIM relists than in September 2007 (336)–just prior to delisting.12
There is a 44% drop in the number of institutions that own MXIM from September 30, 2007 to
December 31, 2008, the next date for which this information is available. Similarly, the number
of mutual funds that own MXIM declines from 435 to 245 (a drop of 57%) over the same period.
The first quarter of 2008, (the second quarter after delisting), exhibits the largest decline in
the number of mutual funds that own MXIM, from 359 to 213. All of the benchmark stocks
experience large drops in the number of funds in this quarter. The decline in the number of
mutual funds that own MXIM shares, in the face of increasing mutual fund share ownership is
likely the result of MXIM’s removal from the S&P 500 Index, and to a lesser extent the Nasdaq
100, Russell, and SOX Indices. In the second quarter of 2007, 63 mutual funds of the 641 that
own MXIM are identified by name as either S&P 500 or Nasdaq 100 index funds. These passive
index funds own 8.2 million shares of MXIM. None of these funds own MXIM while it is delisted.
MXIM was added back to the Nasdaq 100 on December 22, 2008, the Russell 1000 in 2009, and
the SOX Index in September 23, 2013. The stock has not been (re-)added to the S&P 500 Index
as of this paper’s date.
3.2 Trading activity and media following
Table 5 reports the total daily trading volume, pre-session (4:00 am - 9:30 am, primarily from
8:00 - 9:30 am Eastern time) volume, and post-session (4:00 pm - 8:00 pm, primarily from 4:00
- 5:30 pm Eastern time) volume for MXIM and its industry benchmark over the five periods in
the study.13 MXIM’s total trading volume in the first phase of Pink Sheets trading is largely
in line with the pre- and post-delisting benchmark. MXIM’s volume is unusually high during
the sixteen day transition period following its January 17 announcement, 49% of outstanding
shares trade hands during this period. Because of the short duration of this period, it is not
included in the differences-in-differences analysis. Bollen and Christie (2008) note that there
is very little trading activity for most Pink Sheets stocks during the pre-open and post-session
12It may seem odd that the number of mutual fund owners reported in Table 4.B exceeds the number of 13(f)institutional owners reported in Table 1. The number of 13(f) institutions reported in Table 1 is based on firm-levelholdings as reported on the 13(f) form. By contrast, the number of mutual funds reported in Table 4 is basedon the fund-level as reported on the N-Q form. Suppose that 14 different mutual funds managed by FidelityInvestments (which comprises 567 funds) own MXIM. This would show up as 14 unique funds in Form N-Q (andin Table 4), but one institution in the 13(f) filings (and in Table 1).
13Because trading volume is highly skewed, I report quantiles of its distribution in Table 5 and use the naturallog of volume in the differences-in differences analyses reported in Table 6.
10
periods.14 Nevertheless there is unusually heavy volume in MXIM in the pre- and post-session
periods, during this transition phase. This table shows that while trading volume is much lower
in the second phase of Pink Sheets trading than in the other periods, median volume exceeds 1.5
million shares per day.
Table 6 presents the results of the difference-in-differences analysis of whether MXIM’s
behavior–relative to its peers–changes during each of the two phases of Pink Sheets trading.
Difference-in-differences has been criticized for failing to account for lack of independence and
sphericality in the residuals (Bertrand, Duflo, and Mullainathan 2004). Therefore I use a Newey-
West variance-covariance matrix, and compute the lag length to use in adjusting for serial de-
pendence using the method of Andrews (1991). Cases where the treatment effect of MXIM in
PS1 and MXIM in PS2 are statistically significant are in bold type in the table. Panels A – J
of Table 6 report the results of the difference-in-differences regressions with 6,685 (daily) obser-
vations on the seven stocks. Table 6.A analyzes the treatment effects on daily squared returns.
Overall, this Panel shows that MXIM’s squared returns are statistically significantly lower than
those of the other six stocks. Table 6.A also shows that the differences-in-differences of daily
squared (close-to-close) returns in the two treatment periods, while the stock is trading on the
Pink Sheets, are not statistically significantly different from zero.
In Panels B and C I decompose the 24-hour day into close-to-open (16:00 - 9:30) and open-
to-close (9:30 - 16:00) periods. Panel B shows that overall and in PS1, MXIM’s close-to-open
squared returns are not significantly different from its industry peers’. The difference-in-difference
of MXIM’s scale of close-to-open returns is significantly lower in PS2. Panel C shows that the
scale of MXIM’s open-to-close returns is significantly lower overall than peer stocks’. As with
the close-to-close returns in Panel A, there is no statistically significant difference-in-difference
in either of the two treatment periods.
I measure the daily range as the log-difference between the high and low prices within the
day. Panel D of Table 6 reports the difference-in-difference regressions on the range. It shows
that MXIM’s range overall is not significantly different from its peers, and also that there is no
treatment effect from either phase of Pink Sheets trading on the intraday price range.
Table 6.E considers the effect of the different regimes on daily trading volume. The difference
between MXIM’s daily log-trading volume and its peers is significantly lower in PS2, than in the
other three periods–including the first phase of Pink Sheets trading. This effect is also evident in
the raw data in Table 5. MXIM’s average daily trading volume in PS2 is less than half of what14Retail brokers will not execute customer orders on Pink Sheets stocks outside of the 9:30 - 4:00 trading day.
Pink Sheet regulations specify that trading may take place on Monday through Friday from 6:00 am to 5:00 pm.The majority of quoting and trading occurs between the open market hours of 9:30 AM to 4:00 PM (Eastern);however, market participants are free to quote and trade at any time as long as they comply with current regulations(e.g., FINRA best execution rules).
11
it is in the other periods.15
Panels F and G in Table 6 report the differences-in-differences regressions on the Corwin
and Schultz (2012) (CS) measures of (proportional) daily bid-ask spreads and spread-adjusted
return volatility.16 Panel F shows that the spread-adjusted return variance is significantly higher
in PS2, the second phase of Pink Sheets trading. There is no significant treatment effect on the
bid-ask spread in either PS1 or PS2.
Table 6.H considers the treatment effects on daily squared return scaled by trading volume.
The results of this difference-in-differences regression are not surprising in light of the fact that
in PS2 MXIM’s volatility adjusted for the spread is significantly higher and trading volume is
significantly lower. As expected, the treatment effect of PS2 on the ratio of the squared return to
volume is statistically significantly positive. Price is more responsive to volume during MXIM’s
second phase of Pink Sheets trading (there is heightened price pressure).
Panels I and J consider trading activity in the pre-session and post-session periods. Since
I evaluate the natural logarithm of volume, I substitute 50 shares for 0 in both Panel I and J
regressions. Panel I shows that there is a significant negative treatment effect on pre-session
volume in PS2, the second phase of Pink Sheets trading. There is no significant difference-in-
difference attributable to PS1, the pre-announcement Pink Sheets period, in pre-session volume.
There is a significant positive treatment effect of PS1 on post-session trading volume. This
confirms the earlier evidence concerning significant institutional trading while MXIM trades on
the Pink Sheets.
Figure 2 and Tables 1 and 6.K provide information about short interest on MXIM and its
peers. Figure 2 shows that MXIM’s short interest declines from March 2007 through September
2008, and then it rises steadily after relisting on Nasdaq. It also shows that there is significant
variation over time in average industry short interest, but MXIM’s deep drop while trading on the
Pink Sheets is not matched by its industry. Table 6.K shows that MXIM’s industry-benchmarked
short interest is significantly lower while the stock is delisted, (in both Pink Sheets periods). Here
15There are potential concerns when comparing volume across venues. The most important of these is the well-known double counting of principal transactions on Nasdaq, prior to 2001. By 2006, when this sample starts, noneof these concerns apply to “Nasdaq-listed” stocks in light of the riskless principal trade-reporting rules implementedon February 1, 2001. This rule also applies to the Pink Sheets. While it is listed on Nasdaq, MXIM trades throughthe National Market System on a variety of electronic networks. While trading on the Pink Sheets it can nottrade through any of these alternative venues. There is no reason to expect that trading volume on one market isdistorted relative to the other market. This is borne out by the data since volume in the first phase of Pink Sheetstrading is very close to volume in the pre-Pink Sheets period on Nasdaq.
16Corwin and Schultz (2012) develop a non-linear system of equations that rely on the daily high and low pricesonly. As they note, the spread between daily high and low prices depends on both the bid-ask spread and thevariance. They separate these two components by recognizing that the spread between the high and low over atwo-day period will increase roughly linearly over the daily range in the variance, but not in the bid-ask spread.This model is especially useful in analyzing MXIM’s behavior on the Pink Sheets as daily high and low prices areavailable but not bid-ask spreads.
12
the decline in the level of short selling cannot be attributed to a decline in institutional holding,
per se. Delisting has the potential to affect both the supply and demand of loanable shares
for the purpose of shorting. As noted in the introduction, D’Avolio (2002) argues that passive
index funds are an important supplier of securities lending. Options trading is likely a source of
demand for securities lending, as options market makers use short positions in the stock to hedge
open option positions. Arbitrageurs trading in both markets may also shift out the demand for
loanable shares.
Figure 2 and Table 4.L also consider the short interest ratio, that is short interest divided by
average daily volume over the preceding period (since the last measurement of short interest).
Not surprisingly, this shows a significant drop in PS1 since volume remains robust during this first
phase of Pink Sheets trading whereas the drop in short interest is contemporaneous with delisting.
The spike in this ratio, which is evident in Figure 2 is on the three short interest measurement
dates prior to management’s January 17 announcement (December 14, 2007; December 31, 2007;
and January 15, 2008). There is no difference in the difference between MXIM’s ratio of short
interest to volume and that of peer stocks in PS2 relative to the control periods.
Panels M and N of Table 6, and Table 7 evaluate the news environment for MXIM and its
industry peers over the period January 2006 through December 2009. Table 7 shows the number
of stories per month in the Bloomberg news feed (in English) for each of the seven companies.
The average number of news stories that mention MXIM in the second phase of its Pink Sheets
period is 34.8. This is lower than in any of the other periods: 65.1 in the pre-Pink Sheets period,
58.5 in the period when MXIM trades on the Pink Sheets before its charge announcement (PS1),
and 44.8 in the post-Pink Sheets period. Table 7 also shows that this variable is not highly volatile
across the four periods for the six control stocks. However, there is a high degree of cross-sectional
heterogeneity in this metric. In the pre-Pink Sheets period Texas Instruments has an average
of 200.5 stories per month, whereas Fairchild Semiconductor has an average of 24.0 stories per
month. Tables 6.M, and 6.N show the results of differences-in-differences regressions on the news
coverage that address this heterogeneity in different ways. The regression in Panel M includes
MXIM along with Analog Devices, Linear Technologies, and ON Semiconductor–excluding the
two companies with the most stories (Texas Instruments and National Semiconductor) and the
one with the fewest stories (Fairchild Semiconductor). The regression in Panel N uses all 7 stocks
and includes an indicator variable for each (accommodating a firm fixed effect). The inference
is the same from both: the number of news stories on MXIM–controlling for its peer group–is
lower in PS2, the second phase of Pink Sheets trading, than in the pre- and post-Pink Sheets
periods. By contrast, there is no treatment effect in PS1.
13
3.3 Gradual adjustment to information
Table 8 reports the results from daily market model regressions in the pre- and post-Pink
Sheets eras as well as the two phases of Pink Sheets trading, PS1 and PS2. The dependent
variable in the Table 8 regressions is the daily (close-to-close) return on MXIM. The regressors in
Panel A are the one- and two-day lagged open-to-close and close-to-open returns on MXIM, the
contemporaneous (close-to-close) return on the equally-weighted industry portfolio, and the 2-day
cumulative close-to-open and open-to-close returns on the equally-weighted industry portfolio.
Since the coefficients on all four lagged MXIM returns are statistically insignificant in each of
these regressions there is no evidence of return reversals in MXIM at the daily frequency in the
pre-Pink Sheets period and in PS1. By contrast, there is evidence of reversal of the two-day
lagged open-to-close return in the second phase of Pink Sheets trading, PS2.
The coefficients on the lagged index returns in both the close-to-open and open-to-close
periods are insignificantly different from zero in the pre- and post-Pink Sheets periods and first
phase of Pink Sheets trading. However, the coefficient on the lagged open-to-close industry
return is positive and statistically significant in the second phase of Pink Sheets trading. The
table also provides evidence that in the post-delisting period, while MXIM trades on Nasdaq, the
price overreacts to information in post-session trading, as the coefficient on the one-day lagged
close-to-open return is significantly negative.
Table 8.A also shows that the r2 from the market model regressions is also much lower while
the stock trades on the Pink Sheets than pre- and post-delisting. It is 59% both pre- and post-
delisting, but only 24% in the first phase of Pink Sheets trading and 32% in the second phase.
This reflects the importance of company-specific news about the timeliness of its SEC compliance
while MXIM is delisted. This table also shows that some price pressure remains after re-listing.
There is evidence of price pressure in the close-to-open period, since this is reversed in the next
day’s trading. Table 5 shows that trading volume in the pre-open period post-Pink Sheets is
significantly lower than in the pre-Pink Sheets period. Also a two-sample t−test of the null
hypothesis that the number of news stories post-Pink Sheets equals or exceeds the number of
stories in the pre-Pink Sheets period (shown in Table 7) is rejected at the 1% significance level.
In general the evidence suggests that relisting does not restore all measures of market quality to
their pre-delisting levels.
The next set of regressions is designed to assess whether MXIM’s delayed reaction to indus-
try information in the second phase of Pink Sheets trading can be attributed to more costly
short selling while MXIM trades on the Pink Sheets. We know that MXIM’s short interest is
significantly lower in both phases of Pink Sheets trading. To test this I interact a negative return
dummy variable with the lagged index return. If the underreaction to industry news is the result
14

of costlier short selling while MXIM trades on the Pink Sheets then it should be concentrated in
bad news and the coefficient on this interaction term should be positive. Panel B shows that the
interaction term is statistically insignificant.
Table 8.C reports the results of MXIM’s return on the lagged daily close-to-open and open-
to-close returns from the previous three days. This shows that the delayed reaction to industry
news is due equally to both of the previous two days. There is no delayed reaction to close-
to-open returns on any of the days, and the three-day lagged index return is not significantly
related to MXIM’s return on day t. In the second phase of Pink Sheets trading MXIM reacts
with a two-day lag to market information during the trading session. There is no evidence of
any underreactions in the pre- and post-Pink Sheets trading periods, or in the first phase of Pink
Sheets trading.
3.4 Options
Once the SEC forced Nasdaq to delist MXIM the options exchanges also prohibited the
opening of new options contracts on the stock.17 Table 9 contains average and median daily
trading volume for call (Panel A) and put (Panel B) options, by quarter, over the period January
3, 2006 through December 30, 2009 for MXIM and the six stocks in its subindustry. MXIM and
all benchmark companies except Fairchild Semiconductor have positive options trading volume
every day from January 3, 2007 through October 1, 2007. The average (median) daily options
volume (summing over puts and calls of all strikes and maturities) for MXIM from August 1,
2007 through delisting on October 1, 2007 is 6,950 (4,401) contracts. The median daily call
volume is 2,852 contracts and the median daily put volume is 1,549 contracts. The average total
option volume across the six benchmark firms for the same period is 5,454 contracts. The average
median call (put) volume of the benchmark stocks is 2,591 (1,363) contracts in the same quarter.
Prior to delisting trading in MXIM’s options is robust. The median daily volume statistics
show that MXIM’s option trading does not return to these pre-delisting levels even a year after
relisting. There are some high volume days, but the trading activity is more varied through the
post-delisting quarters in both put and call options than it was prior to delisting. The trading
activity in the four quarters that MXIM is delisted involves contracts that were opened prior to
delisting. The table shows that options trading continues apace in the benchmark stocks while
MXIM trades on the Pink Sheets.
17Trade in extant contracts could still take place on the exchanges; only trades closing previously open positionswere permitted. The Securities Act of 1933 (as amended) states that in order to be eligible for options trading asecurity must be a “covered security” as defined in the Act. A stock must be listed on NYSE, AMEX or NMS inorder to be a “covered security,” and hence have exchange-traded options. This restriction is also included in theOCC’s bylaws, and in each of the options exchanges’ own rules.
15
These data suggest that the option delisting had an immediate and large effect on trading in
MXIM’s call and put options. It is not the case that there was little interest in MXIM options
prior to delisting. Furthermore, consistent with the evidence on the presence of lagged close-to-
open reversals after relisting (in Table 8.A), investor attention may not be restored to pre-PS2
levels as the median volumes of call and put options remain significantly below pre-delisting levels
following relisting.
4. Conclusion
A case study can disprove a hypothesis by providing a counterexample. Maxim was delisted,
had its options delisted, and was removed from the S&P 500 Index and other indices yet it
did not experience a measurable decline in market quality. Specifically the following metrics-
benchmarked to peers-were not affected: bid-ask spread; return serial independence (no price
reversals); speed of information assimilation; squared return scaled by trading volume; percentage
of shares owned by mutual funds; media following; analyst coverage, and return variance-ex the
bid-ask spread. Therefore, we can reject the hypothesis that having listed options causes an
increase in these metrics of market quality. We can reject the hypothesis that trading on an
organized exchange (and being “listed”) causes an increase in these metrics of market quality.
We can reject the hypothesis that being included in a major index or indices including the S&P
500 causes an increase in these metrics of market quality.
The market’s reactions to MXIM’s management’s January 2008 announcement show that
the likely reason that market quality did not decline in the four months following delisting is
that major market participants believed that the stock and options would relist in a timely
manner. This belief was shaken by the company’s announcement that its compliance with SEC
requirements would be delayed. After this announcement there is measurable degradation in most
of these measures of market quality. Of the seven metrics in the preceding paragraph, only the
bid-ask spread and the percentage of outstanding shares owned by mutual funds are not adversely
affected for the remaining eight months that MXIM trades on the Pink Sheets. We can reject
institutional change as being the cause of this decline in market quality. A decline in investor
attention in the spirit of Hirshleifer, Lim, and Teoh (2009) and Hendershott, Li, Menkveld, and
Seasholes (2013) is consistent with the entire set of results. MXIM’s overall experience suggests
that investor attention is a first-order driver of market quality. Institutional features, such as
whether a stock has traded options, are not first-order drivers of market quality.
16

Appendices.
A. Maxim Integrated Products TimelineDate EventApril 1983 Maxim founded by Jack Gifford–formerly of Fairchild Semiconductor.February 29, 1988 Maxim goes public: selling 10,865,000 shares for $6 each.December 18, 1995 Maxim is added to the Nasdaq 100 Index.May 2, 2000 Standard & Poor’s announces that Maxim will be added to the
S&P 500 Index on May 9.February 22, 2002 Maxim is added to The Philadelphia Semiconductor Index (SOX).May 22, 2006 Merrill Lynch analyst includes Maxim in a list of companies with
consistent excess returns on executive stock options.June 7, 2006 Maxim announces that it had received notice that the SEC is
conducting an informal inquiry into Maxim’s stock option backdating.July 3, 2006 Maxim announces that it had ‘received a subpoena from the US Attorney
for the Northern District of California asking for documents relatingto its stock option grants and practices.’
September 28, 2006 Maxim announces that it had received a letter from Nasdaq regardingits failure to file its 10-K report for its fiscal year ending June 24, 2006.
December 19, 2006 Maxim announces that Jack Gifford is retiring as CEO.July 3, 2007 Maxim receives staff determination letter from Nasdaq stating that it is
in violation of numerous Nasdaq requirements–threatening delisting.July 9, 2007 Maxim’s Board of Directors requests a stay from Nasdaq (to allow
continued listing).August 21, 2007 Maxim pays regular $0.188 cash dividend.September 25, 2007 Standard & Poor’s announces that Maxim will be removed from the
S&P 500 Index after the close of trading on September 26.October 2, 2007 Maxim is delisted from Nasdaq and options markets, and deleted
from the Nasdaq 100 Index and the SOX Index.November 13, 2007 Maxim pays regular $0.188 cash dividend.December 2007 SEC files civil charges against Jack Gifford and former
CFO Carl Jasper.January 17, 2008 Maxim announces that it will be restating historical financial
statements to record between $550 million and $650 million of additionalstock-based compensation expense, and that its restatement will be delayedan expected three months.
February 12, 2008 Maxim pays regular $0.188 cash dividend.May 13, 2008 Maxim pays regular $0.188 cash dividend.August 20, 2008 Maxim pays $0.20 cash dividend.September 30, 2008 Maxim files all delayed and missing 10-Q and 10-K reports with the SEC.October 6, 2008 Maxim files form 8-A(12b) to register its common and preferred shares, “in
connection with the transfer of the quotation of its common stock from the‘pink sheet’ service to the listing of its common stock on Nasdaq.”
October 8, 2008 Maxim is listed on Nasdaq and options markets.November 19, 2008 Maxim pays $0.20 cash dividend.December 12, 2008 Nasdaq announces that Maxim will be added to the Nasdaq 100 Index
effective with the market open on December 22, 2008.January 11, 2009 Jack Gifford dies of an apparent heart attack.
17
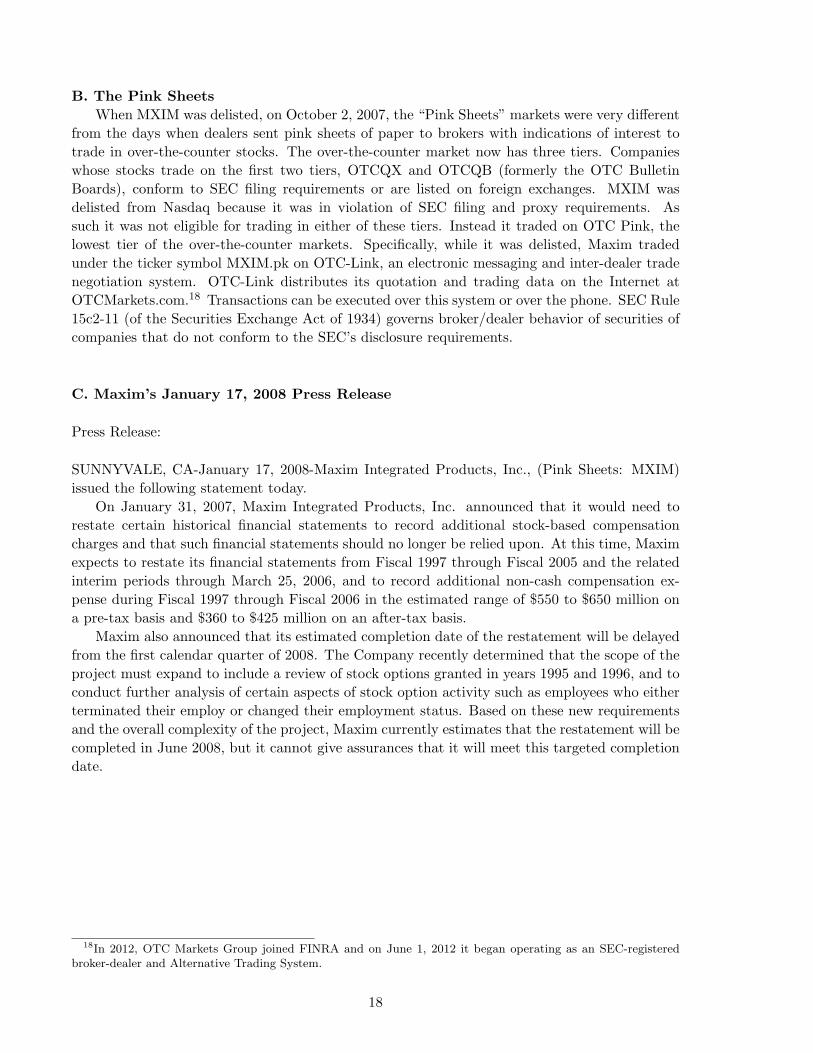
B. The Pink SheetsWhen MXIM was delisted, on October 2, 2007, the “Pink Sheets” markets were very different
from the days when dealers sent pink sheets of paper to brokers with indications of interest totrade in over-the-counter stocks. The over-the-counter market now has three tiers. Companieswhose stocks trade on the first two tiers, OTCQX and OTCQB (formerly the OTC BulletinBoards), conform to SEC filing requirements or are listed on foreign exchanges. MXIM wasdelisted from Nasdaq because it was in violation of SEC filing and proxy requirements. Assuch it was not eligible for trading in either of these tiers. Instead it traded on OTC Pink, thelowest tier of the over-the-counter markets. Specifically, while it was delisted, Maxim tradedunder the ticker symbol MXIM.pk on OTC-Link, an electronic messaging and inter-dealer tradenegotiation system. OTC-Link distributes its quotation and trading data on the Internet atOTCMarkets.com.18 Transactions can be executed over this system or over the phone. SEC Rule15c2-11 (of the Securities Exchange Act of 1934) governs broker/dealer behavior of securities ofcompanies that do not conform to the SEC’s disclosure requirements.
C. Maxim’s January 17, 2008 Press Release
Press Release:
SUNNYVALE, CA-January 17, 2008-Maxim Integrated Products, Inc., (Pink Sheets: MXIM)issued the following statement today.
On January 31, 2007, Maxim Integrated Products, Inc. announced that it would need torestate certain historical financial statements to record additional stock-based compensationcharges and that such financial statements should no longer be relied upon. At this time, Maximexpects to restate its financial statements from Fiscal 1997 through Fiscal 2005 and the relatedinterim periods through March 25, 2006, and to record additional non-cash compensation ex-pense during Fiscal 1997 through Fiscal 2006 in the estimated range of $550 to $650 million ona pre-tax basis and $360 to $425 million on an after-tax basis.
Maxim also announced that its estimated completion date of the restatement will be delayedfrom the first calendar quarter of 2008. The Company recently determined that the scope of theproject must expand to include a review of stock options granted in years 1995 and 1996, and toconduct further analysis of certain aspects of stock option activity such as employees who eitherterminated their employ or changed their employment status. Based on these new requirementsand the overall complexity of the project, Maxim currently estimates that the restatement will becompleted in June 2008, but it cannot give assurances that it will meet this targeted completiondate.
18In 2012, OTC Markets Group joined FINRA and on June 1, 2012 it began operating as an SEC-registeredbroker-dealer and Alternative Trading System.
18

D. DataI checked the integrity of Bloomberg stock price and volume information by comparing these
with CRSP data. Bloomberg rounds prices to the penny, while CRSP reports transaction pricesto the hundredth of a penny. For my sample between 1 and 2% of the transaction prices onCRSP are reported as sub-pennies. Aside from rounding differences, Bloomberg does not includedata from the Midwest (Chicago) Exchange. This can occasionally result in a difference in thedaily high or low price. Consider for example benchmark company Linear Technologies. CRSPand TAQ report the high price for LLTC on December 29, 2006, as $34.42, whereas Bloombergreports this as $30.72. The former is the price stamp on a 100-share trade that crossed on theMidwest Exchange at 15:57:56 ET. The $30.72 value is also the highest price on TAQ excludingthis single reported transaction from the Midwest Exchange (that appears to be in error).
There is generally a difference in the volume data between CRSP and Bloomberg due tothe fact that CRSP and TAQ include a regional exchange that Bloomberg does not. Over the774 trading days from September 21, 2006 through October 16, 2009, the mean log difference inLinear Technologies’ volume between CRSP and Bloomberg is -0.8%, with a standard deviationof 1.4%. Bloomberg’s reported volume on Linear Technologies exceeds that on CRSP on 257 ofthe 774 days. All price and volume data on the six competitors and MXIM pre- and post-PinkSheets come from CRSP and TAQ. I verify dividend payments while MXIM trades on the PinkSheets from the company’s website.
In the period January 1, 2006 through December 31, 2009 for the seven companies in thisindustry, the Bloomberg news feed includes stories in English from the following sources: TheUS Federal News Service (acquired in August 2010 by The Dolan Company), PR Newswire,CNW Group, Bloomberg News, Bloomberg Legal News, Business Wire, Bloomberg Transcripts,Worldwide Computer Products News, Gerson Lehrman Group, Marketwire, Briefing.Com, Mar-ket News Publishing, Washington Service, Comtex News Service, GlobeNewswire, AssociatedPress, and M2 Presswire; general webcontent from sources such as: The Dallas Morning News,Circuits Assembly, Manila Bulletin, Investors Business Daily, and National Reference Sources inthe UK; media syndication and news aggregators such as: Voxant and TheFly; as well as rat-ings and analyst firms such as: JP Morgan, Interactive Brokers, First Global, InsiderScore.Com,Vermilion Capital Management, Trading Central, Recognia, and Fitch.
19

References
Andrews, Donald W.K., 1991, Heteroskedasticity and autocorrelation consistent covariance matrixestimation, Econometrica 59, 817–858.
Ang, Andrew, Assaf A. Shtauber, and Paul C. Tetlock, 2013, Asset pricing in the dark: The crosssection of OTC stocks, Review of Financial Studies 26, 2985–3028.
Bernile, Gennaro and Gregg A. Jarrell, 2009, The impact of the options backdating scandal onshareholders, Journal of Accounting and Economics 47, 2–26.
Bertrand, Marianne, Esther Duflo, and Sendhil Mullainathan, 2004, How much should we trustdifferences-in-differences estimates? Quarterly Journal of Economics 119, 249–275.
Bickley, James M. and Gary Shorter, 2008, Stock options: The backdating issue, CongressionalResearch Service Report for Congress, Federal Publications, Paper 504,http : //digitalcommons.ilr.cornell.edu/key workplace/504/ .
Boehmer, Ekkehart and Eric K. Kelley, 2009, Institutional investors and the informational efficiencyof prices, Review of Financial Studies 22, 3563–3594.
Boehmer, Ekkehart and J. (Julie) Wu, 2010, Short selling and the price discovery process, WorkingPaper, The University of Georgia.
Boguth, Oliver, Murray Carlson, Adlai Fisher, and Mikhail Simutin, 2015, Horizon effects in averagereturns: The role of slow information diffusion, Review of Financial Studies forthcoming.
Bollen, Nicolas P.B. and William G. Christie, 2009, Market microstructure of the Pink Sheets, Journalof Banking and Finance 33, 1326–1339.
Chen, Joseph, Harrison Hong, and Jeremy C. Stein, 2002, Breadth of ownership and stock returns,Journal of Financial Economics 66, 171–205.
Chordia, Tarun, Asani Sarkar, and Avanidhar Subrahmanyam, 2011, Liquidity dynamics and cross-autocorrelations, Journal of Financial and Quantitative Analysis 46, 709–736.
Cohen, Lauren and Dong Lou, 2012, Complicated firms, Journal of Financial Economics 104, 383–400.
Corwin, Shane A. and Jay F. Coughenour, 2008, Limited attention and the allocation of effort insecurities trading, Journal of Finance 63, 3031–3051.
Corwin, Shane A. and Paul Schultz, 2012, A simple way to estimate bid-ask spreads from daily highand low prices, Journal of Finance 67, 719–759.
D’Avolio, Gene, 2002, The market for borrowing stock, Journal of Financial Economics 66, 271–306.
20

DellaVigna, Stefano and Joshua M. Pollet, 2009, Investor inattention and Friday earnings announce-ments, Journal of Finance 64, 709–749.
Dougal, Casey, Joseph Engelberg, Diego Garcia, and Christopher Parsons, 2012, Journalists and thestock market, Review of Financial Studies 25, 639–679.
Duffie, Darrell, 2010, Presidential address: Asset price dynamics with slow-moving capital, Journalof Finance 65, 1238–1268.
Engelberg, Joseph and Christopher Parsons, 2011, The causal impact of media in financial markets,Journal of Finance 66, 67–97.
Fang, Lily H. and Joel Peress, 2009, Media coverage and the cross-section of returns, Journal ofFinance 64, 2023–2052.
Grossman, Sanford J. and Merton H. Miller, 1988, Liquidity and market structure, Journal of Finance43, 617–633.
Harris, Jeffrey H., Venkatesh Panchapagesan, and Ingrid Werner, 2008, Off but not gone: A study ofNasdaq delistings, The Ohio State University, Dice Center Working Paper WP 2008-06.
Hendershott, Terrence, Sunny X. Li, Albert J. Menkveld, and Mark S. Seasholes, 2013, Asset pricedynamics with limited attention, Working Paper, University of California, Berkeley.
Hendershott, Terrence and Albert J. Menkveld, 2014, Price pressures, Journal of Financial Economics114, 405–423.
Hirshleifer, David, Sonya Seongyeon Lim, and Siew Hong Teoh, 2009, Driven to distraction: Extra-neous events and underreaction to earnings news, Journal of Finance 64, 2289–2325.
Hirshleifer, David and Siew Hong Teoh, 2003, Limited attention, information disclosure, and financialreporting, Journal of Accounting and Economics 36, 337–386.
Hong, Harrison, Terence Lim, and Jeremy C. Stein, 2000, Bad news travels slowly: Size, analystcoverage, and the profitability of momentum strategies, Journal of Finance 55, 265–295.
Hong, Harrison and Jeremy C. Stein, 2007, Disagreement and the stock market, Journal of EconomicPerspectives 21, 109–128.
Hou, Kewei, 2007, Industry information diffusion and the lead-lag effect in stock returns, Review ofFinancial Studies 20, 1113–1138.
Hou, Kewei and Tobias J. Moskowitz, 2005, Market frictions, price delay, and the cross-section ofexpected returns, Review of Financial Studies 18, 981–1020.
Huberman, Gur and Tomer Regev, 2001, Contagious speculation and a cure for cancer: A non-eventthat made stock prices soar, Journal of Finance 56, 387–396.
21

Klibanoff, Peter, Owen Lamont, and Thierry A. Wizman, 1998, Investor reaction to salient news inclosed-end country funds, Journal of Finance 53, 673-699.
Kumar, Raman, Atulya Sarin, and Kuldeep Shastri, 1998, The impact of options trading on themarket quality of the underlying security: An empirical analysis, Journal of Finance 53, 717–732.
LaCroix, Kevin M., 2014, The Directors and Officers Diary, website, http://www.dandodiary.com.
Macy, Jonathan, Maureen O’Hara, and David Pompilio, 2008, Down and out in the stock market:The law and economics of the delisting process, Journal of Law and Economics 51, 683–714.
Menzly, Lior and Oguzhan Ozbas, 2010, Market segmentation and the cross-predictability of returns,Journal of Finance 65, 1555–1580.
Nagel, Stefan, 2005, Short sales, institutional investors and the cross-section of stock returns. Journalof Financial Economics 78, 277–309.
Peng, Lin and Wei Xiong, 2006, Investor attention, overconfidence and category learning, Journal ofFinancial Economics 80, 563–602.
Peress, Joel, 2014, The media and the diffusion of information in financial markets: Evidence fromnewspaper strikes, Journal of Finance 69, 2007–2043.
Rashes, Michael C., 2001, Massively confused investors making conspicuously ignorant choices, Jour-nal of Finance 56, 1911–1927.
Roll, Richard, Eduardo Schwartz, and Avanidhar Subrahmanyam, 2009, Options trading activity andfirm valuation, Journal of Financial Economics 94, 345–360.
Tetlock, Paul C., 2007, Giving content to investor sentiment: The role of media in the stock market,Journal of Finance 62, 1139–1168.
22
0
0.2
0.4
0.6
0.81
1.2
1.4
$ Value of $1 on 1/3/07
Dat
e
MX
IMSO
XSu
b-I
nd
ust
ry
Fig
ure
1.C
um
ula
tive
Ret
urn
son
MX
IM,
SO
X,
and
the
6-st
ock
ind
ex.
The
mai
npl
otsh
ows
the
valu
eof
$1in
vest
edon
Janu
ary
3,20
07th
roug
hJu
ne30
,20
09on
Max
imIn
tegr
ated
Pro
duct
s(M
XIM
),th
eP
hila
delp
hia
Stoc
kE
xcha
nge
Sem
icon
duct
orIn
dex
(SO
X),
and
aneq
ually
-wei
ghte
din
dex
ofsi
xst
ocks
inth
em
ixed
sign
alpr
oces
sing
sem
icon
duct
orin
dust
ry.
The
inse
tsh
ows
the
sam
efo
r$1
inve
sted
onSe
ptem
ber
24,
2007
thro
ugh
Oct
ober
4,20
07.
23

MX
IM S
IRA
VG
SIR
MX
IM S
IA
VG
SI
6 4 0
7,5
00
,000
22
,50
0,0
00
15
,00
0,0
00
MX
IM S
IR
Fig
ure
2.S
hor
tIn
tere
stan
dSh
ort
Inte
rest
Rat
iofo
rM
XIM
and
equ
ally
-wei
ghte
dIn
du
stry
Por
tfol
io.
Shor
tin
tere
st(S
I)is
repo
rted
innu
mbe
rof
shar
eson
the
righ
t-ha
ndax
is.
The
shor
tin
tere
stra
tio
(SIR
)is
defin
edas
the
rati
oof
shor
tin
tere
ston
the
repo
rtin
gda
teto
the
aver
age
daily
trad
ing
volu
me
inth
epr
e-re
port
ing
date
peri
od.
Thi
sra
tio
ism
easu
red
onth
ele
ft-h
and
axis
.T
hepe
riod
inw
hich
MX
IMtr
ades
onth
eP
ink
Shee
tsis
shad
ed.
The
data
cove
rth
epe
riod
Janu
ary
12,
2007
thro
ugh
Dec
embe
r31
,20
09.
Pri
orto
2007
shor
tin
tere
stis
repo
rted
mon
thly
–at
mid
-mon
th.
Star
ting
inSe
ptem
ber
2007
,sh
ort
inte
rest
isre
port
edtw
ice
per
mon
th–a
tm
id-m
onth
and
mon
th-e
nd.
24

Tab
le1
Tra
ding
Act
ivit
yan
dO
wne
rshi
pP
rofil
efo
rM
XIM
and
Ben
chm
ark
Fir
ms:
Pre
-an
dP
ost-
Pin
kSh
eets
Sept
embe
r20
07(P
re-P
ink
Shee
ts)
Com
pany
Nam
eT
icke
rE
xcha
nge
Shar
esP
rice
Mar
ket
Ave
rage
Shor
t%
Ow
ned
Num
ber
ofSy
mbo
lO
utst
andi
ngC
apit
aliz
atio
nD
aily
Inte
rest
by13
(f)
13(f
)(0
00’s
)($
Mill
ions
)V
olum
e(0
00’s
shar
es)
Inst
itut
ions
Inst
itut
ions
(000
’ssh
ares
)M
axim
Inte
grat
edP
rodu
cts
MX
IMN
asda
q32
0,53
3$2
9.12
9,33
44,
982
8,88
488
.535
9A
nalo
gD
evic
esA
DI
NY
SE31
1,18
6$3
5.17
10,9
443,
363
5,67
382
.039
3L
inea
rT
echn
olog
yL
LTC
Nas
daq
226,
838
$34.
537,
833
4,83
212
,962
106.
638
4Fa
irch
ildSe
mic
ondu
ctor
FC
SN
YSE
124,
242
$18.
012,
238
901
3,49
310
2.2
181
Nat
iona
lSe
mic
ondu
ctor
NSM
NY
SE27
0,11
3$2
5.43
6,86
95,
715
38,9
0291
.231
9O
NSe
mic
ondu
ctor
ON
NN
Nas
daq
290,
045
$11.
493,
333
5,18
035
,147
112.
328
2T
exas
Inst
rum
ents
TX
NN
YSE
1,42
9,08
5$3
4.68
49,5
6114
,418
26,5
9575
.591
8
Dec
embe
r31
,20
08(P
ost-
Pin
kSh
eets
)T
icke
rE
xcha
nge
Shar
esP
rice
Mar
ket
Ave
rage
Shor
t%
Ow
ned
Num
ber
ofSy
mbo
lO
utst
andi
ngC
apit
aliz
atio
nD
aily
Inte
rest
by13
(f)
13(f
)(0
00’s
)($
Mill
ions
)V
olum
e(0
00’s
shar
es)
Inst
itut
ions
Inst
itut
ions
(000
’ssh
ares
)M
XIM
Nas
daq
304,
123
$11.
423,
473
2,88
65,
842
86.6
230
AD
IN
YSE
291,
193
$19.
025,
538
3,66
87,
404
83.0
384
LLT
CN
asda
q22
1,76
2$2
2.12
4,90
53,
021
21,8
0810
1.9
354
FC
SN
YSE
124,
132
$4.8
960
71,
259
1,80
387
.115
4N
SMN
YSE
229,
369
$10.
072,
310
4,50
215
,597
88.3
277
ON
NN
Nas
daq
411,
675
$3.4
01,
400
3,37
819
,273
93.8
219
TX
NN
YSE
1,29
6,42
5$1
5.52
20,1
2011
,666
32,4
3977
.374
2
Not
es:
Snap
shot
sof
Max
imIn
tegr
ated
Pro
duct
s,w
hich
trad
eson
Nas
daq
prio
rto
Oct
ober
2,20
07,a
ndaf
ter
Oct
ober
8,20
08;a
ndsi
xbe
nchm
ark
com
pani
esth
atco
mpr
ised
the
anal
og/m
ixed
sem
icon
duct
orin
dust
ryin
this
peri
od.
Thi
sta
ble
repo
rts
pric
e,ou
tsta
ndin
gsh
ares
,an
dsh
ort
inte
rest
onSe
ptem
ber
14,
2007
,an
dav
erag
eda
ilyvo
lum
ein
the
two
wee
ksen
ding
Sept
embe
r14
,20
07;
and
info
rmat
ion
from
the
13(f
)fil
ings
for
Sept
embe
r28
,20
07fo
rSe
ptem
ber
2007
;an
dpr
ice,
outs
tand
ing
shar
es,
and
shor
tin
tere
ston
Dec
embe
r31
,20
08an
dav
erag
eda
ilyvo
lum
ein
the
two
wee
ksen
ding
Dec
embe
r31
,20
08,
for
Dec
embe
r31
,20
08.

Table 2Maxim Integrated Products and Benchmark Stocks:
Analyst Following around Maxim’s Delisting
Panel A. Number of Analysts Participating at Conference CallsPre-Delisting Pink Sheets Post-Delisting
MXIM 8/2/2007 11/1/2007 1/31/2008 5/1/2008 8/7/2008 10/29/200817 18 10 11 12 15
ADI 8/21/2007 11/27/07 2/20/2008 5/20/2008 8/19/2008 11/25/200814 11 14 10 8 13
FCS 7/19/2007 10/18/2007 1/24/2008 4/17/2008 7/17/2008 10/16/20089 7 8 8 10 10
LLTC 7/25/2007 10/15/2008 1/16/2008 4/16/2008 7/23/2008 10/15/200817 19 17 15 16 19
NSM 9/25/2007 12/6/2007 3/6/2008 6/5/2008 9/5/2008 12/8/200810 10 7 11 8 7
ONNN 7/31/2007 10/30/2007 1/31/2008 5/16/2008 8/6/2008 10/30/200812 11 9 8 12 12
TXN 7/23/2007 10/22/2007 1/22/2008 4/21/2008 7/21/2008 10/20/200816 22 18 17 21 17
Panel B. Firms attending MXIM’s Conference Calls:AmTech Research X X X X XBofA Securities X X X X XBarclays Capital XBear Stearns X XCitigroup X X X X X XCharter Eqty Rsch X XConsumer Equity X XCowen & Company XCredit Suisse X X X X XDeutscheBank X X X X X XFBR Capital XGlobal Crown Capital X X X X XGoldman Sachs X X X X X XGreenleaf Capital X XJ.P. Morgan X X X XJMP Securities XLehman Bros X X X XMorgan Stanley XPacific Crest Securities X X X XRaymond James X X X XRBC Capital Mkts X XTIAA-CREF XThomas Weisel Partners X X XUBS X X X X XWachovia Securities X XWilliam Blair X X X

Table 2 (Continued)Maxim Integrated Products and Benchmark Stocks:
Analyst Following around Maxim’s Delisting
Notes:
The information in this table is collected from seekingalpha.com.
Panel A reports the dates of the scheduled quarterly conference calls between management andinvestors over the period July 2007 through November 2008. Maxim Integrated Products (MXIM)trades on Nasdaq on the first and last dates, and on the Pink Sheets during the middle four dates.
The date is the date of the conference call. Below the date the number of analysts participatingat the conference (and identified by name and firm on SeekingAlpha) is reported.
The benchmark firms are: ADI, Analog Devices (NYSE); LLTC, Linear Technologies, (Nasdaq);FCS, Fairchild Semiconductor, (NYSE); NSM, National Semiconductor (NYSE); ONNN, ONSemiconductor (Nasdaq); and TXN, Texas Instruments, (NYSE).
Panel B indicates the presence of an investment firm’s analyst at each of MXIM’s quarterlyconference calls at the top dates in Panel A. If an analyst from the firm attended a particularconference call, an X is placed in that column.
This data is used in lieu of traditional sources of analyst following as MXIM is not included in theIBES database (or regularly in other sources, such as Bloomberg), since it does not file reportswith the Securities and Exchange Commission while it trades on the Pink Sheets.

Tab
le3
Max
imIn
tegr
ated
Pro
duct
sN
umbe
rof
Shar
esO
wne
dby
Spec
ific
Inst
itut
iona
lO
wne
rs(f
rom
Mut
ual
Fund
and
13(f
)fil
ings
)
2007
2007
2007
2007
2008
2008
2008
2008
III
III
IVI
IIII
IIV
Mu
tual
Fu
nd
s:G
row
thFu
ndof
Am
eric
a20
,840
,000
15,1
40,0
0015
,140
,000
17,0
25,0
0017
,025
,000
17,0
25,0
0017
,025
,000
17,0
25,0
00F
idel
ity
Low
Pri
ced
9,40
0,00
07,
700,
000
7,00
0,00
010
,000
,000
10,0
00,0
0013
,000
,000
11,0
00,0
009,
000,
500
Fid
elit
yM
agel
lan
3,24
5,40
43,
245,
404
00
00
00
Dod
ge&
Cox
Stoc
kFu
nd0
00
12,1
67,1
0019
,200
,000
19,2
00,0
0019
,434
,400
24,3
60,2
00N
ewE
cono
my
Fund
3,20
0,00
01,
200,
000
1,20
0,00
060
0,00
060
0,00
060
0,00
060
0,00
060
0,00
0T
.R
owe
Pri
ceG
row
th5,
107,
200
5,10
7,20
05,
107,
200
2,60
1,70
00
00
0T
.R
owe
Pri
ceSc
iT
ech.
2,30
0,00
080
0,00
01,
000,
000
3,00
0,00
03,
500,
000
3,30
0,00
03,
300,
000
3,00
0,00
0O
ppen
heim
erG
loba
lFu
nd4,
350,
655
4,35
0,65
54,
964,
155
4,96
4,15
54,
964,
155
4,96
4,15
54,
964,
155
4,96
4,15
5A
mca
pFu
nd3,
375,
000
3,04
5,00
03,
045,
000
3,04
5,00
04,
645,
000
4,64
5,00
04,
645,
000
4,64
5,00
0Se
ligm
anC
omm
&In
fo.
076
9,60
02,
805,
100
4,00
3,00
00
838,
100
311,
900
0F
irst
Eag
leG
loba
l1,
278,
660
2,14
1,25
02,
141,
250
2,58
0,72
05,
470,
010
4,95
7,77
04,
753,
140
0In
vest
men
tC
oof
Am
eric
a14
,995
,000
13,1
95,0
0013
,195
,000
14,7
95,0
0014
,795
,000
14,7
95,0
0014
,795
,000
13,1
95,0
00In
com
eFu
ndof
Am
eric
a0
00
00
015
,190
,000
12,0
45,0
0013
(f)
Fu
nd
s:T
imes
Sqr
(Ins
t.M
.M.)
00
01,
222,
100
1,57
6,50
01,
607,
800
1,85
2,45
00
Ken
sico
(Hed
geFu
nd)
00
370,
000
3,39
0,00
07,
264,
286
7,20
7,58
67,
041,
780
2,33
1,55
7
Not
es:
Max
imIn
tegr
ated
Pro
duct
sw
asde
liste
dfr
omN
asda
qon
Oct
ober
2,20
07,
and
re-l
iste
don
Nas
daq
onO
ctob
er8,
2008
.
Mut
ual
Fund
hold
ings
are
obta
ined
from
quar
terl
yFo
rmN
-Qfil
ings
.H
oldi
ngs
ofT
imes
Squa
reC
apit
alM
anag
emen
t,L
LC
,an
inst
itut
iona
lm
oney
man
ager
,an
dK
ensi
coC
apit
alM
anag
emen
t,a
hedg
efu
nd,
are
from
quar
ter-
end
13(f
)fil
ings
.U
pon
delis
ting
MX
IMw
asre
mov
edfr
omth
e13
(f)
list,
som
ost
man
ager
sdo
not
repo
rtM
XIM
hold
ings
on13
(f)
filin
gs,
whi
leit
trad
eson
the
Pin
kSh
eets
.T
he13
(f)
list
isno
tre
leva
ntfo
rm
utua
lfu
ndre
port
s.N
-Qre
port
sar
efil
edon
aqu
arte
rly
basi
s.I
use
the
last
filin
gin
each
cale
ndar
quar
ter
inth
ista
ble.

Tab
le4
Mut
ual
Fund
Ow
ners
hip
Pro
file
for
MX
IMan
dB
ench
mar
kF
irm
s
Pan
elA
.P
erce
ntag
eof
Out
stan
ding
Shar
esO
wne
dby
Mut
ual
Fund
sP
re-P
ink
Shee
tsP
ink
Shee
ts-1
Pin
kSh
eets
-2P
ost-
Pin
kSh
eets
Tic
ker
2007
I20
07II
2007
III
2007
IV20
08I
2008
II20
08II
I20
08IV
MX
IM38
.236
.936
.940
.244
.239
.946
.550
.8
AD
I29
.231
.832
.127
.727
.926
.430
.828
.3L
LTC
33.4
44.9
39.9
37.9
41.9
41.7
41.9
41.0
FC
S40
.348
.350
.746
.745
.930
.742
.539
.4N
SM25
.727
.428
.429
.829
.125
.328
.126
.0O
NN
N36
.053
.746
.961
.039
.942
.747
.043
.2T
XN
19.7
27.1
25.7
23.3
27.8
27.1
30.5
25.8
Ben
chm
ark
aver
age
30.7
38.8
37.3
37.8
35.4
32.3
36.8
33.9
–Sta
ndar
der
ror
3.0
4.7
4.2
5.8
3.3
3.2
3.2
3.3
Pan
elB
.N
umbe
rof
Mut
ual
Fund
sth
atO
wn
MX
IM48
664
143
535
921
323
719
624
5
AD
I47
663
247
665
452
365
160
260
0L
LTC
548
628
472
573
476
597
561
561
FC
S21
122
922
426
122
127
723
722
8N
SM43
959
449
554
946
454
550
550
2O
NN
N23
440
936
945
434
340
237
435
0T
XN
983
1409
1082
1345
1004
1283
1009
1028
Ben
chm
ark
aver
age
481.
865
0.2
519.
763
9.3
505.
262
5.8
548.
054
4.8
–Sta
ndar
der
ror
114.
316
4.9
119.
915
1.5
109.
414
2.8
107.
211
2.1
Not
es:
Mut
ual
Fund
hold
ings
ofM
axim
Inte
grat
edP
rodu
cts,
whi
chtr
ades
onN
asda
qpr
ior
toO
ctob
er2,
2007
,an
daf
ter
Oct
ober
8,20
08;
and
six
benc
h-m
ark
com
pani
es:
AD
I,A
nalo
gD
evic
es(N
YSE
);L
LTC
,L
inea
rT
echn
olog
ies,
(Nas
daq)
;F
CS,
Fair
child
Sem
icon
duct
or,
(NY
SE);
NSM
,N
atio
nal
Sem
icon
duct
or(N
YSE
);O
NN
N,
ON
Sem
icon
duct
or(N
asda
q);
and
TX
N,
Tex
asIn
stru
men
ts,
(NY
SE).
The
data
isob
tain
edby
aggr
egat
ing
acro
ssFo
rms
N-Q
whi
chal
lm
utua
lfu
nds
mus
tfil
eon
aqu
arte
rly
basi
s.I
aggr
egat
eal
lfil
ings
(aft
erre
mov
ing
redu
ndan
cies
),w
ithi
nea
chca
lend
arqu
arte
r.

Table 5Total, Pre-Session and Post-Session Trading Volume
Maxim and its Industry Benchmark: Pre-Pink Sheets, Pink Sheets I, Pink Sheets Transition,Pink Sheets II, and Post-Pink Sheets Periods
Panel APre-Pink Sheets (January 4, 2006 - August 31, 2007, 419 Trading Days)
25%ile Median 75%ileTotal Volume Industry Average 5,019,784 5,927,755 7,112,727Total Volume MXIM 3,764,804 4,747,507 6,164,408Daily Ratio: MXIM/Industry Average 0.64 0.79 1.01
Pre-Open Industry Avg 1,459 4,717 16,608Pre-Open MXIM 1,100 2,901 11,238Daily Ratio: MXIM/Industry Average 0.14 0.72 3.13
Post-Session Industry Avg 9,569 26,688 96,483Post-Session MXIM 7,420 25,200 82,566Daily Ratio: MXIM/Industry Average 0.30 0.78 2.24
Panel BPink Sheets I (October 2, 2007 - January 16, 2008, 74 Trading Days)
25%ile Median 75%ileTotal Volume Industry Average 5,137,679 6,162,132 7,299,328Total Volume MXIM 2,412,227 3,363,542 4,791,299Daily Ratio: MXIM/Industry Average 0.38 0.54 0.77
Pre-Open Industry Avg 1,000 2,732 11,115Pre-Open MXIM 0 2,100 10,271Daily Ratio: MXIM/Industry Average 0.00 0.40 3.89
Post-Session Industry Avg 10,604 46,772 100,593Post-Session MXIM 60,823 112,748 230,619Daily Ratio: MXIM/Industry Average 1.14 2.94 10.78
Panel CPink Sheets Transition (January 17, 2008 - February 8, 2008, 16 Trading Days)
25%ile Median 75%ileTotal Volume Industry Average 5,955,024 7,931,409 8,558,756Total Volume MXIM 6,281,457 7,875,366 11,654,865Daily Ratio: MXIM/Industry Average 0.85 1.04 1.42
Pre-Open Industry Avg 700 2,841 7,677Pre-Open MXIM 2,1000 9,500 15,200Daily Ratio: MXIM/Industry Average 0.06 3.00 8.41
Post-Session Industry Avg 16,176 26,794 61,010Post-Session MXIM 123,644 208,111 360,917Daily Ratio: MXIM/Industry Average 1.13 6.03 7.96
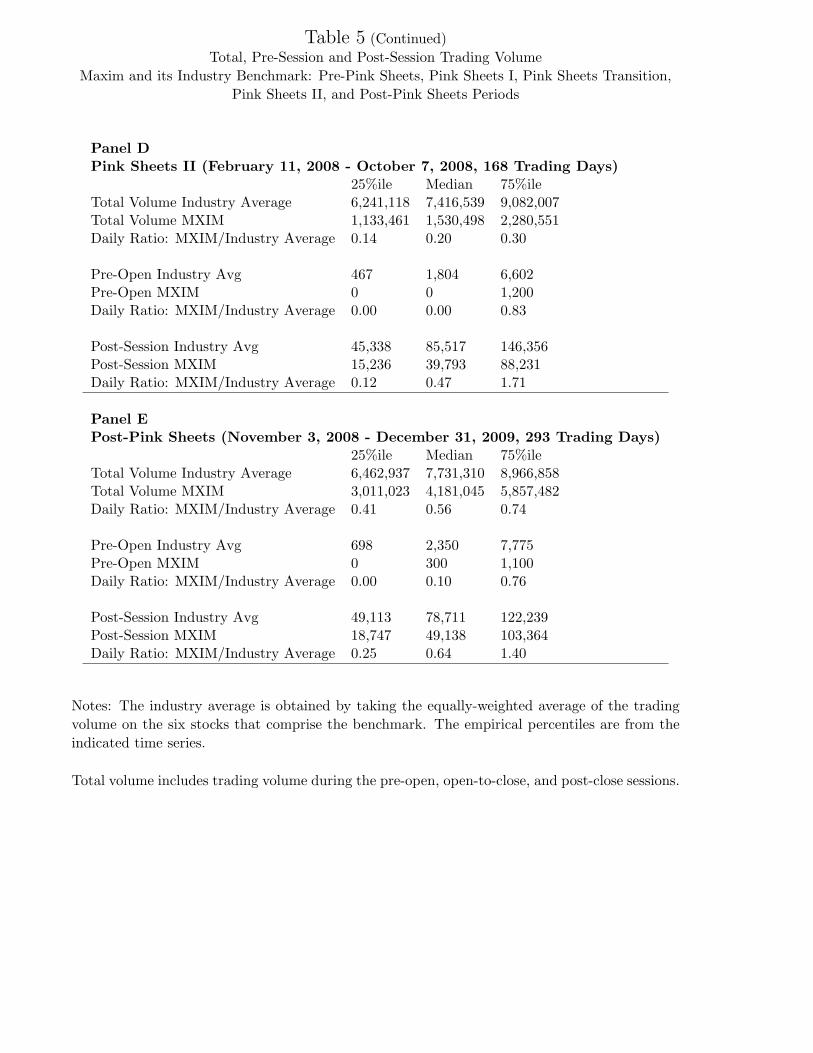
Table 5 (Continued)Total, Pre-Session and Post-Session Trading Volume
Maxim and its Industry Benchmark: Pre-Pink Sheets, Pink Sheets I, Pink Sheets Transition,Pink Sheets II, and Post-Pink Sheets Periods
Panel DPink Sheets II (February 11, 2008 - October 7, 2008, 168 Trading Days)
25%ile Median 75%ileTotal Volume Industry Average 6,241,118 7,416,539 9,082,007Total Volume MXIM 1,133,461 1,530,498 2,280,551Daily Ratio: MXIM/Industry Average 0.14 0.20 0.30
Pre-Open Industry Avg 467 1,804 6,602Pre-Open MXIM 0 0 1,200Daily Ratio: MXIM/Industry Average 0.00 0.00 0.83
Post-Session Industry Avg 45,338 85,517 146,356Post-Session MXIM 15,236 39,793 88,231Daily Ratio: MXIM/Industry Average 0.12 0.47 1.71
Panel EPost-Pink Sheets (November 3, 2008 - December 31, 2009, 293 Trading Days)
25%ile Median 75%ileTotal Volume Industry Average 6,462,937 7,731,310 8,966,858Total Volume MXIM 3,011,023 4,181,045 5,857,482Daily Ratio: MXIM/Industry Average 0.41 0.56 0.74
Pre-Open Industry Avg 698 2,350 7,775Pre-Open MXIM 0 300 1,100Daily Ratio: MXIM/Industry Average 0.00 0.10 0.76
Post-Session Industry Avg 49,113 78,711 122,239Post-Session MXIM 18,747 49,138 103,364Daily Ratio: MXIM/Industry Average 0.25 0.64 1.40
Notes: The industry average is obtained by taking the equally-weighted average of the tradingvolume on the six stocks that comprise the benchmark. The empirical percentiles are from theindicated time series.
Total volume includes trading volume during the pre-open, open-to-close, and post-close sessions.
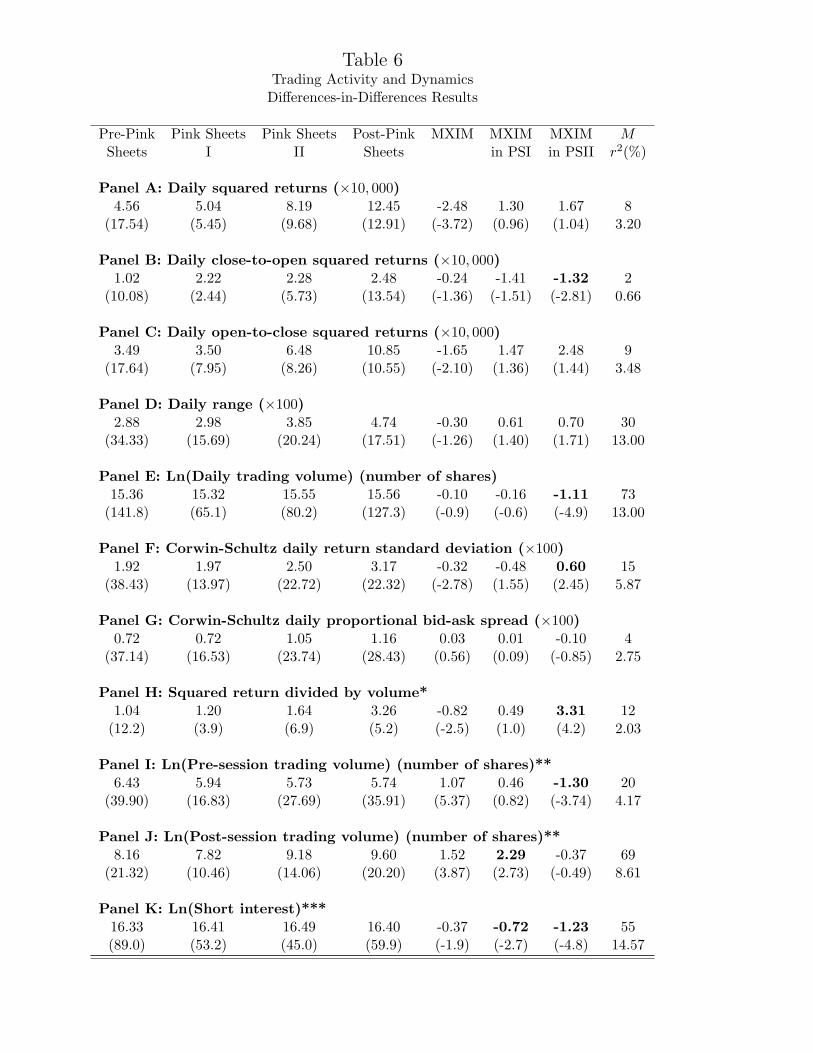
Table 6Trading Activity and Dynamics
Differences-in-Differences Results
Pre-Pink Pink Sheets Pink Sheets Post-Pink MXIM MXIM MXIM MSheets I II Sheets in PSI in PSII r2(%)
Panel A: Daily squared returns (×10, 000)4.56 5.04 8.19 12.45 -2.48 1.30 1.67 8
(17.54) (5.45) (9.68) (12.91) (-3.72) (0.96) (1.04) 3.20
Panel B: Daily close-to-open squared returns (×10, 000)1.02 2.22 2.28 2.48 -0.24 -1.41 -1.32 2
(10.08) (2.44) (5.73) (13.54) (-1.36) (-1.51) (-2.81) 0.66
Panel C: Daily open-to-close squared returns (×10, 000)3.49 3.50 6.48 10.85 -1.65 1.47 2.48 9
(17.64) (7.95) (8.26) (10.55) (-2.10) (1.36) (1.44) 3.48
Panel D: Daily range (×100)2.88 2.98 3.85 4.74 -0.30 0.61 0.70 30
(34.33) (15.69) (20.24) (17.51) (-1.26) (1.40) (1.71) 13.00
Panel E: Ln(Daily trading volume) (number of shares)15.36 15.32 15.55 15.56 -0.10 -0.16 -1.11 73
(141.8) (65.1) (80.2) (127.3) (-0.9) (-0.6) (-4.9) 13.00
Panel F: Corwin-Schultz daily return standard deviation (×100)1.92 1.97 2.50 3.17 -0.32 -0.48 0.60 15
(38.43) (13.97) (22.72) (22.32) (-2.78) (1.55) (2.45) 5.87
Panel G: Corwin-Schultz daily proportional bid-ask spread (×100)0.72 0.72 1.05 1.16 0.03 0.01 -0.10 4
(37.14) (16.53) (23.74) (28.43) (0.56) (0.09) (-0.85) 2.75
Panel H: Squared return divided by volume*1.04 1.20 1.64 3.26 -0.82 0.49 3.31 12
(12.2) (3.9) (6.9) (5.2) (-2.5) (1.0) (4.2) 2.03
Panel I: Ln(Pre-session trading volume) (number of shares)**6.43 5.94 5.73 5.74 1.07 0.46 -1.30 20
(39.90) (16.83) (27.69) (35.91) (5.37) (0.82) (-3.74) 4.17
Panel J: Ln(Post-session trading volume) (number of shares)**8.16 7.82 9.18 9.60 1.52 2.29 -0.37 69
(21.32) (10.46) (14.06) (20.20) (3.87) (2.73) (-0.49) 8.61
Panel K: Ln(Short interest)***16.33 16.41 16.49 16.40 -0.37 -0.72 -1.23 55(89.0) (53.2) (45.0) (59.9) (-1.9) (-2.7) (-4.8) 14.57
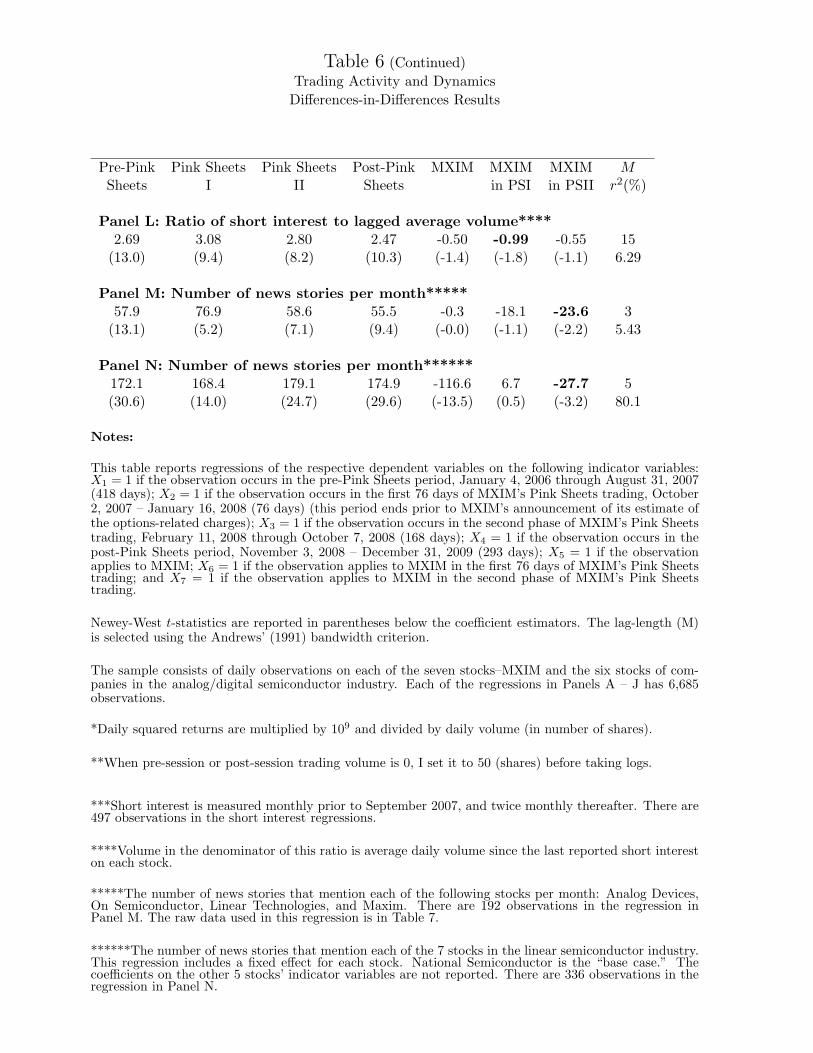
Table 6 (Continued)Trading Activity and Dynamics
Differences-in-Differences Results
Pre-Pink Pink Sheets Pink Sheets Post-Pink MXIM MXIM MXIM MSheets I II Sheets in PSI in PSII r2(%)
Panel L: Ratio of short interest to lagged average volume****2.69 3.08 2.80 2.47 -0.50 -0.99 -0.55 15
(13.0) (9.4) (8.2) (10.3) (-1.4) (-1.8) (-1.1) 6.29
Panel M: Number of news stories per month*****57.9 76.9 58.6 55.5 -0.3 -18.1 -23.6 3
(13.1) (5.2) (7.1) (9.4) (-0.0) (-1.1) (-2.2) 5.43
Panel N: Number of news stories per month******172.1 168.4 179.1 174.9 -116.6 6.7 -27.7 5(30.6) (14.0) (24.7) (29.6) (-13.5) (0.5) (-3.2) 80.1
Notes:
This table reports regressions of the respective dependent variables on the following indicator variables:X1 = 1 if the observation occurs in the pre-Pink Sheets period, January 4, 2006 through August 31, 2007(418 days); X2 = 1 if the observation occurs in the first 76 days of MXIM’s Pink Sheets trading, October2, 2007 – January 16, 2008 (76 days) (this period ends prior to MXIM’s announcement of its estimate ofthe options-related charges); X3 = 1 if the observation occurs in the second phase of MXIM’s Pink Sheetstrading, February 11, 2008 through October 7, 2008 (168 days); X4 = 1 if the observation occurs in thepost-Pink Sheets period, November 3, 2008 – December 31, 2009 (293 days); X5 = 1 if the observationapplies to MXIM; X6 = 1 if the observation applies to MXIM in the first 76 days of MXIM’s Pink Sheetstrading; and X7 = 1 if the observation applies to MXIM in the second phase of MXIM’s Pink Sheetstrading.
Newey-West t-statistics are reported in parentheses below the coefficient estimators. The lag-length (M)is selected using the Andrews’ (1991) bandwidth criterion.
The sample consists of daily observations on each of the seven stocks–MXIM and the six stocks of com-panies in the analog/digital semiconductor industry. Each of the regressions in Panels A – J has 6,685observations.
*Daily squared returns are multiplied by 109 and divided by daily volume (in number of shares).
**When pre-session or post-session trading volume is 0, I set it to 50 (shares) before taking logs.
***Short interest is measured monthly prior to September 2007, and twice monthly thereafter. There are497 observations in the short interest regressions.
****Volume in the denominator of this ratio is average daily volume since the last reported short intereston each stock.
*****The number of news stories that mention each of the following stocks per month: Analog Devices,On Semiconductor, Linear Technologies, and Maxim. There are 192 observations in the regression inPanel M. The raw data used in this regression is in Table 7.
******The number of news stories that mention each of the 7 stocks in the linear semiconductor industry.This regression includes a fixed effect for each stock. National Semiconductor is the “base case.” Thecoefficients on the other 5 stocks’ indicator variables are not reported. There are 336 observations in theregression in Panel N.

Table 7Number of news stories that mention each company
This table reports the total number of news stories that mention each publicly traded company in thelinear signal processor industry on a monthly basis from January 2006 through December 2009. The countis from Bloomberg, using All information sources in the English language.
Month TXN LLTC ADI ONNN FSC NSM MXIMPre-Pink Sheets
Jan 2006 229 34 30 29 29 119 50Feb 2006 196 44 75 39 13 151 41Mar 2006 243 30 51 38 29 175 34Apr 2006 172 24 21 54 19 126 24May 2006 153 50 101 52 27 218 58Jun 2006 186 49 62 61 27 129 73Jul 2006 179 38 39 42 11 111 40Aug 2006 183 54 111 66 18 238 71Sep 2006 234 33 70 51 31 172 62Oct 2006 228 38 58 38 25 167 64Nov 2006 195 33 88 41 20 146 72Dec 2006 189 33 49 67 20 112 62Jan 2007 215 42 42 40 23 143 57Feb 2007 216 36 102 58 38 258 85Mar 2007 284 32 93 49 26 209 52Apr 2007 207 65 56 35 22 153 78May 2007 199 66 169 92 40 164 83Jun 2007 250 38 74 63 41 281 84Jul 2007 145 47 38 49 30 139 79Aug 2007 116 55 152 54 9 173 116Sep 2007 192 33 80 39 5 145 82Mean 200.5 41.6 74.3 50.3 24.0 168.0 65.1Std Dev 38.0 11.4 37.9 14.4 9.7 47.5 21.0
Pink Sheets - IOct 2007 208 67 59 78 50 165 73Nov 2007 123 51 123 72 22 158 44Dec 2007 105 14 194 86 26 109 56Jan 2008 151 44 61 74 29 117 61Mean 146.8 44.0 109.2 77.5 31.8 137.2 58.5Std Dev 45.0 22.2 63.8 6.2 12.5 28.3 12.0

Table 7 (Continued)Number of news stories that mention each company
This table reports the total number of news stories that mention each publicly traded company in thelinear signal processor industry on a monthly basis from January 2006 through December 2009. The countis from Bloomberg, using All information sources in the English language.
Month TXN LLTC ADI ONNN FSC NSM MXIMPink Sheets - II
Feb 2008 181 30 82 55 25 237 37Mar 2008 298 30 117 64 25 254 31Apr 2008 216 37 36 29 32 187 37May 2008 170 43 143 87 55 202 35Jun 2008 230 14 64 33 8 213 18Jul 2008 191 54 76 54 27 177 34Aug 2008 158 66 92 67 13 191 39Sep 2008 217 44 65 25 24 146 47Mean 207.6 39.8 84.4 51.8 26.1 200.9 34.8Std Dev 44.2 16.0 33.3 21.5 14.0 34.1 8.2
Post-Pink SheetsOct 2008 241 77 72 122 45 196 118Nov 2008 146 32 101 85 40 213 35Dec 2008 224 10 66 45 69 201 41Jan 2009 263 78 53 78 37 144 61Feb 2009 176 42 100 58 29 165 37Mar 2009 249 23 64 71 39 238 31Apr 2009 256 69 75 30 76 186 37May 2009 180 45 132 58 21 197 35Jun 2009 242 17 97 29 22 186 18Jul 2009 273 51 86 33 43 209 34Aug 2009 59 9 21 16 4 48 39Sep 2009 225 16 60 56 11 188 43Oct 2009 276 84 71 29 42 190 49Nov 2009 179 27 123 57 14 171 46Dec 2009 164 22 102 62 24 126 48Mean 210.2 40.1 81.5 55.3 34.4 177.2 44.8Std Dev 59.3 26.1 28.5 27.2 20.0 45.0 22.4

Table 8Regression Results
Daily Return regressions: Pre-Pink Sheets, Pink Sheets, and Post-Pink Sheets Periods
Panel A: Evidence of gradual information flow in PS2Intercept Coefficient on: r2(%)
Period (×100) ro−ct−1 rc−o
t−1 ro−ct−2 rc−o
t−2 rc−cI,t r
2(c−o)I,t−2 r
2(o−c)I,t−2 M
Pre-PS -0.08 0.01 -0.01 -0.10 -0.01 0.91 0.05 0.00 0T = 416 (-1.3) (0.1) (-0.2) (-1.1) (-0.3) (19.4) (0.5) (0.0) 59.1
PS1 0.05 -0.02 0.03 -0.01 0.01 0.61 -0.14 0.08 0T = 72 (0.2) (-0.1) (0.2) (0.0) (0.1) (3.6) (-0.7) (0.6) 24.1
PS2 -0.01 0.32 0.05 -0.44 -0.05 0.63 0.16 0.19 1T = 166 (-0.0) (1.3) (0.7) (-2.0) (-0.7) (7.7) (1.0) (2.7) 32.1
Post-PS 0.07 -0.14 -0.17 -0.13 -0.08 0.71 0.03 0.08 1T = 291 (0.7) (-1.7) (-2.4) (-1.3) (-1.4) (16.1) (0.4) (1.6) 58.6
Panel B: No asymmetry based on signIntercept Coefficient on: M
Period (×100) rc−cI,t r
2(c−o)I,t−2 r
2(o−c)I,t−2 D1 · r2(c−o)
I,t−2 D2 · r2(o−c)I,t−2 r2(%)
PS2 -0.39 0.62 0.35 0.32 -0.44 -0.17 1T = 166 (-1.2) (7.0) (1.8) (2.2) (-1.2) (-0.8) 30.5
Panel C: Day-by-dayIntercept Coefficient on: M
Period (×100) rc−cI,t ro−c
I,t−1 rc−oI,t−1 ro−c
I,t−2 rc−oI,t−2 ro−c
I,t−3 rc−oI,t−3 r2(%)
PS2 0.00 0.60 0.20 0.11 0.22 0.17 -0.01 -0.11 1T = 165 (0.0) (6.6) (2.4) (0.5) (2.4) (1.0) (-0.1) (-0.7) 29.5
Notes:
The dependent variable in all regressions is the daily (close-to-close) return on MXIM on day t.
ro−ct−1 is MXIM’s open-to-close return on day t− 1.
rc−ot−1 is MXIM’s close-to-open return on day t− 1.
rc−cI,t is the equally-weighted 6-stock industry (close-to-close) return on day t.
r2(c−o)I,t−2 is the compounded return of the previous two days’ close-to-open on the equally-weighted 6-
stock industry, on days t− 1 and t− 2.

Table 8 (Continued)Regression Results
Daily Return regressions: Pre-Pink Sheets, Pink Sheets, and Post-Pink Sheets Periods
r2(o−c)I,t−2 is the compounded return of the previous two days’ open-to-close on the equally-weighted
6-stock industry, on days t− 1 and t− 2.ro−cI,t−1 is the equally-weighted 6-stock industry open-to-close return on day t-1.
rc−oI,t−1 is the equally-weighted 6-stock industry close-to-open return on day t-1.
D1 =
{1 if r
2(c−o)I,t−2 < 0
0 otherwise
D2 =
{1 if r
2(o−c)I,t−2 < 0
0 otherwise
Pre-PS refers to the period January 4, 2006 through August 31, 2007. Prior to the delisting of MXIMon October 2, 2007.
PS1 refers to the period October 2, 2007 through January 16, 2008. MXIM trades on the Pink Sheetsduring this period that precedes management’s January 17, 2008 announcement that createsuncertainty as to when MXIM will comply with SEC accounting requirements.
PS2 refers to the period February 11, 2008 through October 7, 2008. MXIM trades on the Pink Sheetsduring this period which follows a three-week adjustment period following management’s January17, 2008 announcement. MXIM relists on Nasdaq on October 8, 2008.
Post-PS refers to the period November 3, 2008 through December 31, 2009.

Table 9Daily Options Trading Volume
Maxim Integrated Products and Benchmark Stocks
This table reports the average and median number of options contracts traded on a daily basis–byquarter–for 7 companies in the mixed analog/digital processor industry over the period January3, 2006 through December 30, 2009. MXIM was delisted from Nasdaq on October 2, 2007, andit was no longer possible to write options on MXIM between October 2, 2007 and October 8,2008, during which time MXIM shares trade on the Pink Sheets.
Panel A. Call OptionsRatio of
EW MXIM toCalendar Benchmark BenchmarkQuarter MXIM ADI LLTC NSM TXN FCS ONNN Average (%)2006-I Mean 2,874.2 1,524.9 2,340.5 2,211.9 15,149.9 356.4 181.2 3,627.5 79.2
Median 2,304.5 412.0 726.5 1,023.5 8,959.0 107.5 10.0 3,014.6 76.42006-II Mean 2,120.5 1,417.8 2,247.7 1,812.3 14,945.0 246.9 137.8 3,467.9 61.1
Median 1,398.0 654.0 1,311.0 1,305.0 10,387.0 138.0 73.0 2,311.3 60.52006-III Mean 4,254.2 1,384.6 2,658.2 2,077.5 12,099.2 391.5 69.6 3,113.4 136.6
Median 2,492.0 902.0 2,241.0 1,254.0 8,613.0 182.0 33.0 2,204.2 113.12006-IV Mean 4,844.3 1,344.3 2,299.6 1,637.8 13,665.2 397.3 199.1 3,257.2 148.7
Median 2,096.0 483.0 1,682.0 1,069.0 10,512.0 136.0 48.5 2,321.8 90.32007-I Mean 2,676.7 1,872.2 3,094.2 1,683.1 14,648.8 256.7 670.3 3,704.2 72.3
Median 1,831.0 763.0 2,012.0 1,111.0 12,730.0 134.0 256.0 2,834.3 64.62007-II Mean 5,409.9 4,061.1 2,854.6 2,079.1 15,673.3 463.3 514.6 4,274.4 126.6
Median 3,537.0 2,306.0 1,077.0 1,056.0 12,292.0 171.0 125.0 2,837.8 124.62007-III* Mean 4,324.5 1,484.3 2,069.1 2,152.4 13,609.7 254.9 518.5 3,348.1 129.2
Median 2,851.5 786.5 1,294.0 1,232.5 11,950.0 132.0 152.0 2,591.2 99.62007-IV** Mean 247.9 943.3 2,142.4 2,184.1 12,983.1 161.1 253.8 3,111.3 8.0
Median 67.0 644.0 1,160.0 814.0 8,447.0 90.0 119.0 1,879.0 3.62008-I Mean 13.7 1,283.2 1,628.3 1,653.4 11,719.7 103.0 806.3 2,865.6 0.5
Median 0.0 655.0 1,256.0 755.0 9,284.0 56.0 153.0 2,026.5 0.02008-II Mean 5.6 2,170.0 7,635.9 5,373.4 13,518.0 304.3 996.6 4,999.7 0.1
Median 0.0 1,155.0 1,404.0 2,026.0 9,421.5 113.5 297.0 2,404.5 0.02008-III Mean 4.2 1,017.8 2,388.7 2,334.6 11,930.1 131.7 2,125.6 3,321.4 0.1
Median 0.0 667.5 680.5 1,387.0 8,892.0 48.5 610.0 2,047.6 0.02008-IV Mean 188.0 1,379.0 2,189.2 2,153.4 9,227.2 48.2 266.6 2,543.9 7.4
Median 13.0 878.0 1,402.5 943.5 6,809.5 19.5 73.5 1,687.8 0.82009-I Mean 1,466.3 1,527.3 3,120.3 2,075.0 7,649.5 14.2 251.5 2,439.6 60.1
Median 282.0 960.0 2,229.0 1,139.0 5,369.0 2.0 62.0 1,671.8 16.92009-II Mean 1,829.8 3,836.6 2,154.5 3,118.3 11,379.4 274.5 2,131.2 3,815.8 48.0
Median 734.0 1,073.0 958.0 1,120.0 9,917.0 63.0 783.0 2,319.0 31.72009-III Mean 3,643.8 1,132.6 2,506.5 3,984.9 8,339.4 433.9 2,211.5 3,101.5 117.5
Median 511.0 482.0 896.0 2,502.0 6,074.5 174.0 1,236.5 1,894.2 27.02009-IV Mean 2,055.5 1,546.7 2,062.8 2,348.2 11,281.2 528.6 1,099.2 3,144.5 65.4
Median 525.5 779.0 777.0 1,699.0 9,105.5 201.0 988.0 2,258.3 23.3
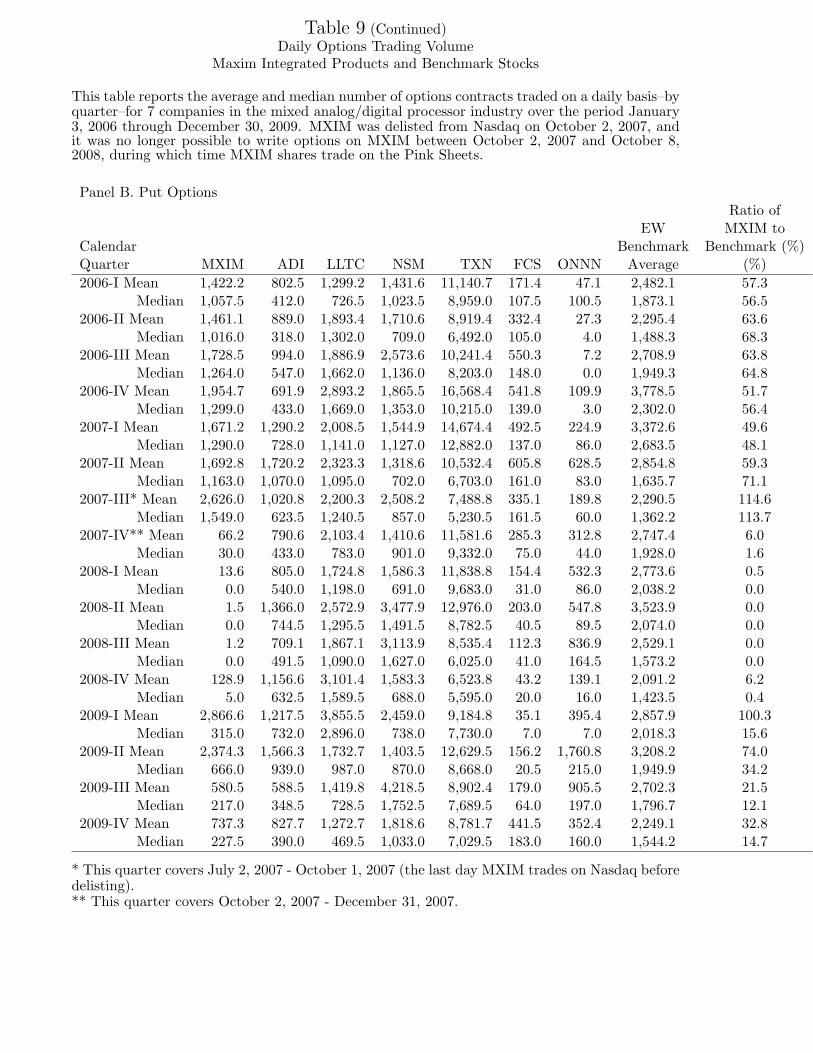
Table 9 (Continued)Daily Options Trading Volume
Maxim Integrated Products and Benchmark Stocks
This table reports the average and median number of options contracts traded on a daily basis–byquarter–for 7 companies in the mixed analog/digital processor industry over the period January3, 2006 through December 30, 2009. MXIM was delisted from Nasdaq on October 2, 2007, andit was no longer possible to write options on MXIM between October 2, 2007 and October 8,2008, during which time MXIM shares trade on the Pink Sheets.
Panel B. Put OptionsRatio of
EW MXIM toCalendar Benchmark Benchmark (%)Quarter MXIM ADI LLTC NSM TXN FCS ONNN Average (%)2006-I Mean 1,422.2 802.5 1,299.2 1,431.6 11,140.7 171.4 47.1 2,482.1 57.3
Median 1,057.5 412.0 726.5 1,023.5 8,959.0 107.5 100.5 1,873.1 56.52006-II Mean 1,461.1 889.0 1,893.4 1,710.6 8,919.4 332.4 27.3 2,295.4 63.6
Median 1,016.0 318.0 1,302.0 709.0 6,492.0 105.0 4.0 1,488.3 68.32006-III Mean 1,728.5 994.0 1,886.9 2,573.6 10,241.4 550.3 7.2 2,708.9 63.8
Median 1,264.0 547.0 1,662.0 1,136.0 8,203.0 148.0 0.0 1,949.3 64.82006-IV Mean 1,954.7 691.9 2,893.2 1,865.5 16,568.4 541.8 109.9 3,778.5 51.7
Median 1,299.0 433.0 1,669.0 1,353.0 10,215.0 139.0 3.0 2,302.0 56.42007-I Mean 1,671.2 1,290.2 2,008.5 1,544.9 14,674.4 492.5 224.9 3,372.6 49.6
Median 1,290.0 728.0 1,141.0 1,127.0 12,882.0 137.0 86.0 2,683.5 48.12007-II Mean 1,692.8 1,720.2 2,323.3 1,318.6 10,532.4 605.8 628.5 2,854.8 59.3
Median 1,163.0 1,070.0 1,095.0 702.0 6,703.0 161.0 83.0 1,635.7 71.12007-III* Mean 2,626.0 1,020.8 2,200.3 2,508.2 7,488.8 335.1 189.8 2,290.5 114.6
Median 1,549.0 623.5 1,240.5 857.0 5,230.5 161.5 60.0 1,362.2 113.72007-IV** Mean 66.2 790.6 2,103.4 1,410.6 11,581.6 285.3 312.8 2,747.4 6.0
Median 30.0 433.0 783.0 901.0 9,332.0 75.0 44.0 1,928.0 1.62008-I Mean 13.6 805.0 1,724.8 1,586.3 11,838.8 154.4 532.3 2,773.6 0.5
Median 0.0 540.0 1,198.0 691.0 9,683.0 31.0 86.0 2,038.2 0.02008-II Mean 1.5 1,366.0 2,572.9 3,477.9 12,976.0 203.0 547.8 3,523.9 0.0
Median 0.0 744.5 1,295.5 1,491.5 8,782.5 40.5 89.5 2,074.0 0.02008-III Mean 1.2 709.1 1,867.1 3,113.9 8,535.4 112.3 836.9 2,529.1 0.0
Median 0.0 491.5 1,090.0 1,627.0 6,025.0 41.0 164.5 1,573.2 0.02008-IV Mean 128.9 1,156.6 3,101.4 1,583.3 6,523.8 43.2 139.1 2,091.2 6.2
Median 5.0 632.5 1,589.5 688.0 5,595.0 20.0 16.0 1,423.5 0.42009-I Mean 2,866.6 1,217.5 3,855.5 2,459.0 9,184.8 35.1 395.4 2,857.9 100.3
Median 315.0 732.0 2,896.0 738.0 7,730.0 7.0 7.0 2,018.3 15.62009-II Mean 2,374.3 1,566.3 1,732.7 1,403.5 12,629.5 156.2 1,760.8 3,208.2 74.0
Median 666.0 939.0 987.0 870.0 8,668.0 20.5 215.0 1,949.9 34.22009-III Mean 580.5 588.5 1,419.8 4,218.5 8,902.4 179.0 905.5 2,702.3 21.5
Median 217.0 348.5 728.5 1,752.5 7,689.5 64.0 197.0 1,796.7 12.12009-IV Mean 737.3 827.7 1,272.7 1,818.6 8,781.7 441.5 352.4 2,249.1 32.8
Median 227.5 390.0 469.5 1,033.0 7,029.5 183.0 160.0 1,544.2 14.7
* This quarter covers July 2, 2007 - October 1, 2007 (the last day MXIM trades on Nasdaq beforedelisting).** This quarter covers October 2, 2007 - December 31, 2007.