THEORY OF REGULATORY COMPLIANCE Richard Fiene
3
THEORY OF REGULATORY COMPLIANCE Richard Fiene October 2016 The Theory of Regulatory Compliance (TRC) 1 deals with the importance and significance of complying with rules or regulations. This theory has implications for all rule, regulatory, and standards development throughout human service and economic domains although the research is being drawn from the human services field. The TRC has developed over the past 40 years. It has particular significance now as the need for either more or less oversight has become politically charged. What is important about the TRC is its emphasis on selecting the right rules rather than having more or less rules and the nature of these rules as being significantly predictive of positive outcomes by being in compliance with said rules. The Theory of Regulatory Compliance was first proposed in the 1970's when the relationship between compliance with rules was compared to compliance with best practice standards and outcome data. From this comparison, it became clear that as facilities were in 100% compliance with all rules, there overall best practice scores and positive outcomes began to drop off. It was also found that there was a "sweet spot" at a substantial compliance level where best practice scores and positive outcomes were at their highest levels. In statistical terms, the relationship was curvilinear rather than linear. This initial result has been confirmed many times over the past 40 years in different forms of human service facilities. This result also led to the conclusion that possibly being in "full" or 100% compliance with all rules was not necessarily a good policy and that all rules or regulations are not created equal. This led to the development of two methodologies dealing with risk assessment and key indicators of regulatory compliance. In both of these methodologies, the focus is on identifying a more targeted group of rules that either statistically predict overall regulatory compliance or reduce risk. But what is the underlying reason for the TRC. It appears from data collected in various regulatory systems that the nature of the rules themselves may be the real problem. When rules are too minimal to comply with, it is far more difficult to discriminate between the really good facilities and the mediocre facilities. This unfortunately is the nature of regulatory data, it is dramatically skewed data with the majority of facilities being in compliance with all the rules. The solution to the above dilemma is not to de- regulate or to over-regulate but to come up with the "right" balance of rules or regulations. We do not want to make the mistake of the old proverbial "throwing out the baby with the bathwater". We need to have some form of oversight but it needs to be the right balance of oversight based upon risk and predictive targeting of specific rules or regulations. The statistical methodologies exist to identify these specific risk and predictive rules and regulations. 1. For additional information regarding TRC, please go to the following website: http://RIKInstitute.com/RIKI. Richard Fiene, Ph.D., Research Psychologist, Research Institute for Key Indicators; Senior Consultant for Licensing Measurement, National Association for Regulatory Administration; and Affiliate Professor, Penn State Prevention Research Center. [email protected]
Transcript of THEORY OF REGULATORY COMPLIANCE Richard Fiene

THEORY OF REGULATORY COMPLIANCE
Richard Fiene
October 2016
The Theory of Regulatory Compliance (TRC)1 deals
with the importance and significance of complying
with rules or regulations. This theory has
implications for all rule, regulatory, and standards
development throughout human service and
economic domains although the research is being
drawn from the human services field. The TRC has
developed over the past 40 years. It has particular
significance now as the need for either more or less
oversight has become politically charged. What is
important about the TRC is its emphasis on selecting
the right rules rather than having more or less rules
and the nature of these rules as being significantly
predictive of positive outcomes by being in
compliance with said rules.
The Theory of Regulatory Compliance was first
proposed in the 1970's when the relationship
between compliance with rules was compared to
compliance with best practice standards and
outcome data. From this comparison, it became
clear that as facilities were in 100% compliance with
all rules, there overall best practice scores and
positive outcomes began to drop off. It was also
found that there was a "sweet spot" at a substantial
compliance level where best practice scores and
positive outcomes were at their highest levels. In
statistical terms, the relationship was curvilinear
rather than linear. This initial result has been
confirmed many times over the past 40 years in
different forms of human service facilities. This
result also led to the conclusion that possibly being
in "full" or 100% compliance with all rules was not
necessarily a good policy and that all rules or
regulations are not created equal.
This led to the development of two methodologies
dealing with risk assessment and key indicators of
regulatory compliance. In both of these
methodologies, the focus is on identifying a more
targeted group of rules that either statistically
predict overall regulatory compliance or reduce risk.
But what is the underlying reason for the TRC. It
appears from data collected in various regulatory
systems that the nature of the rules themselves may
be the real problem. When rules are too minimal to
comply with, it is far more difficult to discriminate
between the really good facilities and the mediocre
facilities. This unfortunately is the nature of
regulatory data, it is dramatically skewed data with
the majority of facilities being in compliance with all
the rules.
The solution to the above dilemma is not to de-
regulate or to over-regulate but to come up with the
"right" balance of rules or regulations. We do not
want to make the mistake of the old proverbial
"throwing out the baby with the bathwater". We
need to have some form of oversight but it needs to
be the right balance of oversight based upon risk and
predictive targeting of specific rules or regulations.
The statistical methodologies exist to identify these
specific risk and predictive rules and regulations.
1. For additional information regarding TRC, please go to
the following website: http://RIKInstitute.com/RIKI.
Richard Fiene, Ph.D., Research Psychologist, Research Institute
for Key Indicators; Senior Consultant for Licensing Measurement,
National Association for Regulatory Administration; and Affiliate
Professor, Penn State Prevention Research Center.

Theory of Regulatory Compliance Algorithm (Fiene, 11/16)
Balance of “do no harm” rules with “best practice” standards selected by risk and ability to predict
positive outcomes. The Theory of Regulatory Compliance deals with selecting the “right” rules and
standards that have predictive validity and do no harm. It acknowledges that all rules and standards are
not created equal and have a differential impact in a monitoring or licensing system. By following a
differential monitoring approach of key indicators and risk assessment, the most cost efficient and
effective system can be implemented. The Theory of Regulatory Compliance proposes policy based
upon substantial but not full compliance (100%) with all rules. The following algorithm summarizes TRC:
(PC < 100) + (PQ = 100) KI (10-20% PC) + RA (10-20% PC) + KIQP (5-10% of PQ) OU
Program Compliance (PC)
“Do no harm” rules
Program Quality (PQ)
“Do well” standards
Key Indicators (KI)
Risk Assessment (RA)
Key Indicators (KIPQ)
Balanced Regulatory Compliance of
Program Compliance and Quality
resulting in best outcomes (OU).
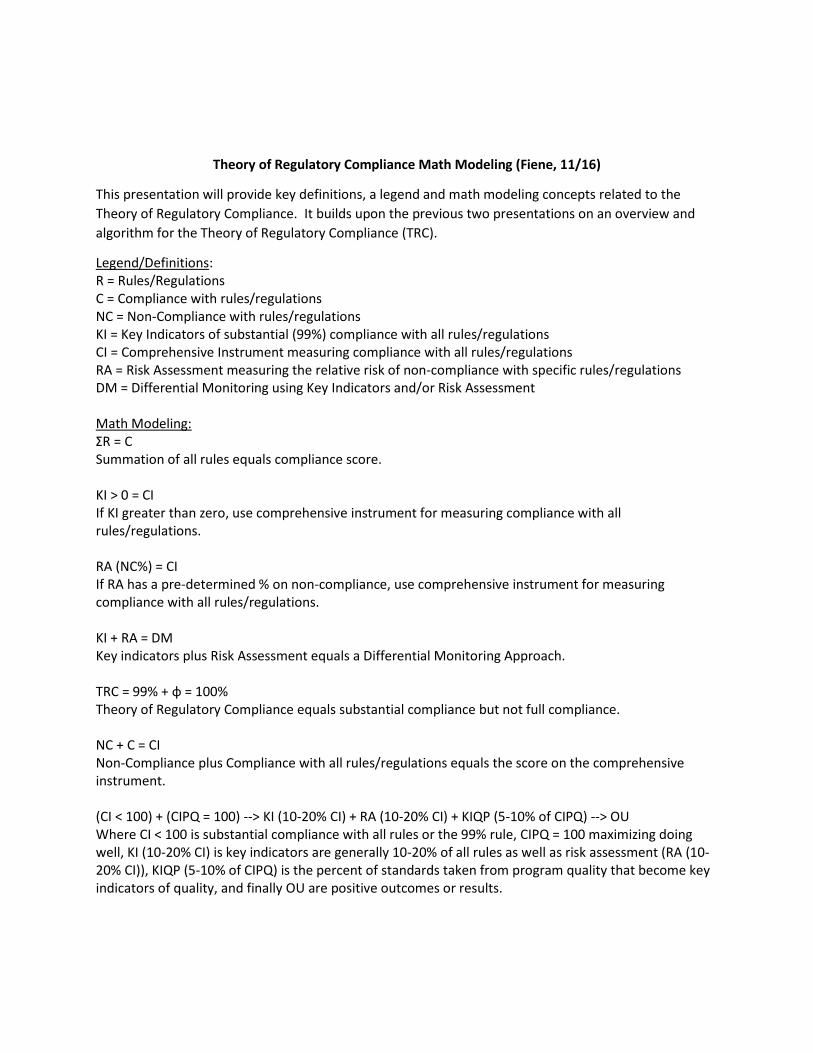
Theory of Regulatory Compliance Math Modeling (Fiene, 11/16)
This presentation will provide key definitions, a legend and math modeling concepts related to the
Theory of Regulatory Compliance. It builds upon the previous two presentations on an overview and
algorithm for the Theory of Regulatory Compliance (TRC).
Legend/Definitions: R = Rules/Regulations C = Compliance with rules/regulations NC = Non-Compliance with rules/regulations KI = Key Indicators of substantial (99%) compliance with all rules/regulations CI = Comprehensive Instrument measuring compliance with all rules/regulations RA = Risk Assessment measuring the relative risk of non-compliance with specific rules/regulations DM = Differential Monitoring using Key Indicators and/or Risk Assessment Math Modeling: ΣR = C Summation of all rules equals compliance score. KI > 0 = CI If KI greater than zero, use comprehensive instrument for measuring compliance with all rules/regulations. RA (NC%) = CI If RA has a pre-determined % on non-compliance, use comprehensive instrument for measuring compliance with all rules/regulations. KI + RA = DM Key indicators plus Risk Assessment equals a Differential Monitoring Approach. TRC = 99% + φ = 100% Theory of Regulatory Compliance equals substantial compliance but not full compliance. NC + C = CI Non-Compliance plus Compliance with all rules/regulations equals the score on the comprehensive instrument. (CI < 100) + (CIPQ = 100) --> KI (10-20% CI) + RA (10-20% CI) + KIQP (5-10% of CIPQ) --> OU Where CI < 100 is substantial compliance with all rules or the 99% rule, CIPQ = 100 maximizing doing well, KI (10-20% CI) is key indicators are generally 10-20% of all rules as well as risk assessment (RA (10-20% CI)), KIQP (5-10% of CIPQ) is the percent of standards taken from program quality that become key indicators of quality, and finally OU are positive outcomes or results.