Theory and practice of colour vision testing: A review. Part
24
Brit. J. industr. Med., 1969, 26, 265-288 Theory and practice of colour vision testing: A review. Part 2 R. LAKOWSKI Visual Laboratory, Department of Psychology, Edinburgh University Lakowski, R. (1969). Brit. J. industr. Med., 26, 265-288. Theory and practice of colour vision testing: A review. Part 2. The more modem tests of colour confusion, hue discrimination, metamerism, and special aptitudes measure a wide variety of attributes. Norms, including variations among normal as well as among defective observers, are given for each test, along with any other information we require to understand them. Finally there is the problem of choice, and factors influencing it, of which tests should be used in different circumstances. Some advice is given on the most useful combinations of tests. Colour confusion - the pseudo-isochromatic tests (PIC) Farnsworth (1955) pointed out that complete specification of stimuli in terms of the physical standards and psychological variables affecting vision and a better definition of experimental populations are needed if we are to study defective and normal vision adequately. This advice applies particularly to pseudo-isochromatic tests. Here the problem is quite complex for theoretically these tests should only be used to divide people into normals and defectives, but, because they are thought to be simple and are easily administered, they are in fact used as a kind of universal colour vision test from which more detailed information even about dis- crimination is extracted. But these tests are the least understood. In design they are very complex though, it must be admitted, ingenious, especially when we consider that many were brought out before accurate colorimetric measurements were available. Yet when examined in detail these plates are often far from ideally designed, and it is because of these faults that we can extract this additional information. Then there is the problem of scoring; of what criteria should be used to classify defects. This has not yet been solved in spite of the numerous papers on this subject, some of them very involved indeed. At present, therefore, it is always better to look upon information from PIC tests as providing a probable but not a certain diagnosis. These tests are called pseudo-isochromatic because normal observers can distinguish between individual colours in the plate and read the intended figures, and therefore they are isochromatic only to defectives (see section on Colour measurement). Basically each of them consists of a number of plates where surface colours are employed in the form of dots to show a multi-coloured figure against a multi- coloured background. Variations in the size of dot (from 2 to 10 mm.), and the employment of arabic numerals and geometric designs for the figure, introduce problems of subtense and form-perception. Plates based on triangles, circles, etc. are simpler to identify while numbers introduce ambiguity or partial difficulties in recognizing the numeral, for example when only a few of the colour elements within the plate are confused (Lakowski, 1965b). Essential structure of PIC tests In the past the efficiency of PIC tests was evaluated by diagnostic criteria but now an objective theoretical approach is possible since colour measurement techniques and the theory of colour vision have advanced sufficiently for them to be confidently used. Although by applying spectro-photometric analysis we could specify these stimuli physically, only 265 copyright. on November 22, 2021 by guest. Protected by http://oem.bmj.com/ Br J Ind Med: first published as 10.1136/oem.26.4.265 on 1 October 1969. Downloaded from
Transcript of Theory and practice of colour vision testing: A review. Part
Brit. J. industr. Med., 1969, 26, 265-288
Theory and practice of colour vision testing:A review. Part 2
R. LAKOWSKIVisual Laboratory, Department of Psychology, Edinburgh University
Lakowski, R. (1969). Brit. J. industr. Med., 26, 265-288. Theory and practice of colour visiontesting: A review. Part 2. The more modem tests of colour confusion, hue discrimination,metamerism, and special aptitudes measure a wide variety of attributes. Norms, includingvariations among normal as well as among defective observers, are given for each test, alongwith any other information we require to understand them. Finally there is the problem ofchoice, and factors influencing it, of which tests should be used in different circumstances.Some advice is given on the most useful combinations of tests.
Colour confusion - the pseudo-isochromatic tests(PIC)
Farnsworth (1955) pointed out that completespecification of stimuli in terms of the physicalstandards and psychological variables affectingvision and a better definition of experimentalpopulations are needed if we are to study defectiveand normal vision adequately. This advice appliesparticularly to pseudo-isochromatic tests. Here theproblem is quite complex for theoretically these testsshould only be used to divide people into normalsand defectives, but, because they are thought to besimple and are easily administered, they are in factused as a kind of universal colour vision test fromwhich more detailed information even about dis-crimination is extracted. But these tests are the leastunderstood. In design they are very complex though,it must be admitted, ingenious, especially when weconsider that many were brought out beforeaccurate colorimetric measurements were available.Yet when examined in detail these plates are oftenfar from ideally designed, and it is because of thesefaults that we can extract this additional information.Then there is the problem of scoring; of what
criteria should be used to classify defects. This hasnot yet been solved in spite of the numerous paperson this subject, some of them very involved indeed.At present, therefore, it is always better to look
upon information from PIC tests as providing aprobable but not a certain diagnosis.
These tests are called pseudo-isochromatic becausenormal observers can distinguish between individualcolours in the plate and read the intended figures,and therefore they are isochromatic only to defectives(see section on Colour measurement). Basicallyeach of them consists of a number of plates wheresurface colours are employed in the form of dots toshow a multi-coloured figure against a multi-coloured background. Variations in the size of dot(from 2 to 10 mm.), and the employment of arabicnumerals and geometric designs for the figure,introduce problems of subtense and form-perception.Plates based on triangles, circles, etc. are simpler toidentify while numbers introduce ambiguity orpartial difficulties in recognizing the numeral, forexample when only a few of the colour elementswithin the plate are confused (Lakowski, 1965b).
Essential structure of PIC testsIn the past the efficiency of PIC tests was evaluatedby diagnostic criteria but now an objective theoreticalapproach is possible since colour measurementtechniques and the theory of colour vision haveadvanced sufficiently for them to be confidently used.Although by applying spectro-photometric analysiswe could specify these stimuli physically, only
265
copyright. on N
ovember 22, 2021 by guest. P
rotected byhttp://oem
.bmj.com
/B
r J Ind Med: first published as 10.1136/oem
.26.4.265 on 1 October 1969. D
ownloaded from

266 R. Lakowski
colorimetric information will be used here since it ismore akin to the relationships underlying stimuliand sensory discrimination. From such dataquantitative predictions can be made about thedifficulty of discriminating, say, figure and back-ground in a given test. This is done by calculating4 c (or colour difference, see section on Colourspecification), while a direct qualitative approachwill allow us to determine whether or not colourconfusion in PIC tests was adequately realized (asthis is always deliberate), and this can provide anindication of how successful the given plates are indetecting outright dichromats.The four basic plate designs common to all PIC
tests are now described in greater detail with refer-ence to colorimetric data. The names given to theseplates are the ones first used by Hardy, Rand, andRittler (1945).
Vanishing type of plates These are the simplest andmost frequently used plates and are found in everyPIC test, some being entirely composed of them.The colours of the figure and background arechosen so that they are aligned along a particularconfusion line for a given dichromat. In dichotomousred-green tests the choice of coloured dots is madeto fit both deutan and protan confusion loci so thatneither is able to read the intended design. Inmodern tests such as the Tokyo Medical College(T.M.C.) colour vision tests they are used in theso-called 'screening' and 'quantitative' plates.Colorimetric data for these plates (see Fig. 1) andfor subsequent figures are arranged so as to yield themaximum information. For example, (a) thechromaticities of coloured dots used in the tests canbe read off to the second decimal point; (b) a numberof isochromatic lines are selected in order toillustrate the colour confusions of a given dichromatto their best advantage; (c) the numerical values of,Jc are marked in; and (d) by using the methodsdescribed in the section on 'Colour specification', thehues and saturations used either for each individualdot or for the total figure and background for eachplate, can be found from AD and purity ratio.The principle involved in designing vanishing
plates is the same for all PIC tests so this exampleillustrates the structure of all such plates eventhough the chosen colours might be from a differentarea of the colour space. In this particular test thecolours are chosen near the spectrum locus positionso that the same coloured dots will serve for bothprotan and deutan defects since their isochromaticcolours are almost the same at this point. The factthat colour differences are introduced permits adegree of quantification; Ac between the colours isquoted in Fig. 1 and varies from about 18 N.B.S.units for the screening plates to 30 for the rightnumeral of the quantitative plates and about 50
0*4 3OBAS52RB6& "N
+ llluminant'C'0 3
03 04 05
FIG. 1. Chromaticities for some T.M.C. plates, illus-trating the 'vanishing type' of design.
N.B.S. units for the left numeral. This allows us toestimate the severity of defects, provided that noneof the screening plates was read correctly. It is(a) mild or first degree if both numerals of thequantitative plates can be read, (b) medium orsecond degree if the left numeral can be read but notthe right, and (c) severe or third degree if neitherleft nor right numerals can be read.
Qualitatively diagnostic type Basically these platesare an extension of the vanishing type of plateexcept that two clusters of coloured dots are used inprinting two separate figures (usually one for thedeuteranope and one for the protanope in the red-green type of plates, and one for the tritanope andone for the tetartanope in the yellow-blue type ofplates). One cluster of colours is used for the back-ground common to both figures. They were includedin PIC tests so that the different types of dichromatcould be distinguished, as essentially this is whatPIC tests claim to be best able to do, that is, diagnosedichromats accurately. However, even here there arevariations in design. For example, the Ishihara andDvorine have much in common whereas theAO H-R-H and T.M.C. tests are differently designed.In some of the tests grey is used as a commonbackground for both deutan and protan figures, butin the Dvorine it may be the figure that is grey andthe background that is purple and red, while in theT.M.C. the deutan figure may be green and theprotan red. It is very important that the two types offigures should be well placed along their confusionlines in relation to the background. The onedescribed in detail here is a qualitatively diagnostic
copyright. on N
ovember 22, 2021 by guest. P
rotected byhttp://oem
.bmj.com
/B
r J Ind Med: first published as 10.1136/oem
.26.4.265 on 1 October 1969. D
ownloaded from
Theory and practice of colour vision testing: A review. Part 2 267
IIC11 I
043
0-3 0-4 05S
x
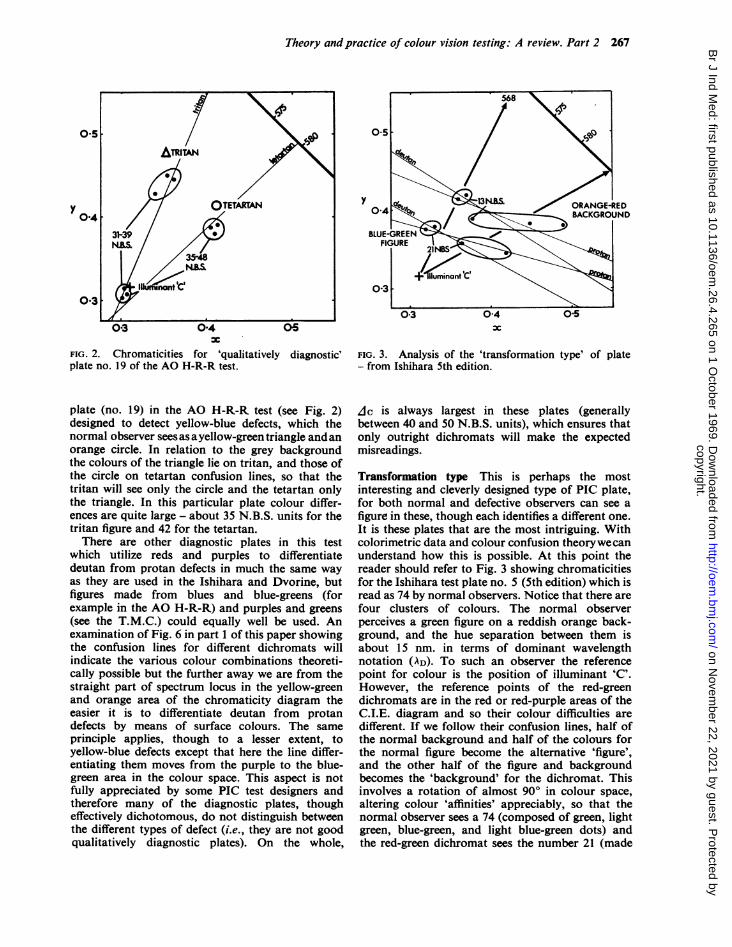
FIG. 2. Chromaticities for 'qualitatively diagnostic'plate no. 19 of the AO H-R-R test.
plate (no. 19) in the AO H-R-R test (see Fig. 2)designed to detect yellow-blue defects, which thenormal observer sees as ayellow-green triangle andanorange circle. In relation to the grey backgroundthe colours of the triangle lie on tritan, and those ofthe circle on tetartan confusion lines, so that thetritan will see only the circle and the tetartan onlythe triangle. In this particular plate colour differ-ences are quite large - about 35 N.B.S. units for thetritan figure and 42 for the tetartan.There are other diagnostic plates in this test
which utilize reds and purples to differentiatedeutan from protan defects in much the same wayas they are used in the Ishihara and Dvorine, butfigures made from blues and blue-greens (forexample in the AO H-R-R) and purples and greens(see the T.M.C.) could equally well be used. Anexamination of Fig. 6 in part 1 of this paper showingthe confusion lines for different dichromats willindicate the various colour combinations theoreti-cally possible but the further away we are from thestraight part of spectrum locus in the yellow-greenand orange area of the chromaticity diagram theeasier it is to differentiate deutan from protandefects by means of surface colours. The sameprinciple applies, though to a lesser extent, toyellow-blue defects except that here the line differ-entiating them moves from the purple to the blue-green area in the colour space. This aspect is notfully appreciated by some PIC test designers andtherefore many of the diagnostic plates, thougheffectively dichotomous, do not distinguish betweenthe different types of defect (i.e., they are not goodqualitatively diagnostic plates). On the whole,
FIG. 3. Analysis of the 'transformation type' of plate- from Ishihara 5th edition.
Ac is always largest in these plates (generallybetween 40 and 50 N.B.S. units), which ensures thatonly outright dichromats will make the expectedmisreadings.
Transformation type This is perhaps the mostinteresting and cleverly designed type of PIC plate,for both normal and defective observers can see afigure in these, though each identifies a different one.It is these plates that are the most intriguing. Withcolorimetric data and colour confusion theorywecanunderstand how this is possible. At this point thereader should refer to Fig. 3 showing chromaticitiesfor the Ishihara test plate no. 5 (5th edition) which isread as 74 by normal observers. Notice that there arefour clusters of colours. The normal observerperceives a green figure on a reddish orange back-ground, and the hue separation between them isabout 15 nm. in terms of dominant wavelengthnotation (AD). To such an observer the referencepoint for colour is the position of illuminant 'C'.However, the reference points of the red-greendichromats are in the red or red-purple areas of theC.I.E. diagram and so their colour difficulties aredifferent. If we follow their confusion lines, half ofthe normal background and half of the colours forthe normal figure become the alternative 'figure',and the other half of the figure and backgroundbecomes the 'background' for the dichromat. Thisinvolves a rotation of almost 900 in colour space,altering colour 'affinities' appreciably, so that thenormal observer sees a 74 (composed of green, lightgreen, blue-green, and light blue-green dots) andthe red-green dichromat sees the number 21 (made
copyright. on N
ovember 22, 2021 by guest. P
rotected byhttp://oem
.bmj.com
/B
r J Ind Med: first published as 10.1136/oem
.26.4.265 on 1 October 1969. D
ownloaded from
268 R. Lakowski
up of green, brown, and orange dots against abackground made up of blue-green, light brown, andpink dots). Ac between figure and background isabout 40 to 50 N.B.S. units, except for two coloureddots in the background lying nearest to the greensin the figure where Ac is about 12 to 25 N.B.S.units. It is the proximity of these few elements inthe plate that prevents people with small colourlosses from seeing the intended pattern distinctly.An element of colour discrimination comes into playand so there is the possibility of reading othernumerals, for example 1 instead of 4. Lakowski(1964, 1965b) found that the very young and oldersubjects find some such plates difficult to read'correctly', and these can therefore be looked on notonly as dichotomous plates but also to some extentas a measure of colour discrimination.
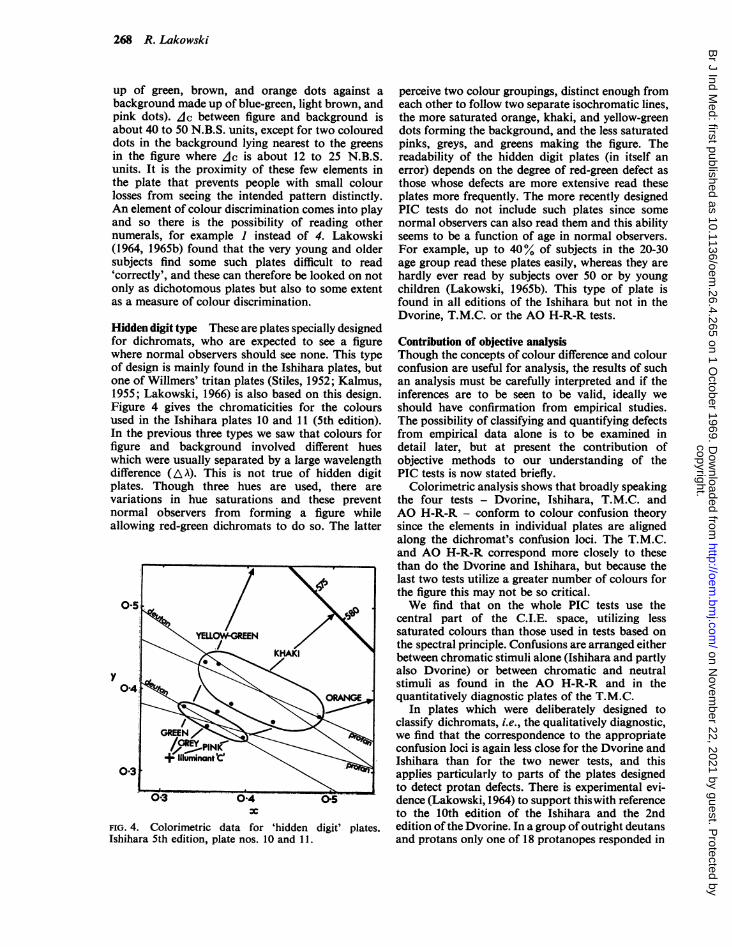
Hidden digit type These are plates specially designedfor dichromats, who are expected to see a figurewhere normal observers should see none. This typeof design is mainly found in the Ishihara plates, butone of Willmers' tritan plates (Stiles, 1952; Kalmus,1955; Lakowski, 1966) is also based on this design.Figure 4 gives the chromaticities for the coloursused in the Ishihara plates 10 and 11 (5th edition).In the previous three types we saw that colours forfigure and background involved different hueswhich were usually separated by a large wavelengthdifference (AA). This is not true of hidden digitplates. Though three hues are used, there arevariations in hue saturations and these preventnormal observers from forming a figure whileallowing red-green dichromats to do so. The latter
YELLO REEN
KHAKI
y~~
x
FIG. 4. Colorimetric data for 'hidden digit' plates.Ishihara 5th edition, plate nos. 10 and 11.
perceive two colour groupings, distinct enough fromeach other to follow two separate isochromatic lines,the more saturated orange, khaki, and yellow-greendots forming the background, and the less saturatedpinks, greys, and greens making the figure. Thereadability of the hidden digit plates (in itself anerror) depends on the degree of red-green defect asthose whose defects are more extensive read theseplates more frequently. The more recently designedPIC tests do not include such plates since somenormal observers can also read them and this abilityseems to be a function of age in normal observers.For example, up to 40% of subjects in the 20-30age group read these plates easily, whereas they arehardly ever read by subjects over 50 or by youngchildren (Lakowski, 1965b). This type of plate isfound in all editions of the Ishihara but not in theDvorine, T.M.C. or the AO H-R-R tests.
Contribution of objective analysisThough the concepts of colour difference and colourconfusion are useful for analysis, the results of suchan analysis must be carefully interpreted and if theinferences are to be seen to be valid, ideally weshould have confirmation from empirical studies.The possibility of classifying and quantifying defectsfrom empirical data alone is to be examined indetail later, but at present the contribution ofobjective methods to our understanding of thePIC tests is now stated briefly.
Colorimetric analysis shows that broadly speakingthe four tests - Dvorine, Ishihara, T.M.C. andAO H-R-R - conform to colour confusion theorysince the elements in individual plates are alignedalong the dichromat's confusion loci. The T.M.C.and AO H-R-R correspond more closely to thesethan do the Dvorine and Ishihara, but because thelast two tests utilize a greater number of colours forthe figure this may not be so critical.We find that on the whole PIC tests use the
central part of the C.I.E. space, utilizing lesssaturated colours than those used in tests based onthe spectral principle. Confusions are arranged eitherbetween chromatic stimuli alone (Ishihara and partlyalso Dvorine) or between chromatic and neutralstimuli as found in the AO H-R-R and in thequantitatively diagnostic plates of the T.M.C.
In plates which were deliberately designed toclassify dichromats, i.e., the qualitatively diagnostic,we find that the correspondence to the appropriateconfusion loci is again less close for the Dvorine andIshihara than for the two newer tests, and thisapplies particularly to parts of the plates designedto detect protan defects. There is experimental evi-dence (Lakowski, 1964) to support thiswith referenceto the 10th edition of the Ishihara and the 2ndedition of the Dvorine. In a group of outright deutansand protans only one of 18 protanopes responded in
copyright. on N
ovember 22, 2021 by guest. P
rotected byhttp://oem
.bmj.com
/B
r J Ind Med: first published as 10.1136/oem
.26.4.265 on 1 October 1969. D
ownloaded from

Theory and practice of colour vision testing: A review. Part 2 269
the accepted manner to the Ishihara, while three outof the 17 cases gave the intended reading for theDvorine. However, of the 18 deutans 12 gave all theexpected responses for the Ishihara qualitativeplates and, similarly, of the 20 deutans tested on theDvorine 10 gave the expected responses. Thus thepercentages of 'expected' or 'correct' readings ofthe possible totals is 22% for protans and 88% fordeutans in the Ishihara, and 20% for protans and60% for deutans in the Dvorine. This deficiency, ofcourse, does not detract from the fact that theseplates are still excellent dichotomous tests, and asthere are colorimetric differences in the variouseditions of such PIC tests, these findings may notapply to other editions.We have also seen that colour difference between
the stimuli of figure and background is alwayslargest in the qualitatively diagnostic plates andless for the 'quantitative' and 'screening' plates.With reference to Ac measurements on theAO H-R-R the validity and usefulness of theconcept of colour difference for assessing thedifficulty of a colour task can be illustrated. It wasfound that for the screening plates Ac is 15 to 25N.B.S. units, while for plates designed to detectmedium R-G defect it is > 36 N.B.S. units and forplates for detecting extreme R-G defect it is >42N.B.S. units. Here we have an example of a testdesigned to detect degrees of defect where theincreased Ac found objectively corresponds to whatthe designer intended. Similarly, in the T.M.C.screening plates, Ac is 18 N.B.S. units while inplates for detecting mild, medium, and severedefects it is 18, 30, and 50 N.B.S. units respectively.
In these two tests then, the order of presentationof the plates is according to the planned order ofdifficulty. This does not apply to the Ishihara andDvorine tests as these were designed mainly to bedichotomous and therefore all plates should beequally difficult. However, it is interesting to notethat the colorimetric data reveal that though inmost of the plates, for example the Ishihara, Ac is25 to 45 N.B.S. units, in some, such as the trans-formation type (series I and II) which containelements critical to the perception of the arabicfigure, it is only between 10 and 15 N.B.S. units, andin such cases it is better to consider the plates asuseful for screening or detecting slight defects. Thesame applies to the Dvorine where Ac is onlyabout 10 to 15 N.B.S. units for the plates in series V(plates 10 and 11), and about 18 to 20 N.B.S. unitsfor plates in series IV and there is empirical evidenceto show that plate 10 is 'difficult' to read. It has thehighest percentage of misreadings per plate in thistest, that is, almost 40% in a population of 500subjects (Lakowski, 1964). Again these plates couldbe considered screening or quantitative plates fordetecting mild defects or losses in discrimination.
So, by having the appropriate knowledge, wecould rearrange the order of presenting the individualplates in such dichotomous tests where those withsmall colour differences (say less than 20 N.B.S.units) could be used for detecting minor defects orimpairment of discrimination in normal subjects,while those with larger differences (35 to 40 N.B.S.units) would be used for detecting outrightdichromats.
The problem of clhssfficationWe have seen that the aim of all PIC tests is to detectcolour confusion. If there were no individualvariations in defects and if the tests were perfectlydesigned, one plate alone would suffice for thatpurpose. But the ideal plate has yet to be designedand we must also accept that there are degrees ofdefect. The poor discrimination of some extremeanomalous trichromats which can amount to partialcolour confusion may cover large areas of the colourspace. Such subjects may perform like outrightdichromats, and so we find that the problems ofdiscrimination and confusion are intermingled.Many tests are too crude to distinguish between thelarge difference in defects (see section on Anomal-oscopes, Fig. 15). In the older PIC tests the aim wasto divide the population only into those with andthose without congenitally determined red-greencolour defects (dichotomy), whereas the more recenttests have introduced discrete steps, so that some'quantification' should be possible. The problem ofdiagnosis is further complicated because there aresubjects who, though not congenitally red-greendeficient, still give faulty readings mostly for thevanishing type of plates and occasionally for thetransformation plates.How far then can PIC tests be used to measure
colour vision and can the degree of defect bequantified from the number of misreadings? TheT.M.C. and AO H-R-R have ostensibly done thisalready, but what about the other tests? Data quotedhere are confined to the Ishihara and Dvorine,which are examined to find whether quantitativediagnosis is possible, and as it is difficult to makeabsolutely final classifications we shall discussdiagnoses only in terms of probabilities.
First let us examine a hypothetical scale ofprobabilities that could apply to the Ishiharareadings. If a subject misreads 24 of the total 24plates given, the probability that he has a congenitalred-green defect is about 0 9 (that is, very high)though this cannot be absolutely certain. His faultyreading might, for example, be the result of centralscotoma, such as is found in the early stages ofacquired dyschromatopsia due to alcohol amblyopia.That he is an outright dichromat is less certain(with P about 0-80) for extreme anomalous subjectscan score very large numbers of misreadings. If he
copyright. on N
ovember 22, 2021 by guest. P
rotected byhttp://oem
.bmj.com
/B
r J Ind Med: first published as 10.1136/oem
.26.4.265 on 1 October 1969. D
ownloaded from
270 R. Lakowski
gives the expected deutan readings the probabilitythat he is a deutan is 0*85, but the prediction for theclassical protan type of defect is less certain as many
such subjects do not give the expected type of mis-readings, for example in the 10th edition of theIshihara (Lakowski, 1965b, 1966). On the otherhand, with such numbers of misreadings, theprobability that the subject is a simple deuter-anomalous is small (thus P = 0 2) and that he hasnormal colour vision is even smaller (P = 005),though there is always a possibility that a neuroticperson with no congenital colour defect could obtainsuch a high score (Pickford, 1949). Of course, theprobability of correct diagnosis will be increasedenormously if information available from othercolour vision tests, especially from tests based on a
different principle, is used.Certain research data (Pickford, 1950; Belcher,
Greenshields, and Wright, 1958) appear to show thatthe frequency distribution of misreadings of, say,
the Ishihara plates in a randomly selected populationhas almost no continuity between normal and colourdefective subjects. Such frequency distributions are
J-shaped with a large number of subjects makinga few mistakes at one end of the error scale and a
relatively large number of subjects making many
mistakes at the other end of the error scale. But itshould be remembered that these data were collectedon young subjects between 20 and 30, many of themstudents, who socially and intellectually are scarcelya representative sample of the general population.For such a population the division between thenumber of misreadings made by defective as opposedto normal subjects is easily established, but this isnot necessarily the case for others, where thedividing line might depend very much on thesampling method, on age, or even on what con-
stitutes a 'misreading'. Let us consider how a givendefect is characterized in terms of numbers ofincorrect readings. Classification of defect is accord-
ing to that obtained from the P-N anomaloscopewhere the term 'outright dichromat' denotes thosedeuteranopes (D) and protanopes (P) who easilyaccept all the possible ratios in the Rayleighequation. Simple anomalous trichromats are thosedeuteranomalous (DA) and protanomalous (PA)subjects who deviate significantly in theirmatching ratios from those most frequently acceptedby normal observers, but otherwise have gooddiscrimination, while the term 'incomplete' impliesall subjects not included in the above classificationsEDA and EPA, that is anomalous trichromats withenlarged matching ranges (accepting a number ofratios) and incomplete dichromats (see section onAnomaloscopes).Number of subjects (all males) in each sub-class
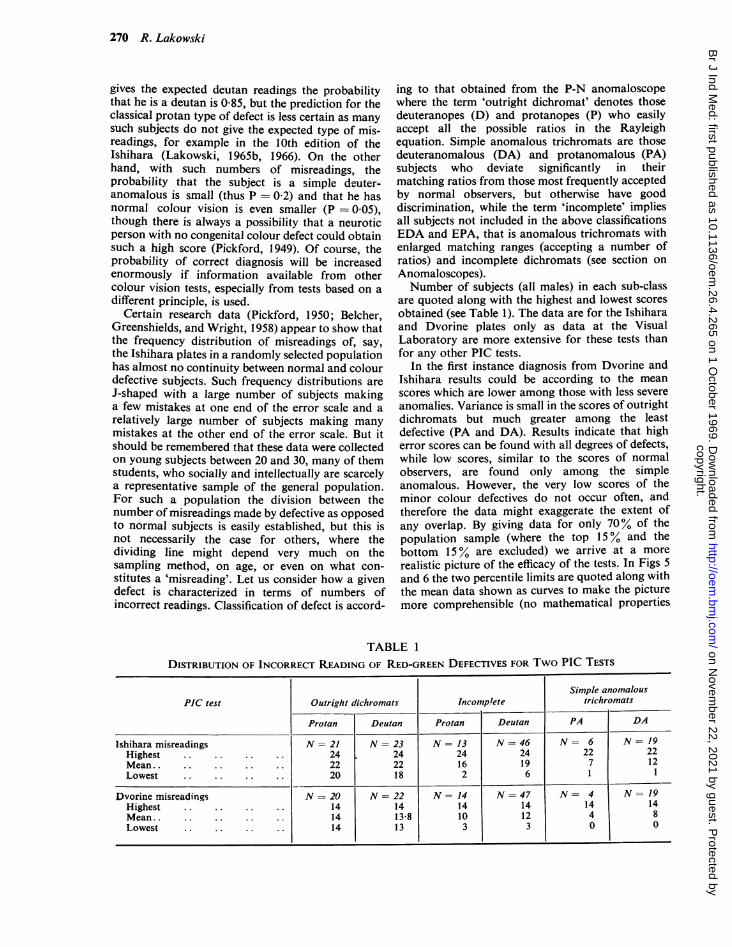
are quoted along with the highest and lowest scoresobtained (see Table 1). The data are for the Ishiharaand Dvorine plates only as data at the VisualLaboratory are more extensive for these tests thanfor any other PIC tests.
In the first instance diagnosis from Dvorine andIshihara results could be according to the meanscores which are lower among those with less severeanomalies. Variance is small in the scores of outrightdichromats but much greater among the leastdefective (PA and DA). Results indicate that higherror scores can be found with all degrees of defects,while low scores, similar to the scores of normalobservers, are found only among the simpleanomalous. However, the very low scores of theminor colour defectives do not occur often, andtherefore the data might exaggerate the extent ofany overlap. By giving data for only 70% of thepopulation sample (where the top 15 % and thebottom 15% are excluded) we arrive at a morerealistic picture of the efficacy of the tests. In Figs 5and 6 the two percentile limits are quoted along withthe mean data shown as curves to make the picturemore comprehensible (no mathematical properties
TABLE 1DISTRIBUTION OF INCORRECT READING OF RED-GREEN DEFECTIVES FOR Two PIC TESTS
Simple anomalousPIC test Outright dichromats Incomplete trichromats
Protan Deutan Protan Deutan PA DA
Ishihara misreadings N= 21 N =23 N = 13 N = 46 N= 6 N = 19Highest .. .. .. .. 24 24 24 24 22 22Mean.. 22 22 16 19 7 12Lowest .. .. .. .. 20 18 2 6 1 1
Dvorine nisreadings N =20 N =22 N =14 N =47 N= 4 N 19Highest .. .. .. .. 14 14 14 14 14 14Mean.. 14 13-8 10 12 4 8Lowest .. .. .. .. 14 13 3 3 0 0
copyright. on N
ovember 22, 2021 by guest. P
rotected byhttp://oem
.bmj.com
/B
r J Ind Med: first published as 10.1136/oem
.26.4.265 on 1 October 1969. D
ownloaded from

Theory and practice of colour vision testing: A review. Part 2 271
M --xvxN-- -
" \
x
x
DEUTAN
12
la
N -x -x-K
PROTAN
z
zx
x.
,x
v. _ .D ID DA P IP PA
FIG. 5. Dvorine misreadings for the mean, 15th, and85th percentiles for deutan and protan type of defects;dichromats (P, D), incomplete (IP, ID), anomalous (PA,DA).
5'
4
3
2
'4
It
75 12-5 20 30 40 50 60 66+
AGE GROUPS
FIG. 7. Mean number of misreadings for an age popu-lation on two PIC tests.
240
z 20
16
1 1U,0
Ul
zo
2
21X
-""
I
..XX
DEUTAN
D lb DA
FIG. 6. Ishihara misreadings fo:85th percentiles for deutan and Idichromats (P, D), incomplete(PA, DA).
should be attributed to these).the data on anomalous deutefrom a larger sample than wasthe inferences that can be rndiagrams are numerous, for e;and Ishihara discriminate degbetter than comparable protan
In order to find the highesmisreadings for non-defectiveat low scores alone. Would su4us to exclude colour defectiveswe be that it does so? The uset al., 1958) used for normalfirst presentation, there shoulthree misreadings for the Ishthan one for the Dvorine. Ithowever, that these are verycould be misleading if classificthe very young were made accoor if it were used on subje4involved in Belcher's study. I
giving average misreadings
2
population for the two PIC tests, we see that them X~~-~--x cut-off point used by Belcher et al. could only apply
e " to certain age groups. Thus the criterion used todecide the cut-off point depends not only on the
l ' *\ \ type of population involved but also on the sampling12 \ technique employed. Let us consider this last point
in greater detail. We distinguish between two kindsof population (a) inclusive, where everyone is tested
4 PROTAN 's including all those with red-green defects, and
cX---x (b) modified, where colour defective persons are
PIP PA excluded from the sample. Again we may have a'closedpopulation' where everyone in a given class or
r the mean, 15th, and locality is included and tested, or an 'open population'protan types of defects; where some choice has been made and thus only a(IP, ID), anomalous 'sample' of a given class is tested. In such populations
it is important to assess the extent of the 'random-ness' achieved. For this purpose Belcher's resultswill be compared with those obtained from 745 male
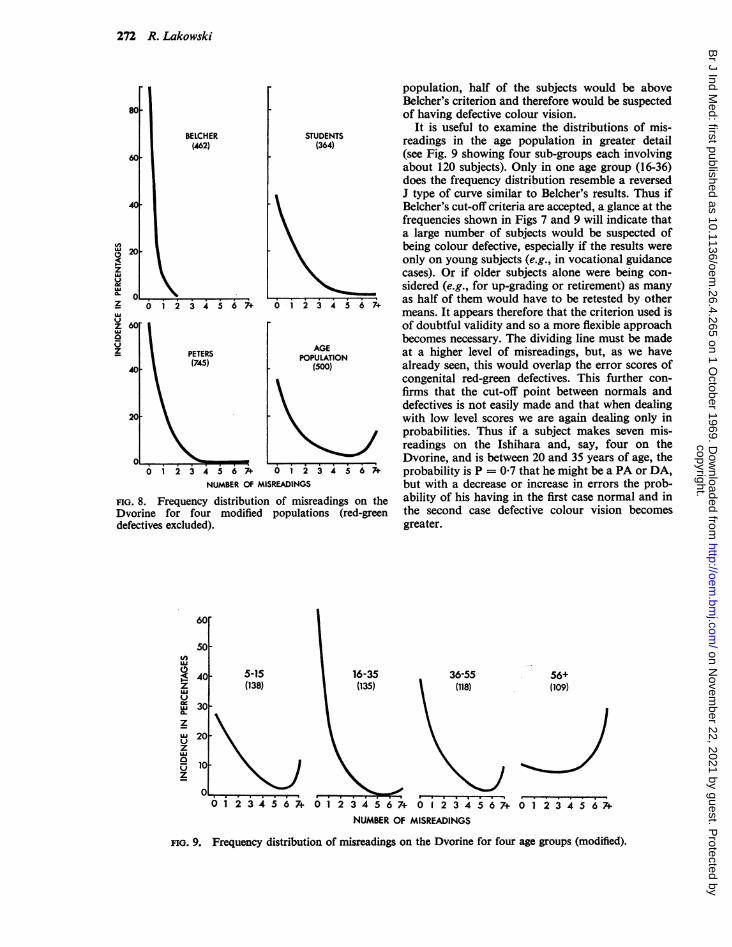
Bearing in mind that police candidates (Peters, 1954), with those of 364an defects are drawn first-year psychology students at Edinburgh, andavailable for protans, with an age population of 500 subjects - 244 maleiade from these two and 256 females - ranging from 5 to 80 yearsxample both Dvorine (Lakowski, 1964). Analysis is confined to data for;rees of deutan defect the Dvorine, as discrepancies are largesthere, thoughi ones. there are similar smaller ones for the Ishihara.,tpossible number of Figure 8 shows results for the four modified popu-observers let us look lations (that is, red-green defectives excluded). Thech an approach allow frequency curves for three of the populations show,, and how certain can a less sharp decrease in numbers of subjects with,ual criterion (Belcher greater error scores than were found in Belcher'sobservers is that, on population, where a great many subjects made onlyId be not more than one or two misreadings. The frequency curve for theiihara and not more age population is quite different from the other threemust be emphasized, in having the lowest percentage of subjects with nobiased figures which misreadings, and in showing a 14-5% incidence ofation of the results of subjects with seven or more misreadings. Rememberprding to these criteria, that both the Edinburgh student study and Peter'scts older than those study were on closed populations. Both these studiesIf we look at Fig. 7 show high percentages of those with two and moreof a modified age misreadings (32 and 16 respectively). In the age
14
12z
10LU
A
I
copyright. on N
ovember 22, 2021 by guest. P
rotected byhttp://oem
.bmj.com
/B
r J Ind Med: first published as 10.1136/oem
.26.4.265 on 1 October 1969. D
ownloaded from
272 R. Lakowski
BELCHER(462)
STUDENTS(364)
AGEPOPULATION
(500)
0 1i2 3 4 5 67+ 061 2 3 4 6 +
NUMBER OF MISREADINGS
FIG. 8. Frequency distribution of misreadings on theDvorine for four modified populations (red-greendefectives excluded).
LU
0
i-zuJ
u
a-
z
LU
zU
LUz
5-15(138)
population, half of the subjects would be aboveBelcher's criterion and therefore would be suspectedof having defective colour vision.
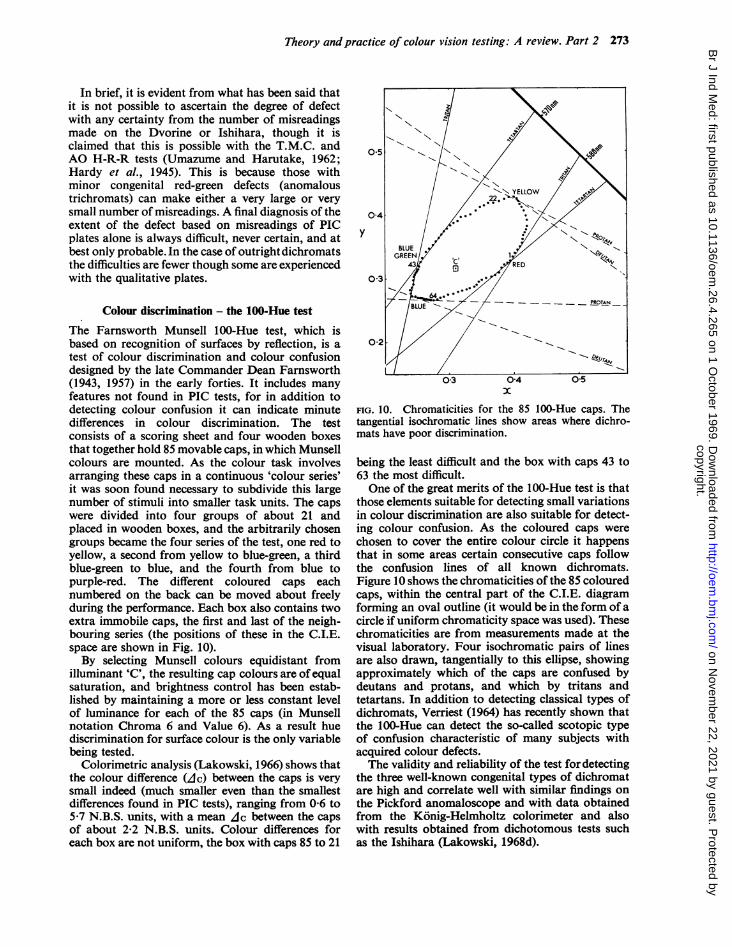
It is useful to examine the distributions of mis-readings in the age population in greater detail(see Fig. 9 showing four sub-groups each involvingabout 120 subjects). Only in one age group (16-36)does the frequency distribution resemble a reversedJ type of curve similar to Belcher's results. Thus ifBelcher's cut-offcriteria are accepted, a glance at thefrequencies shown in Figs 7 and 9 will indicate thata large number of subjects would be suspected ofbeing colour defective, especially if the results wereonly on young subjects (e.g., in vocational guidancecases). Or if older subjects alone were being con-sidered (e.g., for up-grading or retirement) as manyas half of them would have to be retested by othermeans. It appears therefore that the criterion used isof doubtful validity and so a more flexible approachbecomes necessary. The dividing line must be madeat a higher level of misreadings, but, as we havealready seen, this would overlap the error scores ofcongenital red-green defectives. This further con-firms that the cut-off point between normals anddefectives is not easily made and that when dealingwith low level scores we are again dealing only inprobabilities. Thus if a subject makes seven mis-readings on the Ishihara and, say, four on theDvorine, and is between 20 and 35 years of age, theprobability is P = 0 7 that he might be a PA or DA,but with a decrease or increase in errors the prob-ability of his having in the first case normal and inthe second case defective colour vision becomesgreater.
36-55(118)
56+(109)
0 1 2 3 4 5 6 7+ 0 1 2 3 4 5 6 7+
NUMBER OF MISREADINGS
FIG. 9. Frequency distribution of misreadings on the Dvorine for four age groups (modified).
LU
zU
uz
Vz.0V
PETERS(745)
copyright. on N
ovember 22, 2021 by guest. P
rotected byhttp://oem
.bmj.com
/B
r J Ind Med: first published as 10.1136/oem
.26.4.265 on 1 October 1969. D
ownloaded from
Theory andpractice of colour vision testing: A review. Part 2 273
In brief, it is evident from what has been said thatit is not possible to ascertain the degree of defectwith any certainty from the number of misreadingsmade on the Dvorine or Ishihara, though it isclaimed that this is possible with the T.M.C. andAO H-R-R tests (Umazume and Harutake, 1962;Hardy et al., 1945). This is because those withminor congenital red-green defects (anomaloustrichromats) can make either a very large or verysmall number of misreadings. A final diagnosis of theextent of the defect based on misreadings of PICplates alone is always difficult, never certain, and atbest only probable. In the case of outright dichromatsthe difficulties are fewer though some are experiencedwith the qualitative plates.
Colour discrimination - the 100-Hue test
The Farnsworth Munsell 100-Hue test, which isbased on recognition of surfaces by reflection, is atest of colour discrimination and colour confusiondesigned by the late Commander Dean Farnsworth(1943, 1957) in the early forties. It includes manyfeatures not found in PIC tests, for in addition todetecting colour confusion it can indicate minutedifferences in colour discrimination. The testconsists of a scoring sheet and four wooden boxesthat together hold 85 movable caps, in which Munsellcolours are mounted. As the colour task involvesarranging these caps in a continuous 'colour series'it was soon found necessary to subdivide this largenumber of stimuli into smaller task units. The capswere divided into four groups of about 21 andplaced in wooden boxes, and the arbitrarily chosengroups became the four series of the test, one red toyellow, a second from yellow to blue-green, a thirdblue-green to blue, and the fourth from blue topurple-red. The different coloured caps eachnumbered on the back can be moved about freelyduring the performance. Each box also contains twoextra immobile caps, the first and last of the neigh-bouring series (the positions of these in the C.I.E.space are shown in Fig. 10).By selecting Munsell colours equidistant from
illuminant 'C', the resulting cap colours are ofequalsaturation, and brightness control has been estab-lished by maintaining a more or less constant levelof luminance for each of the 85 caps (in Munsellnotation Chroma 6 and Value 6). As a result huediscrimination for surface colour is the only variablebeing tested.
Colorimetric analysis (Lakowski, 1966) shows thatthe colour difference (Ac) between the caps is verysmall indeed (much smaller even than the smallestdifferences found in PIC tests), ranging from 0-6 to5.7 N.B.S. units, with a mean Ac between the capsof about 2-2 N.B.S. units. Colour differences foreach box are not uniform, the box with caps 85 to 21
GREEN 1C.43 ~~~~~~ED
0-3
BW __ROA
0-2
03 04 05x
FIG. 10. Chromaticities for the 85 100-Hue caps. Thetangential isochromatic lines show areas where dichro-mats have poor discrimination.
being the least difficult and the box with caps 43 to63 the most difficult.One of the great merits of the 100-Hue test is that
those elements suitable for detecting small variationsin colour discrimination are also suitable for detect-ing colour confusion. As the coloured caps werechosen to cover the entire colour circle it happensthat in some areas certain consecutive caps followthe confusion lines of all known dichromats.Figure 10 shows the chromaticities of the 85 colouredcaps, within the central part of the C.I.E. diagramforming an oval outline (it would be in the form of acircle if uniform chromaticity space was used). Thesechromaticities are from measurements made at thevisual laboratory. Four isochromatic pairs of linesare also drawn, tangentially to this ellipse, showingapproximately which of the caps are confused bydeutans and protans, and which by tritans andtetartans. In addition to detecting classical types ofdichromats, Verriest (1964) has recently shown thatthe 100-Hue can detect the so-called scotopic typeof confusion characteristic of many subjects withacquired colour defects.The validity and reliability of the test fordetecting
the three well-known congenital types of dichromatare high and correlate well with similar findings onthe Pickford anomaloscope and with data obtainedfrom the Konig-Helmholtz colorimeter and alsowith results obtained from dichotomous tests suchas the Ishihara (Lakowski, 1968d).
copyright. on N
ovember 22, 2021 by guest. P
rotected byhttp://oem
.bmj.com
/B
r J Ind Med: first published as 10.1136/oem
.26.4.265 on 1 October 1969. D
ownloaded from
274 R. Lakowski
PROTAN DEUTAN
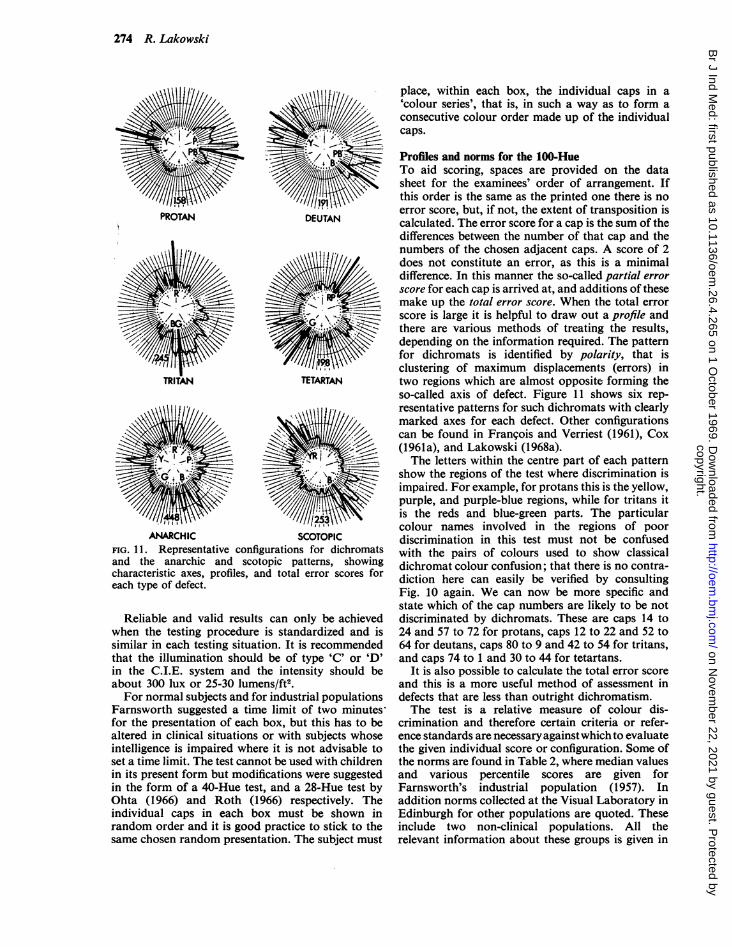
ANARCHIC SCOTOPICFIG. 11. Representative configurations for dichromatsand the anarchic and scotopic patterns, showingcharacteristic axes, profiles, and total error scores foreach type of defect.
Reliable and valid results can only be achievedwhen the testing procedure is standardized and issimilar in each testing situation. It is recommendedthat the illumination should be of type 'C' or 'D'in the C.I.E. system and the intensity should beabout 300 lux or 25-30 lumens/ft2.For normal subjects and for industrial populations
Farnsworth suggested a time limit of two minutes,for the presentation of each box, but this has to bealtered in clinical situations or with subjects whoseintelligence is impaired where it is not advisable toset a time limit. The test cannot be used with childrenin its present form but modifications were suggestedin the form of a 40-Hue test, and a 28-Hue test byOhta (1966) and Roth (1966) respectively. Theindividual caps in each box must be shown inrandom order and it is good practice to stick to thesame chosen random presentation. The subject must
place, within each box, the individual caps in a'colour series', that is, in such a way as to form aconsecutive colour order made up of the individualcaps.
Profiles and norms for the 100-HueTo aid scoring, spaces are provided on the datasheet for the examinees' order of arrangement. Ifthis order is the same as the printed one there is noerror score, but, if not, the extent of transposition iscalculated. The error score for a cap is the sum of thedifferences between the number of that cap and thenumbers of the chosen adjacent caps. A score of 2does not constitute an error, as this is a minimaldifference. In this manner the so-called partial errorscore for each cap is arrived at, and additions of thesemake up the total error score. When the total errorscore is large it is helpful to draw out a profile andthere are various methods of treating the results,depending on the information required. The patternfor dichromats is identified by polarity, that isclustering of maximum displacements (errors) intwo regions which are almost opposite forming theso-called axis of defect. Figure 11 shows six rep-resentative patterns for such dichromats with clearlymarked axes for each defect. Other configurationscan be found in Frangois and Verriest (1961), Cox(1961a), and Lakowski (1968a).The letters within the centre part of each pattern
show the regions of the test where discrimination isimpaired. For example, for protans this is the yellow,purple, and purple-blue regions, while for tritans itis the reds and blue-green parts. The particularcolour names involved in the regions of poordiscrimination in this test must not be confusedwith the pairs of colours used to show classicaldichromat colour confusion; that there is no contra-diction here can easily be verified by consultingFig. 10 again. We can now be more specific andstate which of the cap numbers are likely to be notdiscriminated by dichromats. These are caps 14 to24 and 57 to 72 for protans, caps 12 to 22 and 52 to64 for deutans, caps 80 to 9 and 42 to 54 for tritans,and caps 74 to 1 and 30 to 44 for tetartans.
It is also possible to calculate the total error scoreand this is a more useful method of assessment indefects that are less than outright dichromatism.The test is a relative measure of colour dis-
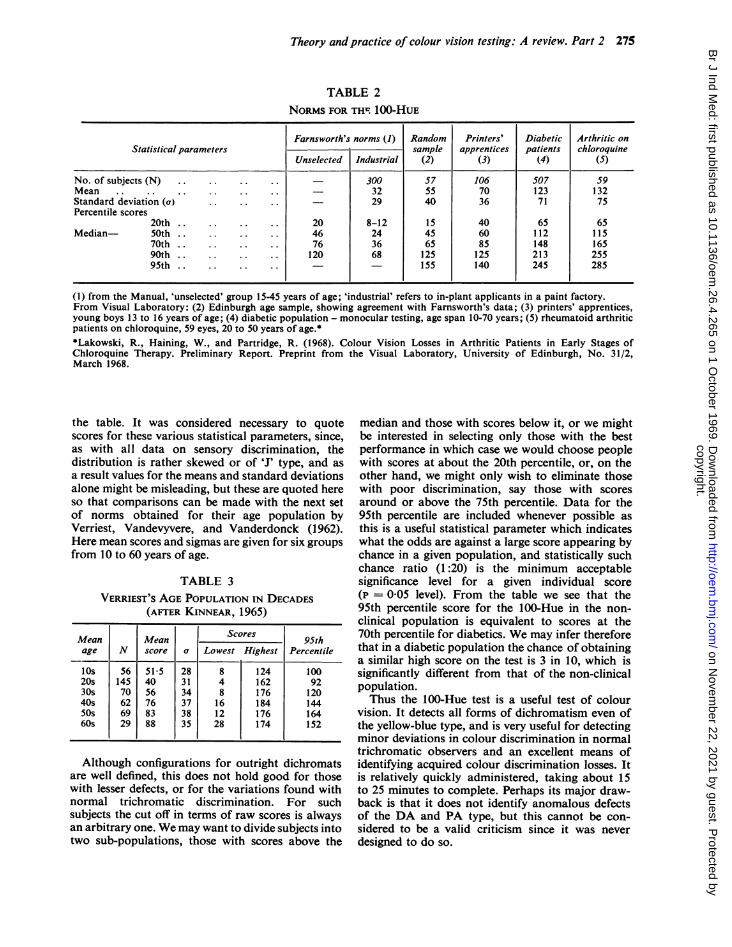
crimination and therefore certain criteria or refer-ence standards are necessary againstwhich to evaluatethe given individual score or configuration. Some ofthe norms are found in Table 2, where median valuesand various percentile scores are given forFarnsworth's industrial population (1957). Inaddition norms collected at the Visual Laboratory inEdinburgh for other populations are quoted. Theseinclude two non-clinical populations. All therelevant information about these groups is given in
copyright. on N
ovember 22, 2021 by guest. P
rotected byhttp://oem
.bmj.com
/B
r J Ind Med: first published as 10.1136/oem
.26.4.265 on 1 October 1969. D
ownloaded from
Theory andpractice of colour vision testing: A review. Part 2 275
TABLE 2NORMS FOR TH' 100 HUE
Farnsworth's norms (1) Random Printers' Diabetic Arthritic onStatistical parameters sample apprentices patients chloroquine
Unselected Industrial (2) (3) (4) (5)
No. of subjects (N) .. .. .. .. 300 57 106 507 59Mean . .. .. .. .. .. 32 55 70 123 132Standard deviation (a) .. .. .. 29 40 36 71 75Percentile scores
20th .. .. .. .. 20 8-12 15 40 65 65Median- 50th .. .. .. .. 46 24 45 60 112 115
70th .. .. .. .. 76 36 65 85 148 16590th .. .. .. .. 120 68 125 125 213 25595th .. .. .. .. - - 155 140 245 285
(1) from the Manual, 'unselected' group 15-45 years of age; 'industrial' refers to in-plant applicants in a paint factory.From Visual Laboratory: (2) Edinburgh age sample, showing agreement with Farnsworth's data; (3) printers' apprentices,young boys 13 to 16 years of age; (4) diabetic population - monocular testing, age span 10-70 years; (5) rheumatoid arthriticpatients on chloroquine, 59 eyes, 20 to 50 years of age.**Lakowski, R., Haining, W., and Partridge, R. (1968). Colour Vision Losses in Arthritic Patients in Early Stages ofChloroquine Therapy. Preliminary Report. Preprint from the Visual Laboratory, University of Edinburgh, No. 31/2,March 1968.
the table. It was considered necessary to quotescores for these various statistical parameters, since,as with all data on sensory discrimination, thedistribution is rather skewed or of 'J' type, and asa result values for the means and standard deviationsalone might be misleading, but these are quoted hereso that comparisons can be made with the next setof norms obtained for their age population byVerriest, Vandevyvere, and Vanderdonck (1962).Here mean scores and sigmas are given for six groupsfrom 10 to 60 years of age.
TABLE 3VERRIEST'S AGE POPULATION IN DECADES
(AFTER KINNEAR, 1965)
Mean Mean Scores 95thage N score a Lowest Highest Percentile
lOs 56 515 28 8 124 10020s 145 40 31 4 162 9230s 70 56 34 8 176 12040s 62 76 37 16 184 144SOs 69 83 38 12 176 16460s 29 88 35 28 174 152
Although configurations for outright dichromatsare well defined, this does not hold good for thosewith lesser defects, or for the variations found withnormal trichromatic discrimination. For suchsubjects the cut off in terms of raw scores is alwaysan arbitrary one. We may want to divide subjects intotwo sub-populations, those with scores above the
median and those with scores below it, or we mightbe interested in selecting only those with the bestperformance in which case we would choose peoplewith scores at about the 20th percentile, or, on theother hand, we might only wish to eliminate thosewith poor discrimination, say those with scoresaround or above the 75th percentile. Data for the95th percentile are included whenever possible asthis is a useful statistical parameter which indicateswhat the odds are against a large score appearing bychance in a given population, and statistically suchchance ratio (1:20) is the minimum acceptablesignificance level for a given individual score(p = 0 05 level). From the table we see that the95th percentile score for the 100-Hue in the non-clinical population is equivalent to scores at the70th percentile for diabetics. We may infer thereforethat in a diabetic population the chance of obtaininga similar high score on the test is 3 in 10, which issignificantly different from that of the non-clinicalpopulation.Thus the 100-Hue test is a useful test of colour
vision. It detects all forms of dichromatism even ofthe yellow-blue type, and is very useful for detectingminor deviations in colour discrimination in normaltrichromatic observers and an excellent means ofidentifying acquired colour discrimination losses. Itis relatively quickly administered, taking about 15to 25 minutes to complete. Perhaps its major draw-back is that it does not identify anomalous defectsof the DA and PA type, but this cannot be con-sidered to be a valid criticism since it was neverdesigned to do so.
copyright. on N
ovember 22, 2021 by guest. P
rotected byhttp://oem
.bmj.com
/B
r J Ind Med: first published as 10.1136/oem
.26.4.265 on 1 October 1969. D
ownloaded from

276 R. Lakowski
Metamerism - anomaloscopes
In their comparative evaluation of anomaloscopesWillis and Farnsworth (1952) define these instru-ments as devices 'for mixing red and green lights invarying proportions to produce a match for yellowlight . . .'. This is true of the instrument used byLord Rayleigh (1881) who first discovered the widevariations in the ratios of subjects with apparentlynormal colour vision. Since then, and especiallysince the construction of Nagel's anomaloscope in1898, they have been used to find anomalous anddichromatic red-green defects (Nagel, 1907).
Essentially anomaloscopes are instruments, whereeither spectral or filtered lights employing a filmmode of appearance are used, in which the viewingaperture is either fixed or can be varied slightly.The viewing field is divided into two parts, onestandard and one variable, the latter involving amixture of two primaries. Matches producing anequal sensation for the two parts are in a metamericrelationship, and so in the original 'RayleighEquation' a variable mixture of lithium red andthallium green were matched against a sodiumyellow. In some of the Nagel anomaloscopes (modelII) the so-called 'Trendelenburg Equation', in whicha standard blue is matched by additive mixtures ofviolet and blue-green, is included. Finally, thePickford type of anomaloscope utilized a thirdequation in which a white (near illuminant A) can bematched by a mixture ofyellow and blue (see Fig. 12).The information that can be obtained from an
anomaloscope will depend on the method of testingand on how the data were quantified. There are avariety of psychophysical methods of assessingcolour vision by this means, and in the early days asubject was permitted to operate the variableshimself, yielding one matching setting. This methodwas sometimes extended by allowing the testee tomake several matches and a mean setting wascalculated from this. Others recommended that allmanipulations should be done by the experimenterand that the method of constant stimuli should beutilized. Pickford (1951), however, strongly recom-mends the use of the methods of limits, where theexaminer makes a number of serial adjustments,continuing until he has established all possiblemixture ratios and explored the whole matchingrange or interval of equality for the observer.Some subjects might have a small matching range
(MR), accepting only one ratio setting, whereasothers may accept a number of ratios and thus havea larger MR, and when this happens a mid-matchingpoint (MMP) is usually calculated. From thecombined data of matching range and mid-matchingsetting inferences can be made about the sensorydiscrimination and physiology of a subject's visualsystem.
0-8
0-6
y0-4
0-21
FIG. 12. Loci of anomaloscope colour equations givingtheir original names, and chromaticities for the green-blueequations 0, 20, 30, and 60 arbitrary unit settings andstandard (for the P-N anomaloscope).
There are a number of methods of recording suchdata, the simplest being to quote the mixturesaccepted, a kind of arbitrary instrumental indexindicating the numbers of millimetres or degreesettings on a scale. Another way is to mark suchsettings on a diagram against an arbitrarily chosenscale representing the entire colour equation - withits red and green end points.
Deviations in mixture ratiosThough a large number of subjects have very smallMRs and accept perhaps only one mixture ratio sothat both their MMPs and MRs have the samenumerical value, there are others, who, althoughtheir discrimination is good, require differingamounts of the primaries to match a given standard,some needing more red and others more green inthe Rayleigh equation. For such people it is bothuseful and meaningful to express this deviationquantitatively. In order to do this Trendelenburg(1929) introduced the so-called 'anomaly quotients'for the Nagel anomaloscope, a mathematical devicewhich attempted to express the magnitude of suchdeviations by the following formula:
N' NQ 73 - N' 73 - N
where N is the position of the mixture setting for anaverage normal observer, and N' the position
copyright. on N
ovember 22, 2021 by guest. P
rotected byhttp://oem
.bmj.com
/B
r J Ind Med: first published as 10.1136/oem
.26.4.265 on 1 October 1969. D
ownloaded from
Theory andpractice of colour vision testing: A review. Part 2 277
YELLOW-BLUEN 124
GREEN-BLUEN 125
-3 -2 -1
STANDARD DEVIATIONSFIG. 13. Frequency distribution of mixture ratios for three P-N anomaloscopeequations (rea-green, yellow-blue, and green-blue) and number of subjects involved(age span 16-60 years).
adopted by a deviant subject, and the number 73represents the end of the scale for that particularNagel instrument in the red-green equation. Themore the value of Q deviates from 1 in eitherdirection the greater is the deviation from the mostfrequent quotient. For example, Q = 1 5 denotesa degree of deuteranomaly, while Q = 0-5 indicatesa degree of protanomaly, and any intermediatevalues can be obtained. This measure is mostfrequently used on the continent, and is a very simpleway of expressing quantitatively certain aspects of,say, red-green anomalous vision. Verriest (1968)shows that this formula can be adapted for use withany type of anomaloscope.The criticism of this is that it is still only a relative
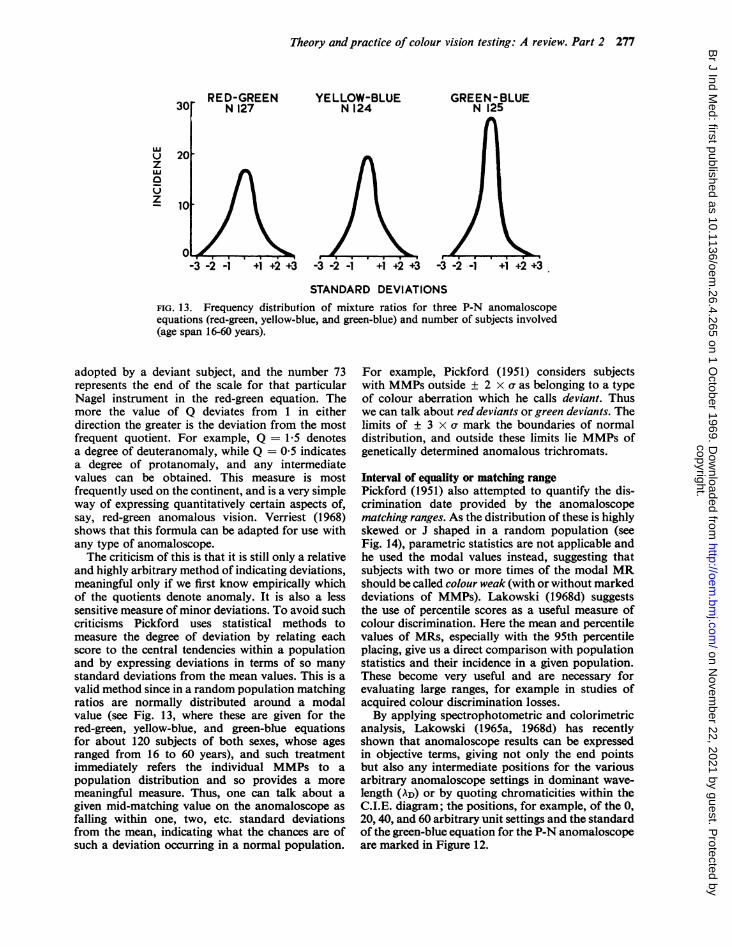
and highly arbitrary method of indicating deviations,meaningful only if we first know empirically whichof the quotients denote anomaly. It is also a lesssensitive measure of minor deviations. To avoid suchcriticisms Pickford uses statistical methods tomeasure the degree of deviation by relating eachscore to the central tendencies within a populationand by expressing deviations in terms of so manystandard deviations from the mean values. This is avalid method since in a random population matchingratios are normally distributed around a modalvalue (see Fig. 13, where these are given for thered-green, yellow-blue, and green-blue equationsfor about 120 subjects of both sexes, whose agesranged from 16 to 60 years), and such treatmentimmediately refers the individual MMPs to apopulation distribution and so provides a moremeaningful measure. Thus, one can talk about agiven mid-matching value on the anomaloscope asfalling within one, two, etc. standard deviationsfrom the mean, indicating what the chances are ofsuch a deviation occurring in a normal population.
For example, Pickford (1951) considers subjectswith MMPs outside ± 2 x a as belonging to a typeof colour aberration which he calls deviant. Thuswe can talk about red deviants or green deviants. Thelimits of ± 3 x a mark the boundaries of normaldistribution, and outside these limits lie MMPs ofgenetically determined anomalous trichromats.
Interval of equality or matching rangePickford (1951) also attempted to quantify the dis-crimination date provided by the anomaloscopematching ranges. As the distribution of these is highlyskewed or J shaped in a random population (seeFig. 14), parametric statistics are not applicable andhe used the modal values instead, suggesting thatsubjects with two or more times of the modal MRshould be called colour weak (with or without markeddeviations of MMPs). Lakowski (1968d) suggeststhe use of percentile scores as a useful measure ofcolour discrimination. Here the mean and percentilevalues of MRs, especially with the 95th percentileplacing, give us a direct comparison with populationstatistics and their incidence in a given population.These become very useful and are necessary forevaluating large ranges, for example in studies ofacquired colour discrimination losses.By applying spectrophotometric and colorimetric
analysis, Lakowski (1965a, 1968d) has recentlyshown that anomaloscope results can be expressedin objective terms, giving not only the end pointsbut also any intermediate positions for the variousarbitrary anomaloscope settings in dominant wave-length (AD) or by quoting chromaticities within theC.I.E. diagram; the positions, for example, of the 0,20, 40, and 60 arbitrary unit settings and the standardof the green-blue equation for the P-N anomaloscopeare marked in Figure 12.
RED-GREENN 127
LUIuzLU
z
-3 +1 +2 +3 -3 -2 -1 +1 +2 +3 +2 +3
copyright. on N
ovember 22, 2021 by guest. P
rotected byhttp://oem
.bmj.com
/B
r J Ind Med: first published as 10.1136/oem
.26.4.265 on 1 October 1969. D
ownloaded from

278 R. Lakowski
YELLOW-BLUEN 124
t 2 4 6 8 101214 1618
GREEN-BLUEN 125
J.N.D.
FIG. 14. Frequency distribution of matching ranges (discrimination) for threeequations plotted against j.n.d. scale.
RED-GREEN COLOUR EQUATION CLASSIFICATION
NORMAL
I.F1 I NO MAL |VARIATIONSRED-GREEN DEVIANTS IN NORMAL
TRICHROMATS
COLOUR WEAK
_ SIMPLE PA AND DA
- - ENLARGED PA AND DA ANOMALOUS- ~~~~~~~~~~~~~TRICHROMATS
I - - EPA AND EDA
INCOMPLETE P AND D.DICHROMATS
_ = = PROTAN AND DEUTAN
-3x +SD. +3x STATISTICAL PARAMETERS
05 1.0 15 ANOMALY QUOTIENTS
FIG. 15. Graphical representation of red-green colour vision classifications yieldedby anomaloscope data (see text for fuller description).
U)ul0
z
ul
z
CL
zu0
z
copyright. on N
ovember 22, 2021 by guest. P
rotected byhttp://oem
.bmj.com
/B
r J Ind Med: first published as 10.1136/oem
.26.4.265 on 1 October 1969. D
ownloaded from
Theory andpractice of colour vision testing: A review. Part 2 279
In addition, deviations in an observer's matchingpoints or the extent of a matching range can now beexpressed in 'just noticeable differences' (j.n.d.) ascalculated from Judd's uniform chromaticity dia-gram (1935). This method ofanalysing anomaloscopedata permits arbitrary deviations to be expressedalong a uniform scale of colour sensation.
Figure 15 represents pictorially the type of infor-mation that can be obtained from anomaloscopedata, showing the limits of the normal variations inMMP, deviant, and colour weak vision, and alsosome examples of congenital defective performances.In it the two central vertical lines represent ± alimits, that is the variation of MMPs for 68-3% ofthe subjects in a normal population. If this isextended to include the outer lines it represents99-74% of the variance or ± 3 x a. The horizontalblack lines cutting across or lying within theseboundaries represent the MR of the specified typesof subjects. In the first two groups classified, thefirst of the normal subjects and the four red andgreen deviants have good discrimination, acceptingonly one mixture ratio setting while the four colourweak subjects accept a greater number of ratios:they simply have large MRs (at least twice themedian value of the MR of the normal trichomats).Deviants differ from the normal subjects in thattheir MMPs are at or outside the limits of 2 x a(not marked in the Figure). The same applies to theMMPs of the simple DA and PA subjects (protan-omalous and deuteranomalous) whose discrimi-nation on the anomaloscope is as good as that ofnormal observers except that their mixture ratiosare well outside the limits of ± 3 x a. On the otherhand, those PA and DA subjects with enlargedMRs have poorer discrimination since they accepta greater number of mixture ratios. Note that whatdistinguishes the anomalous from all other subjectsis that their MMPs are always well outside the limitsof the distributions for normal observers evenwhen one of the end points of their MR cuts acrossthe position of the mean MMP of such observers.Dichromats, however, have MRs that extend throughall the available mixture ratios for the givenequation. Thus they accept all mixture ratios asequivalent to the standard whether theyare theratiostypical of normals, anomalous or any other type ofsubject.Whichever way the results are recorded or
analysed the anomaloscope is an instrument capableof measuring continuous variations in colour vision,and in this sense it is far superior to any of the testsdescribed here. Nevertheless it is a simpler devicethan say Wright's or the Konig-Helmholtz color-imeters, in which more complex mixture ratios canbe chosen, and which have a greater degree ofspectral purity. Because they are optically verycomplex such instruments require a greater degree
of sophistication on the part ofboth the experimenterand the observers, and of course they are moreexpensive and thus inappropriate for routine colourvision testing, although they are excellent researchinstruments.There are a number of anomaloscopes at present
in use, mostly manufactured in the United States.As few are obtainable in this country only twomodels which are easily available are described indetail - the Nagel anomaloscope manufactured bySmith and Haensch of Berlin and the Pickford-Nicolson anomaloscope produced by Rayner ofRayner and Keiller Ltd. of London.
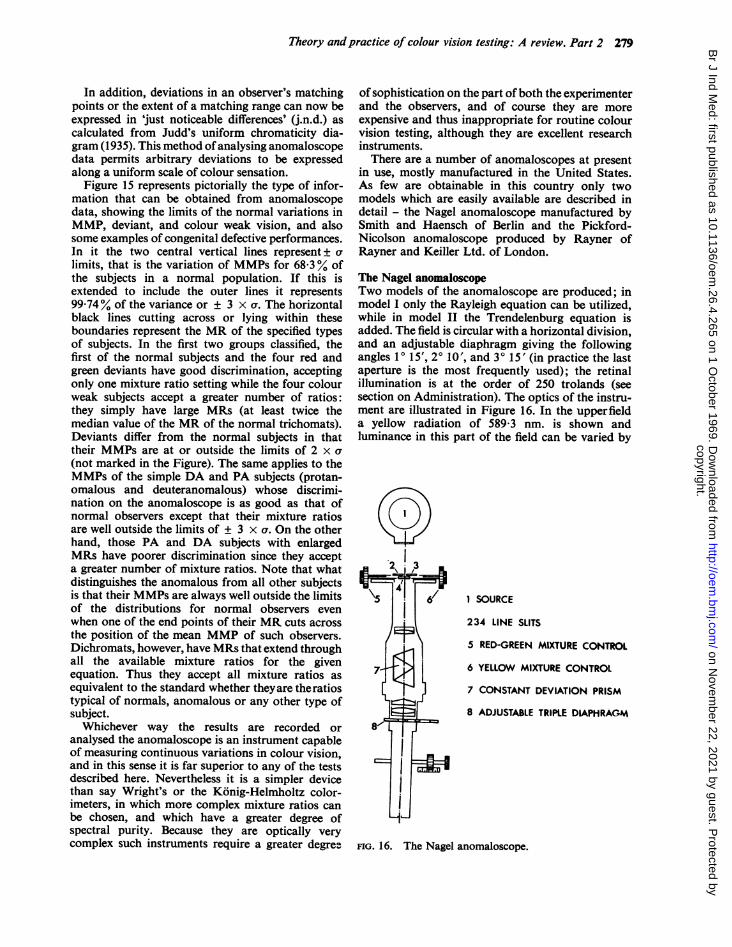
The Nagel anomaloscopeTwo models of the anomaloscope are produced; inmodel I only the Rayleigh equation can be utilized,while in model II the Trendelenburg equation isadded. The field is circular with a horizontal division,and an adjustable diaphragm giving the followingangles 1° 15', 2° 10', and 30 15' (in practice the lastaperture is the most frequently used); the retinalillumination is at the order of 250 trolands (seesection on Administration). The optics of the instru-ment are illustrated in Figure 16. In the upperfielda yellow radiation of 589-3 nm. is shown andluminance in this part of the field can be varied by
2 !\S5| . 6/ 1 SOURCE
234 LINE SLITS
< n 7 S RED-GREEN MIXTURE CONTROL
XI L ~6 YELLOW MIXTURE CONTROL
7 CONSTANT DEVIATION PRISM
8 ADJUSTABLE TRIPLE DIAPHRAGM
FIG. 16. The Nagel anomaloscope.
copyright. on N
ovember 22, 2021 by guest. P
rotected byhttp://oem
.bmj.com
/B
r J Ind Med: first published as 10.1136/oem
.26.4.265 on 1 October 1969. D
ownloaded from

280 R. Lakowski
a control screw. The lower slits give the additivemixtures 670 nm. and 536 nm. In model II indigoand blue-green are matched to blue, that is a 490 nm.standard is matched by 470 nm. and 517 nm. Inthis model tritanopes and anomalous tritanopes can
be detected where the dichromats equalize the indigoand blue-green with the intermediate wavelengthwhile tritanomalous subjects use too much indigofor their match. Again it is possible to calculateanomaly quotients from the positions of the left-handknobs exactly as for the Rayleigh equation. Becausethe subject's modal values vary greatly and becausethe saturation cannot be altered the equation isdifficult to use and recent models of the Nagelanomaloscope have been produced without theTrendelenburg equation.Of course it is important to have the instrument
calibrated from time to time especially when it isfirst used after being out of use for some time, or
after being moved about. This can easily be donewith the help of sources with line spectra.
The Pickford-Nicolson anomaloscope (P-N)From the optical and mechanical point of view thisinstrument is a much simpler device. There are no
lenses, and the mechanical parts are very simple(see Fig. 17). Essentially the colorimetric com-
ponents consist of a set of glass colour filters, thesource and the glass panel at the viewing aperture.In all models of the P-N anomaloscope three colourequations are utilized, and in theory all known colourdefects can be tested on this instrument, not only intheir dichromatic form but also at the anomalousstage. (See Fig. 12 showing loci for the equationboth for P-N and the Nagel anomaloscopes.)
Current models utilize Chance-Pilkington glassfilters to make up the primaries of the colourmixtures. Colorimetric measurements of these at theviewing aperture of the anomaloscope show thatthey are desaturated in relation to the values givenby the makers for filters alone. Table 4 shows theC.I.E. coordinates and dominant wavelength (AD)as calculated from the position of illuminant A.The retinal illumination at modal match settings for
5
1 SOURCE 2 FILTERS 3 SHUTTERS
4 INTEGRATING CHAMBERS 5 ADJUSTABLE VIEWING APERTURE
FIG. 17. The P-N anomaloscope.
the three equations is around 70 and 80 trolands,and so is within the photopic range of adaptation.The viewing aperture can be varied from 40 minutesto 31' and viewing is done at one metre. Othersubtense may be utilized, but the one mostfrequently used is the 11' measuring purely fovealvision.
ValidationBoth anomaloscopes have proved to be validmeasures of defective colour vision, and Willis andFarnsworth (1952) found the Nagel to be the mostefficient of the five that they studied, that is theNagel, Hecht-Shlaer, Bausch and Lomb, DoubleDichroic Polaroid, and the Colour TemperatureMeter Anomaloscopes. Green (1962) found com-
plete agreement in classifying 21 red-green defectivesbetween the Pickford-Nicolson and the Nagel
TABLE 4C.1.E. COORDINATES AND AD (nm.) FOR THE PRIMARIES OF TH THREE COLOUR EQUATIONS
(P-N ANOMALOSCOPE); MEASUREMENT BY VISUAL COLORIMETRY, ILLUMINANT A
C.L.E. coordinates
Colour mixtures Primary I Primary 2 Standard
x y AD X Y | AD X Y | ADRed + green = yellow .. .. .. 0-672 0 309 628&5 0-384 0 550 555 0 0-511 0*446 584-3Yellow + blue = neutral .. .. .. 0-516 0-458 583 5 0-195 0*152 472-8 0 474 0-412 593*0Green + blue =blue/green .. .. .. 0379 0548 5525 0172 0*131 473-3 0-302 0400 493-5
copyright. on N
ovember 22, 2021 by guest. P
rotected byhttp://oem
.bmj.com
/B
r J Ind Med: first published as 10.1136/oem
.26.4.265 on 1 October 1969. D
ownloaded from

Theory and practice of colour vision testing: A review. Part 2 281
anomaloscopes. In their original paper on the pilotmodel, Pickford and Lakowski (1960) state that thediagnosis obtained on the new model correspondedclosely to results obtained on the older type ofPickford anomaloscope. Lakowski (1968d) alsoquotes a close correspondence between the anom-aloscope findings and wavelength discriminationdata obtained from the Konig-Helmholtz colourmixer; those subjects who had the best matches onthe anomaloscope also had the best discriminationon the colour mixer and resembled those quoted byWright (1946). The progressively poorer dis-crimination of some normal trichromats, typifiedby their enlarged matching ranges, was reflected inincreased A A at maxima of discrimination, that is,at blue, green, and red. There is also a close cor-respondence in their diagnosis of anomaloustrichromats. When results were compared with thosefor the 100-Hue test, there was a similar cor-respondence between these diagnosed dichromatsand the confusion axes. Other correlations betweenthe performances of normal trichromats on theP-N and those on conventional colour vision testshave been described elsewhere by Lakowski (1965a,1968d).Norms for the P-N anomaloscopes have been
established by Pickford and Lakowski (1960) andfor the age variable by Lakowski (1968d) which inmany respects are similar to those obtained from alarger sample tested on the older anomaloscope(Pickford, 1957; Lakowski, 1958, 1962). Norms forthe Nagel are found in the works of Nelson (1938),Wright (1946), Rushton and Baker (1964), and forthe age variable in the works of Obi (1954) andBoles-Carenini (1954).Lakowski (1968d) states that quotients or mid-
matching points are stable, showing no age variationsaround the most frequent ratio except among theyoung (particularly those under 15), where shifts inthe red-green ratios, statistically significant at the0.01 level, are obtained in relation to other popu-lations. Boles-Carenini (1954), however, found thatthe means of the Rayleigh equations are displacedtowards the green end in aged subjects. Lakowski(1962) also states that the magnitude of the standarddeviations in the very young and in the older subjectsis greater than is found in the 20-30 age group. Asfar as matching ranges (discrimination) are con-cerned, the red-green equation is the least affectedby age deterioration, remaining stable until we cometo the 55s and over, when the incidence of those withpoor discrimination increases to 30%. On the otherhand, matching ranges for yellow-blue and green-blue begin to increase as early as 30 years of age,where the percentage of subjects with poorer dis-crimination at, say, the age of 40 is already 30%higher than in the younger subjects, and reaches ashigh as 80% among the very old. Figure 18 gives
JN.D.I6I
/AT BLUE GREEN5 ~~~~~~XD493nmA ~~~~~~~~~~(Green-Blue)
3 - TYELLCOWXD 584nm(Red-Green).
15 20 25 35 45 55AGE (yrs.)
FIG. 18. Effect of age on discrimination (in j.n.d.s) -from a study using the P-N anomaloscope. Standardsare indicated for each equation.
the mean matching ranges in j.n.d.s for threeequations for the P-N anomaloscope for an agespan from 15 to 55 years.Of all the tests discussed here, the anomaloscopes
are the most difficult to use, and training is necessaryif they are to be used validly and efficiently. Onlythose who are seriously considering working in thefield of colour vision should embark on using them.However, provided such skills are obtained, theanomaloscope has advantages which far outweighany inconveniences in training. Colour vision,including the defects found among dichromats,anomalous trichromats, and the minor variations ofnormal subjects, can all be tested on a continuousscale. In addition, in anomaloscopes such as theP-N, red-green and yellow-blue defects and dis-crimination can be tested validly, and because avariable brightness adjustment is included for thestandard yellow in both the Nagel and P-Nanomaloscopes the classification of deutan andprotan defects is categorical.
Special tests of colour aptitudeThe requirements of industry, transport, and theprofessions have yet to be adequately stated, thoughin certain branches specific testing procedures andrequirements for 'proper' colour efficiency are laiddown. For example, the Giles-Archer and theEdridge-Green lanterns (Giles, 1960), are used forselecting air and naval personnel and for testing theability to recognize small colour signals at long
copyright. on N
ovember 22, 2021 by guest. P
rotected byhttp://oem
.bmj.com
/B
r J Ind Med: first published as 10.1136/oem
.26.4.265 on 1 October 1969. D
ownloaded from
282 R. Lakowski
distances. In some occupations, it is especiallyimportant that no dichromats, particularly of thered-green type, should be admitted. However, thereare a vast number of occupations where this type ofexclusion would not be adequate for selectingpersonnel, for, in industry especially, it seems moreimportant to discover whether a man is fitted for aparticular job than to classify him as either normalor colour defective. What is necessary in mostsituations is to establish whether he has the requiredskill to deal with a particular colour task. Such 'jobanalyses' have not yet been fully established,although the need for them has been stressed bywriters such as Riddell et al. (1949), Colour Group(1946), Pickford (1955), Cavanagh (1955), Sloan andAltman (1951), and Lakowski (1968b).
Recently a number of tests have appeared whichclaim to test specific colour abilities such as colouraptitude and colour memory. Though they weredesigned only between 10 and 20 years ago thesetests are becoming more widely accepted and theirusefulness is now appreciated.
Burnham-Clark-Munsell colour memory test(B.C.M.T.)To fill an important gap in an already existingbattery of tests, Burnham and Clark (1955) devisedtheir memory test, because they claimed that(apart from closely juxtaposed colour matches insmall fields) all comparisons involved an element ofmemory. When a colour inspector compares a coloursample in one place with a colour standard elsewhere,he has to be able to recall his impression of thesample for some time if he is to compare it with thestandard. The artist needs to remember the coloursof the landscape while he paints, and the housewifefrequently has to remember the colour of the wallswhen buying curtain material.The B.C.M.T. is administered under standardized
lighting conditions outlined elsewhere, and consistsof a wheel on which the test chips or caps and thecomparison chips are mounted. All this material isenclosed in a carrying case, the top surface of whichserves as the immediate visual surround. Comparisonchips consist of 43 of the odd number of hues of theMunsell series (as used in the 100-Hue test).Duplicates of 20 of these hues are used as test chipsand duplicates of a further two hues are used aspractice chips, all of which are mounted on twoconcentric circles on a freely rotating wheel.The subject is presented with one surface hue for
5 seconds and after an interval of 5 seconds he isrequired to select from the range of hue chips onewhich resembles the first hue shown. This is repeatedfor as many as 20 of the hue chips and the subject isscored on his accuracy of memory choice. The testtakes 15 to 20 minutes to administer individually.Scores obtained from a large population are normally
y 29 - °0-4- 000 0 $:
GREEN 41* 00
N 0O~~~3 *0 0* 830-3- 0 *0 *-PINK
BLUE
Oe3 4 0 O-5
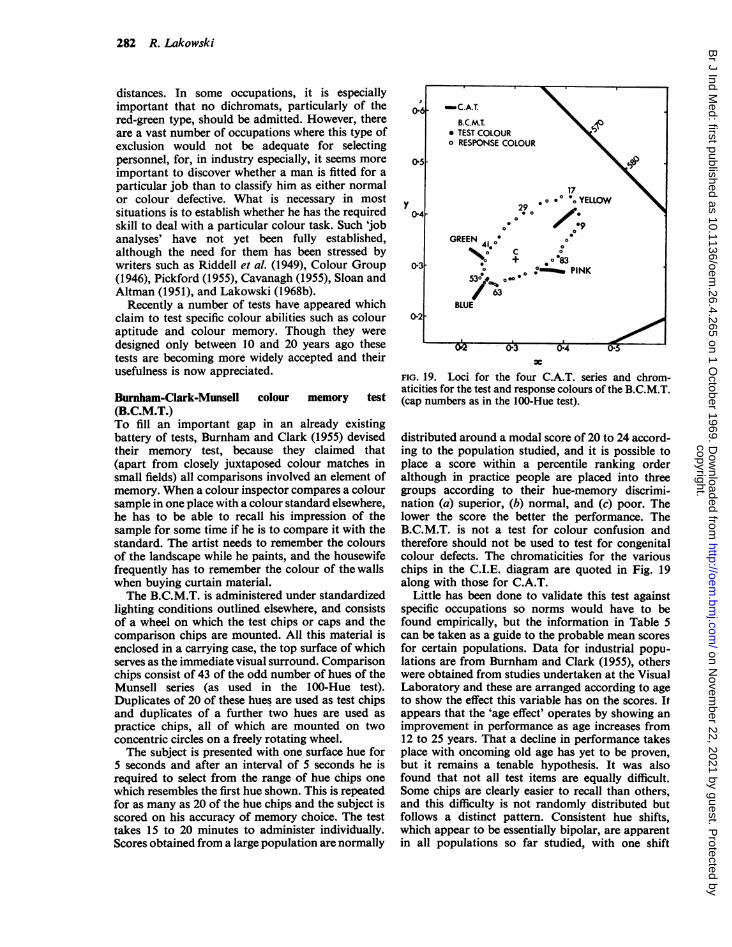
FIG. 19. Loci for the four C.A.T. series and chrom-aticities for the test and response colours of the B.C.M.T.(cap numbers as in the 100-Hue test).
distributed around a modal score of 20 to 24 accord-ing to the population studied, and it is possible toplace a score within a percentile ranking orderalthough in practice people are placed into threegroups according to their hue-memory discrimi-nation (a) superior, (b) normal, and (c) poor. Thelower the score the better the performance. TheB.C.M.T. is not a test for colour confusion andtherefore should not be used to test for congenitalcolour defects. The chromaticities for the variouschips in the C.I.E. diagram are quoted in Fig. 19along with those for C.A.T.
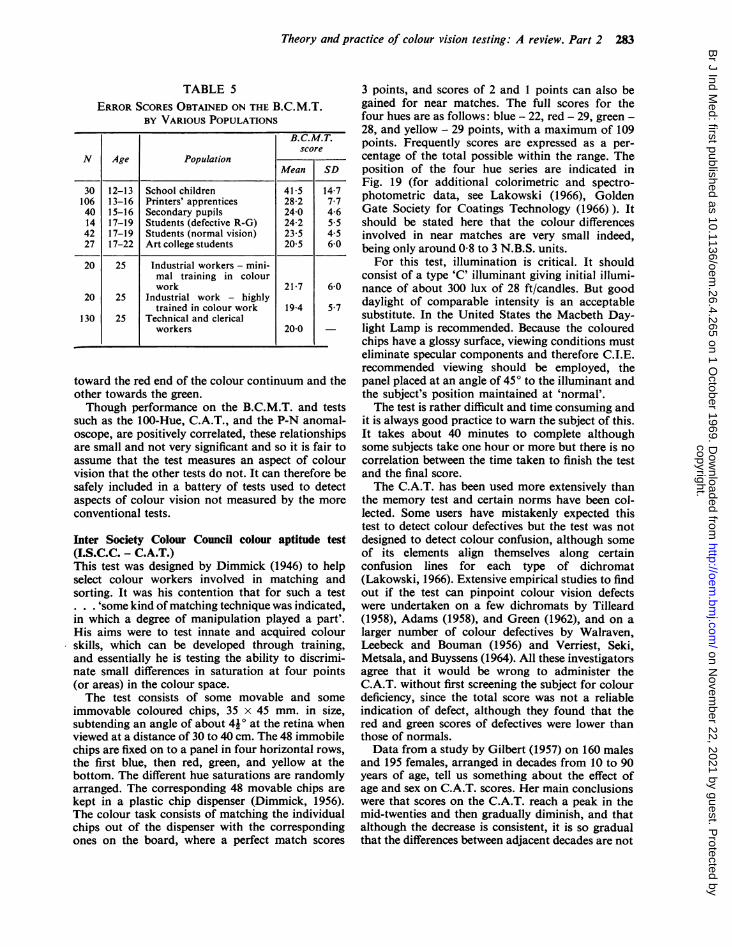
Little has been done to validate this test againstspecific occupations so norms would have to befound empirically, but the information in Table 5can be taken as a guide to the probable mean scoresfor certain populations. Data for industrial popu-lations are from Burnham and Clark (1955), otherswere obtained from studies undertaken at the VisualLaboratory and these are arranged according to ageto show the effect this variable has on the scores. Itappears that the 'age effect' operates by showing animprovement in performance as age increases from12 to 25 years. That a decline in performance takesplace with oncoming old age has yet to be proven,but it remains a tenable hypothesis. It was alsofound that not all test items are equally difficult.Some chips are clearly easier to recall than others,and this difficulty is not randomly distributed butfollows a distinct pattern. Consistent hue shifts,which appear to be essentially bipolar, are apparentin all populations so far studied, with one shift
copyright. on N
ovember 22, 2021 by guest. P
rotected byhttp://oem
.bmj.com
/B
r J Ind Med: first published as 10.1136/oem
.26.4.265 on 1 October 1969. D
ownloaded from
Theory and practice of colour vision testing: A review. Part 2 283
TABLE 5ERROR SCORES OBTAINED ON THE B.C.M.T.
BY VARIOUS POPULATIONSB.C.M.T.
scoreN Age Population
Mean SD
30 12-13 School children 41-5 14-7106 13-16 Printers' apprentices 28-2 7-740 15-16 Secondary pupils 24-0 4-614 17-19 Students (defective R-G) 24-2 5-542 17-19 Students (normal vision) 23-5 4-527 17-22 Art college students 20-5 6-0
20 25 Industrial workers - mini-mal training in colourwork 21-7 6-0
20 25 Industrial work - highlytrained in colour work 19-4 5 7
130 25 Technical and clericalworkers 20 0 -
toward the red end of the colour continuum and theother towards the green.Though performance on the B.C.M.T. and tests
such as the 100-Hue, C.A.T., and the P-N anomal-oscope, are positively correlated, these relationshipsare small and not very significant and so it is fair toassume that the test measures an aspect of colourvision that the other tests do not. It can therefore besafely included in a battery of tests used to detectaspects of colour vision not measured by the moreconventional tests.
Inter Society Colour Council colour aptitude test(I.S.C.C. - C.A.T.)This test was designed by Dimmick (1946) to helpselect colour workers involved in matching andsorting. It was his contention that for such a test
. . 'some kind ofmatching technique was indicated,in which a degree of manipulation played a part'.His aims were to test innate and acquired colourskills, which can be developed through training,and essentially he is testing the ability to discrimi-nate small differences in saturation at four points(or areas) in the colour space.The test consists of some movable and some
immovable coloured chips, 35 x 45 mm. in size,subtending an angle of about 4j0 at the retina whenviewed at a distance of 30 to 40 cm. The 48 immobilechips are fixed on to a panel in four horizontal rows,the first blue, then red, green, and yellow at thebottom. The different hue saturations are randomlyarranged. The corresponding 48 movable chips arekept in a plastic chip dispenser (Dimmick, 1956).The colour task consists of matching the individualchips out of the dispenser with the correspondingones on the board, where a perfect match scores
3 points, and scores of 2 and 1 points can also begained for near matches. The full scores for thefour hues are as follows: blue - 22, red - 29, green -28, and yellow - 29 points, with a maximum of 109points. Frequently scores are expressed as a per-centage of the total possible within the range. Theposition of the four hue series are indicated inFig. 19 (for additional colorimetric and spectro-photometric data, see Lakowski (1966), GoldenGate Society for Coatings Technology (1966) ). Itshould be stated here that the colour differencesinvolved in near matches are very small indeed,being only around 08 to 3 N.B.S. units.For this test, illumination is critical. It should
consist of a type 'C' illuminant giving initial illumi-nance of about 300 lux of 28 ft/candles. But gooddaylight of comparable intensity is an acceptablesubstitute. In the United States the Macbeth Day-light Lamp is recommended. Because the colouredchips have a glossy surface, viewing conditions musteliminate specular components and therefore C.I.E.recommended viewing should be employed, thepanel placed at an angle of 450 to the illuminant andthe subject's position maintained at 'normal'.The test is rather difficult and time consuming and
it is always good practice to warn the subject of this.It takes about 40 minutes to complete althoughsome subjects take one hour or more but there is nocorrelation between the time taken to finish the testand the final score.The C.A.T. has been used more extensively than
the memory test and certain norms have been col-lected. Some users have mistakenly expected thistest to detect colour defectives but the test was notdesigned to detect colour confusion, although someof its elements align themselves along certainconfusion lines for each type of dichromat(Lakowski, 1966). Extensive empirical studies to findout if the test can pinpoint colour vision defectswere undertaken on a few dichromats by Tilleard(1958), Adams (1958), and Green (1962), and on alarger number of colour defectives by Walraven,Leebeck and Bouman (1956) and Verriest, Seki,Metsala, and Buyssens (1964). All these investigatorsagree that it would be wrong to administer theC.A.T. without first screening the subject for colourdeficiency, since the total score was not a reliableindication of defect, although they found that thered and green scores of defectives were lower thanthose of normals.Data from a study by Gilbert (1957) on 160 males
and 195 females, arranged in decades from 10 to 90years of age, tell us something about the effect ofage and sex on C.A.T. scores. Her main conclusionswere that scores on the C.A.T. reach a peak in themid-twenties and then gradually diminish, and thatalthough the decrease is consistent, it is so gradualthat the differences between adjacent decades are not
copyright. on N
ovember 22, 2021 by guest. P
rotected byhttp://oem
.bmj.com
/B
r J Ind Med: first published as 10.1136/oem
.26.4.265 on 1 October 1969. D
ownloaded from

284 R. Lakowski
TABLE 6MEAN SCORES OBTAINED ON THE C.A.T., BY VARIOUS POPULATIONS
N Mean score Age and type of subject Investigator
106 51.1 13-16, printers' apprentices Lakowski (1969)355 53 6 Age study, 10-90 years, no colour experience Gilbert (1957)25 59-1 16-52, average 28 years, colour workers Lakowski (1968c)48 59 2 Adult (?) untrained subjects Walraven et al. (1956)112 60-9 14-53, average 28 years, random population Verriest et al. (1964)147 66 16-60 years, students of architecture and colour workers Little (1967)200 70 Adult colour workers Adams (1958)200 70 Adult (?) varied Dimmick (1954)698 70 Adult (?) concerned with colour problems Dimmick (1956)210 72-7 Adult colour trained Tilleard (1958)
significant. At all ages in this population discrim-ination was better in yellow and red than in greenand blue. Females had higher total scores, but thiswas not true for all colours or for all age decades.
Several studies of colour normals were madeusing the C.A.T., and mean scores were found tovary from 53 to 72, a rather large scatter. This maybe attributable to small colorimetric differenceswhich possibly exist between individual sets of theC.A.T. A more probable cause is that the test wasnot administered under identical lighting conditionsnor in an identical manner. Table 6 shows the resultsof a number of investigations giving mean scores,size of sample, age, and a brief description of thetype of subject used.The validity of the C.A.T. for testing for specific
occupations is not yet known and still has to beestablished empirically, but correlations betweenthe scores obtained on this test and on the B.C.M.T.,100-Hue, and P-N anomaloscope indicate that thereis no relationship between C.A.T. results and theothers, and therefore it can again be assumed, as inthe case of the colour memory, that this test measuressome ability that the others do not. A four-pointclassification of total individual scores can be usedand two such have been suggested by Dimmick(1954) and by Hess (1957).The C.A.T. test is used extensively for selecting
colour workers in the U.S.A., and it has recentlybeen suggested (I.S.C.C. Newsletter No. 173) that if
TABLE 7FOUR-PART CLASSIFICATION OF SCORES FOR C.A.T.
Four-point scaleInvestigator
1 2 3 4
Dimmick 85-95 75-85 65-75 55-65Excellent Good Satisfactory Doubtful
Hess 84-109 72-83 49-71 0-48
selection is made on the basis of C.A.T. scores, onlythose with a score of 75 or over should be chosen tobecome colour matchers.
DiscussionNo direction has yet been given on what tests to use.This was deliberate. The reader was presented withthe relevant facts - how each test was designed, howit detects defects, and why it is able to measureindividual differences in colour discrimination. It waspointed out that the tests are not perfect; that it issometimes difficult to achieve what is expected; andthat this may depend on variables not involvingcolour. It is hoped that those already using suchtests will understand them a little better, that theirresults will be more reliable, and that they willeliminate any wrong inferences thay may havehabitually been making. Newcomers should findtheir work made easier. As far as the actual choice oftests is concerned there is obviously no perfectselection. For example, it might be thought best touse the most sophisticated tests (those which measurea variety of colour attributes) but high costs, lengthof testing time, and the skill required in applyingthem all might prevent them from being chosen.The following discussion is intended to clarify thefactors involved in such a choice.
Colour vision requirementsThis requires careful analysis, and the habit oflooking upon colour vision problems as simple andrequiring little attention should be deplored. A kindofjob analysis is always called for, and where this isnot readily available an attempt should be madefrom a common sense point of view. First, it shouldbe decided whether to eliminate only those withmajor defects or whether those with the best dis-crimination are wanted. This distinction is importantas the exclusion of dichromats does not ensure thatthose with good colour discrimination will beselected. It might be that after more careful con-
copyright. on N
ovember 22, 2021 by guest. P
rotected byhttp://oem
.bmj.com
/B
r J Ind Med: first published as 10.1136/oem
.26.4.265 on 1 October 1969. D
ownloaded from

Theory and practice of colour vision testing: A review. Part 2 285
sideration it will become obvious that not alldefectives need be excluded, or alternatively that it isunnecessary to select only the best for the task.There are professions and skills in which it isapparently an advantage to have good discriminationalthough it is a mistake to think that a defect wouldbe an insurmountable handicap. Take, for example,professions like architecture, metallurgy, and crystal-lography, or the biological sciences, where stainingtechniques are used, and analytical chemistry inwhich titrations are involved. In cases like these,colour vision defects, especially dichromatismn, area handicap since subjects who are unaware of theirdefects can be blamed for lack of attention, stupidityor ignorance if they mistake one colour for another.It would probably be unfair to eliminate colourdefectives from such occupations, but it is alwaysgood practice to let people know what type ofdiscrimination they have in order to prevent suchunpleasant occurrences, and where the eye is to beused as a sort of 'null instrument' they must eitherask others to help, pay particular attention to thetask, or try to reduce as far as possible the depen-dence on colour clues for solutions.Of course there are situations where only those
with the best discrimination are wanted and wherethis is so we must make absolutely certain that onlythose with such ability are selected.
Available testsEven when colour vision requirements are knownwe still have to consider what tests are available andthe amount of money and time at our disposal.Perhaps it should be stressed that a prevalentattitude, which assumes that any test will do andthat the cheaper it is and the less time it takes thebetter, is not conducive to an adequate analysis ofcolour vision. This is clearly the wrong approach.Of course if we only wish to eliminate red-greendichromats then pseudo-isochromatic plates costingabout £6 and administered in a few minutes aresufficient, though it should be realized that some ofthose who are outright failures on these tests willhave only minor defects. In order to avoid this,greater expenditure is needed and longer time mustbe allowed for administration. We must also con-sider whether the tester possesses or is willing toacquire the skills which would enable him toadminister the more complicated tests validly.Again it is the experience of the writer that mostofthose involved in colour vision assessment look onit as a sort of Cinderella that needs scant attentionand no skill whatsoever. It must be stressed that thisis not so; that if procedure is standardized and a fewtechniques learned much more will be achieved thanthe mere knowledge of whether the person is colourdefective or not. Such competence gives a degree ofcertainty that would not have been possible before.
Thus tests of hue discrimination or colour aptitudeand the anomaloscopes in particular should not beadministered by first reading the manual. It is thepractice at the Visual Laboratory when trainingpeople to administer these tests that a number ofsubjects, usually at least 20, must be tested in avariety of tests before the experimenter is regardedas having some competence in handling the material.If this skill is not acquired, two things can happen.On the one hand, the tester will be clumsy andawkward in dealing with his subjects, many ofwhomwill be very sensitive about being found to bedefective. On the other hand, if the more advancedtests are used, it will be found that wrong orinadequate information will be obtained as a resultof the test situation being made too easy or toodifficult. Since the results of such administration willnot be comparable with the norms obtained byothers, it is strongly advised that every examinershould spend some time acquiring the techniques ofadministration until he acquires some finesse.
Actual testing procedureLet us begin by saying that the four PIC tests dis-cussed in this paper are capable of detecting red-green dichromats and if administered in northernday-light they will be the cheapest and easiestmethod of testing. If, on the other hand, an artificialstandard illuminant 'C' is to be used then anadditional £20 to £40 will have to be expended. Ifwe must also eliminate the anomalous, those withtritan defects, or those with possible acquireddefects, then the simple PIC tests would not beadequate. In cases where anomalous trichromatshave to be detected the use of hue discriminationor the specialized tests would add nothing to ourdiagnosis as they are not sufficiently sensitive. Ananomaloscope which can distinguish between thevarious types and degrees of defect would berequired. This immediately poses problems - one ofcost since the two anomaloscopes described herewould be priced between £150 and £350, and anotherof skill since the tester must have this and mustbe prepared to spend a certain time, say a few weeks,acquiring it.When selecting people with good discrimination
two things have to be considered. We have alreadyseen that specialized tests cannot distinguish properlybetween congenital colour defectives and those withnone, so we must first establish that in the popu-lation to be tested for specific abilities all suchdefectives have been eliminated by other means.For this we would require a pseudo-isochromatictest to begin with, followed by the specialized testsof colour discrimination, colour memory or aptitude,and we would have to know exactly what colourability we were looking for. That this is an importantproblem can be seen from a recent study by
copyright. on N
ovember 22, 2021 by guest. P
rotected byhttp://oem
.bmj.com
/B
r J Ind Med: first published as 10.1136/oem
.26.4.265 on 1 October 1969. D
ownloaded from

286 R. Lakowski
Lakowski (1969) where the effect of psychologicalvariables and the inter-correlation between colourvision tests was assessed for normal trichromats.It was found from the results of factor analysis thateach test was measuring attributes specific to itselfand from this it is inferred that no one test can beregarded as a substitute for another. Let us enlargeon this. In the first place, as far as the psychologicalfactors of personality and intelligence are concerned,though there was a significant relationship betweensome colour vision tests and cognitive variables andothers with personality variables, it was found thatactual variance for a given colour test was producedby something specific to that test and that variancedue to other factors was small, accounting for about4-16% of the total. For example, in the 100-Huetest, 84% of the variance was produced by somethingspecific to this test, and the remainder, that is 16%,was made up of different factors; 7j% was accountedfor by what this test has in common with other colourvision tests while 41% and 4% respectively wereexplained by what it has in common with cognitiveand personality factors. It was also shown thatvariance for cognitive and personality factors isabout equal for the 100-Hue and the B.C.M.T. testwhile the cognitive loading is much smaller for theC.A.T. and the P-N anomaloscope which, in turn,are more loaded on personality aspects. However,from the study it is obvious that these extraneousvariances are relatively insignificant compared withthe total for each test. This is quite an importantfinding as far as our problem is concerned for if wewant to select people with the best possible abilitywe have to know exactly which ability we areinterested in and so we come back to the importanceofjob analysis. Remembering that each test measuresa specific ability we have to be clear in our mindswhat we want from our colour worker or colourmatcher. If the main element in the task is a goodmemory for colours, then obviously the B.C.M.T.test is the one required. If, on the other hand, thetask involves the perception of small brightness orsaturation differences, for example as found withmachine-press operators, then the test we want toapply is the C.A.T.; and, lastly, where a premium isput on hue discrimination and where small differ-ences must be distinguished, then the 100-Hue testshould be employed.We have seen that anomaloscopes detect colour
confusion and can measure discrimination in certainparts of the colour space, but we should alsoremember that this test is most suited wheremetamerism plays an important role. Thus theinstrument can be used as an overall test of colourvision and colour discrimination where the infor-mation obtained will be most relevant to colourmixing and to matching of metameric pairs as foundin the textile and printing industries.
Perhaps the effect of ageing and acquired dys-chromatopsias should again be emphasized sincethis calls for re-testing at certain ages. For example,a man of 40 might be rather old to be made aforeman in a colour or dyestuff workshop and if heis chosen then he should be re-tested at shortintervals, say, of about five years. It should also beremembered that if industrial workers either have orhad any eye diseases or have complications such asdiabetes or arthritis there is a possibility that theirdiscrimination has deteriorated. It must be stressedthat pseudo-isochromatic tests are both inadequateand inappropriate for detecting such changes andtherefore the emphasis is again on colour dis-crimination tests or anomaloscopes.
Battery of testsIt will be plain by now that the ideal is to have a setof colour vision tests so that each situation can bemet. The question of cost must be borne in mind.If it is only necessary to exclude major defectivesand then keep the cost as low as possible, it isperhaps advisable to use two sets of pseudo-isochromatic plates - one of the modern types suchas the T.M.C. or AO H-R-R and the other fromamong the Ishihara or Dvorine tests, or the Stillingtables. A more sophisticated and useful combinationwould be one pseudo-isochromatic test plus a colourdiscrimination test like the 100-Hue. Here, with alittle skill, all variations in colour vision could bedetected for although it has been said that from100-Hue results alone we will have no indication ofsimple anomalous vision, yet, used in conjunctionwith the plates, it will be found that with a littlepractice a fairly certain diagnosis can be made. Thethird combination would, of course, involve veryspecialized tests and it should be remembered thateven here we would still have to administer a pseudo-isochromatic or other test for screening purposes.It would therefore be necessary to have that testplus any of the specific ones already mentioned. Inlarge establishments which undertake testing fordifferent industries or occupations or where anindustrial consultant is employed, the ideal solutionwould be to have a battery of tests which include ananomaloscope as well as a colour discriminationtest and some PIC tests. But, of course, in the lastanalysis all these tests will only be as effective as theastuteness of the user can make them. Though paperslike this are helpful, there is no substitute for practice.
I wish to thank Miss C. Liston for secretarial assistanceand Mr. J. Rae for preparing the diagrams.
References
Adams, J. M. (1958). Some results obtained with the I.S.C.C. colouraptitude test. J. Oil Col. Chemn. Ass., 41, 807-813.
copyright. on N
ovember 22, 2021 by guest. P
rotected byhttp://oem
.bmj.com
/B
r J Ind Med: first published as 10.1136/oem
.26.4.265 on 1 October 1969. D
ownloaded from
Theory and practice of colour vision testing: A review. Part 2 287
Belcher, S. J., Greenshields, K. W., and Wright, W. D. (1958).Colour vision survey using the Ishihara, Dvorine, Bostrom andKugelberg, Bostrom, and American-Optical Hardy-Rand-Rittlertests. Brit. J. Ophthal., 42, 355-359.
Boles-Carenini, B. (1954). Del comportamento del senso cromaticoin relazione all'eta. Ann. Ottal., 80, 451 458.
Brown, P. K., and Wald, G. (1964). Visual pigments in single rods andcones of the human retina. Science, 144, 45-52.
Burnham, R. W., and Clark, J. R. (1955). A test of hue memory.J. appl. Psychol., 39, 164-172.
-, Janes, R. M., and Bartleson, C. J. (1963). Color - A Guide toBasic Facts and Concepts. Wiley, New York.
Cavanagh, P. (1955). The Ishihara test and defects of colour vision.Occup. Psychol., 29, 43-57.
Colour Group (1946). Report on Defective Colour Vision. PhysicalSociety, London.
Cox, J. (1961a). Colour vision defects acquired in diseases of the eye.Brit. J. physiol. Opt., 17, 195-216; 18, 3-32; and 18, 67-84.
(1961b). Unilateral color deficiency, congenital and acquired.J. opt. Soc. Amer., 51, 992-999.
Crawford, B. H., Ed. (1968). Techniques of Photostimulation in Biology.North Holland Publ. Co.
De Valois, R. L. (1960). Color vision mechanisms in the monkey.J. gen. Physiol., 43, July Suppl. pp. 115-128.
, Jacobs, G. H., and Jones, A. E. (1963). Responses of single cellsin primate red-green color vision system. Optik (Stuttgart), 20,87-98.
Dimmick, F. L. (1946). Color Aptitude Test. J. appl. Psychol., 30,no. 1, pp. 10-22.
(1954). Factors in the application of the Colour Aptitude Test.Off. Digest., pp. 1265-1270.
-(1956). Specifications and calibration of the 1953 edition of theInter-Society Colour Council Aptitude Test. J. opt. Soc. Amer., 46,389-393.
Farnsworth, D. (1943). The Farnsworth-Munsell 100-hue anddichotomous test for color vision. Ibid., 33, 568-578.(1955). Methodological requirements in the study of normal and
defective color vision. In Recent Developments in Color. (Proc.14th int. Congr. Psychol., Montreal 1954). Acta Psychol., 11,223.
(1957). The Farnsworth-Mansell 100-Hue Test Manual. MunsellColor Co., Baltimore, Maryland, U.S.A.
Francois, J., and Verriest, G. (1957). Les dyschromatopsies acquises.Ann. Oculist. (Paris), 190, 713-746, 812-859, and 893-943.
(1961). On acquired deficiency of colour vision. VisionRes., 1, 201-219.
Galifret, Y., Ed. (1960). Mechanisms of Colour Discrimination.Pergamon Press, Oxford.
Gilbert, J. G. (1957). Age changes and color matching. J. Geront.,12, 210-215.
Giles, G. H. (1960). The Principles and Practice of Refraction.Hammond, Hammond, London.
Golden Gate Society for Coatings Technology (1966). Color Instru-ments take the visual Color Aptitude Test. J. Paint Technology,38, 564-574.
Graham, C. H., Ed. (1965). Vision and Visual Perception. Wiley,New York.
Granit, R, (1947). Senrsory Mechanisms of the Retina. Oxford Uni-versity Press, London.
-(1955). Receptors and Sensory Perception. Yale University Press,New Haven, Conn.
Green, M. (1962). Results of testing a group of colour defectivesubjects with several tests of colour vision and colour aptitude.Farbe, 11, 87-92.
Grossman, S. P. (1967). A Textbook of Physiological Psychology.Wiley, New York.
Grutzner, P. (1962). Erworbene Farbensinnstorungen bei Netzhaut-degenerationen. Farbe, 11, 35-44.
Guild, J. (1925-26). A trichromatic colorimeter suitable for standard-ization work. Trans. opt. Soc. (London), 27, 106-129.
-(1931). The colorimetric properties of the spectrum. Phil. Trans.roy. Soc. (London) A, 230, 149-187.
Hardy, L. H., Rand, G., and Rittler, M. C. (1945). Tests for thedetection and analysis of color blindness. I. The Ishihara test: anevaluation. J. opt. Soc. Amer., 35, 268-275.
Helmholtz, H. von (1892). Versuch das psychophysische Gesetz aufdie Farbenunterschiede trichromatischer Augen anzuwenden.Z. Psychol. Physiol. Sinnesorg., 3, 1-20.
Hering, E. (1878). Zur Lehre vom Lichtsinne. Gerolds, Vienna.Hering, E. (1920). Grundzuge der Lehre vom Lichtsinn. Julius Springer,
Berlin.Hess, M. (1957). Personal experience with theI.S.C.C. colour aptitude
test. J. Oil Col. Chem. Assoc., 40, 136-142.
Hurvich, L. M., and Jameson, D. (1955). Some quantitative aspects ofan opponent-colors theory, II. Brightness, saturation and hue innormal and dichromatic vision. J. opt. Soc. Amer., 46, 602-616.
, (1960). Color vision. In Ann. Rev. Psychol., 11, 99-130.Inter Society Color Council. News letter No. 173.Jaeger, W. (1956). Defective colour-vision caused by eye disease.
Trans. ophthal. Soc. U.K., 76, 477-489.Judd, D. B. (1935). A Maxwell triangle yielding uniform chromaticity
scales. J. opt. Soc. Amer., 25, 24-35.(1944). Standard response functions for protanopic and
deuteranopic vision. J. Res. nat. Bur. Standards, 33, 407; RP 1618.(1949). Current views on colour blindness. Docam. Ophthal.
(den Haag), 3, 251-288.(1958). Basic correlates of the visual stimulus. In Handbook of
Experimental Psychology, S. S. Stevens (Ed.), pp. 811-867. Wiley,New York.
(1961). Blue-glass filters to approximate the blackbody at6500°K. Farbe, 10, 31-36.
--, (1966), Fundamental studies of color vision from 1860 to 1960.Proc. Nat Acad. Sci. (Wash.), 50, 1313-1330.
-, and Wyszecki, G. (1963). Colour in Business, Science andIndustry, 2nd ed. Wiley, New York.
Kalmus, H. (1955). The familial distribution of congenital tritanopia.Ann. Hum. Genetics, 20, 39-56.
(1965). Diagnosis and Genetics of Defective Colour Vision.Permagon Press, Oxford and London.
Kherumian, R., and Pickford, R. W. (1959). Heredite' et Fre'quencedes Anomalies Congdnitales du Sens Chromatique. Vigot Freres,Paris.
Kinnear, P. R. (1965). The colour discrimination of diabetics.Unpublished M.Sc. thesis, Edinburgh University.
Kries, J. von. (1905). Die Gesichtsempfindungen. In Handbuch derPhysiologic des Menschen, ed. Nagel, W., Vol. 3, 109-281, Vieweg,Braunschweig.- (1924). In Treatise on Physiological Optics. H. L. F. von
Helmholtz. (J.P.C. Southall trans.). Optical Society of America,Rochester, New York State.
Koellner, H. (1912). Die Storungen des Farbensinnes. Ihre klinischeBedeutung and ihre Diagnose. Karger, Berlin.
Konig, A. (1903). Gesammelte Abhandlungen. Barth, Leipzig.Lakowski, R. (1958). Age and colour vision. Advanc. Sci., 15, 231-236.
(1962). Is the deterioration of colour discrimination with agedue to lens or retinal changes? Farbe, 11, 69-86.- (1964). Age and colour vision. Unpublished Ph.D. thesis,
Edinburgh University.- (1965a). Testing of colour vision in prospective printers'
apprentices and the problems this presents in selection. Brit. J.Physiol. Opt., 22, 10-32.(1965b). Colorimetric and photometric data for the 10th edition
of the Ishihara plates. Ibid., 22, 195-207.-(1966). A critical valuation of colour vision tests. Ibid., 23,
186-209.(1968a). The Farnsworth-Munsell 1 00-hue test. Ohthal. Optician,
8, 862-872.(1968b). Colour matching ability: can it be measured? J. Soc.
Dyers Col., 84, 3-9.(1968c). Small colour vision variations and their effect in visual
colorimetry. In Colour Measurement in Industry, pp. 167-194.The Colour Group, London.
(1 968d). The Pickford-Nicolson Anomaloscope - Calibrationvalidation and population norms. Second Scottish Symposiumon Colour, Scottish Section of the Colour Group. 5 and 6September. Brit. J. Physiol. Opt. In press.(1969). Psychological variables in colour vision testing. Proceed-
ings of the 1st International Colour Congress, Stockholm, 1969.M. Richter, Masterschmidt, Verlag, Gottingen. In press.
Little, A. (1967). The measurement of color discrimination ability.Color Engineering, 5, 48-53.
Le Grand, Y. (1968). Light, Colour and Vision, 2nd ed. Chapman andHall, London.
Marks, W. B., Dobelle, W. H., and MacNichol, E. F. (1964). Visualpigments of single primate cones. Science, 143, 1181-1183.
Maxwell, J. C. (1890). On the theory of colours in relation to colour-blindness. In The Scientific Papers of James Clark Maxwell, vol. 1,pp. 119-125, ed. Niven, W. D. Cambridge University Press,London.
Muller, G. E. (1924). Darstellung und Erkldrung der verschiedenenTypen der Farbenblindheit. Vandenhoeck and Ruprecht, Gottingen.(1930). Ueber die Farbenempfindungen, Bd. I and 2. Z. Psychol.
Physiol. Sinnesorg. Erganzungsbd., 17, 1-430; 18, 435-647.Nagel, W. A. (1907). Zwei Apparate fur die augenarztliche Funktions-
prufung. Adaptometer und kleines Spektrophotometer (Anomal-oskop). Z. Augenheilk., 17, 201-222.
copyright. on N
ovember 22, 2021 by guest. P
rotected byhttp://oem
.bmj.com
/B
r J Ind Med: first published as 10.1136/oem
.26.4.265 on 1 October 1969. D
ownloaded from
288 R. Lakowski
Nelson, J. H. (1938). Anomalous trichromatism and its relation tonormal trichromatism. Proc. phys. soc. Lond., 50, 661-690.
Nickerson, D., and Stultz, K. F. (1944). Color tolerance specification.J. opt. Soc. Amer., 34, 550-570.
Obi, S. (1954). Study on the color sense of the aged. Acta Soc. Ophthal.Jap., 58, 451-454. (In Japanese).
Ohta, Y. (1966). The improvement of 40 Hue test. Ibid., 70, 798-801.(In Japanese, English summary.)
Ostwald, W. (1931-33). Colour Science: A Handbook for AdvancedStudents. Winsor and Newton, London.
Peters, G. A. (1954). The new Dvorine color perception test.Optometric Weekly, No. 11, pp. 1801-1803.
Pickford, R. W. (1949). Total colour blindness of hysterical origin.Brit. J. med. Psychol., 22, 122-128.(1950). A study of the Ishihara test for colour blindness. Brit. J.
Psychol., 40, 71-80.(1951). Individual Diferences in Colour Vision. Routledge andKeegan Paul, London.(1955). Weak and anomalous colour vision in industry and the
need for adequate tests. Occup. Psychol., 29, 182-192.- (1957). A practical anomaloscope for testing colour vision and
colour blindness. Brit. J. physiol. Opt., 14, 2-26.(1958). A review of some problems of colour vision and colour
blindness. Advanc. Sci., 15, 104-117., and Lakowski, R. (1960). The Pickford-Nicolson anomaloscope.
Brit. J. Physiol. Opt., 17, 131-150.Pitt, F. H. G. (1935). Characteristics of dichromatic vision. Med. Res.
Coun. spec. Rep. Ser. No. 200.Rayleigh, Lord (1881). Experiments on colour. Nature (Lond.), 25,
64-66.Riddell, W. J. B. et al. (1949). Discussion on colour vision in industry.
Proc. roy. Soc. Med., 43, 145-150.Ripps, H., and Weale, R. A. (1963). Cone pigments in the normal
human fovea. Vision Res., 3, 531-543.Roth, A. (1966). Le test 28 hue selon Farnsworth. Bull. Soc. Ophihal.
Fr., 66, 231-238.Ruddock, K. H. (1965). The effect of age upon colour vision. Vision
Res., 5, 37-45; 47-58.Rushton, W. A. H. (1958). Visual pigments in the colour blind. Nature
(Lond.), 182, 690-692.- (1962). Visual pigments in man. Sci. Amer., 207, no. 5
(Nov.), pp. 120-132., and Baker, H. D. (1964). Red-green sensitivity in normal vision.Vision Res., 4, 75-85.
Said, F. S., and Weale, R. A. (1959). The variation with age of thespectral transmissivity of the living human crystalline lens.Gerontologia (Basel), 3, 213-231.
Sidowski, J. B., Ed. (1966). Experimental Methods and Instrumentationin Psychology. McGraw-Hill, New York.
Sloan, L. L., and Altman, A. (1951). Evaluation of H-R-R plates forMeasuring Degree of Red-Green Deficiency. Wilmer Ophthal.Instit. Tech. Report-Project N 60 NR 234-07.
Smith, H. C. (1943). Age differences in color discrimination. J.gen. Psychol., 29, 191-226.
Stiles, W. S. (1952). Colour vision: a retrospect. Endeavour, 11, 33-40.- , and Crawford, B. H. (1933). The luminous efficiency of rays
entering the eye at different points. Proc. roy. Soc., 112B, 428-450.Svaetichin, G., and MacNichol, E. F. (1958). Retinal mechanisms for
chromatic and achromatic vision. Ann. N. Y. Acad. Sci., 74,385-404.
Tiffin, J., and Kuhn, N. S. (1942). Color discrimination in industry.Arch. Ophthal. (Chic.), 28, 851-859.
Tilleard, D. L. (1958). Colour Aptitude Test: analysis of scores.J. Oil Col. Chem. Ass., 41, 797-806.
Trendelenburg, W. (1929). Zur Diagnostik des abnormalen Farben-sinnes. Klin. Mbl. Augenheilk., 83, 721-732.
Umazume, K., and Harutake, M. (1962). 'Tokyo Medical CollegeColor Vision Test'. Farbe, 11, 4547.
Verriest, G. (1963). Further studies on acquired deficiency of colourdiscrimination. J. opt. Soc. Amer., 53, 185-195.
-(1964). Les deficences acquises de la discrimination chromatiqueMem. Acad. roy. Med. Belg., ser. 2, 4, fasc. 5, pp. 35-327.
(1968). ttude comparative des efficiences de quelques tests pourla reconnaissance des anomalies de la vision des couleurs. Arch.Mal. Prof., 29, 293-314.
-, Seki, R., Metsala, P., and Buyssens, A. (1964). Sur le coloraptitude test et sa valeur en tant qu'epreuve de detection desdeficiences de la discrimination chromatique. Biol. Jaarb.(Dodonaea), 32, 237-242.
-, Vandevyvere, R., et Vanderdonck, R. (1962). Nouvellesrecherches se rapportant a l'influence du sexe et de 1l'ge sur ladiscrimination chromatique, ainsi qu'a la signification pratiquedes resultats du test 100 hue de Farnsworth-Munsell. Rev. Opt.,41, 499-509.
Wald, G. (1966). Defective color vision and its inheritance. Proc. nat.Acad. Sci. (Wash.), 55, 1347-1363.
Walraven, P. L. (1966). A zone theory of colour vision. In Proc.int. Col. Meeting. Vol. 1, pp. 137-140. Ed. M. Richter, Muster-schmidt-Verlag, Gottingen.
*, Leebeck, H. J., and Bouman, M. A. (1956). The ISCC ColorAptitude Test - the Interpretation of Some Testing Results.Instituut voor Zintuigfysiologie. R.V.O.-T.N.O. Report No.WW-10.
Weale, R. A. (1963). The Aging Eye. Lewis, London.Willis, M. P., and Farnsworth, D. (1952). Comparative Evaluation of
Anomaloscopes. U.S. Navy med. Res Lab., Washington. Report190.
Wright, W. D. (1928-29). A re-determination of the trichromaticcoefficients of the spectral colours. Trans. Opt. Soc. (Lond.), 30,141-164.
( 1930). A re-determination of the mixture curves of the spectrumr.Ibid., 31, 201-218.
-- (1946). Researches on Normal and Defective Colour Vision.Henry Kimpton, London.
(1952). The characteristics of tritanopia. J. opt. Soc. Amer., 42,509-521.(1964) The Measurement of Colour. 3rd ed. Hilger, London.
Wyszecki, G., and Stiles, W. S. (1967). Color Science: Concepts andMethods, Quantitative Data and Formules. Wiley, New York.
Young, T. (1807). On the theory of light and colours. In A Course ofLectures on Natural Philosophy and the Mechanical Arts, Vol. 2,pp. 613-632. Johnson, London.
Zanen, J. (1953). Introduction a l'etude des dyschromatopsiesretiniennes centrales acquises. Bull. Soc. belge Ophthal., no. 103,pp. 3-148.
Reference list of tests
1. AO H-R-R Pseudoisochromatic plates. (2nd ed. 1957). Hardy,L. H., Rand, G., and Rittler, M. C. American Optical InstrumentDivision.
2. Burnham-Clark-Munsell Color Memory Test. Burnham, R. W.,and Clark, J. R. Munsell Color Co. Inc., Baltimore, 1,Maryland 21218; and Tintometer Sales Limited, WaterlooRoad, Salisbury, England.
3. Color Aptitude Test (1953). Inter-Society Color Council. Feder-ation of Paint and Varnish Production Clubs, Philadelphia 7,Pennsylvania.
4. Dvorine Pseudo-Isochromatic Plates (2nd ed. 1953). Dvorine, 1.Waverley Press Inc., Baltimore, Maryland, U.S.A.
5. Farnsworth-Munsell 100-Hue Test. Farnsworth, D. MunsellColour Co. Inc., Baltimore 1, Maryland 21218; TintometerSales Limited, Waterloo Road, Salisbury, England.
6. Ishihara Tests for Colour-Blindness. (10th ed.) Ishihara, S.S. Kanchara, Nippon Isho Shuppan Co., Japan.
7. Pickford-Nicolson Anomaloscope. Pickford, R. W. Rayner ofRayner and Keeler Ltd., London.
8. Tokyo Medical College Color Vision Test (1957). (1st ed.)Ophthalmology Dept., Tokyo Medical College. MurakamiColor Research Laboratory, Tokyo, Japan.
Received for publication November 16, 1968.
copyright. on N
ovember 22, 2021 by guest. P
rotected byhttp://oem
.bmj.com
/B
r J Ind Med: first published as 10.1136/oem
.26.4.265 on 1 October 1969. D
ownloaded from