THEORIES of POPULATION GROWTH AP Human...
3
AP Human Geography Population THEORIES of POPULATION GROWTH THOMAS MALTHUS (1798) – world’s population growth would outpace its carrying capacity. Global population growing geometrically, while food-supply only growing arithmetically. Critics say that the future is unpredictable – now have innovations in agriculture, etc. KARL MARX – problem was not population growth rates but the unequal distribution of resources and wages. ESTER BOSERUP believed that over- population could be solved by increasing the number of subsistence farmers. NEO-MALTHUSIANS – different regions can support different levels of population. Need to read a “sustainable” level. FUTURE POPULATION PROJECTIONS The UNITED NATIONS predicts that the earth’s population will begin declining with 9.0 billion by 2050 and 9.5 billion by 2100. NEGATIVE CHECKS on population = war, plagues, pandemics, famines, etc. DEMOGRAPHIC MEASURES CRUDE BIRTH RATE (CBR) – number of live births / 1,000 people / year CRUDE DEATH RATE (CDR) – number of deaths / 1,000 people/ year INFANT MORTALITY RATE (IMR) – number of infant deaths / 1,000 live births. LIFE EXPECTANCY – average number of years to be lived by a person. FECUDITY – ability to a woman to concept. Fecund years between ages 15-45. TOTAL FERTILITY RATE (TFR) – predicted number of births per 1,000 women in the fecund years. A TFR of 2.1 is considered REPLACEMENT-LEVEL FERTILITY. DOUBLING TIME – number of years it will take for the country to double in population size. DEMOGRAPHIC TRANSITION MODEL (see Concept Card #1) CRITICISMS of the DTM This model is based on England’s transition from a subsistence economy to an industrialized society. They believe not all countries will pass through the same demographic transition pattern. Because of the diffusion of medicine and food supplies push countries in Stage 2 to Stage 3 at a much faster pace. Some demographers propose adding a Stage 5 – show continuing decline in CBR. ©BECKY WHITE HATCH, 2011 - REA BASICS OF DEMOGRAPHY DEMOGRAPHIC is the study of human populations. Geographers use demographic analysis to study the spatial distribution of humans and their movements. The size, composition, and growth of a country’s population affect its well-being. POPULATION EQUATION SCALE of INQUIRY is the size of a geographic investigation (global, regional or local). GLOBAL SCALE = entire world; REGIONAL = continents, countries, or states; LOCAL = neighborhoods or towns. DEMOGRAPHIC ACCOUNTING EQUATION o P 1 =P 0 + B – D + I – E (Population at the end of the interval of measurement = Population at the beginning + Births – Deaths + Immigration – Emigration) POPULATION DISTRIBUTION DISTRIBUTION of population is the pattern of people across the earth’s surface – where they live. People are unevenly concentrated – clustering around sustaining resources. ECUMENE is the part of the earth where people can live – about 5% of the earth’s surface. GLOBAL POPULATION DISTRIBUTION Largest CONCENTRATION = EAST ASIA (China, Japan, Taiwan, North and South Korea) – 25% of the world’s people. Second-largest concentration = SOUTH ASIA (India, Bangladesh, Sri Lanka, and Pakistan. Most are farmers. Third-largest concentration EUROPE – most are urban dwellers (from the INDUSTRIAL REVOLUTION). POPULATION DENSITY DENSITY is another tool geographers use to study population distribution. Demographers use several types of density to analyze population trends: o ARITHMETIC DENSITY (Population Density) – total number of people/total land area. o PHYSIOLOGICAL DENSITY – number of people/arable land o AGRICULTURAL DENSITY – number of farmers/arable land. CARRYING CAPACITY Related to density is a region’s or country’s CARRYING CAPACITY, the number of people the area can sustain or support. This number can vary depending on a region’s available technology, wealth, climate, resources. . OVERPOPULATION is when a region’s population outgrows its carrying capacity, but carrying capacity can be increased through global trade and communication. POPULATION PYRAMIDS Demographers use POPULATION PYRAMIDS (age-sex structures) to evaluate the distribution of age and genders in a given population. A group of people of the same age is known as a COHORT. The DEPENDENCY RATIO shows the relationship between the dependents and the non-dependents. People in a country aged 15-64 are considered non- dependent = workforce. Over the last three centuries, the earth has experienced a POPULATION EXPLOSION – a dramatic population increase. EXPONENTIAL GROWTH RATE means that the more people that are added, the faster the population is growing. LINEAR (ARITHMETIC) GROWTH is a constant of fixed rate of growth. HISTORICAL TRENDS of GROWTH FIRST AGRICULTURAL REVOLUTION empowered humans with the ability to domesticate crops and build stationary settlements through farming - Cities began to develop and the population began to grow at faster rates. INDUSTRIAL REVOLUTION (1700s) was linked to the SECOND AGRICULTURAL REVOLUTION – improved fertilization and food storage techniques – fostered population growth and urbanization. Geographic Analysis of Population Population Growth over Space and Time
Transcript of THEORIES of POPULATION GROWTH AP Human...
AP Human Geography
Population
THEORIES of POPULATION GROWTH THOMAS MALTHUS (1798) – world’s
population growth would outpace its carrying capacity. Global population growing geometrically, while food-supply only growing arithmetically. Critics say that the future is unpredictable – now have innovations in agriculture, etc.
KARL MARX – problem was not population growth rates but the unequal distribution of resources and wages.
ESTER BOSERUP believed that over-population could be solved by increasing the number of subsistence farmers.
NEO-MALTHUSIANS – different regions can support different levels of population. Need to read a “sustainable” level.
FUTURE POPULATION PROJECTIONS The UNITED NATIONS predicts that the
earth’s population will begin declining with 9.0 billion by 2050 and 9.5 billion by 2100.
NEGATIVE CHECKS on population = war, plagues, pandemics, famines, etc.
DEMOGRAPHIC MEASURES CRUDE BIRTH RATE (CBR) – number of live
births / 1,000 people / year
CRUDE DEATH RATE (CDR) – number of deaths / 1,000 people/ year
INFANT MORTALITY RATE (IMR) – number of infant deaths / 1,000 live births.
LIFE EXPECTANCY – average number of years to be lived by a person.
FECUDITY – ability to a woman to concept. Fecund years between ages 15-45.
TOTAL FERTILITY RATE (TFR) – predicted number of births per 1,000 women in the fecund years. A TFR of 2.1 is considered REPLACEMENT-LEVEL FERTILITY.
DOUBLING TIME – number of years it will take for the country to double in population size.
DEMOGRAPHIC TRANSITION MODEL (see Concept Card #1)
CRITICISMS of the DTM
This model is based on England’s transition from a subsistence economy to an industrialized society. They believe not all countries will pass through the same demographic transition pattern. Because of the diffusion of medicine and food supplies push countries in Stage 2 to Stage 3 at a much faster pace.
Some demographers propose adding a Stage 5 – show continuing decline in CBR.
©BECKY WHITE HATCH, 2011 - REA
BASICS OF DEMOGRAPHY DEMOGRAPHIC is the study of human
populations. Geographers use demographic analysis to study the spatial distribution of humans and their movements.
The size, composition, and growth of a country’s population affect its well-being.
POPULATION EQUATION SCALE of INQUIRY is the size of a
geographic investigation (global, regional or local). GLOBAL SCALE = entire world; REGIONAL = continents, countries, or states; LOCAL = neighborhoods or towns.
DEMOGRAPHIC ACCOUNTING EQUATION o P1=P0 + B – D + I – E
(Population at the end of the interval of measurement = Population at the beginning + Births – Deaths + Immigration – Emigration)
POPULATION DISTRIBUTION DISTRIBUTION of population is the pattern
of people across the earth’s surface – where they live. People are unevenly concentrated – clustering around sustaining resources.
ECUMENE is the part of the earth where people can live – about 5% of the earth’s surface.
GLOBAL POPULATION DISTRIBUTION Largest CONCENTRATION = EAST ASIA
(China, Japan, Taiwan, North and South Korea) – 25% of the world’s people.
Second-largest concentration = SOUTH ASIA (India, Bangladesh, Sri Lanka, and Pakistan. Most are farmers.
Third-largest concentration EUROPE – most are urban dwellers (from the INDUSTRIAL REVOLUTION).
POPULATION DENSITY DENSITY is another tool geographers use
to study population distribution. Demographers use several types of density to analyze population trends:
o ARITHMETIC DENSITY (Population Density) – total number of people/total land area.
o PHYSIOLOGICAL DENSITY – number of people/arable land
o AGRICULTURAL DENSITY – number of farmers/arable land.
CARRYING CAPACITY Related to density is a region’s or
country’s CARRYING CAPACITY, the number of people the area can sustain or support. This number can vary depending on a region’s available technology, wealth, climate, resources. .
OVERPOPULATION is when a region’s population outgrows its carrying capacity, but carrying capacity can be increased through global trade and communication.
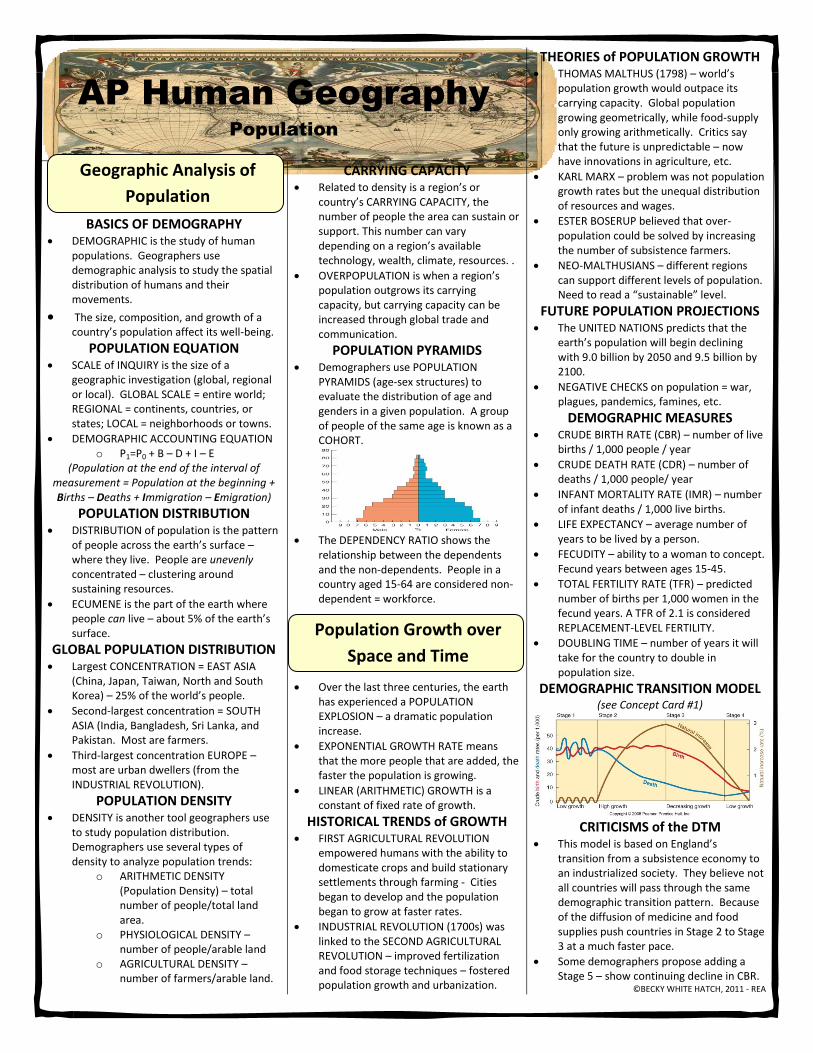
POPULATION PYRAMIDS Demographers use POPULATION
PYRAMIDS (age-sex structures) to evaluate the distribution of age and genders in a given population. A group of people of the same age is known as a COHORT.
The DEPENDENCY RATIO shows the
relationship between the dependents and the non-dependents. People in a country aged 15-64 are considered non-dependent = workforce.
Over the last three centuries, the earth has experienced a POPULATION EXPLOSION – a dramatic population increase.
EXPONENTIAL GROWTH RATE means that the more people that are added, the faster the population is growing.
LINEAR (ARITHMETIC) GROWTH is a constant of fixed rate of growth.
HISTORICAL TRENDS of GROWTH FIRST AGRICULTURAL REVOLUTION
empowered humans with the ability to domesticate crops and build stationary settlements through farming - Cities began to develop and the population began to grow at faster rates.
INDUSTRIAL REVOLUTION (1700s) was linked to the SECOND AGRICULTURAL REVOLUTION – improved fertilization and food storage techniques – fostered population growth and urbanization.
Geographic Analysis of
Population
Population Growth over
Space and Time

GLOBAL VARIATIONS in DTM
The DTM demonstrates that the CDR is a function of technology innovations and improvements in health care. CBR is based on cultural choice and individual decisions by people. CBR takes longer to change, unless forced by government.
All countries have progressed beyond Stage 1, largely through the diffusion of medical technology from MDC during the MEDICAL REVOLUTION.
Most African countries are in STAGE 2. Most Latin Americans and Asian countries
remain in STAGE 3 at moderate growth. Many western European countries are at
the end of STAGE 4 and pushing toward a potential STAGE 5. (Japan is also here).
The United States is in STAGE 4 – TFR = 2.06.
STAGE 2 – Cape Verde 1930-2000
STAGE 3: CHILE 1860-2000
STAGE 4: DENMARK 1830-1980
EPIDEMIOLOGIC TRANSITION MODEL The EPIDEMIOLOGIC TRANSITION MODEL
forcuses on the CAUSES OF DEATH in each of the stages of the DTM.
o PANDEMICS like the Black Plague affect the CDR in Stage 1.
o Diseases such as CHOLERA associated with overcrowding into cities affect CDR in Stage 2.
o The CDR is most affected in Stage 3-4 by disease associated ith the growing number of elderly people.
o Some demographers call for a STAGE 5 which re-introduce infections of Stage 3.
SPATIAL INTERACTION and FRICTION
OF DISTANCE SPATIAL INTERACTION is the interaction
between two places, whether through communication, economic transaction, or migration and travel.
FRICTION of DISTANCE – the difficulty of distance is being decreased through increased technology. Distance is not as much as a barrier that it once was.
SPACE-TIME COMPRESSION – process of coming closer together and more in contact with each other even though the real distance remains the same.
MIGRATION MIGRATION is the process of
permanently moving from your home region and crossing an administrative boundary – between countries, states, or counties.
MIGRATION STREAMS A MIGRATION STREAM is a pathway
from a place of origin to a destination.
Places attracting lots of migrants have high PLACE DESIRABILITY.
NET IN-MIGRATION- more immigrants (moving in) than emigrants (exiting). NET OUT-MIGRATION has more emigrants than immigrants.
Where there is a MIGRATION STREAM there is a MIGRATION COUNTERSTREAM of people moving back to the place of origin from the new place.
PUSH and PULL FACTORS PUSH FACTORS are the negative
influences that make a person want to move away – high taxes, crime rates . . .
PULL FACTORS are the positive influences that pull a person toward a particular place – schools, jobs . . .
VOLUNTARY vs. FORCED VOLUNTARY MIGRATION occurs migrant
chooses to move.
FORCED (INVOLUNTARY) MIGRATION – migrant pushed from their land. Refugee
REGIONS of DISLOCATION SUB-SAHARAN AFRICA has the largest
refugee crisis. Millions have fled from Rwanda, the Congo, and Sudan . . .
MIDDLE EAST – Palestinians and Kurds
EUROPE – fall of Yugoslavia – Balkans – almost 7 million refugees
SOUTHEAST ASIA – Vietnam War – 2 million refugees; Cambodia, Burma
SOUTH ASIA – Afghani refugees to Pakistan, and Sri Lanka.
BRAIN DRAIN
The more educated people are, the more likely they are to make long distance moves, often outside of their country.
MAJOR MIGRATIONS at DIFFERENT SCALES
3% of the world’s people have migrated from their countries of origin.
North America, Oceania, and Europe have net in-migrations.
Asia, Africa and Latin America have net out-migrations.
About 50% of Southwest Asia’s population are immigrants = highest percentage in the world.
WAVES OF MIGRATION – UNITED STATES
1607-1776 – immigrants came from Europe and Africa (slave trade) – initial settlement of colonies.
Mid-19th
century – early 20th
century – continued migration from Europe
1970s to today – immigrants mostly from Asia and Latin America.
INTERNAL MIGRATION
INTERREGIONAL MIGRATION – moving from one region in the country to another region.
INTRAREGIONAL MIGRATION – moving within a region – EX: rural-urban
CENTERS of POPULATION in the U.S. have seen a westward and southward direction pattern.
MIGRATION SELECTIVITY The evaluation of how likely someone is to
migrate based on personal, social, and economic factors. People are most likely to move between the ages of 18-30, the time in which they leave home to find employment, attend college, war…
RAVENSTEIN’S MIGRATION LAWS The majority of migrants travel short
distances – STEP MIGRATION. o INTERVENING OPPORTUNITY or
OBSTACLE – changes migration plans.
Migrants who are traveling a long way tend to move to larger cities than smaller cities – GRAVITY MODEL
Rural residents are more likely to migrate than are urban residents.
Families are less likely to migrate across national borders than are young adults.
Every migration stream creates a counter-stream.
ACTIVITY SPACE Area that you travel on a daily basis.
Population Movement