THEORETICAL Fe II–III EMISSION-LINE STRENGTHS FROM
12
THEORETICAL Fe II –III EMISSION-LINE STRENGTHS FROM ACTIVE GALACTIC NUCLEI WITH BROAD-LINE REGIONS T. A. A. Sigut Department of Physics and Astronomy, The University of Western Ontario, London, ON N6A 3K7, Canada and Anil K. Pradhan and Sultana N. Nahar Department of Astronomy, The Ohio State University, 174 West 18th Avenue, Columbus, OH 43210-1106 Receivv ed 2004 January 9; accepted 2004 April 20 ABSTRACT We present theoretical iron emission line strengths for physical conditions typical of active galactic nuclei (AGNs) with broad-line regions. The non–local thermodynamic equilibrium (NLTE) models include a new and extensive treatment of radiative transfer in the Fe iii ion, complementing the Fe ii emission line strengths predicted in our earlier works. We also briefly present preliminary results for the Fe i emission from AGNs using a reduced atom model. We can satisfactorily reproduce the empirical UV Fe iii emission line template of Vestergaard & Wilkes for the prototypical narrow-line Seyfert 1 galaxy I Zw 1, both in terms of the general Fe iii flux distribution and the relative strength of the Fe iii and Fe ii emission. However, a number of detailed features are still not matched; the most prominent example is the strongest single Fe iii feature observed in the I Zw 1 spectrum, UV47: it is predicted to be strong only in models suppressing Fe-H charge exchange reactions. We examine the role of variations in cloud turbulent velocity and iron abundance and carry out Monte Carlo simulations to demonstrate the effect of uncertainties in atomic data on the computed spectra. Subject headin gg s: atomic data — line: formation — line: identification — quasars: emission lines — supernovae: general 1. INTRODUCTION The ultraviolet spectra of active galactic nuclei (AGNs) with broad-line regions (BLRs) exhibit a quasi-continuum of thousands of blended iron emission lines, dominated by Fe ii (Wills et al. 1980a, 1980b); numerous Fe ii transitions are also present in the optical (Boroson & Green 1992; Ve ´ron-Cetty et al. 2004) and near-infrared (Rudy et al. 2000, 2001; Rodrı ´guez-Ardila et al. 2002). Since their recognition as a significant component of the BLR emission spectrum, these Fe ii transitions have been the subject of intense observational scrutiny and theoretical modeling (Netzer 1980, 1990; Kwan & Krolik 1981; Netzer & Wills 1983; Wills et al. 1985; Elitzur & Netzer 1985; Collin-Souffrin et al. 1986, 1988; Penston 1987; Dumont & Collin-Souffrin 1990; Sigut & Pradhan 1998, 2003; Verner et al. 1999). Reproducing the strength of the Fe ii emission has been a considerable challenge for traditional photoionized models of the BLR clouds; typically, the Fe ii(UV þ opt)=H flux ratio is observed to be $ 10, ranging from $2 to near $30 in the case of superstrong Fe ii emitters (Joly 1993; Graham et al. 1996). However, Fe ii is not the only component of the low- ionization emission spectrum of the BLR. Ultraviolet tran- sitions of Fe iii are also well established (Baldwin et al. 1996; Laor et al. 1997; Vestergaard & Wilkes 2001). Laor et al. (1997) identify a strong feature near 2418 8 in the spectrum of the prototypical narrow-line Seyfert 1 (NLS1) galaxy I Zw 1 as Fe iii multiplet UV47. Most recently, Vestergaard & Wilkes (2001) provide a detailed analysis of the UV Fe iii emission from I Zw 1 and use their observations to empirically derive Fe ii and Fe iii flux templates. In our previous work (Sigut & Pradhan 2003, hereafter SP03), we constructed a detailed non-LTE radiative transfer model for Fe ii, including 829 atomic levels, and predicted a large number ($23,000) of Fe ii emission line strengths for conditions typical of the BLRs of AGNs. In this paper, we extend our earlier work on Fe ii to detailed non-LTE models for Fe i – iii. We compare these predictions to the observed UV I Zw 1 template. 2. ATOMIC DATA The four lowest ionization stages of iron, Fe i – iv, were explicitly included in the calculations (although Fe iv was included as only a one-level atom). A summary of the com- plete iron model atom is given in Table 1. The final non-LTE atomic model includes 944 energy levels and 14,962 radiative bound-bound (rbb) transitions. With the exception of level energies, the majority of radiative and collisional atomic data were computed using methods developed under the Iron Project 1 (Hummer et al. 1993, hereafter IP.I). The R-matrix method employed in the Iron Project (IP) ensures relatively uniform accuracy for the computed data. In the following sections, the IP atomic data will also be identified according to the number of the paper in the ongoing series published in Astronomy & Astrophysics (e.g., ‘‘IP.I’’ for the first paper in this series). 2.1. Fe i A minimal Fe i atomic model was included in the calcula- tion, mainly to predict the ionization fraction of Fe i in the various BLR models and provide preliminary flux estimates. While rare, Fe i fluxes have been tentatively identified in a few 1 Complete references for the Iron Project are given at www.astronomy .ohio-state.edu/$pradhan. 81 The Astrophysical Journal, 611:81–92, 2004 August 10 # 2004. The American Astronomical Society. All rights reserved. Printed in U.S.A.
Transcript of THEORETICAL Fe II–III EMISSION-LINE STRENGTHS FROM

THEORETICAL Fe II–III EMISSION-LINE STRENGTHS FROM ACTIVE GALACTIC NUCLEIWITH BROAD-LINE REGIONS
T. A. A. Sigut
Department of Physics and Astronomy, The University of Western Ontario, London, ON N6A 3K7, Canada
and
Anil K. Pradhan and Sultana N. Nahar
Department of Astronomy, The Ohio State University, 174 West 18th Avenue, Columbus, OH 43210-1106
Receivved 2004 January 9; accepted 2004 April 20
ABSTRACT
We present theoretical iron emission line strengths for physical conditions typical of active galactic nuclei(AGNs) with broad-line regions. The non–local thermodynamic equilibrium (NLTE) models include a new andextensive treatment of radiative transfer in the Fe iii ion, complementing the Fe ii emission line strengthspredicted in our earlier works. We also briefly present preliminary results for the Fe i emission from AGNs usinga reduced atom model. We can satisfactorily reproduce the empirical UV Fe iii emission line template ofVestergaard & Wilkes for the prototypical narrow-line Seyfert 1 galaxy I Zw 1, both in terms of the general Fe iiiflux distribution and the relative strength of the Fe iii and Fe ii emission. However, a number of detailed featuresare still not matched; the most prominent example is the strongest single Fe iii feature observed in the I Zw 1spectrum, UV47: it is predicted to be strong only in models suppressing Fe-H charge exchange reactions. Weexamine the role of variations in cloud turbulent velocity and iron abundance and carry out Monte Carlosimulations to demonstrate the effect of uncertainties in atomic data on the computed spectra.
Subject headinggs: atomic data — line: formation — line: identification — quasars: emission lines —supernovae: general
1. INTRODUCTION
The ultraviolet spectra of active galactic nuclei (AGNs) withbroad-line regions (BLRs) exhibit a quasi-continuum ofthousands of blended iron emission lines, dominated by Fe ii
(Wills et al. 1980a, 1980b); numerous Fe ii transitions are alsopresent in the optical (Boroson & Green 1992; Veron-Cettyet al. 2004) and near-infrared (Rudy et al. 2000, 2001;Rodrıguez-Ardila et al. 2002). Since their recognition as asignificant component of the BLR emission spectrum, theseFe ii transitions have been the subject of intense observationalscrutiny and theoretical modeling (Netzer 1980, 1990; Kwan &Krolik 1981; Netzer & Wills 1983; Wills et al. 1985; Elitzur &Netzer 1985; Collin-Souffrin et al. 1986, 1988; Penston 1987;Dumont & Collin-Souffrin 1990; Sigut & Pradhan 1998, 2003;Verner et al. 1999). Reproducing the strength of the Fe ii
emission has been a considerable challenge for traditionalphotoionized models of the BLR clouds; typically, theFe ii(UVþ opt)=H� flux ratio is observed to be �10, rangingfrom �2 to near �30 in the case of superstrong Fe ii emitters(Joly 1993; Graham et al. 1996).
However, Fe ii is not the only component of the low-ionization emission spectrum of the BLR. Ultraviolet tran-sitions of Fe iii are also well established (Baldwin et al. 1996;Laor et al. 1997; Vestergaard &Wilkes 2001). Laor et al. (1997)identify a strong feature near 2418 8 in the spectrum of theprototypical narrow-line Seyfert 1 (NLS1) galaxy I Zw 1 asFe iii multiplet UV47. Most recently, Vestergaard & Wilkes(2001) provide a detailed analysis of the UV Fe iii emissionfrom I Zw 1 and use their observations to empirically deriveFe ii and Fe iii flux templates.
In our previous work (Sigut & Pradhan 2003, hereafterSP03), we constructed a detailed non-LTE radiative transfer
model for Fe ii, including 829 atomic levels, and predicted alarge number (�23,000) of Fe ii emission line strengths forconditions typical of the BLRs of AGNs. In this paper, weextend our earlier work on Fe ii to detailed non-LTE modelsfor Fe i–iii. We compare these predictions to the observed UVI Zw 1 template.
2. ATOMIC DATA
The four lowest ionization stages of iron, Fe i–iv, wereexplicitly included in the calculations (although Fe iv wasincluded as only a one-level atom). A summary of the com-plete iron model atom is given in Table 1. The final non-LTEatomic model includes 944 energy levels and 14,962 radiativebound-bound (rbb) transitions. With the exception of levelenergies, the majority of radiative and collisional atomic datawere computed using methods developed under the IronProject1 (Hummer et al. 1993, hereafter IP.I ). The R-matrixmethod employed in the Iron Project ( IP) ensures relativelyuniform accuracy for the computed data. In the followingsections, the IP atomic data will also be identified according tothe number of the paper in the ongoing series published inAstronomy & Astrophysics (e.g., ‘‘IP.I’’ for the first paper inthis series).
2.1. Fe i
A minimal Fe i atomic model was included in the calcula-tion, mainly to predict the ionization fraction of Fe i in thevarious BLR models and provide preliminary flux estimates.While rare, Fe i fluxes have been tentatively identified in a few
1 Complete references for the Iron Project are given at www.astronomy.ohio-state.edu/�pradhan.
81
The Astrophysical Journal, 611:81–92, 2004 August 10
# 2004. The American Astronomical Society. All rights reserved. Printed in U.S.A.
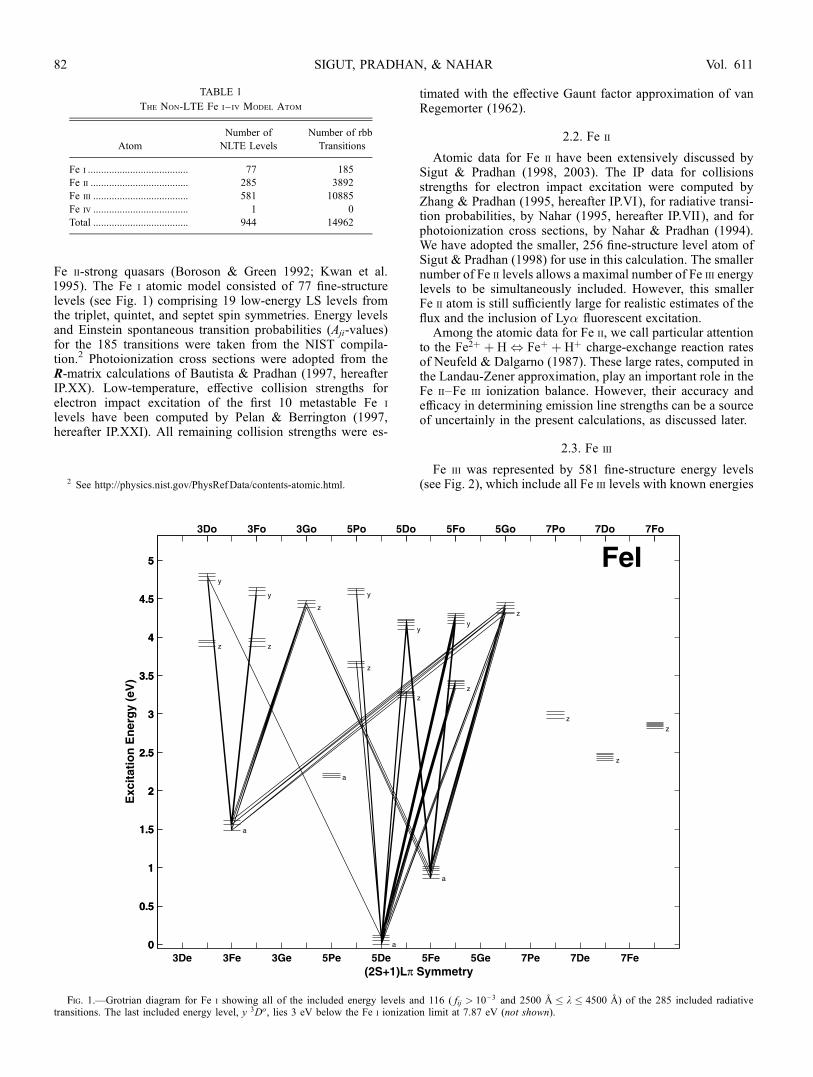
Fe ii-strong quasars (Boroson & Green 1992; Kwan et al.1995). The Fe i atomic model consisted of 77 fine-structurelevels (see Fig. 1) comprising 19 low-energy LS levels fromthe triplet, quintet, and septet spin symmetries. Energy levelsand Einstein spontaneous transition probabilities (Aji-values)for the 185 transitions were taken from the NIST compila-tion.2 Photoionization cross sections were adopted from theR-matrix calculations of Bautista & Pradhan (1997, hereafterIP.XX). Low-temperature, effective collision strengths forelectron impact excitation of the first 10 metastable Fe i
levels have been computed by Pelan & Berrington (1997,hereafter IP.XXI). All remaining collision strengths were es-
timated with the effective Gaunt factor approximation of vanRegemorter (1962).
2.2. Fe ii
Atomic data for Fe ii have been extensively discussed bySigut & Pradhan (1998, 2003). The IP data for collisionsstrengths for electron impact excitation were computed byZhang & Pradhan (1995, hereafter IP.VI), for radiative transi-tion probabilities, by Nahar (1995, hereafter IP.VII), and forphotoionization cross sections, by Nahar & Pradhan (1994).We have adopted the smaller, 256 fine-structure level atom ofSigut & Pradhan (1998) for use in this calculation. The smallernumber of Fe ii levels allows a maximal number of Fe iii energylevels to be simultaneously included. However, this smallerFe ii atom is still sufficiently large for realistic estimates of theflux and the inclusion of Ly� fluorescent excitation.Among the atomic data for Fe ii, we call particular attention
to the Fe2þ þ H , Feþ þ Hþ charge-exchange reaction ratesof Neufeld & Dalgarno (1987). These large rates, computed inthe Landau-Zener approximation, play an important role in theFe ii–Fe iii ionization balance. However, their accuracy andefficacy in determining emission line strengths can be a sourceof uncertainly in the present calculations, as discussed later.
2.3. Fe iii
Fe iii was represented by 581 fine-structure energy levels(see Fig. 2), which include all Fe iii levels with known energies
TABLE 1
The Non-LTE Fe i– iv Model Atom
Atom
Number of
NLTE Levels
Number of rbb
Transitions
Fe i ...................................... 77 185
Fe ii ..................................... 285 3892
Fe iii .................................... 581 10885
Fe iv .................................... 1 0
Total .................................... 944 14962
Fig. 1.—Grotrian diagram for Fe i showing all of the included energy levels and 116 ( fij > 10�3 and 2500 8 � k � 4500 8) of the 285 included radiativetransitions. The last included energy level, y 3Do, lies 3 eV below the Fe i ionization limit at 7.87 eV (not shown).
2 See http://physics.nist.gov/PhysRefData/contents-atomic.html.
SIGUT, PRADHAN, & NAHAR82 Vol. 611

(see the NIST compilation; also Nahar & Pradhan 1996) Wehave used four principal sources to compile the requiredAji-values for Fe iii transitions: the NIST critically evaluateddatabase; the R-matrix results of Nahar & Pradhan (1996,hereafter IP.XVII) for dipole-allowed (�S ¼ 0) transitions3;the Hartree-Fock calculations of Ekberg (1993), which alsotreats intersystem (�S 6¼ 0) transitions; and the extensivesemiempirical calculations of Kurucz (1992).
Photoionization cross sections were adopted from Nahar &Pradhan (IP.XVII). Collision strengths for electron impact ex-citation were adopted from Zhang (1996, hereafter IP.XVIII).All remaining collision strengths were estimated with the Gauntfactor approximation. Charge exchange reactions with Fe iv
were also included following Kingdon & Ferland (1996).
3. CALCULATIONS
The iron line fluxes were calculated using the procedure ofSP03. Briefly, a background temperature and density structurefor a single BLR cloud of a given ionization parameter andtotal particle density was computed with CLOUDY (Ferland,1991). The shape of the photoionizing continuum was taken tobe that of Mathews & Ferland (1987). Given this fixed, one-dimensional model, the coupled equations of radiative transfer
and statistical equilibrium were solved for a self-consistent setof iron level populations and line fluxes. A complete discussionof the system of equations solved, including the treatment offluorescent excitation by Ly� and Ly�, and the implemen-tation details, are given in SP03. We note that our treatmentof fluorescent excitation involves first the construction of thefull frequency-dependent, PRD (partial-redistribution) sourcefunctions for Ly� and Ly�, and then their inclusion in thetotal monochromatic source functions used in the radiativetransfer solutions for all overlapping iron rbb transitions. Allof the iron radiative transitions assumed complete redistri-bution over a Doppler line profile with a width given by
��D ¼
ffiffiffiffiffiffiffiffiffiffiffiffiffiffiffiffiffiffiffi2kT
mFe
þ v2t
s: ð1Þ
Here mFe is the mass of an iron atom and vt is the internalturbulent velocity of the cloud.4
In the current work, each set of iron fluxes is specified byfour model parameters representing the BLR cloud: the ion-ization parameter, the total particle density, the (internal) cloud
Fig. 2.—Grotrian diagram for Fe iii showing all of the included energy levels and the 286 radiative transitions with fij > 0:2 and k < 5000 8. as predicted byKurucz (1992). These transitions are only a tiny fraction of the total number of radiative transitions included in the calculation. The last energy level included, g 3De,lies 2.1 eV below the Fe iii ionization limit at 30.65 eV (not shown).
3 Identification of the calculated (bound) Fe iii levels and their corre-spondence with the experimental NIST energy levels was performed by Nahar& Pradhan (1996) via the ELEVID code of Nahar (1995).
4 Turbulent velocity is used to refer to what is commonly denoted micro-turbulence by stellar astronomers; this velocity represents the width of aGaussian distribution of turbulent motions small in scale compared to unitoptical depth. These motions act to broaden the line profile (eq. [1]), and thuscan alter the radiative transfer solution in each line.
IRON EMISSION FROM AGNs 83No. 1, 2004
turbulent velocity, and the iron abundance relative to hydro-gen. Table 2 identifies the different BLR models constructedin this work and the associated ionization parameters, particledensities, and total column densities.
4. IRON IONIZATION BALANCE
The ionization balance among the four lowest ionizationstages of iron was self-consistently calculated simultaneouslywith the level populations. Expression for the total and level-specific photo and collisional ionization-recombination ratesare given in SP03. A small correction was applied at eachdepth for the fraction of iron more highly ionized than Fe iv,with this correction being estimated by CLOUDY.
Our self-consistent procedure is different from Verner et al.(1999), who first solve for the iron ionization balance in iso-
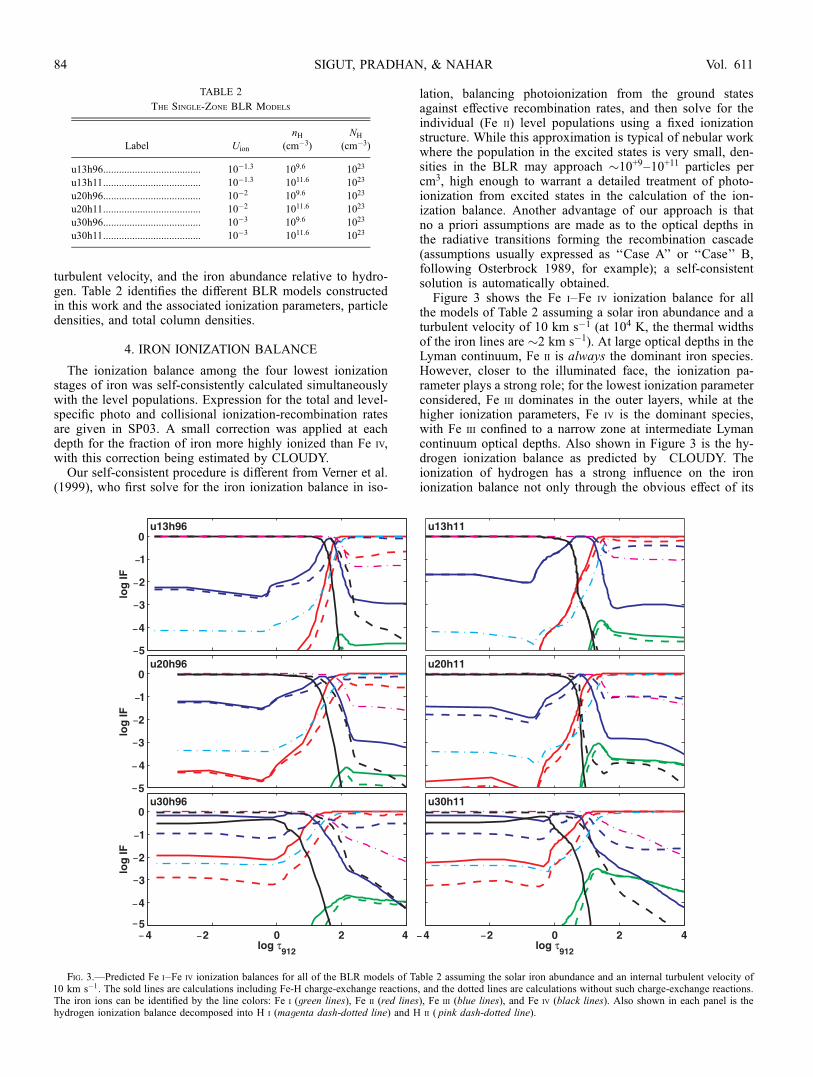
lation, balancing photoionization from the ground statesagainst effective recombination rates, and then solve for theindividual (Fe ii) level populations using a fixed ionizationstructure. While this approximation is typical of nebular workwhere the population in the excited states is very small, den-sities in the BLR may approach �10+9–10+11 particles percm3, high enough to warrant a detailed treatment of photo-ionization from excited states in the calculation of the ion-ization balance. Another advantage of our approach is thatno a priori assumptions are made as to the optical depths inthe radiative transitions forming the recombination cascade(assumptions usually expressed as ‘‘Case A’’ or ‘‘Case’’ B,following Osterbrock 1989, for example); a self-consistentsolution is automatically obtained.Figure 3 shows the Fe i–Fe iv ionization balance for all
the models of Table 2 assuming a solar iron abundance and aturbulent velocity of 10 km s�1 (at 104 K, the thermal widthsof the iron lines are �2 km s�1). At large optical depths in theLyman continuum, Fe ii is always the dominant iron species.However, closer to the illuminated face, the ionization pa-rameter plays a strong role; for the lowest ionization parameterconsidered, Fe iii dominates in the outer layers, while at thehigher ionization parameters, Fe iv is the dominant species,with Fe iii confined to a narrow zone at intermediate Lymancontinuum optical depths. Also shown in Figure 3 is the hy-drogen ionization balance as predicted by CLOUDY. Theionization of hydrogen has a strong influence on the ironionization balance not only through the obvious effect of its
Fig. 3.—Predicted Fe i–Fe iv ionization balances for all of the BLR models of Table 2 assuming the solar iron abundance and an internal turbulent velocity of10 km s�1. The sold lines are calculations including Fe-H charge-exchange reactions, and the dotted lines are calculations without such charge-exchange reactions.The iron ions can be identified by the line colors: Fe i (green lines), Fe ii (red lines), Fe iii (blue lines), and Fe iv (black lines). Also shown in each panel is thehydrogen ionization balance decomposed into H i (magenta dash-dotted line) and H ii ( pink dash-dotted line).
TABLE 2
The Single-Zone BLR Models
Label Uion
nH(cm�3)
NH
(cm�3)
u13h96..................................... 10�1.3 109.6 1023
u13h11..................................... 10�1.3 1011.6 1023
u20h96..................................... 10�2 109.6 1023
u20h11..................................... 10�2 1011.6 1023
u30h96..................................... 10�3 109.6 1023
u30h11..................................... 10�3 1011.6 1023
SIGUT, PRADHAN, & NAHAR84 Vol. 611

opacity on the local ionizing radiation field, but also throughstrong charge-exchange reactions, Fe2þ þ H , Feþ þ Hþ.
Figure 3 also shows the predicted ionization fractions inthe same set of BLR models except neglecting Fe-H charge-transfer reactions. There are significant differences, most no-tably for the higher ionization parameters at the lower particledensity considered, models u20h96 and u13h96. The absenceof charge exchange reactions in these models leads to Fe iii,and not Fe ii, as the dominant iron ionization stage throughoutthe cloud model. The influence of the charge-exchange reac-tions on the predicted iron fluxes will be discussed in a latersection; such models may be partially supported by observa-tion of I Zw 1 as they are better able to account for an intensefeature near 2418 8 identified by Laor et al. (1997) as Fe iii
UV47. We note that the charge exchange ionization and re-combination rates for Fe2þ þ H , Feþ þ Hþ predicted byNeufeld & Dalgarno (1987) were obtained in the rather crudeLandau-Zener approximation (see Flower 1990; also Kingdon& Ferland 1996), and it is not inconceivable that this rate maybe significantly overestimated.
Finally, we note that the predicted fraction of Fe i in allcases, including the lowest ionization parameter considered,is very small, T10�3. The question of whether such a smallneutral fraction can account for the tentatively identified Fe i
features in AGN spectra will be addressed in a later section.
5. PREDICTED Fe iii FLUXES
Table 3 gives the total iron fluxes in the wavelength intervalof 1500–5000 8 for the single-zone BLR cloud models ofTable 2. The effect of increasing the cloud turbulent velocityfrom 10 to 50 km s�1 and of tripling the iron abundance
relative to hydrogen are also given. The total flux is brokendown into the percentage contributions of each of the ironions. The higher density models with the larger ionizationparameters, models u20h11 and u13h11, predict the largestcontribution of the flux arising from Fe iii, approaching �35%in model u13h11. As also seen from the table, the percentagecontribution of Fe iii tends to decrease with increasing turbu-lent velocity (except for model u30h96) and increases with anenhanced iron abundance; the u13h11 model, with a threefoldenhancement of the iron abundance, comes close to having anequal flux split between Fe ii and Fe iii. It should be borne inmind that these comparisons are with the significantly smalleratom Fe ii of Sigut & Pradhan (1998) to allow the simulta-neous treatment of the a large Fe iii atom.
Figures 4 and 5 show the wavelength distributions of theemitted iron line fluxes for the u20h96 and u13h11 models,respectively, in the case of a solar iron abundance and 10 km s�1
of turbulent velocity. The lower wavelength limit has beenextended down from the 15008 of Table 3 to 5008 in order toshow the complete Fe iii spectrum. The separate panels in theseplots show the total line flux as well as the contributions fromthe individual iron ions. There is a striking difference in theFe iii fluxes predicted for these two models. For u20h96, thestrongest Fe iii emission occurs at wavelengths near 1900 8.These transitions represent decays from the lowest odd-parityFe iii level, z 7Po, to a 7Se and are the only possible �S ¼ 0transitions (see Fig. 2). Intersystem (�S 6¼ 0) transitions fromz 7Po to a 5De, the Fe iii ground state, giving lines near 1220 8,and to a 5Se, giving lines near 2400 8 (multiplet UV47), arealso present but weak. The multiplet UV47 transitions iden-tified as the strongest Fe iii features in the spectrum of I Zw 1 by
TABLE 3
Iron Fluxes for the BLR Models
Model
(1)
Ftot
(2)
% Fe i
(3)
% Fe ii
(4)
% Fe iii
(5)
Solar Abundance, Vt ¼ 10 km s�1
u30h96........................... 2.246E+05 0.3 96.3 3.4
u30h11........................... 5.393E+06 2.9 88.8 8.3
u20h96........................... 1.479E+06 0.2 94.5 5.4
u20h11........................... 2.470E+07 3.3 81.9 14.8
u13h96........................... 4.698E+06 0.2 94.1 5.7
u13h11........................... 1.572E+08 1.2 63.1 35.7
Solar Abundance, Vt ¼ 50 km s�1
u30h96........................... 2.936E+05 0.3 95.9 3.9
u30h11........................... 1.006E+07 2.1 92.9 5.0
u20h96........................... 2.366E+06 0.1 94.8 5.1
u20h11........................... 6.687E+07 1.5 89.1 9.4
u13h96........................... 8.840E+06 0.1 95.2 4.7
u13h11........................... 4.198E+08 0.5 74.3 25.2
3; Solar Abundance, Vt ¼ 10 km s�1
u30h96........................... 5.958E+05 0.3 96.7 3.0
u30h11........................... 1.186E+07 2.9 87.0 10.0
u20h96........................... 3.471E+06 0.2 94.6 5.2
u20h11........................... 4.004E+07 4.8 76.8 18.4
u13h96........................... 1.003E+07 0.3 93.9 5.9
u13h11........................... 2.520E+08 1.9 55.1 43.0
Notes.—The total flux, Ftot in ergs cm�2 s�1, is for 1500 8 � k � 5000 8.Cols. (3)–(5) give the percentage contribution of each iron ion to the total flux.The models are identified as in Table 2.
IRON EMISSION FROM AGNs 85No. 1, 2004
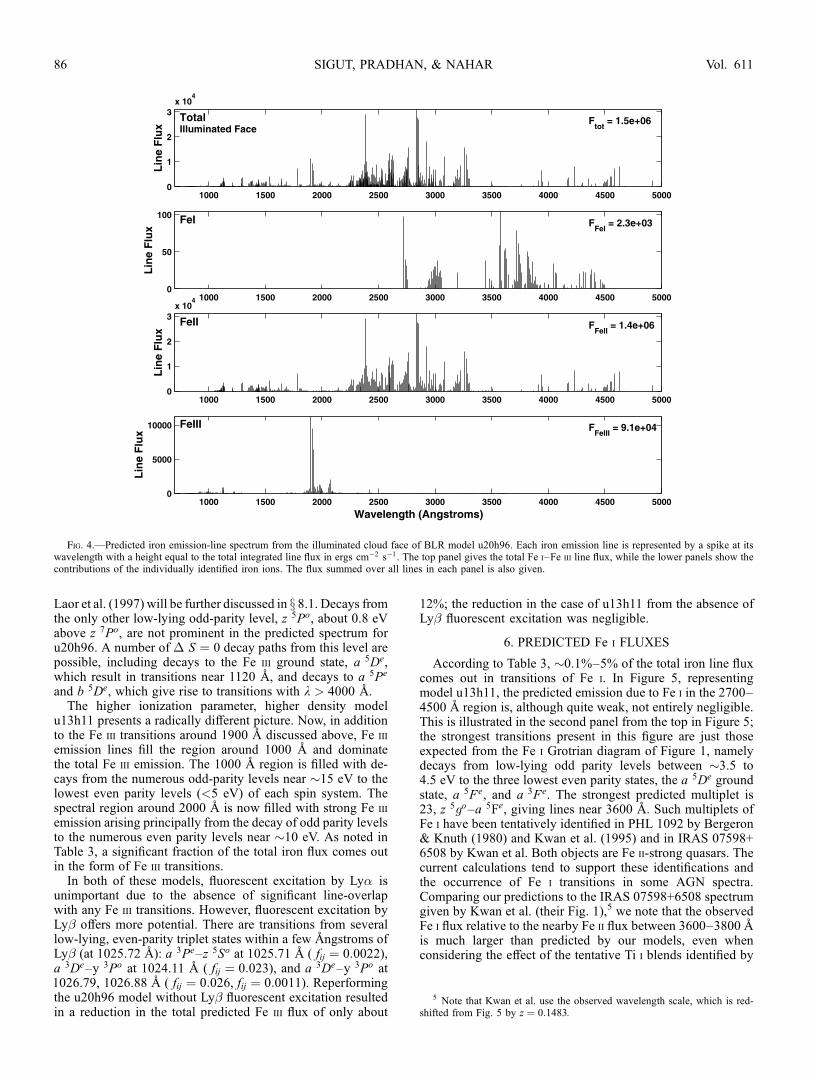
Laor et al. (1997) will be further discussed in x 8.1. Decays fromthe only other low-lying odd-parity level, z 5Po, about 0.8 eVabove z 7Po, are not prominent in the predicted spectrum foru20h96. A number of � S ¼ 0 decay paths from this level arepossible, including decays to the Fe iii ground state, a 5De,which result in transitions near 1120 8, and decays to a 5Pe
and b 5De, which give rise to transitions with k > 4000 8.The higher ionization parameter, higher density model
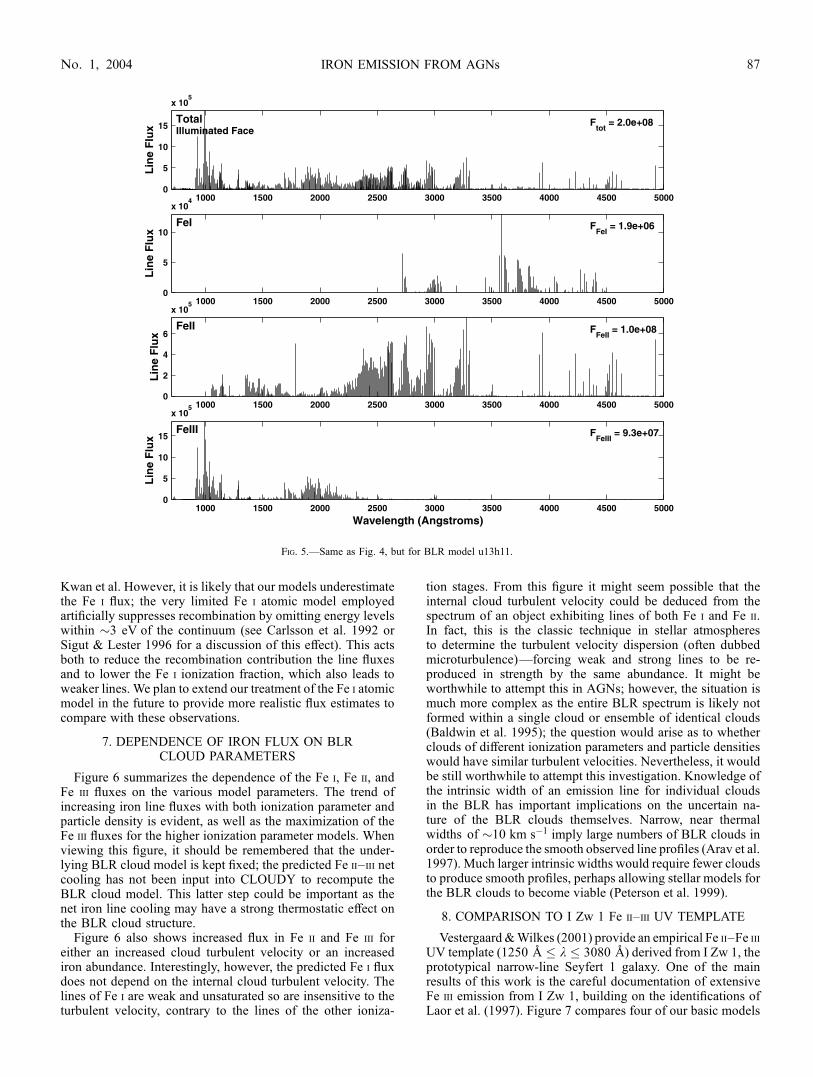
u13h11 presents a radically different picture. Now, in additionto the Fe iii transitions around 1900 8 discussed above, Fe iii
emission lines fill the region around 1000 8 and dominatethe total Fe iii emission. The 1000 8 region is filled with de-cays from the numerous odd-parity levels near �15 eV to thelowest even parity levels (<5 eV) of each spin system. Thespectral region around 2000 8 is now filled with strong Fe iii
emission arising principally from the decay of odd parity levelsto the numerous even parity levels near �10 eV. As noted inTable 3, a significant fraction of the total iron flux comes outin the form of Fe iii transitions.
In both of these models, fluorescent excitation by Ly� isunimportant due to the absence of significant line-overlapwith any Fe iii transitions. However, fluorescent excitation byLy� offers more potential. There are transitions from severallow-lying, even-parity triplet states within a few 8ngstroms ofLy� (at 1025.72 8): a 3Pe–z 5So at 1025.71 8 ( fij ¼ 0:0022),a 3De–y 3Po at 1024.11 8 ( fij ¼ 0:023), and a 3De–y 3Po at1026.79, 1026.88 8 ( fij ¼ 0:026, fij ¼ 0:0011). Reperformingthe u20h96 model without Ly� fluorescent excitation resultedin a reduction in the total predicted Fe iii flux of only about
12%; the reduction in the case of u13h11 from the absence ofLy� fluorescent excitation was negligible.
6. PREDICTED Fe i FLUXES
According to Table 3, �0.1%–5% of the total iron line fluxcomes out in transitions of Fe i. In Figure 5, representingmodel u13h11, the predicted emission due to Fe i in the 2700–4500 8 region is, although quite weak, not entirely negligible.This is illustrated in the second panel from the top in Figure 5;the strongest transitions present in this figure are just thoseexpected from the Fe i Grotrian diagram of Figure 1, namelydecays from low-lying odd parity levels between �3.5 to4.5 eV to the three lowest even parity states, the a 5De groundstate, a 5Fe, and a 3Fe. The strongest predicted multiplet is23, z 5go–a 5Fe, giving lines near 3600 8. Such multiplets ofFe i have been tentatively identified in PHL 1092 by Bergeron& Knuth (1980) and Kwan et al. (1995) and in IRAS 07598+6508 by Kwan et al. Both objects are Fe ii-strong quasars. Thecurrent calculations tend to support these identifications andthe occurrence of Fe i transitions in some AGN spectra.Comparing our predictions to the IRAS 07598+6508 spectrumgiven by Kwan et al. (their Fig. 1),5 we note that the observedFe i flux relative to the nearby Fe ii flux between 3600–3800 8is much larger than predicted by our models, even whenconsidering the effect of the tentative Ti i blends identified by
Fig. 4.—Predicted iron emission-line spectrum from the illuminated cloud face of BLR model u20h96. Each iron emission line is represented by a spike at itswavelength with a height equal to the total integrated line flux in ergs cm�2 s�1. The top panel gives the total Fe i–Fe iii line flux, while the lower panels show thecontributions of the individually identified iron ions. The flux summed over all lines in each panel is also given.
5 Note that Kwan et al. use the observed wavelength scale, which is red-shifted from Fig. 5 by z ¼ 0:1483.
SIGUT, PRADHAN, & NAHAR86 Vol. 611
Kwan et al. However, it is likely that our models underestimatethe Fe i flux; the very limited Fe i atomic model employedartificially suppresses recombination by omitting energy levelswithin �3 eV of the continuum (see Carlsson et al. 1992 orSigut & Lester 1996 for a discussion of this effect). This actsboth to reduce the recombination contribution the line fluxesand to lower the Fe i ionization fraction, which also leads toweaker lines. We plan to extend our treatment of the Fe i atomicmodel in the future to provide more realistic flux estimates tocompare with these observations.
7. DEPENDENCE OF IRON FLUX ON BLRCLOUD PARAMETERS
Figure 6 summarizes the dependence of the Fe i, Fe ii, andFe iii fluxes on the various model parameters. The trend ofincreasing iron line fluxes with both ionization parameter andparticle density is evident, as well as the maximization of theFe iii fluxes for the higher ionization parameter models. Whenviewing this figure, it should be remembered that the under-lying BLR cloud model is kept fixed; the predicted Fe ii–iii netcooling has not been input into CLOUDY to recompute theBLR cloud model. This latter step could be important as thenet iron line cooling may have a strong thermostatic effect onthe BLR cloud structure.
Figure 6 also shows increased flux in Fe ii and Fe iii foreither an increased cloud turbulent velocity or an increasediron abundance. Interestingly, however, the predicted Fe i fluxdoes not depend on the internal cloud turbulent velocity. Thelines of Fe i are weak and unsaturated so are insensitive to theturbulent velocity, contrary to the lines of the other ioniza-
tion stages. From this figure it might seem possible that theinternal cloud turbulent velocity could be deduced from thespectrum of an object exhibiting lines of both Fe i and Fe ii.In fact, this is the classic technique in stellar atmospheresto determine the turbulent velocity dispersion (often dubbedmicroturbulence)—forcing weak and strong lines to be re-produced in strength by the same abundance. It might beworthwhile to attempt this in AGNs; however, the situation ismuch more complex as the entire BLR spectrum is likely notformed within a single cloud or ensemble of identical clouds(Baldwin et al. 1995); the question would arise as to whetherclouds of different ionization parameters and particle densitieswould have similar turbulent velocities. Nevertheless, it wouldbe still worthwhile to attempt this investigation. Knowledge ofthe intrinsic width of an emission line for individual cloudsin the BLR has important implications on the uncertain na-ture of the BLR clouds themselves. Narrow, near thermalwidths of �10 km s�1 imply large numbers of BLR clouds inorder to reproduce the smooth observed line profiles (Arav et al.1997). Much larger intrinsic widths would require fewer cloudsto produce smooth profiles, perhaps allowing stellar models forthe BLR clouds to become viable (Peterson et al. 1999).
8. COMPARISON TO I Zw 1 Fe ii–iii UV TEMPLATE
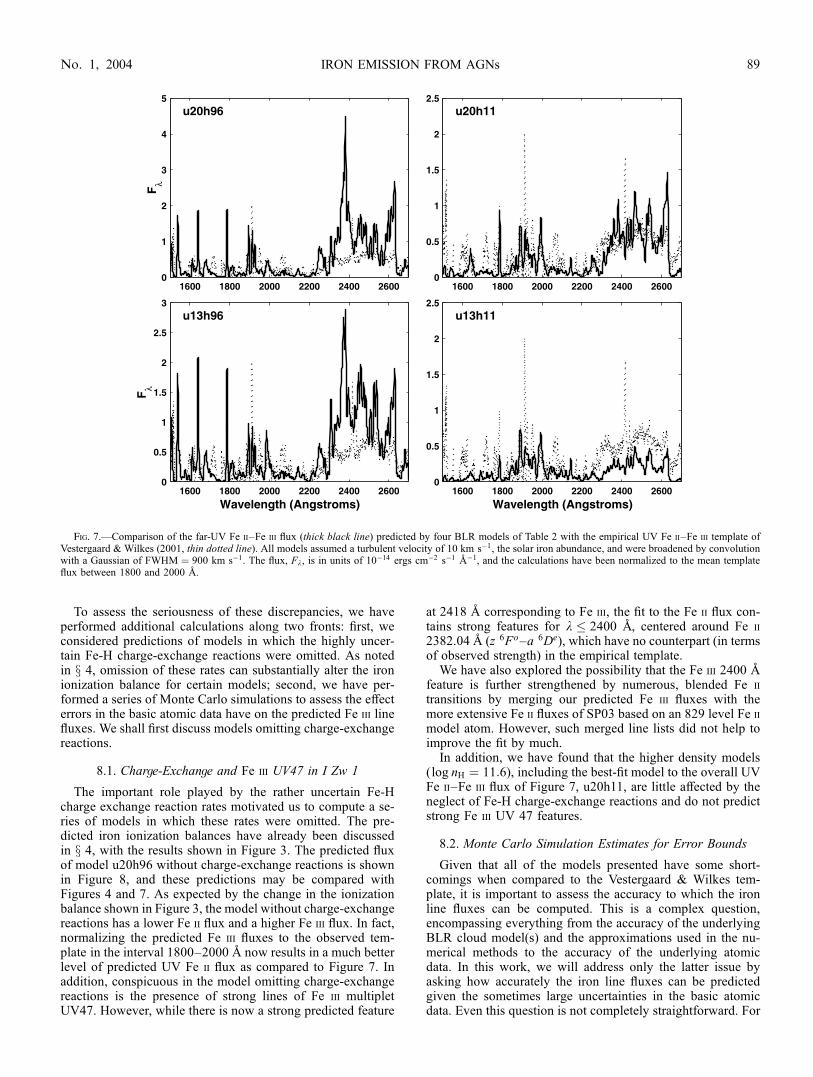
Vestergaard &Wilkes (2001) provide an empirical Fe ii–Fe iiiUV template (1250 8 � k � 3080 8) derived from I Zw 1, theprototypical narrow-line Seyfert 1 galaxy. One of the mainresults of this work is the careful documentation of extensiveFe iii emission from I Zw 1, building on the identifications ofLaor et al. (1997). Figure 7 compares four of our basic models
Fig. 5.—Same as Fig. 4, but for BLR model u13h11.
IRON EMISSION FROM AGNs 87No. 1, 2004

with a solar iron abundance and minimal turbulent velocity(10 km s�1) with the I Zw 1 template. In these comparisons, thecalculations have been broadened by convolution with aGaussian to 900 km s�1 FWHM (Vestergaard & Wilkes 2001),and the template has been normalized to the median model fluxin the region of strongest Fe iii flux included in the templatewavelength region, 1800–2000 8.
In discussing this comparison, it should be emphasized againthat all our calculations are for a single BLR cloud with a singleionization parameter and total particle density. The predictedspectrum is then broadened by convolution with a Gaussian tocompare to the template. The actual I Zw 1 emitting region isexpected to be considerably more complex. It is likely that arange of BLR cloud parameters contribute to the observed Feflux (as in the locally optimally emitting cloud model ofBaldwin et al. (1995), for example) with the overall spectrumshape determined by the (poorly understood) geometry andvelocity field within the BLR.
A further possible caveat to keep in mind when viewing asimple, direct comparison to the I Zw 1 spectrum comes fromVeron-Cetty et al. (2004). They have constructed an optical Fe iitemplate (3535–7530 8) for I Zw 1 using a simultaneous fit offour velocity systems: a broad, Lorentzian system, and threenarrow-line, Gaussian systems. Based on this multicomponentfit, they argue that the spectrum of I Zw 1 is unusual in that thereis a low-excitation, narrow-line system that emits both forbid-den and permitted Fe ii transitions. In proposing their BLRtemplate, Veron-Cetty et al. remove the narrow-line permittedFe ii component, which leads to significant differences withearlier templates, such as that of Boroson & Green (1992).
The Vestergaard & Wilkes template has not been constructedin this fashion. While using multicomponent fits to removenon-Fe features, and to help separate the Fe ii–Fe iii emission,Vestergaard & Wilkes caution against identifying any of theindividual fit components with a physical emitting region.Among the models considered in Figure 7, the higher den-
sity, intermediate ionization parameter model u20h11 does agood job of reproducing the overall level of the Fe ii UVemission line strength in the 2000–2500 8 region given thenormalization to the Fe iii flux between 1800–2000 8. Thus,we find that there is, in principle, no problem in accounting forthe relative amount of UV Fe ii–Fe iii flux from I Zw 1, evenwith a crude, single-zone model. While inspection of Figure 7clearly reveals a strong correlation between the model and theempirical template, there are several disagreements in detail. Inthe principle Fe iii wavelength region, 1800–2000 8, the rel-ative strengths of individual features are not correctly repro-duced. Most notable, however, is the failure of the basic modelto correctly reproduce the strength of the Fe iii feature near2418 8 identified by Laor et al. (1997). This strong feature isassociated with Fe iii multiplet UV47, the intersystem transi-tion z 7Po–a 5Se, giving (identified) features near 2418.58 8(J ¼ 3 2, fij ¼ 0:0027) and 2438.18 8 (J ¼ 2 2, fij ¼0:0011). Finally, some of the disagreement in the 2200–26008region can be traced to our use of a limited Fe ii model atom.6
Fig. 6.—Dependence of the Fe i, Fe ii, and Fe iii line fluxes, in ergs cm�2 s�1, summed over the wavelength interval 1500–5000 8, on the single-zone BLR cloudparameters of Table 2. The effect of tripling the iron abundance and of increasing the cloud turbulent velocity from 10 to 50 km s�1 is also shown. The symbolsidentify the iron ions as in the right-hand panel.
6 See Table 3 of SP03. Transitions with lower energies well above �6 eV,or involving levels from the doublet spin system, are not included in thecurrent work.
SIGUT, PRADHAN, & NAHAR88 Vol. 611
To assess the seriousness of these discrepancies, we haveperformed additional calculations along two fronts: first, weconsidered predictions of models in which the highly uncer-tain Fe-H charge-exchange reactions were omitted. As notedin x 4, omission of these rates can substantially alter the ironionization balance for certain models; second, we have per-formed a series of Monte Carlo simulations to assess the effecterrors in the basic atomic data have on the predicted Fe iii linefluxes. We shall first discuss models omitting charge-exchangereactions.
8.1. Chargge-Exchangge and Fe iii UV47 in I Zw 1
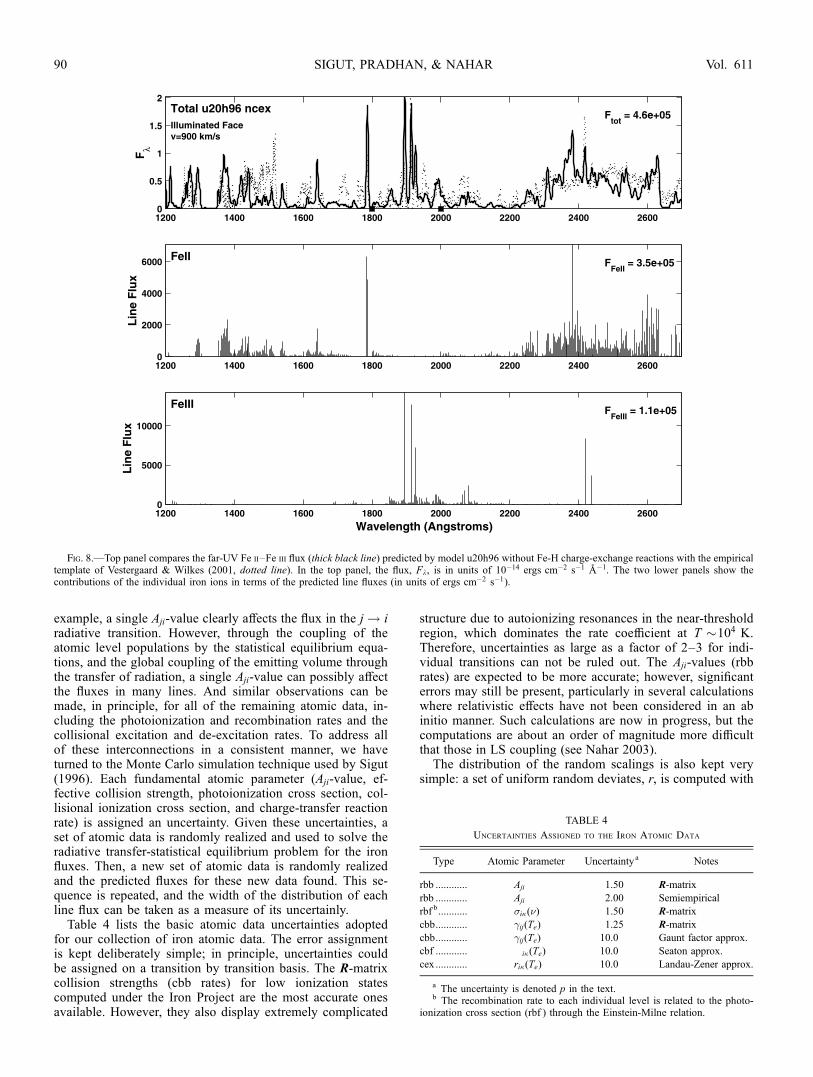
The important role played by the rather uncertain Fe-Hcharge exchange reaction rates motivated us to compute a se-ries of models in which these rates were omitted. The pre-dicted iron ionization balances have already been discussedin x 4, with the results shown in Figure 3. The predicted fluxof model u20h96 without charge-exchange reactions is shownin Figure 8, and these predictions may be compared withFigures 4 and 7. As expected by the change in the ionizationbalance shown in Figure 3, the model without charge-exchangereactions has a lower Fe ii flux and a higher Fe iii flux. In fact,normalizing the predicted Fe iii fluxes to the observed tem-plate in the interval 1800–2000 8 now results in a much betterlevel of predicted UV Fe ii flux as compared to Figure 7. Inaddition, conspicuous in the model omitting charge-exchangereactions is the presence of strong lines of Fe iii multipletUV47. However, while there is now a strong predicted feature
at 2418 8 corresponding to Fe iii, the fit to the Fe ii flux con-tains strong features for k � 2400 8, centered around Fe ii
2382.04 8 (z 6Fo–a 6De), which have no counterpart (in termsof observed strength) in the empirical template.
We have also explored the possibility that the Fe iii 2400 8feature is further strengthened by numerous, blended Fe ii
transitions by merging our predicted Fe iii fluxes with themore extensive Fe ii fluxes of SP03 based on an 829 level Fe iimodel atom. However, such merged line lists did not help toimprove the fit by much.
In addition, we have found that the higher density models(log nH ¼ 11:6), including the best-fit model to the overall UVFe ii–Fe iii flux of Figure 7, u20h11, are little affected by theneglect of Fe-H charge-exchange reactions and do not predictstrong Fe iii UV 47 features.
8.2. Monte Carlo Simulation Estimates for Error Bounds
Given that all of the models presented have some short-comings when compared to the Vestergaard & Wilkes tem-plate, it is important to assess the accuracy to which the ironline fluxes can be computed. This is a complex question,encompassing everything from the accuracy of the underlyingBLR cloud model(s) and the approximations used in the nu-merical methods to the accuracy of the underlying atomicdata. In this work, we will address only the latter issue byasking how accurately the iron line fluxes can be predictedgiven the sometimes large uncertainties in the basic atomicdata. Even this question is not completely straightforward. For
Fig. 7.—Comparison of the far-UV Fe ii–Fe iii flux (thick black line) predicted by four BLR models of Table 2 with the empirical UV Fe ii–Fe iii template ofVestergaard & Wilkes (2001, thin dotted line). All models assumed a turbulent velocity of 10 km s�1, the solar iron abundance, and were broadened by convolutionwith a Gaussian of FWHM ¼ 900 km s�1. The flux, Fk, is in units of 10�14 ergs cm�2 s�1 8�1, and the calculations have been normalized to the mean templateflux between 1800 and 2000 8.
IRON EMISSION FROM AGNs 89No. 1, 2004
example, a single Aji-value clearly affects the flux in the j ! iradiative transition. However, through the coupling of theatomic level populations by the statistical equilibrium equa-tions, and the global coupling of the emitting volume throughthe transfer of radiation, a single Aji-value can possibly affectthe fluxes in many lines. And similar observations can bemade, in principle, for all of the remaining atomic data, in-cluding the photoionization and recombination rates and thecollisional excitation and de-excitation rates. To address allof these interconnections in a consistent manner, we haveturned to the Monte Carlo simulation technique used by Sigut(1996). Each fundamental atomic parameter (Aji-value, ef-fective collision strength, photoionization cross section, col-lisional ionization cross section, and charge-transfer reactionrate) is assigned an uncertainty. Given these uncertainties, aset of atomic data is randomly realized and used to solve theradiative transfer-statistical equilibrium problem for the ironfluxes. Then, a new set of atomic data is randomly realizedand the predicted fluxes for these new data found. This se-quence is repeated, and the width of the distribution of eachline flux can be taken as a measure of its uncertainly.
Table 4 lists the basic atomic data uncertainties adoptedfor our collection of iron atomic data. The error assignmentis kept deliberately simple; in principle, uncertainties couldbe assigned on a transition by transition basis. The R-matrixcollision strengths (cbb rates) for low ionization statescomputed under the Iron Project are the most accurate onesavailable. However, they also display extremely complicated
structure due to autoionizing resonances in the near-thresholdregion, which dominates the rate coefficient at T �104 K.Therefore, uncertainties as large as a factor of 2–3 for indi-vidual transitions can not be ruled out. The Aji-values (rbbrates) are expected to be more accurate; however, significanterrors may still be present, particularly in several calculationswhere relativistic effects have not been considered in an abinitio manner. Such calculations are now in progress, but thecomputations are about an order of magnitude more difficultthat those in LS coupling (see Nahar 2003).The distribution of the random scalings is also kept very
simple: a set of uniform random deviates, r, is computed with
Fig. 8.—Top panel compares the far-UV Fe ii–Fe iii flux (thick black line) predicted by model u20h96 without Fe-H charge-exchange reactions with the empiricaltemplate of Vestergaard & Wilkes (2001, dotted line). In the top panel, the flux, Fk, is in units of 10�14 ergs cm�2 s�1 8�1. The two lower panels show thecontributions of the individual iron ions in terms of the predicted line fluxes (in units of ergs cm�2 s�1).
TABLE 4
Uncertainties Assigned to the Iron Atomic Data
Type Atomic Parameter Uncertaintya Notes
rbb ............ Aji 1.50 R-matrix
rbb ............ Aji 2.00 Semiempirical
rbf b........... �i�(�) 1.50 R-matrix
cbb............ �ij(Te) 1.25 R-matrix
cbb............ �ij(Te) 10.0 Gaunt factor approx.
cbf ............ �i�(Te) 10.0 Seaton approx.
cex ............ ri�(Te) 10.0 Landau-Zener approx.
a The uncertainty is denoted p in the text.b The recombination rate to each individual level is related to the photo-
ionization cross section (rbf ) through the Einstein-Milne relation.
SIGUT, PRADHAN, & NAHAR90 Vol. 611
the RAN2 algorithm of Press et al. (1992). Given the uncer-tainty assignment, p, from Table 4, a uniform set of deviates forthe logarithm of the scaling is found from the linear relationl ¼ aþ r(b� a), where a ¼ �log10( p) and b ¼ log10( p). Theactual set of scalings, d, is taken as d ¼ 10l. This procedureensures the following common-sense property of the scalings:for example, if a charge-exchange rate is assumed accurate towithin a factor of 100, then one might expect the a scaling from0.1 to 1.0 to be as likely as one from 1 to 10. However, thisprocedure also results in the mean scaling being different from1, namely d ¼ ( p� p�1)=½ ln 10(b� a)�; for example, themeanscaling for p ¼ 100 is about 10.8. Thus, the most probablevalue for the rate is not that adopted in the default (unscaled)atomic model. However, given the uncertainty (a factor of 100in this case), we do not consider this deviation significant.
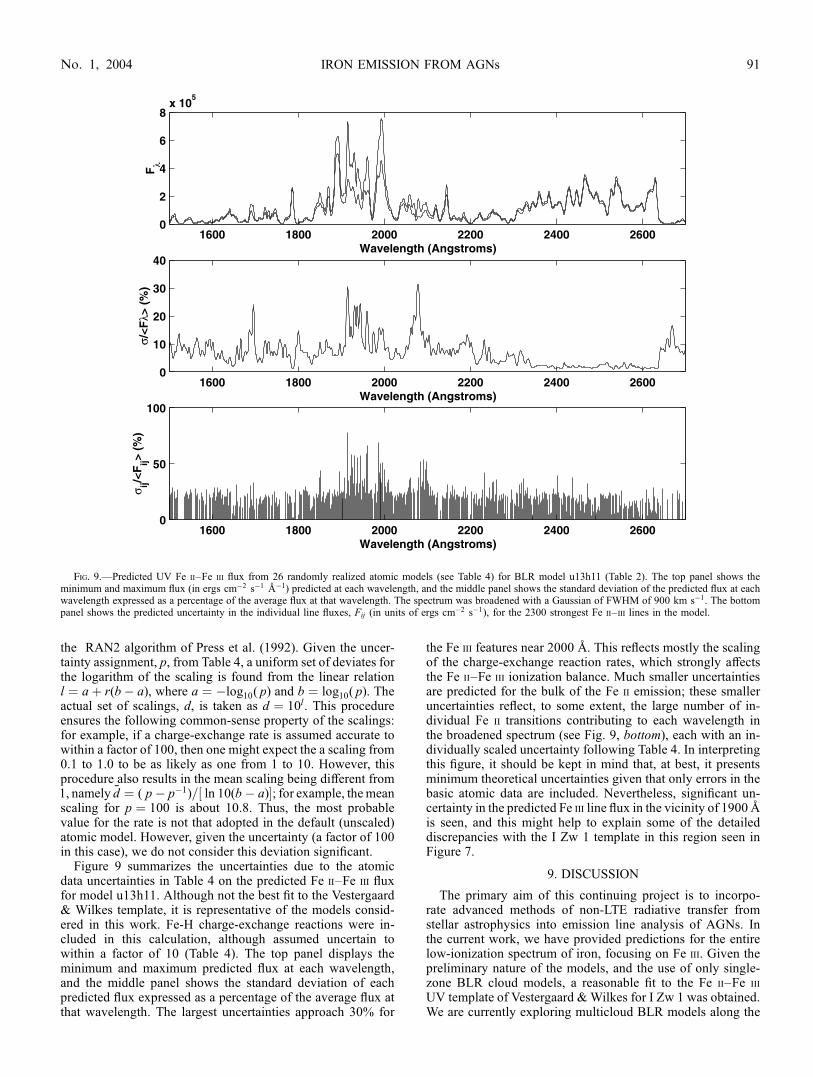
Figure 9 summarizes the uncertainties due to the atomicdata uncertainties in Table 4 on the predicted Fe ii–Fe iii fluxfor model u13h11. Although not the best fit to the Vestergaard& Wilkes template, it is representative of the models consid-ered in this work. Fe-H charge-exchange reactions were in-cluded in this calculation, although assumed uncertain towithin a factor of 10 (Table 4). The top panel displays theminimum and maximum predicted flux at each wavelength,and the middle panel shows the standard deviation of eachpredicted flux expressed as a percentage of the average flux atthat wavelength. The largest uncertainties approach 30% for
the Fe iii features near 2000 8. This reflects mostly the scalingof the charge-exchange reaction rates, which strongly affectsthe Fe ii–Fe iii ionization balance. Much smaller uncertaintiesare predicted for the bulk of the Fe ii emission; these smalleruncertainties reflect, to some extent, the large number of in-dividual Fe ii transitions contributing to each wavelength inthe broadened spectrum (see Fig. 9, bottom), each with an in-dividually scaled uncertainty following Table 4. In interpretingthis figure, it should be kept in mind that, at best, it presentsminimum theoretical uncertainties given that only errors in thebasic atomic data are included. Nevertheless, significant un-certainty in the predicted Fe iii line flux in the vicinity of 19008is seen, and this might help to explain some of the detaileddiscrepancies with the I Zw 1 template in this region seen inFigure 7.
9. DISCUSSION
The primary aim of this continuing project is to incorpo-rate advanced methods of non-LTE radiative transfer fromstellar astrophysics into emission line analysis of AGNs. Inthe current work, we have provided predictions for the entirelow-ionization spectrum of iron, focusing on Fe iii. Given thepreliminary nature of the models, and the use of only single-zone BLR cloud models, a reasonable fit to the Fe ii–Fe iii
UV template of Vestergaard & Wilkes for I Zw 1 was obtained.We are currently exploring multicloud BLR models along the
Fig. 9.—Predicted UV Fe ii–Fe iii flux from 26 randomly realized atomic models (see Table 4) for BLR model u13h11 (Table 2). The top panel shows theminimum and maximum flux (in ergs cm�2 s�1 8�1) predicted at each wavelength, and the middle panel shows the standard deviation of the predicted flux at eachwavelength expressed as a percentage of the average flux at that wavelength. The spectrum was broadened with a Gaussian of FWHM of 900 km s�1. The bottompanel shows the predicted uncertainty in the individual line fluxes, Fij (in units of ergs cm�2 s�1), for the 2300 strongest Fe ii– iii lines in the model.
IRON EMISSION FROM AGNs 91No. 1, 2004
lines of the locally optimally emitting cloud models of Baldwinet al. (1995) to see if an improved fit to the I Zw 1 UV templatecan be obtained. We also intend to compare the predictions ofsuch a model to the new optical I Zw 1 template of Veron-Cettyet al. (2004).
An aspect in which our treatment is incomplete is in thedetailed treatment of the Fe iv atom, the dominant ionizationstate in the fully ionized, optically thin region of BLR models.The atomic data for Fe iv are in hand, computed from the IronProject, and we plan to incorporate them into a further ex-tension of the present work on par with Fe ii and Fe iii. TheFe iv lines may also contribute to UV spectra of BLR; forexample, see observations of the Orion nebula using theHubble Space Telescope (Rubin et al. 1997).
In addition, the 2418 8 feature in the computed and ob-served Fe iii spectra offers a diagnostic of atomic processesand physical conditions and of uncertainties in atomic data.The combined role of these factors in determining the inten-sity of this emission feature may be illustrated by consideringlevel-specific e� þ Fe3þ ! Fe2þ recombination. An increasein the recombination-cascade rates might lead to (1) less ofa role for charge-exchange, as inferred by the non–charge-exchange models, (2) enhancement of the 2418 8 feature dueto recombination contribution to the Fe iii line, and (3) lessflux in Fe ii shortward of 2400 8, consistent with observa-tions. The present recombination rates were derived from
level-specific photoionization cross sections of Fe iii com-puted in LS coupling (Nahar & Pradhan 1994). Later workhas shown (Pradhan et al. 2001; Nahar & Pradhan 2003) thatnear-threshold resonance complexes may affect the recombi-nation rates by up to several factors. It is necessary to con-sider relativistic fine structure and resolve the resonancecomplexes in great detail (excited metastable state cross sec-tions are affected much more than the ground state). Nahar &Pradhan (2003) have developed a unified scheme for calcu-lations of electron-ion recombination, including both the ra-diative and the dielectronic recombination processes. Suchlevel-specific calculations for total recombination into theFe iii levels may possibly resolve the discrepancy in the ob-served and computed intensities of the 2418 8 feature.It is therefore not an exaggeration to say that in spite of the
present scale of this effort, both in terms of atomic physics andradiative transfer, considerable work is still needed to improvethe models.
We would like to thank Marianne Vestergaard for providingthe UV I Zw 1 iron template. This work was supported by theNatural Sciences and Engineering Research Council of Canada(T. A. A. S.) and by the US National Science Foundation andNASA (A. K. P. & S. N.).
REFERENCES
Arav, N., Barlow, T. A., Laor, A., & Blandford, R. D. 1997, MNRAS,288, 1015
Baldwin, J. A., Ferland, G., Korista, K., & Verner, D. 1995, ApJ, 455, L119Baldwin, J. A., et al. 1996, ApJ, 461, 664Bautista, M. A., & Pradhan, A. K. 1997, A&AS, 122, 167 (IP.XX)Bergeron, J., & Knuth, D. 1980, A&A, 85, L11Boroson, T. A., & Green, R. F. 1992, ApJS, 80, 109Carlsson, M., Rutten, R. J., & Shchukina, N. G. 1992, A&A, 253, 567Collin-Souffrin, S., Joly, M., Pequignot, D., & Dumont, S. 1986, A&A, 166, 27Collin-Souffrin, S., Hameury, J.-M., & Joly, M. 1988, A&A, 205, 19Dumont, A. M., & Collin-Souffrin, S. 1990, A&A, 229, 313Ekberg, J. O. 1993, A&AS, 101, 1Elitzur, M., & Netzer, H. 1985, ApJ, 291, 464Ferland, G. J. 1991, HAZY: An Introduction to CLOUDY, OSU Int. Rep. 91-01Flower, D. 1990, Molecular Collisions in the Interstellar Medium (Cambridge:Cambridge Univ. Press)
Graham, M. J., Clowes, R. G., & Campusano, L. E. 1996, MNRAS, 279, 1349Hummer, D. G., Berrington, K. A., Eissner, W., Pradhan, A. K., Saraph, H. E.,& Tully, J. A. 1993, A&A, 279, 298 (IP.I)
Joly, M. 1993, Ann. Phys. Fr., 18, 241Kingdon, J. B., & Ferland, G. J. 1996, ApJS, 106, 205Kurucz, R. L., & Bell, B. 1995, Atomic Line Data, Kurucz CD-ROMNo. 23 (Cambridge: SAO)
Kwan, J. K., Cheng, F., Fang, L., Zheng, W., & Ge, J. 1995, ApJ, 440, 628Kwan, J. K., Krolik, J. H. 1981, ApJ, 250, 478Laor, A., Jannuzi, B. T., Green, R. F., & Boroson, T. A. 1997, ApJ, 489, 656Mathews, W. G., & Ferland, G. J. 1987, ApJ, 323, 456Nahar, S. N. 1995, A&A, 293, 967 (IP.VII)———. 2003, in ASP Conf. Ser. 288, Stellar Atmosphere Modeling, ed.I. Hubeny, D. Mihalas, & K. Werner (San Francisco: ASP), 651
Nahar, S. N., & Pradhan, A. K. 1994, J. Phys. B, 27, 429———. 1996, A&AS, 119, 507 (IP.XVII)———. 2004, in Radiation Processes In Physics and Chemistry ed. R. H. Pratt& S. T. Manson (North Holland: Elsevier), 323
Netzer, H. 1980, ApJ, 236, 406
———. 1990, Saas-Fee Advanced Course 20, Active Galactic Nuclei, ed.T. J.-L. Courvoisier & M. Mayor (Heidelberg: Springer), 57
Netzer, H., & Wills, B. J. 1983, ApJ, 275, 445Neufeld, D. A., & Dalgarno, A. 1987, Phys. Rev. A, 35, 3142Osterbrock, D. E. 1989, Astrophysics of Gaseous Nebula and Active GalacticNuclei (Mill Valley: University Science Books)
Pelan, J., & Berrington, K. A. 1997, A&AS, 122, 177 (IP.XXI)Penston, M. V. 1987, MNRAS, 229, 1PPeterson, B. M., Pogge, R. W., & Wanders, I. 1999, in ASP Conf. Ser. 175,Structure and Kinematics of Quasar Broad-Line Regions, ed. C. M. Gaskell,W. N. Brandt, M. Dietrichm, D. Dultzin-Hacyan, & M. Eracleous (SanFrancisco: ASP), 41
Pradhan, A. K. Nahar, S. N., & Zhang, H. L. 2001, ApJ, 549, L265Press, W. H., Teukolsky, S. A., Vetterling, W. T., & Flannery, B. P. 1992,Numerical Recipes (Cambridge: Cambridge Univ. Press)
Rodrıguez-Ardila, A., Viegas, S. M., Pastoriza, M. G., & Prato, L. 2002, ApJ,565, 140
Rubin, R. H., et al. 1997, ApJ, 474, L131Rudy, R. J., Lynch, D. K., Mazuk, S., Venturini, C. C., Puetter, C., & Hamann,F. 2001, PASP, 113, 916
Rudy, R. J., Mazuk, S., Puetter, C., & Hamann, F. 2000, ApJ, 539, 166Sigut, T. A. A. 1996, ApJ, 473, 452Sigut, T. A. A., & Lester, J. B. 1996, ApJ, 461, 972Sigut, T. A. A., & Pradhan, A. K. 1998, ApJ, 499, L139———. 2003, ApJS, 145, 15 (SP03)Van Regemorter, H. 1962, ApJ, 136, 906Veron-Cetty, M.-P., Joly, M., & Veron, P. 2004, A&A, 417, 515Verner, E. M., Verner, D. A., Korista, K. T., Ferguson, J. W., Hamann, F., &Ferland, G. J. 1999, ApJS, 120, 101
Vestergaard, M., & Wilkes, B. J. 2001, ApJS, 134, 1Wills, B. J., Netzer, H., Uomoto, A. K., & Wills, D. 1980a, ApJ, 237, 319Wills, B. J., Netzer, H., & Wills, D. 1980b, ApJ, 241, L1———. 1985, ApJ, 288, 94Zhang, H. L. 1996, A&AS, 199, 523 (IP.VXIII)Zhang, H. L., & Pradhan, A. K. 1995, A&A, 293, 953 (IP.VI)
SIGUT, PRADHAN, & NAHAR92