Theoretical and Experimental Study of Bubbly Gas- water...
16
International Journal of Information Science and Education. ISSN 2231-1262 Volume 2, Number 1 (2012) pp. 43-58 © Research India Publications http://www. ripublication.com Theoretical and Experimental Study of Bubbly Gas- water Two Phase Flows through a Universal Venturi Tube (UVT) Abbas H. A. M. Hasan 1 , A. Hadawey 1 , Al-Wahaibi. Y 2 , Waleed Abdul-Karem1, and Khalid F. Al-Raheem 1 1 Department of Mechanical and Industrial Engineering, Caledonian College of Engineering, Oman. 2 Department of Petroleum and Chemical Engineering, Sultan Qaboos University, Oman. Abstract Unlike single phase flows, the relationship between the phase flow rate and the pressure drop across a differential pressure device (e.g. Venturi) in multiphase flow measurements is not simple and should include the phase volume fractions or the mass flow quality. The research described in this paper studies the bubbly gas-water two phase flows through a universal Venturi tube. The bubbly flow is assumed to be homogenous in which the two phases are moved with the same velocity (i.e. the slip ratio is unity). A Universal Equation.3 (24) entage error, EMBED Equation. in conjunction with the homogenous flow model, was combined with the flow density meter enabling the gas volume fraction and hence the mixture flow rate in bubbly gas-water two phase flows to be determined. It was inferred from the experimental results that the homogenous flow model starts to break when the gas volume fraction increases beyond 17.48%. Keywords: Universal Venturi Tube, Two phase flow, Flow density meter, Bubbly flow Introduction In industrial fields the need to measure fluid flow rate arises frequently. The accuracy and repeatability of the flow rate measurements are necessary for process development and control. Differential pressure devices can be used in multiphase flow
Transcript of Theoretical and Experimental Study of Bubbly Gas- water...

International Journal of Information Science and Education. ISSN 2231-1262 Volume 2, Number 1 (2012) pp. 43-58 © Research India Publications http://www. ripublication.com
Theoretical and Experimental Study of Bubbly Gas-water Two Phase Flows through a Universal Venturi
Tube (UVT)
Abbas H. A. M. Hasan1, A. Hadawey1, Al-Wahaibi. Y2, Waleed Abdul-Karem1, and Khalid F. Al-Raheem1
1 Department of Mechanical and Industrial Engineering,
Caledonian College of Engineering, Oman. 2 Department of Petroleum and Chemical Engineering,
Sultan Qaboos University, Oman.
Abstract
Unlike single phase flows, the relationship between the phase flow rate and the pressure drop across a differential pressure device (e.g. Venturi) in multiphase flow measurements is not simple and should include the phase volume fractions or the mass flow quality. The research described in this paper studies the bubbly gas-water two phase flows through a universal Venturi tube. The bubbly flow is assumed to be homogenous in which the two phases are moved with the same velocity (i.e. the slip ratio is unity). A Universal Equation.3 (24) entage error, EMBED Equation.in conjunction with the homogenous flow model, was combined with the flow density meter enabling the gas volume fraction and hence the mixture flow rate in bubbly gas-water two phase flows to be determined. It was inferred from the experimental results that the homogenous flow model starts to break when the gas volume fraction increases beyond 17.48%. Keywords: Universal Venturi Tube, Two phase flow, Flow density meter, Bubbly flow
Introduction In industrial fields the need to measure fluid flow rate arises frequently. The accuracy and repeatability of the flow rate measurements are necessary for process development and control. Differential pressure devices can be used in multiphase flow

44 Abbas H. A. M. Hasan et al
metering. The most common differential pressure device is the Venturi meter, but orifice plates have also been used widely. The advantage of using the Venturi meter over the orifice plate is that the Venturi meter is much more predictable and repeatable than the orifice plate for wide ranging flow conditions. Furthermore, the smooth flow pattern in Venturi meter reduces frictional losses which increase the reliability of the Venturi. The bubbly air-water two phase flow described in this paper was considered as a homogenous flow in which the velocity of the phases can be assumed equal (i.e. the slip ratio is unity). The universal Venturi tube used in this paper is shown in Figure 1. The dimensions of the Venturi meter are similar to the hydraulic shape described by [1]. Measurement of the gas volume fraction is important to determine the phase flow rate in multiphase flow applications. The differential pressure technique (i.e. flow density meter), in conjunction with the mathematical flow model, was used in this paper to measure the gas volume fraction. This technique is simple in operation, easy to handle, non-intrusive and low cost [2]. The gas volume fraction can be used in conjunction with the homogenous flow model to determine the predicted mixture (homogenous) volumetric flow rate. The predicted mixture flow rate can then be compared with the reference mixture volumetric flow rate to analyse the accuracy and the capability of the homogenous flow model. It was found that the homogenous flow model works well when the gas volume fraction approximately below 0.1748 (i.e. 17.48%). Beyond that the bubbly-slug transition occurred in which the assumption of equal phase’s velocities is no longer valid. Considerable theoretical and experimental studies have been published to describe mathematical models of Venturis in multiphase flow measurements. The study of multiphase flow through contraction devices is described for example by Murdock (1962) [3], Smith and Leang (1975) [4], Chisholm (1977) [5], Lin (1982) [6], de Leeuw (1994) [7] and Steven (2002) [8]. All of these correlations depend either on the mass flow quality, x or empirical constants. Online measurement of mass flow quality x is rather difficult and not practical in multiphase flow applications. Some of the correlations found in literature are summarised below [9].
(i) Murdock studied the two phase flow through an orifice plate meter and his work was not restricted only to wet gas flows. Murdock developed a rational equation modifying the single phase equation by introducing an experimental constant (correction factor). Murdock’s correlation considers two phase flow to be separated flow and he computed the total mass flow rate using an empirical constant (equal to 1.26) and by assuming that the quality of the mixture is known. The correction factor in Murdock’s correlation was solely a function of the modified version of Lockhart-Martinelli parameter modX which is defined as the ratio of the superficial flows momentum pressure drops (and not the friction pressure drops as in the original definition by Lockhart-Martinelli parameter). The modified Lockhart-Martinelli parameter is given by;

Theoretical and Experimental Study of Bubbly Gas-water 45
w
g
w
g
w
g
w
g
g
w
g
w
k
k
x
x
k
k
m
m
P
PX
1
mod
(1)
where wP and gP are the differential pressures when the liquid and gas phases
respectively flow alone, wm and gm are the water and gas flow rates respectively, gk
and wk are the gas and water flow coefficients, g and w are the gas and water density respectively and xis the mass flow quality. The gas mass flow rate in two phase flow from Murdock’s correlation can be written as;
mod26.112
126.11
2X
PkA
k
k
x
x
PkAm
gTPgt
w
g
w
g
gTPgt
g
(2)
where
TPP is the two phase pressure drop.
(ii) Chisholm studied two phase separated flow through a sharp edge orifice plate. The Chisholm correlation is a function of the two phase pressure drop and the modified Lockhart-Martinelli parameter. The gas mass flow rate in the Chisholm correlation can be written as;
2modmod1
2
XCX
PAkm
gTPtgg
(3)
where tA is the total flow area during two phase flow and C is the ‘Chisholm parameter’ and is given (in terms of a slip ratio S) by;
w
g
g
w SS
C
1 (4)
(iii) Lin developed his model on the basis of a separated flow model (for
general stratified two phase flow) and compared his model against the experimental data. This comparison shows that the Lin model can be used to calculate the flow rate or the quality of gas-liquid mixture in the range 0.00455 to 0.328 of the density ratio wg , and in the pipe size ranging from 8 to 75 mm. The Lin correction factor K is given by;
54
32
5743.2612966.5
6150.606954.4426541.948625.1
w
g
w
g
w
g
w
g
w
gK (5)
The gas mass flow rate in Lin correlation can be written as;
46 Abbas H. A. M. Hasan et al
g
w
wTPtwg
xxK
PxAkm
)1(
2 =
1
2
w
g
g
w
gTPtw
m
mK
PAk
(6)
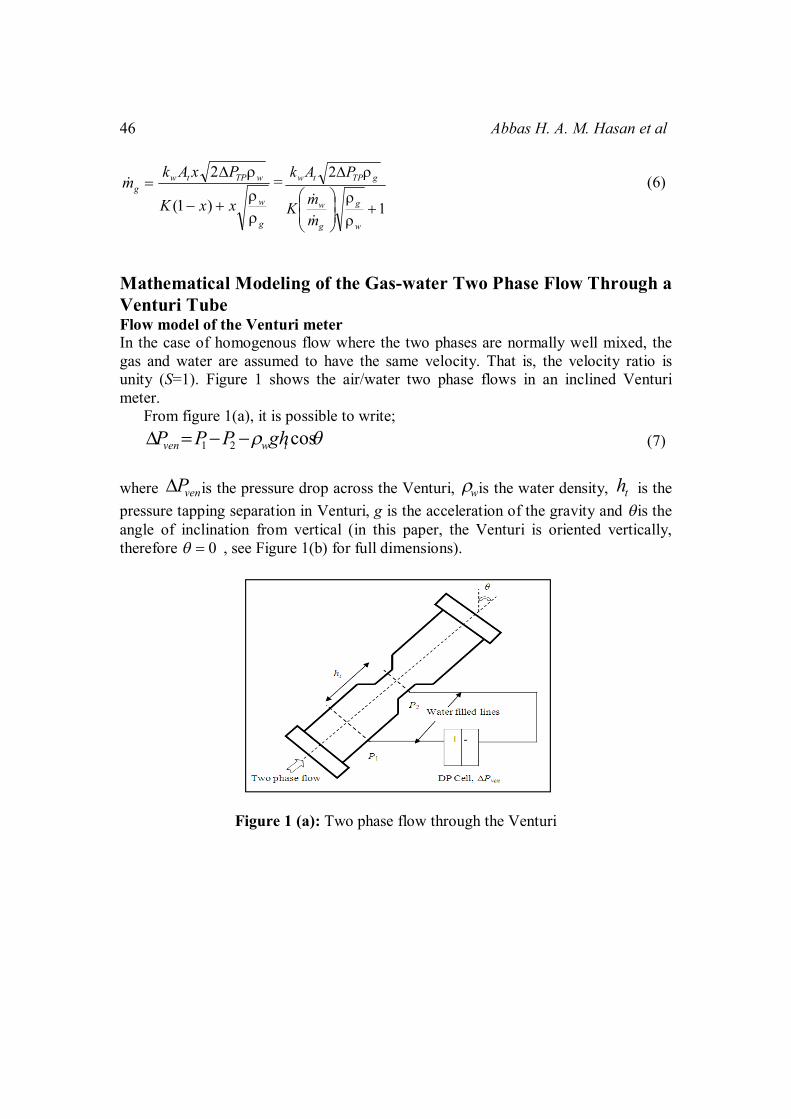
Mathematical Modeling of the Gas-water Two Phase Flow Through a Venturi Tube Flow model of the Venturi meter In the case of homogenous flow where the two phases are normally well mixed, the gas and water are assumed to have the same velocity. That is, the velocity ratio is unity (S=1). Figure 1 shows the air/water two phase flows in an inclined Venturi meter. From figure 1(a), it is possible to write; cos21 twven ghPPP (7) where venP is the pressure drop across the Venturi, w is the water density, th is the pressure tapping separation in Venturi, g is the acceleration of the gravity and is the angle of inclination from vertical (in this paper, the Venturi is oriented vertically, therefore 0 , see Figure 1(b) for full dimensions).
Figure 1 (a): Two phase flow through the Venturi

Theoretical and Experimental Study of Bubbly Gas-water 47
Figure 1 (b): 2D design of the UVT
It should be stated that, Eq (7) is only true for water filled lines. From Bernoulli's equation it is possible to write;
venmtmm FghUUPP ,
21
2221 cos
21
(8)
where 1U and 2U are the velocities at the inlet and the throat respectively, venmF , is the
frictional pressure loss (from inlet to the throat of the Venturi) and m is the mixture density and is given by;
wgwgggm )1()1( (9) The mass conservation energy can be written as;
2
112 A
AUU (10)
where 1A and 2A are the areas at the inlet and the throat of the Venturi respectively. Since the bubbly flow is assumed homogenous, Eq (10) can be written as;
2
12 A
AUU h (11)
where hU is the homogenous velocity (i.e. the summation of the gas and water superficial velocity divided by the cross sectional area of the pipe at the inlet of the Venturi). Substituting (8), (9) & (11) into (7) gives;
1)1(
21cos
2
2
12, A
AUFghP hgwvenmtwgven (12)

48 Abbas H. A. M. Hasan et al
It is well known that the mixture (homogenous) volumetric flow rate mQ is given by;
1AUQ hm (13) Substituting hU from equation (12) into equation (13) gives;
venmtwgvengw
m FghP
A
A
AQ ,2
2
1
1 cos)1(
2
1
(14)
In terms of the discharge coefficient dC , Eq (14) can be written as;
cos)1(
2
12
2
1
1twgven
gw
dm ghP
A
A
ACQ
(15)
It is clear from Eq (15) that the flow rate is a function of the pressure drop across the Venturi and the gas volume fraction. That is;
),( gvenm PfQ (16)
venP in Eq (15) is measured directly from the dp cell (see figure 1(a)). The gas
volume fraction g in Eq (15) can be measured using the flow density meter as described in section 2.2. Measurement of the gas volume fraction using the flow density meter The gas volume fraction g in Eq (15) can be measured by the differential pressure technique [10]. With reference to Figure 2 in which the tubes, connected to an upper and lower pressure tapping, are filled with water, it is possible to write;
mwspipempipe ghFP cos, (17)
where pipeP is the pressure drop across the vertical pipe, sh is the pressure tapping
separation ( )m 1sh and pipemF , is the frictional pressure loss term across parallel pipe.

Theoretical and Experimental Study of Bubbly Gas-water 49
Figure 2: Measurement of the gas volume fraction The frictional pressure loss term across parallel pipe is given by (Darcy’s law);
D
fUhF hsw
pipem
2
,2 (18)
where D is the inner pipe diameter and f is the single phase friction factor and is given by;
22 uh
DPf
sw
w
(19)
where uis the single phase (water) flow velocity and wP is the single phase (water) pressure drop across vertical pipe. Substituting (9) into (17) and solving for g gives;
gws
pipempipeg gh
FP
cos
, (20)
Once the gas volume fraction g is measured, the mixture volumetric flow rate mQcan be easily determined using Eq (15). Experimental setup The vertical bubbly gas-water two phase flow configuration, shown in Figure 3, is capable of providing flows with water as a continuous phase and air as a dispersed phase. This flow loop was used to study the universal Venturi tube using the homogenous flow model described in section 2. Combining the UVT with the flow

50 Abbas H. A. M. Hasan et al
density meter (which was used to measure the gas volume fraction at the inlet of the UVT, see Figure 3) allows the mixture flow rate (see Eq (15)) to be determined. As shown in Figure 3, the water was pumped to the test section which consists of the UVT and the flow density meter, through a turbine flow meter. The turbine flow meter was used to measure the reference water volumetric flow rate. The gas (air) was injected at the bottom of the test section through the thermal mass flow meter which was used to provide the reference gas flow rate. The air was passed through the regulator and the ball valve in which the reference gas flow rate can be manually controlled. The sum of the reference gas volumetric flow rate rgQ , (obtained from the
thermal mass flow meter) and the reference water volumetric flow rate rwQ , (obtained
from the turbine flow meter) gives the reference mixture volumetric flow rate, rmQ , .
Figure 3: A schematic diagram of the vertical bubbly gas-water two phase flow configuration The predicted mixture volumetric flow rate mQ obtained from the homogenous flow model (see Eq (15)) can be compared with the reference mixture volumetric flow rate, rmQ , in which the percentage error in the mQ can be analysed. Two DP cells were used to measure the differential pressure drop across vertical pipe and Venturi meter. A Yokogawa DP cell was used to measure pipeP across the vertical pipe (i.e. flow density meter) while a Honeywell DP cell was connected across upstream and the
Theoretical and Experimental Study of Bubbly Gas-water 51
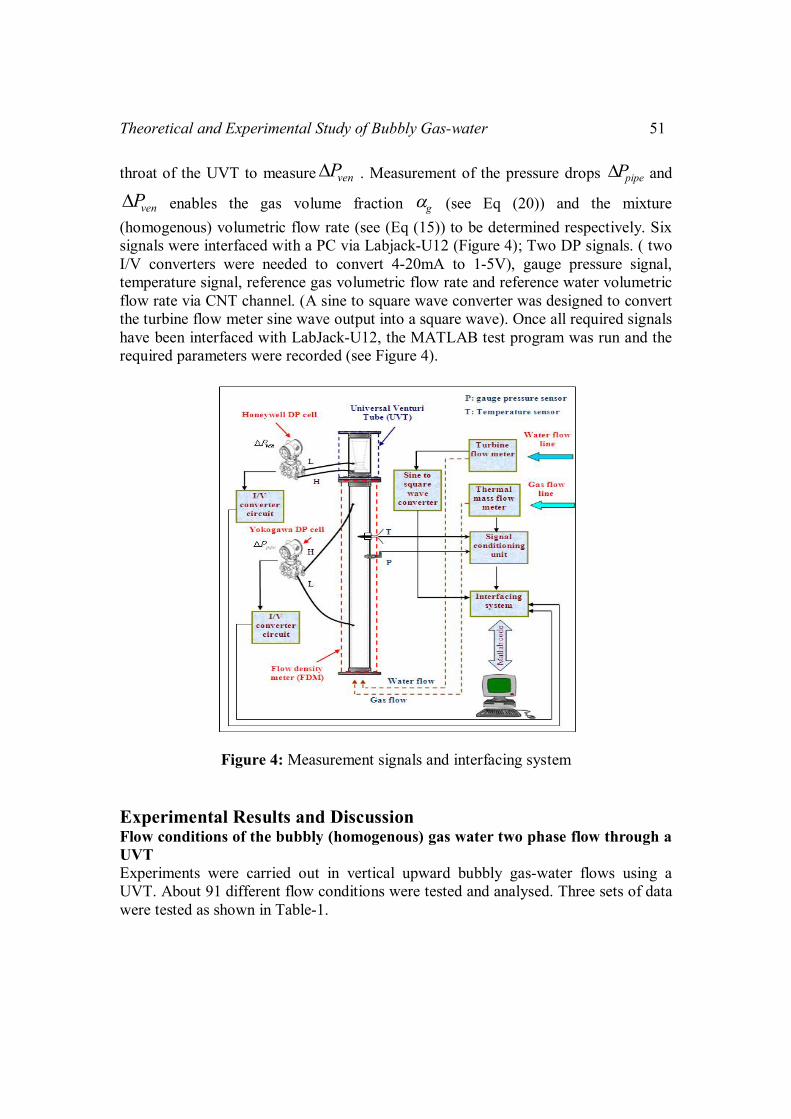
throat of the UVT to measure venP . Measurement of the pressure drops pipeP and
venP enables the gas volume fraction g (see Eq (20)) and the mixture (homogenous) volumetric flow rate (see (Eq (15)) to be determined respectively. Six signals were interfaced with a PC via Labjack-U12 (Figure 4); Two DP signals. ( two I/V converters were needed to convert 4-20mA to 1-5V), gauge pressure signal, temperature signal, reference gas volumetric flow rate and reference water volumetric flow rate via CNT channel. (A sine to square wave converter was designed to convert the turbine flow meter sine wave output into a square wave). Once all required signals have been interfaced with LabJack-U12, the MATLAB test program was run and the required parameters were recorded (see Figure 4).
Figure 4: Measurement signals and interfacing system Experimental Results and Discussion Flow conditions of the bubbly (homogenous) gas water two phase flow through a UVT Experiments were carried out in vertical upward bubbly gas-water flows using a UVT. About 91 different flow conditions were tested and analysed. Three sets of data were tested as shown in Table-1.
52 Abbas H. A. M. Hasan et al
Table-1: Flow Conditions
Flow conditions Set-1 Set-2 Set-3 )(m 13
,sQ rw
310339.1 310937.1 310057.1 to 310152.4
)(m 13,
sQ rg 510329.3 to 310264.1
410178.1 to 310015.1
510648.2 to 310181.1
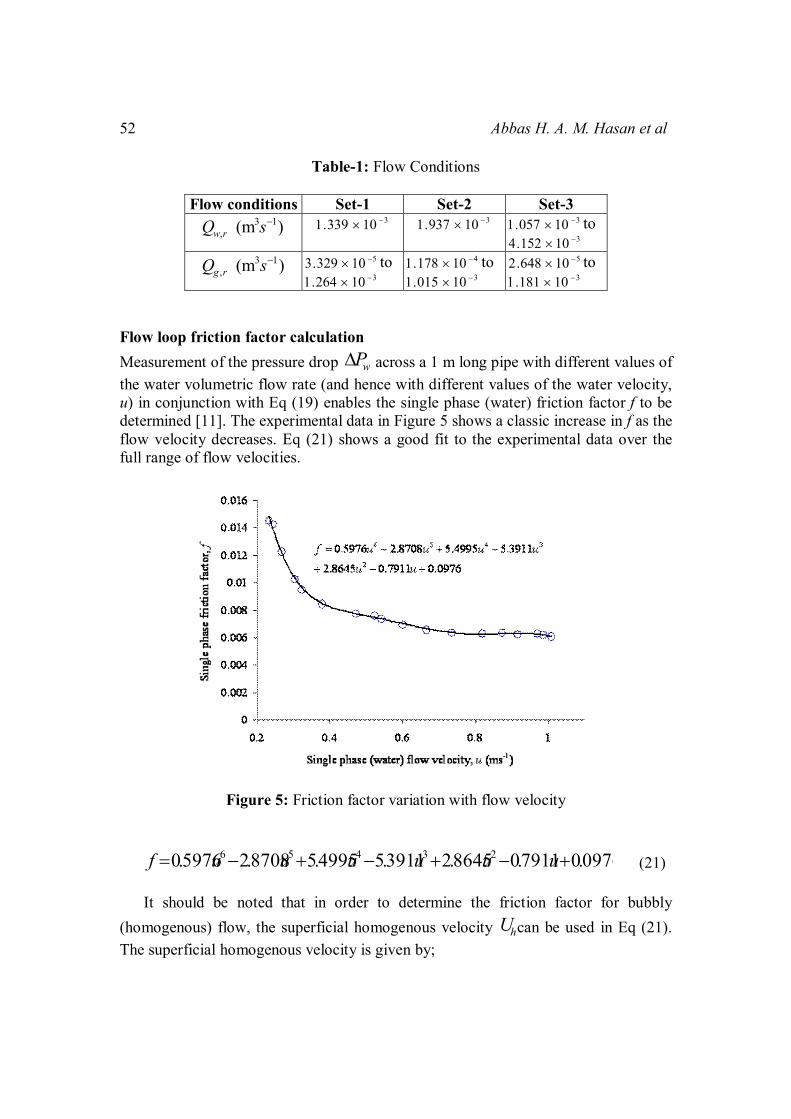
Flow loop friction factor calculation Measurement of the pressure drop wP across a 1 m long pipe with different values of the water volumetric flow rate (and hence with different values of the water velocity, u) in conjunction with Eq (19) enables the single phase (water) friction factor f to be determined [11]. The experimental data in Figure 5 shows a classic increase in f as the flow velocity decreases. Eq (21) shows a good fit to the experimental data over the full range of flow velocities.
Figure 5: Friction factor variation with flow velocity
0976.07911.08645.23911.54995.58708.25976.0 23456 uuuuuuf (21) It should be noted that in order to determine the friction factor for bubbly (homogenous) flow, the superficial homogenous velocity hU can be used in Eq (21). The superficial homogenous velocity is given by;

Theoretical and Experimental Study of Bubbly Gas-water 53
A
QQU rgrw
h,,
(22)
where rwQ , is the reference water volumetric flow rate measured directly from the
turbine flow meter before water and gas were mixed (see Figure 3), rgQ , is the reference gas volumetric flow rate measured directly from the thermal mass flow meter and A is the cross sectional area of the pipe (see Figure 1(b)). Replacing u in Eq (21) with hU (see Eq (22)) enables the loop friction factor f to be determined in a bubbly gas-water flow. Once the friction factor f for bubbly (homogenous) flows is obtained, the frictional pressure loss term pipemF , across parallel
pipe in Eq (18) can be easily determined (and hence the gas volume fraction g in Eq
(20) can be obtained). Note that, measurement of g enables the predicted mixture
(homogenous) volumetric flow rate mQ (see Eq (15)) to be determined. Variation of the discharge coefficient A discharge coefficient (see Eq (15)) is a parameter introduced to account for the frictional and turbulent losses in a Venturi meter [7]. In the literature, the value of the discharge coefficient for single phase (water) flow is always less than unity. The discharge coefficient dC in Eq (15) can be defined as;
m
rmd Q
QC , (23)
where rmQ , is the reference mixture (homogenous) volumetric flow rate and mQ is the predicted (theoretical) mixture volumetric flow rate. Figure 6 shows the variation of the discharge coefficient dC with the gas volume
fraction g . It is clear that the values of dC becomes unpredictable when g
exceeded 0.1748. In other words, for %48.17g , the values of dC can be treated as
independent of g and can be averaged as 0.948.

54 Abbas H. A. M. Hasan et al
Figure 6: Variation of the discharge coefficient with the gas volume fraction Variation of the pressure drop across the UVT in gas-water bubbly flows Figure 7 shows the relationship between the pressure drop and the superficial homogenous velocity hU . It is seen that when %48.17g , the trend can be approximated by a square root relationship which is very common relationship in single phase flow through a Venturi meter. For %48.17g , this approximation was no longer valid in which the points were moved away from approximated curve. This was due to the effects of the transition of a bubbly flow into a slug flow.
Figure 7: Variation of the pressure drop and superficial homogenous velocity through a UVT

Theoretical and Experimental Study of Bubbly Gas-water 55
Percentage error in the predicted homogenous volumetric flow rate through the UVT in gas-water bubbly flow As can be seen from Figure 6, the discharge coefficient dC in a bubbly gas-water flow was averaged as 0.948. To analyse the percentage error, , between the reference and the predicted mixture volumetric flow rates (Eq (15)) in bubbly (homogenous) gas-water two phase flows, two different values of dC (0.94 and 0.95) other than the average value of the discharge coefficient were used to show the variation of the mean value error, , at different values of dC .
100,
,
rm
rmm
Q
QQ (24)
Figures 8 to 10 show the variation of the percentage error, in the predicted mixture volumetric flow rate mQ with the gas volume fraction g at different values of
dC .
Figure 8: Percentage error in mQ at 94.0dC

56 Abbas H. A. M. Hasan et al
Figure 9: Percentage error in mQ at 948.0dC
Figure 10: Percentage error in mQ at 95.0dC It is seen from Figures 8-10 that the homogenous flow model starts to break when the gas volume fraction g exceeds 17.48% in which the error was increased to about 30%. This was due to the transition between bubbly and slug flow regimes. The homogenous flow model is based on the unity slip ratio assumption (i.e. equal phase
Theoretical and Experimental Study of Bubbly Gas-water 57
velocities). However, for %48.17g , this assumption is no longer valid and the slip ratio effect should be introduced in the flow model. Conclusion The homogenous flow model was derived for the bubbly gas-water two phase flows through a universal Venturi tube. The gas volume fraction was measured using the differential pressure technique (i.e. flow density meter). The homogenous flow model in conjunction with the differential pressure technique was used to predict the mixture volumetric flow rate (Eq (15)) through the Venturi meter. From the comparison between the predicted mixture volumetric flow rate mQ (see
Eq (15)) and the reference mixture volumetric flow rate rmQ , (obtained from the turbine flow meter and the thermal mass flow meter, see Figures 3 and 4), it can be concluded that the homogenous flow model starts to break when the gas volume fraction increased beyond 17.48%. This was due to the bubbly-slug transition flow. In this case the homogenous flow model should be modified to account for the slip ratio between the phases. Acknowledgment I wish to express my deep sense of gratitude to Professor Gary Lucas, Head of Systems Research Group, at the University of Huddersfield, for his continuous support and his valuable advice. References
[1] D. Halmi, “Metering Performance Investigation and Substantiation of the "Universal Venturi Tube" (UVT), Part 1- Hydraulic Shape and Discharge Coefficient.,” Journal of Fluid Engineering, vol. 73-WA/FM-3, 1974, pp. 124-131.
[2] G.F. Hewitt, Measurement of the two phase flow parameters, London: Academic Press, 1978.
[3] Murdock, J.W. (1962), Two-phase flow measurements with orifices, J. of Basic Eng, Vol. 84, pp. 419-433.
[4] Smith, R.V. and Leang, J.T. (1975), Evaluations of correction for two-phase flowmeter three current-one new, J. of Engineering for power, pp. 589-593.
[5] Chisholm, D. (1977), Research note: Two-phase flow through sharp-edged orifices, J. of Mech. Eng. Sci., Vol. 19, No.3.
[6] Lin, Z. H. (1982), Two-phase flow measurement with sharp-edged orifices, Int. J. of Multiphase Flow, Vol. 8, No. 6, pp. 683-693.

58 Abbas H. A. M. Hasan et al
[7] de Leeuw, H. (1994), Wet gas flow measurement by means of a Venturi meter and a tracer technique, North Sea Flow Measurement Workshop, Peebles, Scotland.
[8] Steven, R.N. (2002), Wet gas metering with a horizontally mounted Venturi meter, J. of Flow Measurement and Inst, Vol. 12, pp. 361-372.
[9] Abbas H. A. M. Hasan. & Lucas, G. P., 2011. Experimental and theoretical study of the gas-water two phase flow through a conductance multiphase Venturi meter in vertical annular (wet gas) flow. Journal of Nuclear Engineering and Design. Vol. 241, issue (6), pp. 1998-2005.
[10] Lucas G.P. (1987) “The measurement of two-phase flow parameters in vertical and inclined flows”. PhD Thesis, University of Manchester Institute of Science and Technology (UMIST), UK.
[11] Massey, B. (1998) “Mechanics of Fluid”. Stanley Thornes Ltd. ISBN: 0-7487-4043-0.